Article

Interlaboratory Comparison of SpermX™ and Conventional Differential Extractions Indicated High Male DNA Recovery by the SpermX Method

1
InnoGenomics Technologies, 2000 Lakeshore Dr #5016, New Orleans, LA 70148, USA
2
National Center for Forensic Science, P.O. Box 162367, Orlando, FL 32816, USA
3
Department of Chemistry, University of Central Florida, P.O. Box 162366, Orlando, FL 32816, USA
4
The Center for Forensic Science Research and Education, 2300 Stratford Ave, Willow Grove, PA 19090, USA
5
College of Life Sciences, Center City Campus, Thomas Jefferson University, 1020 Walnut Street, Philadelphia, PA 19107, USA
6
Department of Forensic Science, College of Criminal Justice, Sam Houston State University, Huntsville, TX 77341, USA
7
Department of Forensic Sciences, The George Washington University, 2100 Foxhall Rd, Washington, DC 20007, USA
*
Author to whom correspondence should be addressed.
Forensic Sci. 2023, 3(4), 592-610; https://doi.org/10.3390/forensicsci3040043
Submission received: 16 August 2023 / Revised: 20 September 2023 / Accepted: 23 November 2023 / Published: 1 December 2023

Abstract

:
The National Institute of Justice reported that current methods for processing sexual assault samples have a high failure rate, with 60 to 80 percent of tested kits unable to produce usable DNA profiles. Even when samples test positive for male DNA, 34 percent of sexual assault kits (SAKs) do not yield recovered male DNA after differential extraction. Less than 30% recovery of available sperm DNA contributes to this low success rate. The SpermX™ method (SX) has been shown to recover 80 percent or more of sperm DNA from sexual assault samples. An interlaboratory evaluation compared SX to standard differential extraction (DE) protocols. Mock samples with known ratios of female epithelial cells and sperm cells were processed using both methods. Results revealed that SX consistently provided CODIS up-loadable DNA profiles, even with as few as 25 sperm cells, whereas DE failed to produce usable results. On average, SX yielded a seven-fold increase in the recovery of unshared male alleles compared to DE. In conclusion, SX outperformed DE in recovering higher quantities of male DNA with minimal female carryover in sexual assault-type samples. This improved success rate in obtaining usable DNA profiles can significantly aid in solving sexual assault cases.

1. Introduction

Crime laboratories have faced backlogs of unanalyzed sexual assault kits (SAKs) for decades. While laboratories have spent considerable effort to combat these backlogs, an often-overlooked issue is the low success rate of obtaining informative DNA profiles of perpetrators when testing these kits. Previous research and published reports have shown that as many as 60 to 80 percent of tested kits fail to produce a usable DNA profile. For example, the Sexual Assault Kit Initiative (SAKI) website reported that 60% of tested kits did not obtain a CODIS up-loadable profile [1], while an NIJ Sexual Assault Backlog Study showed that 64% of SAKs failed to obtain a CODIS up-loadable profile [2]. The Alaska Scientific Crime Detection Laboratory also recently reported that 60 to 80 percent of tested SAKs had recovered insufficient male DNA to complete DNA testing [3]. The issue may be sample collection as well as sample processing methods. The ability to obtain an STR profile from a perpetrator requires the separation of sperm cells from epithelial cells in the sample. While some of the low success rates may be due to samples not having any sperm present, there is considerable evidence that indicates that the current methodology of sperm cell separation is also partly responsible for the low success rate. The most common differential extraction method [4] used in most laboratories was developed in 1985 and relies on the differential digestion of epithelial cells, formation of a sperm cell pellet, and separation of the pellet from the digested epithelial cell DNA. Studies have shown that this method’s efficiency of sperm cell recovery is very poor, typically recovering less than 30 percent of the sperm in the sample [5,6]. There is compelling evidence to suggest that a much higher success rate could be achieved. For instance, the following data are from the NIJ Sexual Assault Backlog Study [2]: 34% of SAK samples that tested positive with a Y DNA screen did not have any male DNA recovered after differential extraction. For oral swabs, which typically have low sperm quantities, 75% of all samples that were positive for sperm based on microscopic analysis did not have any male DNA after differential extraction [2]. The data clearly demonstrate that current differential extraction methods do not have a sufficient recovery to effectively capture sperm from low-level sperm samples and this may be impacting a significant number of SAKs. Given that improving the success rate could have as big a financial return as increasing caseload capacity, a more efficient differential extraction method would be of great benefit to the forensic community. The poor success rate when testing SAKs is not the only challenge faced by crime laboratories. The long-standing problem of backlogs of SAKs and forensic cases, in general, continues to persist. The 2020–2021 Project FORESIGHT report indicated that, over the 2013–2020 period, backlogs in DNA casework grew 27% annually while productivity only increased by 3.1% per year [7]. Without significant increases in funding or improved technology to increase case capacity, these trends are likely to continue, and backlogs will continue to increase. The challenges with SAK backlogs and the differential extraction method are well known to the forensic community [8]. Much R&D investment has gone into trying to develop alternative methods to improve and automate the differential extraction process, but other methods that are commercially available either have similar or worse sperm recovery to standard manual differential methods [6,9]. Recently, a successful process has been developed to automate the standard differential extraction protocol [9] on a Hamilton liquid handling robot as well as the semi-automated method on the QIAcube [10] system. These developments are significant steps toward reducing the growing backlog of sexual assault kits that are sitting unprocessed [2]. However, automated differential extraction methods still rely on removing the sperm cells from the swab or substrate and the sperm cell pellet formation. While automated methods perform similarly to manual differential extraction in SAK samples with high sperm quantities, they tend to perform worse in samples with low sperm quantities [9]. While some laboratories may decide to use an automated method to improve their capacity, they may end up doing so at the cost of reducing their success rates. All the current methods have the limitation of low recovery of sperm DNA available on the evidence samples. In the case of the DNAse-based method, Erase Sperm, the recovery reported was only 4.3% of the estimated sperm cells present on the mock evidence swab [5]. A study from Australia reports a very low success rate of sperm detection from oral swabs of sexual assault victims [11]. Presently most crime laboratories do not even process sexual assault oral swabs because of the very low possibility of success in obtaining a probative DNA profile. A better sample recovery method can be very useful for such samples. The National Institute of Justice published the National Best Practices for Sexual Assault Kits: A Multidisciplinary Approach and stated in the conclusions “At the forensic laboratory, the objective is to analyze the SAK promptly and generate a DNA profile from the crime scene evidence that can be entered into CODIS and searched” [12]. Implementation of the SpermX (SX) method can be instrumental in meeting this objective to obtain the most informative probative male profile from sexual assault evidence, especially for samples containing lower amounts of sperm. The SX method consistently provided an average of six times more sperm DNA recovery compared to the standard differential extraction method (DE) and was even better for low-level sperm samples. This high recovery is due to the capability of the SpermX device to capture the sperm cells present in the special membrane matrix and the swab being kept in the device throughout the processing, including sperm digestion. Studies showed that removing the swab after the epithelial digest to obtain a sperm pellet during the differential extraction process can lead to losses of up to approximately 80% of the sperm DNA [13]. Current sexual assault processing methods used in forensic laboratories incorporate some variation of the original Gill’s method [4] and remove the substrate after initial epithelial cell digestion to pellet the sperm cells prior to washes and final digestion to obtain the sperm DNA fraction. This approach is also utilized in the automated process [9]. Thus, the adoption of nanofiber-based sperm capture technology to process SAKs results in an increased success rate [13] for obtaining results in many cases currently reported as no DNA results and could succeed in obtaining suspect profiles and solving crimes.
The SX method can improve the analysis of sexual assault evidence and provide a much-needed upgrade to conventional methods. Sexual assault samples often include evidence samples with low sperm counts. In many sexual assault cases victims do not go to the authorities right away and in certain situations are forced to douche, bathe, etc. [2,14], which decreases the number of sperm cells present in the evidence collected for the DNA analysis. The SX method can be used to perform differential extraction in low sperm evidentiary samples such as microscope slides, oral swabs, and other items that may not be successful or attempted with the DE.
This interlaboratory study was undertaken to establish that the SX method can be implemented at various crime laboratories and ensure that there is consistency across laboratories when performing the manual SX method and to compare results to each laboratory’s in-house DE (i.e., comparisons of the two methods are to be made within each laboratory to their specific DE and not between laboratories).

2. Materials and Methods

Saliva from one female donor was collected under an Advarra IRB (approval # MOD00865430) and semen from one male donor was obtained from an IRB-approved commercial source.
Proteinase K (ProK, 20 mg/mL), and Dithiothreitol (DTT, 1 M) were purchased from ThermoFisher Scientific, Waltham, MA, USA. GlobalFiler, GeneMapper IDX 1.4 and 1.6 software, Hi Di Formamide, Quantifiler™ Trio Quantification Kit, GeneAmp™ 9700 PCR thermal cycler, 7500 Real-Time PCR System, Veriti™ 96-Well Fast Thermal Cycler, Quant Studio™ 5 Real-Time PCR System, were from Applied Biosystems, Waltham, MA, USA. PowerPlex® Fusion from Promega Corporation, Madison, WI, USA, QIAamp® DNA Investigator Kit and MTL buffer from QIAGEN, Hilden, Germany, Phosphate Buffer Saline (PBS) was obtained from VWR Scientific, Radnor, PA, USA, Thermomixer (MIXER HC) was from USA Scientific, The AutoLys tube heating block for the thermomixer and AutoLys M Rack was purchased from Nolato, Sweden. InnoQuant HY DNA quantification kit, SpermX digest buffer, and Epithelial cell Digest buffer were components of the SpermX kit from InnoGenomics Technologies, New Orleans, LA, USA. For centrifugation of AutoLys M rack with 24 SpermX tubes was performed using Eppendorf 5810 R centrifuge with an A-4 Rotor for deep well plates.

2.1. Samples and Pre-Quantification

Mock, case-type mixture samples were prepared using biological samples like sperm cells and buccal cells. The first step involved pre-quantifying all the biological samples individually. The samples were then mixed in appropriate ratios to achieve the desired Female: Male ratios.
For the saliva samples, the collection process included washing the samples initially. Multiple tubes containing 750 µL of neat saliva and 500 µL of Phosphate Buffered Saline were vortexed and centrifuged at 12,000× g in a 1.5 mL tube. After centrifugation, 1 mL of the supernatant was discarded, and the remaining 250 µL fractions were pooled together after resuspension to ensure homogeneity. Duplicate aliquots of 25 µL from the pooled saliva were extracted, purified, and pre-quantified using the InnoQuant kit [15]. The pre-quantification process aimed to determine the concentration of the DNA in the saliva samples (ng/µL).
For the semen samples, pre-quantification was performed similarly to the previous methods described earlier [13]. A known volume of neat semen was digested briefly with ProK to remove non-sperm cell DNA, such as DNA contribution from white blood cells, from the semen sample [16,17]. This step ensured that only DNA from sperm cells was quantified accurately. The sperm cells were washed once and then digested, purified, and quantified. For the pre-quantification of sperm cells, 25 µL of semen was extracted. Epithelial Digest solution (585 µL) and ProK (30 µL) were added to the sample. A Sperm Digest Mixture containing Sperm Digest Solution (296 µL), ProK (24 µL), and DTT (80 µL) was used for digestion. The digestion was carried out in a thermomixer at a shaking speed of 900 rpm for 45 min at 63 °C. DNA purification was performed using the QIAamp® DNA Investigator Kit, and DNA quantification was carried out using the InnoQuant® HY kit with the Quant Studio™ 5 Real-Time PCR System.
Each sample was pre-quantified in duplicate, and the average value was used for further calculations. The known amount of semen, determined based on the pre-quantification results, provided an estimate of the total DNA recovered from the sperm cells in the female:male mixture swabs. The number of sperm cells present in each swab sample is estimated using a value of 3.3 pg/cell [18] from the total DNA deposited on the swabs.
Variability is expected in the making of the mock swab samples. Cellular material may not remain homogeneous in solution and stochastic sampling effects can occur. Saliva was used for the female biological fluid as creating a vaginal slurry is more challenging and can lead to inconsistencies. Real casework samples with female vaginal epithelial cells and semen also have large variability. The variation in the sample preparation can account for some of the observed differences within and between the laboratories. The QC analysis of the prepared samples indicated good consistency for the triplicate samples (see Section 3.8 and results in Supplemental Table S1).
The recovery of sperm DNA from the mock swab samples was calculated by comparing the total amount of sperm DNA deposited on the swabs with the actual amounts recovered using both the SX method and the DE.

2.2. Mixture Sample Preparation

All three laboratories processed eight swab sets (i.e., each swab set in triplicate) of known female and male mixtures (Table 1). The mock evidence swabs were made with various female-to-male DNA sample ratios based on DNA quantifications, starting from 100:1 to 18,000:1. The lowest male DNA amount placed onto the swab was equivalent to approximately 25 sperm cells (assuming 1 sperm cell contains approximately 3.3 pg of DNA) [18].
Each laboratory independently processed the eight swab sets using the SX protocol and their current protocol for the DE. The laboratories had some differences in the DE, quantification kits, STR amplification kits, and genetic analyzers used for testing as described in Section 3. The female–male ratios on the dried swabs, listed in Table 1, were achieved by pre-quantification, and diluting the samples with PBS. The saliva component concentration was approximately 21.1 ng/µL and the semen component was 36.1 ng/µL. Each swab set prepared consisted of 18 identical samples such that each of the three laboratories was given 6 swabs in each set. The 6 swabs were divided to allow for the triplicate testing for the SX method and triplicate testing for the DE method.

2.3. SpermX Method for All Three Laboratories

All three laboratories performed the SX using the identical protocol and the reagents provided in the SpermX kit as described previously [13]. The method comparison swabs were cut from the applicator sticks, and whole swabs were used for the experiments. The cut swab was placed in the inner tube containing the nanofiber membrane of the SpermX device. For the SX, the swabs are retained in the SpermX device’s inner tube during all the steps, including sperm digestion. The first epithelial digest contained 585 µL of epithelial digest buffer together with 30 µL of ProK and was incubated at 56 °C for 1.5 h in a thermomixer with a shaking speed of 900 rpm. After the incubation, the inner tube was raised to the up position and centrifuged using AutoLys M Rack in a plate centrifuge, for 5 min at 3200× g. The first epithelial lysate (E1) was collected in the outer tube of the device. The inner tube was then placed into a fresh outer tube and a second epithelial digest was performed on the swab by adding 600 µL of epithelial digest buffer and 15 µL of ProK solution at 56 °C for 30 min. The second epithelial lysate was collected by centrifuging the SpermX device with the inner tube at the raised position for 5 min at 3200× g. The remaining epithelial DNA was removed by placing the inner tube only in a 15 mL conical tube for wash collection. Three washes were performed by adding 500 µL of sperm digest buffer in the inner tube with the sample and centrifuging. The washes were then discarded. For the sperm cell digestion, the inner tube containing the membrane with the sperm cells as well as the swab was placed in a clean outer tube. The sperm cell digest solution consisted of 296 µL of SpermX digest buffer with 24 µL of Pro K, and 80 µL DTT. The digestion was performed at 63 °C for 45 min in a thermomixer with a shaking speed of 900 rpm. The sperm fraction was collected by centrifugation and an additional amount of 150 µL of sperm digest buffer was then added to collect any remaining sperm DNA lysate soaked in the membrane. Finally, all the sperm cell fraction (S-fraction) was collected by centrifugation. All three fractions E1, E2, and S were subjected to DNA purification. All collected fractions (i.e., E1, E2, and S) were purified with the QIAamp® DNA Investigator Kit with a 60 µL elution volume (LAB 1) or the Qiagen EZ1 DNA Investigator Kit on the EZ1® Advanced XL with a 50 µL elution volume (LAB 2 and LAB 3). To purify using the QIAamp DNA Investigator Kit, the lysate was combined with Buffer AL in equal volumes and mixed vigorously by vortex for 10 s. The mixture was then combined with an equal volume of 100% ethanol and mixed again for 10 s before transferring it to a QIAamp MinElute column. The ratio of lysate to Buffer AL to ethanol was maintained at 1:1:1. When using the Qiagen EZ1 DNA Investigator Kit and EZ1 Advanced XL (LAB 3), the large volume protocol was applied to the E1 fraction, with an elution volume of 100 µL, while the trace protocol was used for the E2 and S fractions, with an elution volume of 50 µL. All fractions were eluted into TE-4 buffer.

2.4. Conventional Differential Extraction Method (DE)

The three laboratories utilized their own standard differential extraction protocol. LAB 1 used the differential extraction protocol with single epithelial digestion which was performed as described by Klein et. al. [5]. The epithelial digestion process involved adding 400 µL of stain extraction buffer (SEB) consisting of 10 mM Tris, 10 mM EDTA, 100 mM NaCl, and 2% SDS, along with 10 µL of Pro K (20 mg/mL), to the substrate. The mixture was vortexed and incubated for 1 h at 56 °C, with shaking at 900 rpm in a thermomixer. To remove any liquid in the lid, the sample was briefly vortexed and centrifuged in an Eppendorf microcentrifuge. The swab was then placed in a spin basket and centrifuged in Eppendorf microcentrifuge at the maximum speed of 16,100× g for 5 min to recover as much liquid as possible. This liquid was combined with the epithelial digest (E). The swab was discarded, and the epithelial digest solution was centrifuged at maximum speed for 5 min. The resulting E fraction, approximately 380 µL, was carefully transferred to a new tube, leaving around 30 µL of supernatant covering the sperm pellet. The sperm pellet was washed three times with 750 µL of PBS. Each time, the pellet was resuspended, centrifuged, and most of the supernatant (except for 30 µL) was removed. The washed sperm pellet was then resuspended in a sperm digestion buffer consisting of 400 µL of SEB, 10 µL of Pro K, and 20 µL of 1 M DTT. A total of 430 µL of the digest solution was added to each sperm pellet, and the mixture was vortexed and incubated in a thermomixer for 2 h at 56 °C, with gentle mixing at 900 rpm. The DNA purification for both the epithelial and sperm fractions was carried out using the Qiagen QIAamp DNA Investigator Kit, following the manufacturer’s protocol.
LAB 2 differential extraction followed the Qiagen EZ1® DNA Investigator® protocol for “Pretreatment for Epithelial Cells Mixed with Sperm Cells” per the manufacturer [19]. In brief, the protocol epithelial digest was performed using 190 µL buffer G2 and 10 µL Proteinase K incubated at 56 °C for 1 h. Three washes of the sperm pellet with 500 µL buffer G2 were performed prior to the sperm digestion using 160 µL buffer G2, 10 µL Proteinase K, and 40 µL 1M DTT incubated at 70 °C for 10 min. The EZ1® trace protocol was used for a final elution volume of 50 µL.
LAB 3 differential extraction used a modification of the Qiagen EZ1® DNA Investigator® protocol for “Pretreatment for Epithelial Cells Mixed with Sperm Cells”. The modifications included an epithelial digestion solution comprised of 500 µL of an in-house EZ1 Extraction Buffer (~430 mL deionized water, 1.46 g sodium chloride, 5 mL Tris: HCl buffer, 10 mL EDTA buffer (0.5 M), and 50 mL sodium dodecyl sulfate solution (20%)), 5 µL Proteinase K, and 1 µL carrier RNA. Modifications to the incubation times and sperm pellet washes were made to decrease the 56 °C epithelial digest incubation from 1 h to 40 min at 850 rpm, increase the 70 °C sperm digest incubation from 10 min to 40 min at 850 rpm and decrease the number of sperm pellet washes from three to one. Before purification, MTL buffer (400 µL) was added to the E fractions. The large volume protocol with an elution volume of 100 µL was used for E fractions and the trace protocol with an elution volume of 50 µL was used for S fractions. All fractions were eluted into TE buffer.

2.5. DNA Quantification

LAB 1 used the InnoQuant® HY kit on a QuantStudio™ 5 Real-Time PCR System. The short target quantity was used to calculate total human DNA and the Y target quantity provided the male DNA concentration. The total human DNA minus the male DNA amount was calculated as the female DNA amount when applicable. The InnoQuant DNA standard is NIST traceable, hence the reported values of DNA quantifications are relative to the NIST SRM2372 standard [20].
LAB 2 used the Quantifiler™ Trio Quantification Kit on a 7500 Real-Time PCR System. The small autosomal target quantity provided the value for total human DNA, and the Y target quantity gave the male DNA concentration. For the estimation of the female DNA concentration, the quantification value of small autosomal minus the Y target DNA was used.
LAB 3 used the Quantifiler™ Trio Quantification Kit on a QuantStudio™ 5 Real-Time PCR System following the manufacturer’s guidelines for full reaction volumes. The same calculations as LAB 2 were performed to estimate total human DNA, male, and female DNA amounts.

2.6. STR Amplification and Typing

STR analysis of the purified DNA from E fraction and S fractions was performed using PowerPlex® Fusion kit by LAB 1. The input DNA was 0.4 ng in a 25 µL reaction volume (15 µL of template/low-TE and 10 µL of PCR reaction mix). PCR amplification was performed on the GeneAmp™ 9700 PCR thermal cycler for 30 cycles as per the manufacturer’s instruction. The injection mixture consisted of 1 µL of amplified product mixed with 9.5 µL of Hi Di formamide and 0.5 µL of PowerPlex® Fusion kit size standard. STR analysis was performed on the AB 3130 Genetic Analyzer and analyzed using GeneMapper ID-X®v1.4 and an analytical threshold of 100 RFU.
GlobalFilerTM amplifications were performed by LAB 2 targeting 1 ng template in a 25 µL reaction volume (15 µL of template/low-TE and 10 µL of PCR reaction mix) for 29 cycles on the GeneAmp 9700 PCR thermal cycler. The injection mixture consisted of 1 µL of amplified PCR product mixed with 9.6 µL of formamide and 0.4 µL of GeneScanTM 600 LIZTM dye Size Standard v2.0. STR analysis was performed on the AB 3500 Genetic Analyzer and analyzed using GeneMapper ID-X® v1.6 and an analytical threshold of 100 RFU.
LAB 3 performed GlobalFiler™ amplifications targeting 1 ng template DNA in a 25 µL reaction volume (15 µL of template DNA/TE−4 buffer and 10 µL of PCR reaction mix) for 29 cycles, on the Veriti™ 96-Well Fast Thermal Cycler. In preparation for injection and electrophoresis, a mixture of 10.4 µL of GeneScan™ 600 LIZ™ Lane Standard v. 2.0 per 250 µL of Hi-Di™ formamide was prepared and 10 µL was added to each well followed by 1 µL of amplified PCR product. STR analysis was performed on the AB 3500 Genetic Analyzer and analyzed using GeneMapper ID-X® v1.4 and an analytical threshold of 40 RFU. Note that although this laboratory used a different analytical threshold (AT) than the other two laboratories, each laboratory used the same AT for both the SX and DE samples.

2.7. Method Comparison Studies

A method comparison of the differential extraction process performed using SX with the DE was performed using eight mixture swab sets (Table 1). Quantification data of the total Y DNA recovered from the sperm fraction compared to the amount of sperm based on the quantification of the sperm cells added to the swabs were used to calculate the male DNA recovery for both the SX and DE. STR data comparisons of the sperm fraction profiles (one from each triplicate set based on the lowest S/Y ratio) were performed using the percentage of unshared male alleles recovered, the male percentage observed in the STR profile, and the statistical probabilities using the likelihood ratio (LR). Note that LAB 1 processed swab sets E–H and did not process mixtures A–D for the DE. The results of DE and SX method comparison for samples like swab sets A–D (i.e., with 5 ng or more male DNA) were previously performed by LAB 1 and reported [13] as part of the validation study (sample sets 10–15) and were not run for this study. The results for the swab sets A–D by LAB 2 and LAB 3 are reported in the Supplemental Materials (Tables S2–S7).
The male profile proportions and LR probabilities were determined using STRmix™ (a probabilistic genotyping software from Niche Vision Forensics, LLC) [21]. The known female and male donor genotypes were provided for comparison to the unknown mixture profiles, simulating a sexual assault case with a female victim and male suspect. Generic STRmix parameters were used that correspond to the STR kits, stutter values, and instrument platform using each laboratory analytical threshold (AT). LAB 1 and LAB 2 used an AT of 100 RFU and LAB 3 used an AT of 40 RFU. STRmix used the two known contributors to each mixture to provide the proportion of each contributor in each of the sperm fraction profiles (e.g., 70% female and 30% male). Data are reported as the male proportion in each sample. All STRmix runs used the same proposition with H1 as the female and male as known contributors and H2 as the female known contributor and an unknown contributor. The LR was calculated using the highest posterior density (HPD) for a lower bound estimate, to assess the amount of information gained for each mixture for both methods.

3. Results

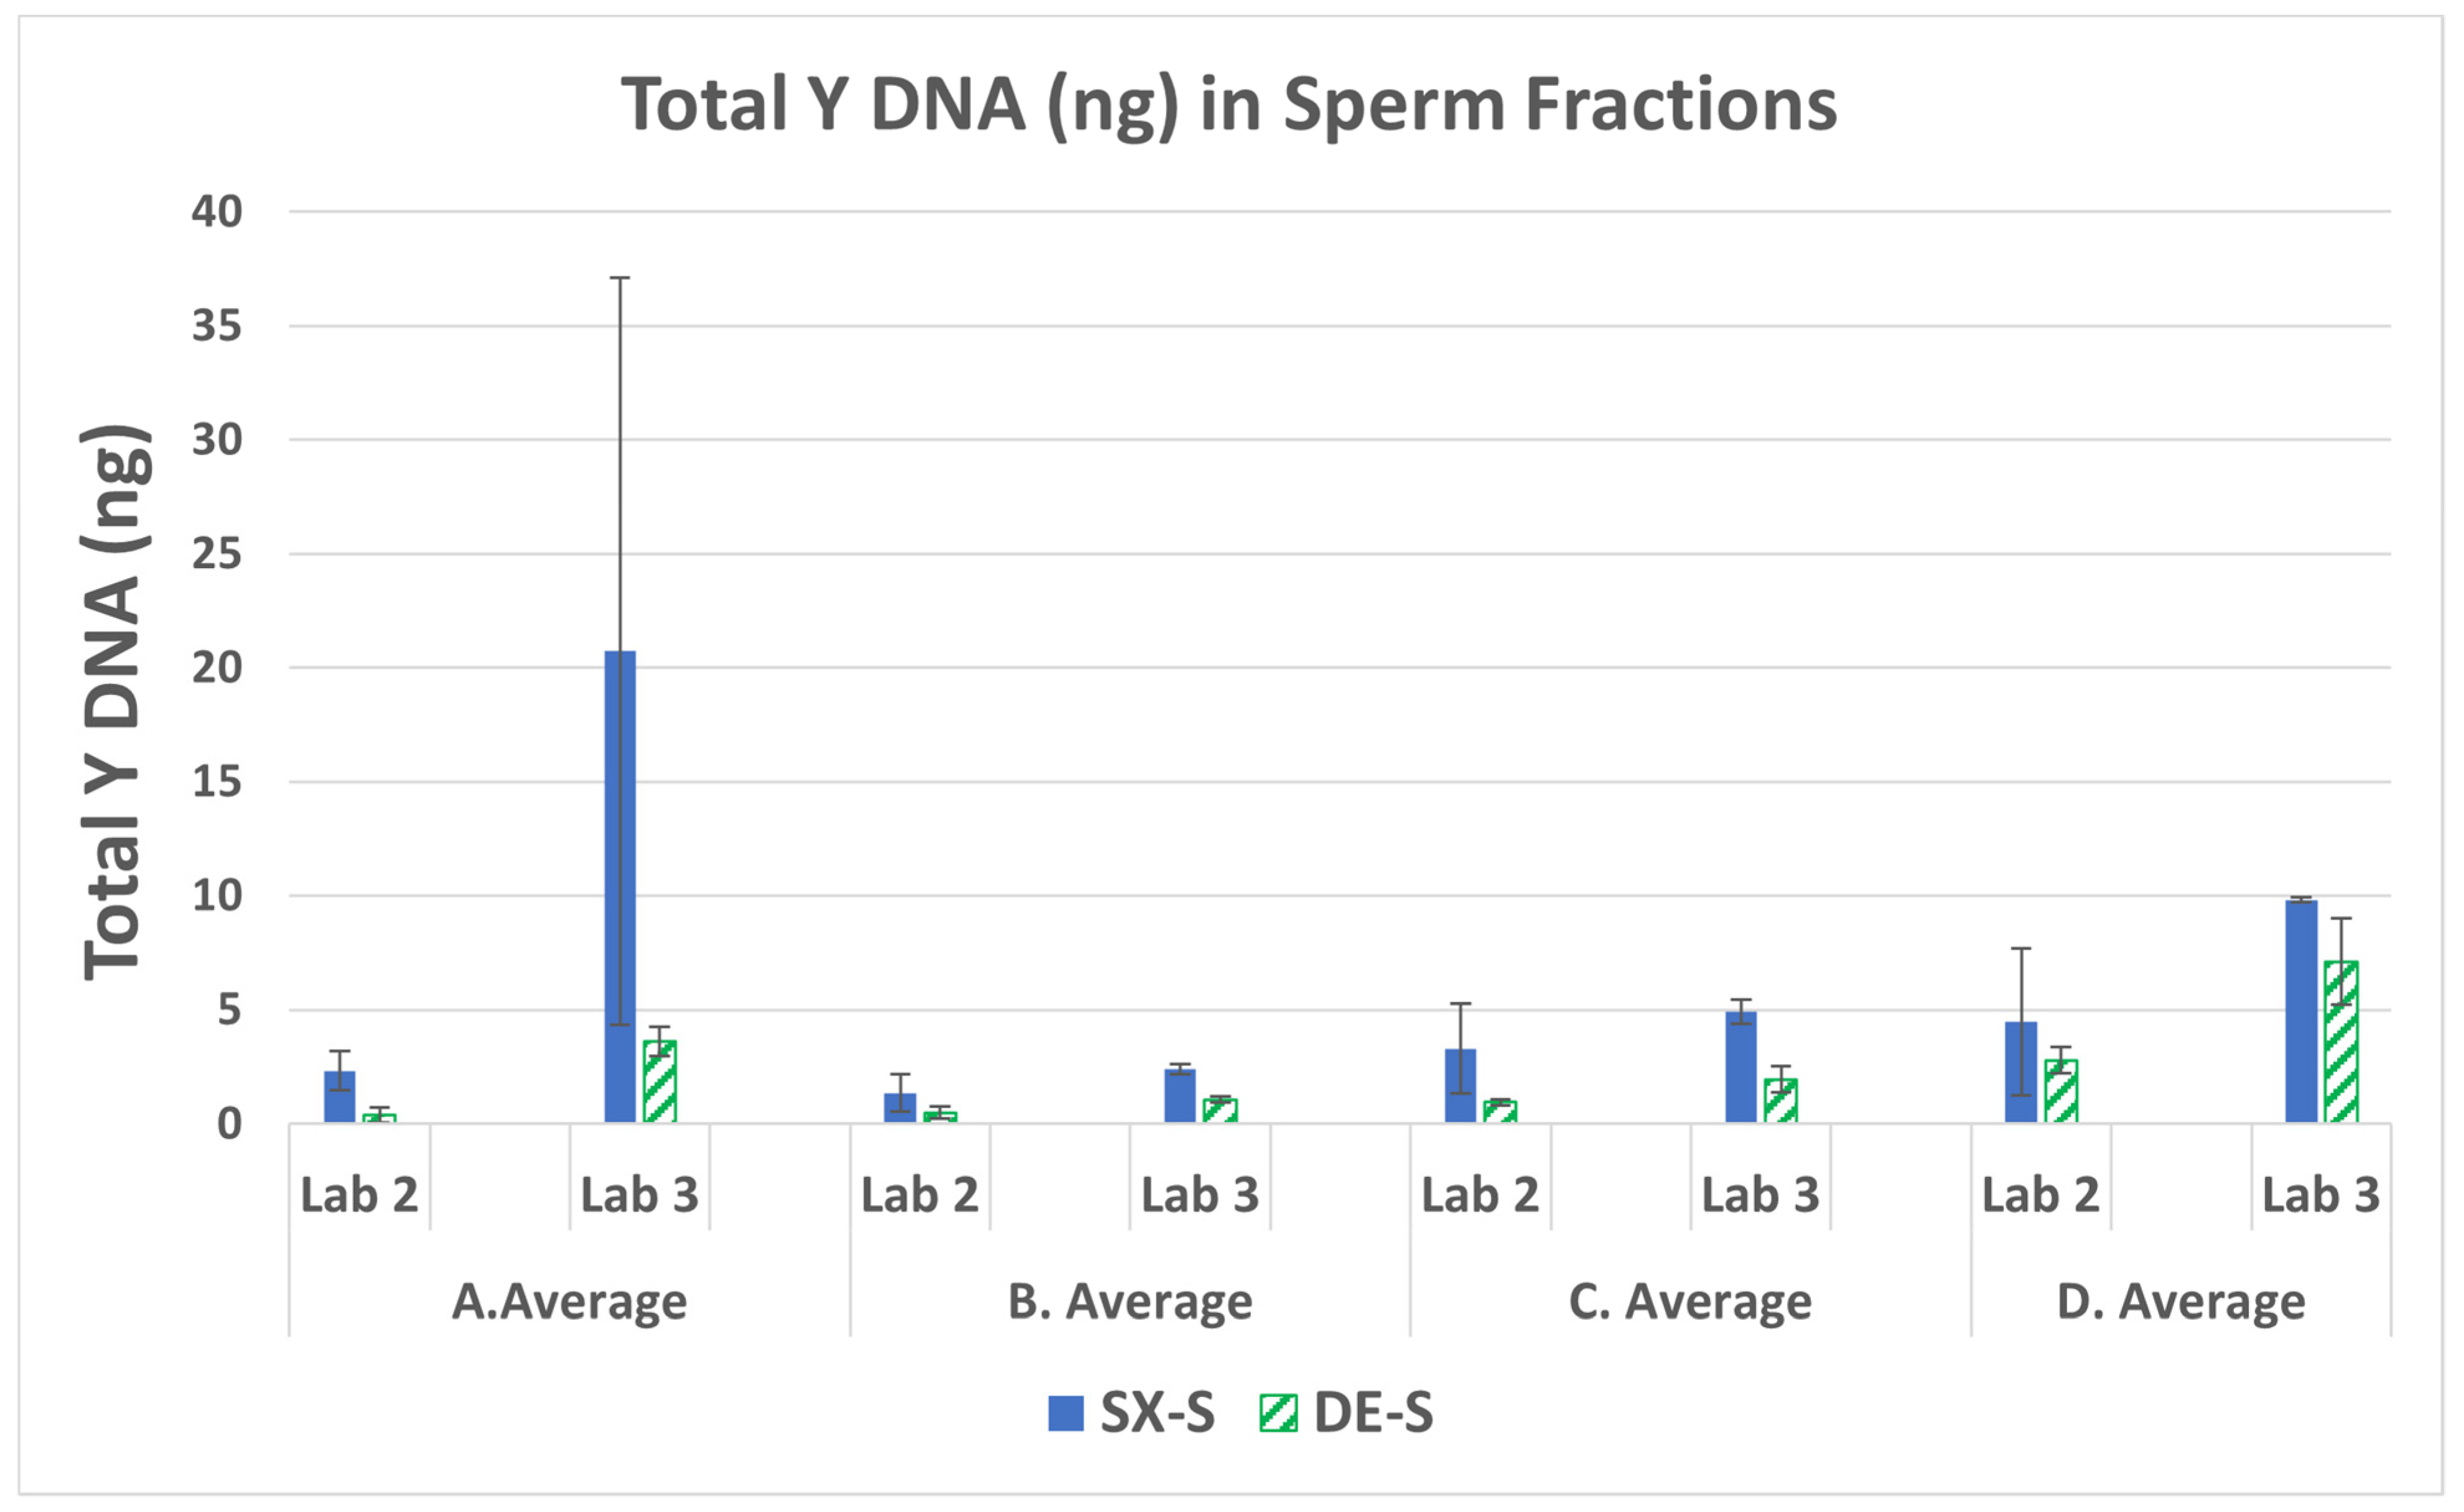
3.1. Male DNA in Sperm Fractions

The total Y DNA (ng) in each sperm fraction was averaged for the triplicate runs for each mixture. The averages for mixtures A–D and E–H are shown in Figure 1 and Figure 2, respectively. The SX had a higher recovery of male DNA than did the DE for all samples run by the three laboratories. The average amount of DNA recovered for mixture A by LAB 3 in Figure 1 is an outlier, exhibiting double the amount of DNA placed on the swab. This may be due to some inhomogeneities in the solution during sample preparation. The lower-end sperm series in mixtures E–H were prepared with 1500 ng female and 2.5 ng, 1.25 ng, 0.33 ng, and 0.0825 ng male, respectively. Figure 2 illustrates the decrease in male DNA recovered from E to H, as expected. On average, SX recovered five-fold more male DNA than DE. A majority of the comparisons exhibited significant differences (p < 0.05) as seen in Supplemental Table S2. The fold differences in Y DNA (SX/DE) in the sperm fractions and laboratory averages are in Supplemental Table S3.

3.2. Total Human to Male Ratios (S/Y) in the Sperm Fractions

The ratio of the total human DNA or the small autosomal target DNA (S) to the male DNA (Y target) in the sperm fraction can be used an indicator of the performance of the SX and DE by indicating how well each method separated the sperm cell DNA from the female/non-sperm cell male DNA. If the total human DNA obtained from the short quantification is equal to the Y-DNA quantification the S/Y ratio will be close to one, indicating a good separation of male and female cells during differential extraction. A S/Y ratio of one (barring any copy number variation for the male individual) would be expected to give a single source male DNA profile. If there is sufficient male DNA this sample will provide a probative autosomal STR profile from sexual assault evidence collected from a female victim. In the case of more total human DNA from female carryover into the sperm fraction, the S/Y ratio is higher than one. The total human DNA quantification includes DNA from the female cells (e.g., buccal cells from saliva) and DNA from the sperm cells, and the contribution from the non-sperm DNA from the semen donor such as the white blood cells and any epithelial or cell-free DNA present in the semen [17,18]. The pre-quantification of the neat semen obtained from the male donor resulted in a non-sperm DNA contribution (i.e., DNA amount in the epithelial digestion fraction) of 22.6%. Figure 3 lists the average S/Y ratio obtained from the swab sets for each sperm fraction.
The SX resulted in lower S/Y ratios for all samples run by each of the three laboratories. This is indicative of less female carryover with SX compared to DE. Note that each laboratory had only one of the three swabs with results for the lowest sperm mixture H (25 sperm cells) processed with DE (no standard deviation bars). The DE S/Y ratios ranged from 5.4 to 183-fold higher than SX, indicating a poorer separation of female and male DNA. The fold difference in S/Y ratios (DE/SX) in the sperm fractions and laboratory averages are in Supplemental Table S4.

3.3. Male Recovery Percentage in the Sperm Fractions

The average percentage of male DNA in the sperm fraction relative to the theoretical amount placed on the swabs is shown in Figure 4. The SX recovered more male DNA distributed into the sperm fraction than did the DE. The difference between values (displayed as -fold higher differences) are shown in Table 2.
The results presented in Figure 4 indicate that, on average, SX recovered from 1.5 to 10 times more male DNA in the sperm fractions of mixtures A–D than DE. For the lower-end sperm series, E–H, SX recovered 20–1533 times more male DNA than DE. The SX recovered more sperm DNA than DE from the mixtures with as low as 100 cells (swab set G: 330 pg) and 25 cells (swab set H: 82.5 pg). This demonstrates the SX as the better method to recover male DNA from evidentiary swabs with very low amounts of sperm in the presence of high amounts of female material (swab set G at 4545:1 and swab set H at 18,182:1).

3.4. Percent Female Carryover in the Sperm Fractions

The percentage of female DNA in the sperm fractions was calculated by the fraction of total female DNA present in the sperm fraction ((total human–male DNA)/total female in all fractions) × 100 and not by the theoretical amount placed on the swabs. The average percent female carryover into the sperm fractions is shown in Figure 5. The DE exhibited a higher average percentage of female carryover than SX for all swab sets run from all three laboratories. A majority of the comparisons exhibited significant differences (p < 0.05) as seen in Supplemental Table S5. The fold difference for each of the mixtures ranged from 2.8 to 10-fold more female carryover with DE than SX. The fold differences for higher DE female carryover (DE/SX) in the sperm fractions and laboratory averages are in Supplemental Table S6. LAB 3 exhibited higher fold differences that may be due to their DE method consisting of only one wash of the sperm pellet whereas the SX method incorporates three washes, like most DE protocols (as used by LAB 1 and LAB 2). The experimental design required each laboratory to utilize its current protocols for DE methods to be more representative of the practice in various crime laboratories. The DE included only one epithelial lysis step, as was the practice in the three laboratories involved in this study. However, a double epithelial lysis step as reported [5] could have reduced the female carryover in the DE. Overall, the larger amount of female carryover results in more complex mixture interpretations and/or loss of male allelic information.

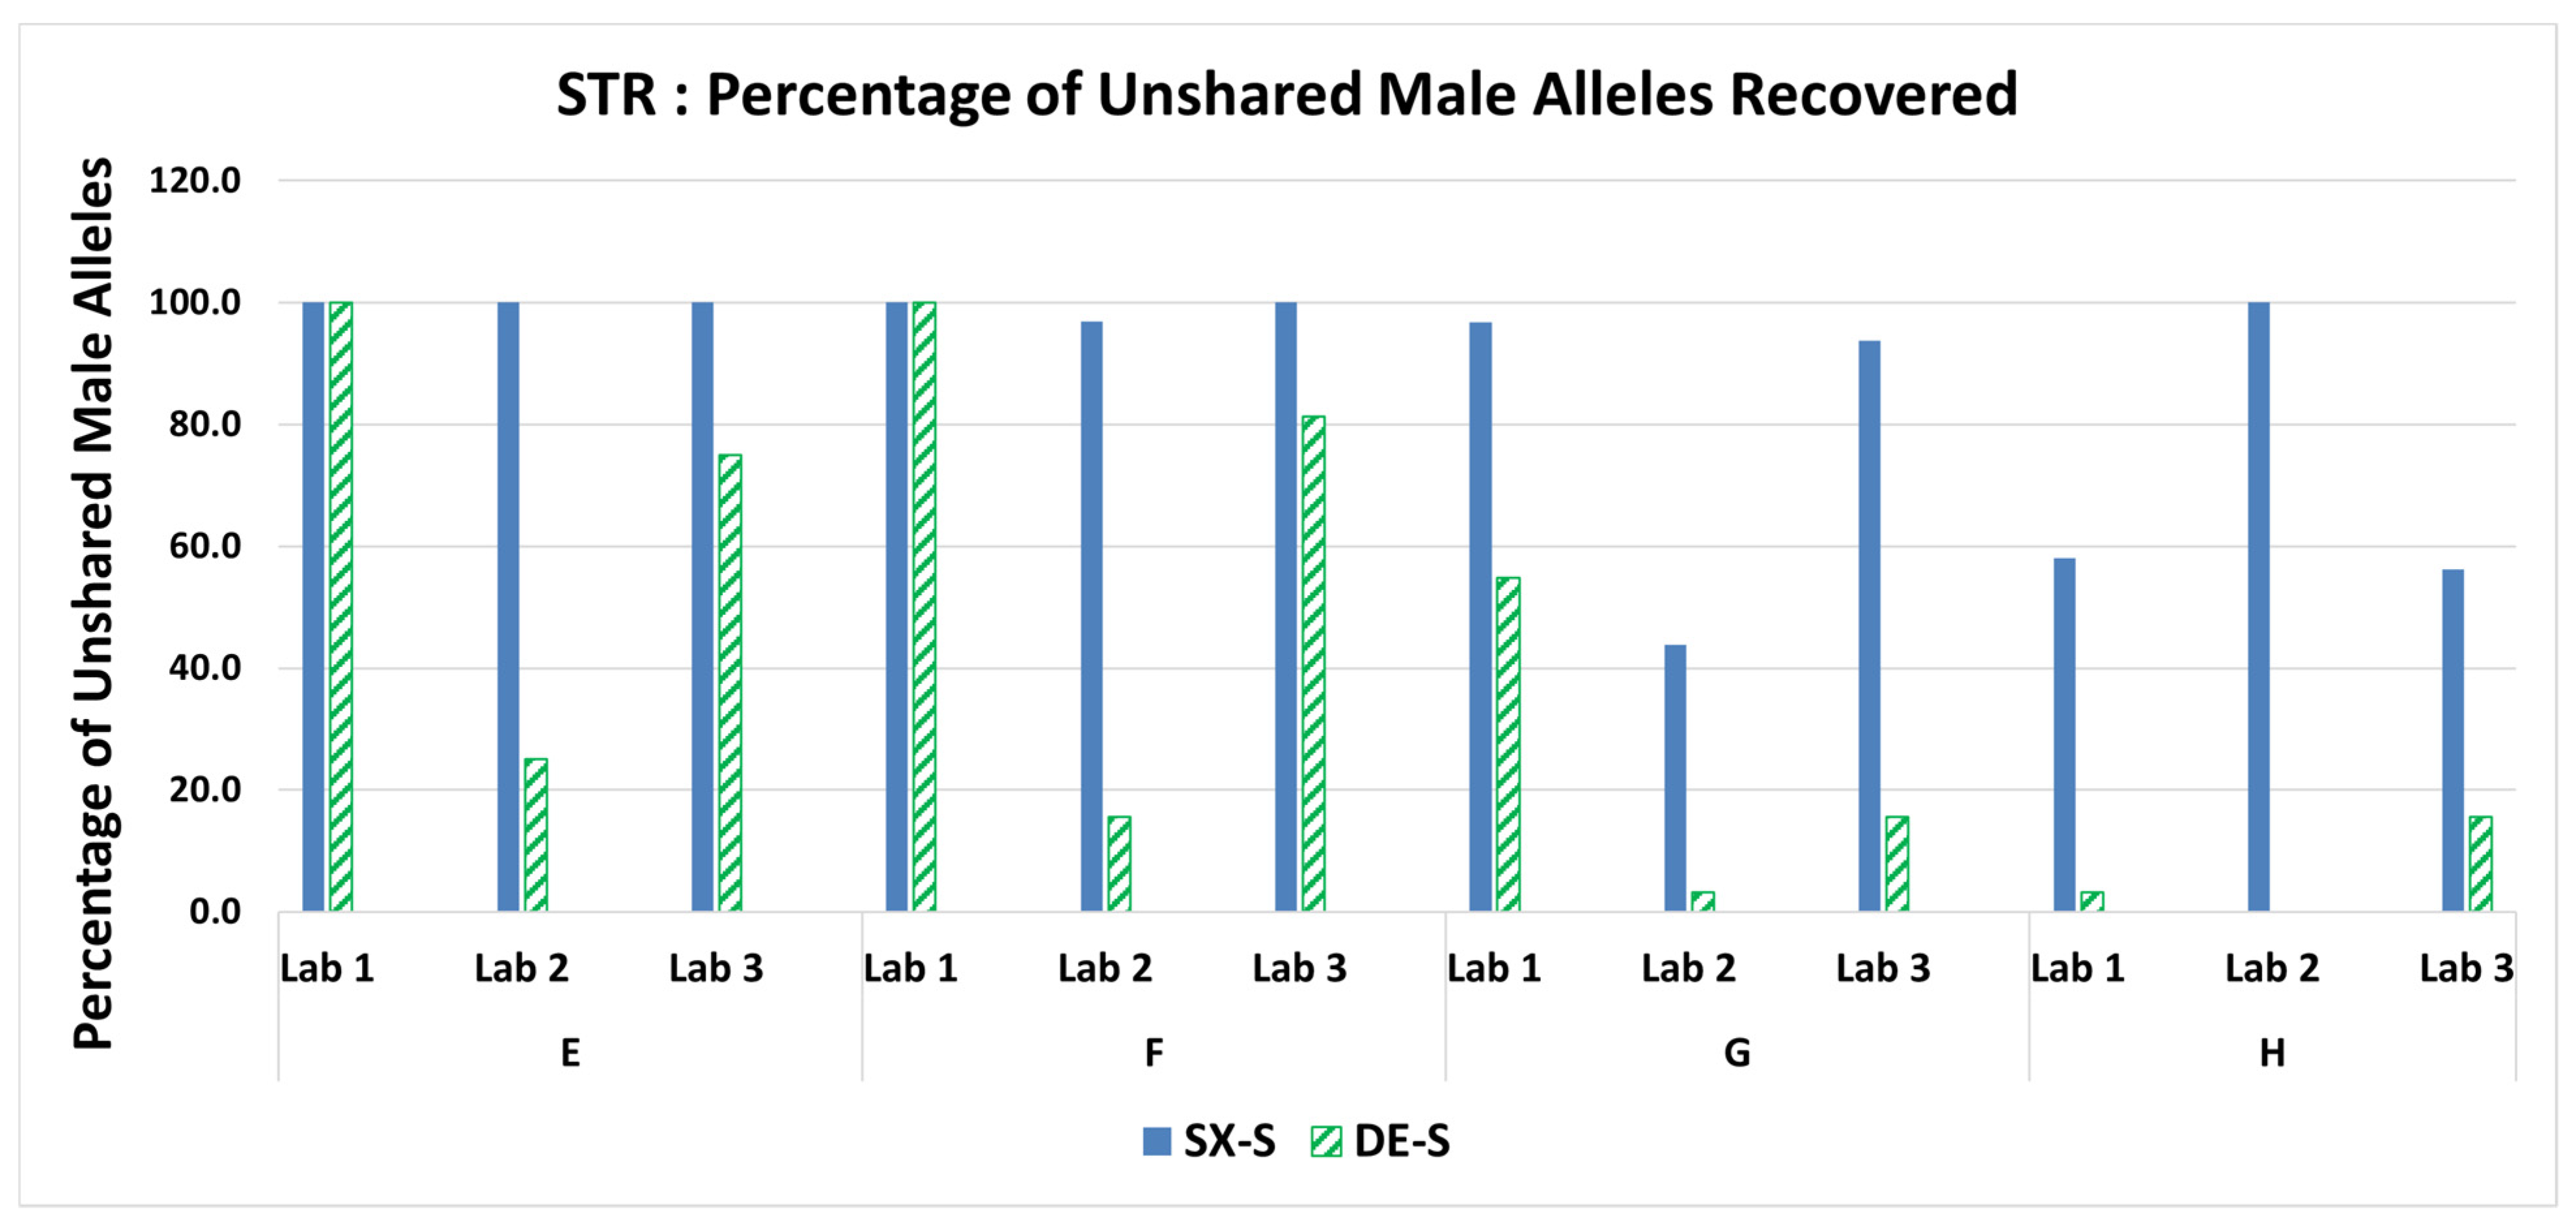
3.5. STR: Percentage of Unshared Male Alleles Recovered in the Sperm Fraction Profiles

STR profiles from one of the three replicates (i.e., the sperm fraction that exhibited the lowest S/Y ratio) for each mixture were typed by LAB 1 using PowerPlex® Fusion on an Applied Biosystems 3130 Genetic Analyzer and typed by the LAB 2 and LAB 3 using GlobalFiler™ on an Applied Biosystems 3500 Genetic Analyzer. The female: male mixture genotypes contained 31 and 32 unshared male alleles for Fusion and GlobalFiler, respectively. Recovery of the unshared male alleles is shown as a percentage in Figure 6. The SX demonstrated comparable or more unshared male alleles recovered in the sperm fraction STR profiles for all mixtures run for each of the three laboratories. The percentage of unshared male alleles detected in the sperm fractions and fold differences (SX/DE) are in Supplemental Table S7. LAB 2 detected only one unshared allele (3.1%) in mixtures B and G, demonstrating higher fold differences of 32-fold and 14-fold, respectively. This may indicate there was some loss of the sperm pellet and the resulting lower recovery of male DNA. This is not uncommon in actual casework analysis by various crime laboratories with the DE method. Mixtures G and H, with the lowest amount of sperm deposited on the swabs, resulted in SX detecting more unshared male alleles as shown in Table 3. Hence, the SX renders more genetic profile information from the probative male donor than does the DE.
The most disparate mixture H, with a female: male ratio of 18,182:1, containing only 25 sperm cells resulted in a minor male profile with all unshared alleles detected with the SX and a single source female profile (i.e., no male unshared alleles detected) with the DE as shown in Figure 7 when processed by LAB 2. Note that LAB 2 had an unexplained inconsistency with more alleles obtained in mixture H than in mixture G. LAB 2 did recover more sperm DNA in mixture G than in mixture H (Figure 2). This can potentially be due to inhomogeneities in sample preparation due to stochastic effects with lower amounts of DNA or loss of sperm DNA in mixture G during processing.
LAB 1 processing of the H mixture resulted in 18 unshared male alleles detected with the SX and only one unshared male allele obtained with the DE. The single 29 male allele was called at the D21S11 locus as seen in Figure 8, with no other indication of male DNA in the profile (i.e., no Y at Amelogenin nor the 11 Y-STR allele at DYS391).
Similarly, LAB 3 DE results had no Y allele at Amelogenin nor the two detected at Y-indel for mixture H but did detect five unshared male alleles at other loci, including the 11 at DYS391, whereas the SX detected 18 unshared male alleles in total. A comparison of the GlobalFiler profiles for the purple channel in Figure 9 shows five unshared male alleles detected for the SX and no unshared male alleles detected for the DE.

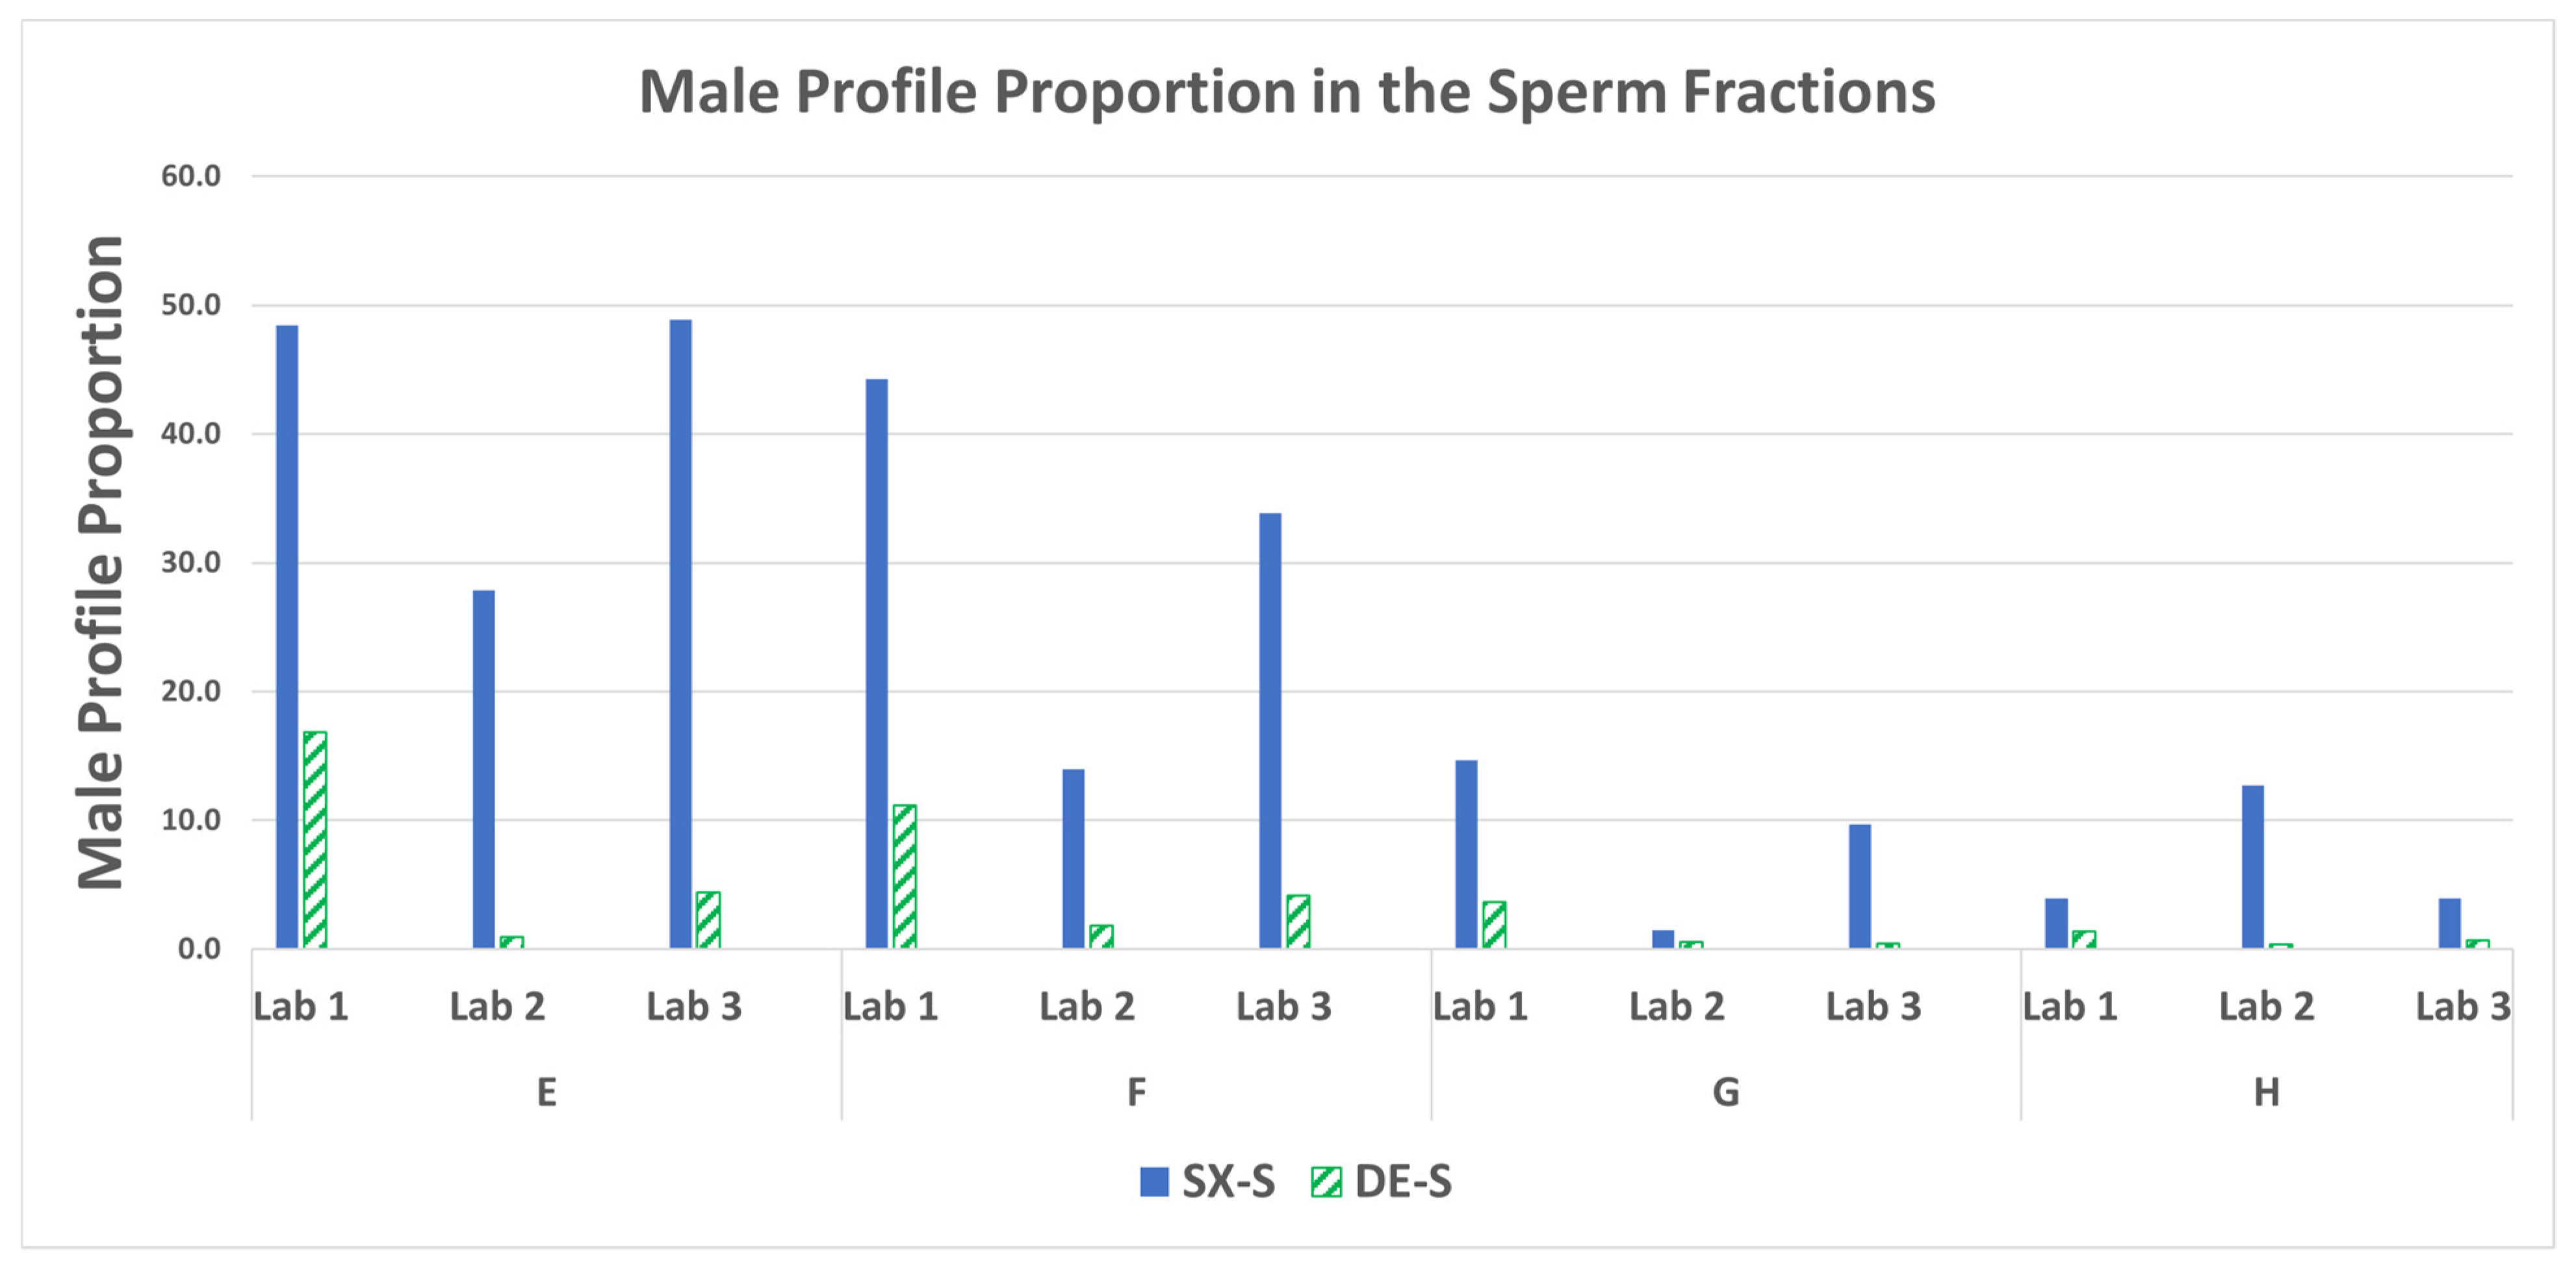
3.6. STR: Male Profile Proportion in the Sperm Fractions

The STR profiles of the sperm fractions were processed using STRmix™ to obtain the percentage of the male donor in each mixture. The male profile proportions give a better evaluation of the contribution of male DNA relative to the female DNA in the mixture (i.e., peak height is utilized) than does the count of unshared male alleles detected (Section 3.5). The male profile proportions in Figure 10 demonstrate the SX STR profiles were comprised of more of the male component (less of the female component) than the DE STR profiles. The SX ranged from 2- to 36-fold more male contribution detected in the STR sperm fraction profiles than the DE. The percentage of the male component in the STR profile from the sperm fractions using STRmix and fold differences (SX/DE) are in Supplemental Table S8.

3.7. STR Statistics: Probabilistic Genotyping

The STR profiles of the sperm fractions were processed using STRmix to obtain the LRs for each mixture (i.e., ratio of the probability to observe the results should the male donor/suspect be at the source of the DNA detected to the probability to observe the results should an unknown, unrelated contributor be at the source of the DNA detected). Figure 11 shows the LRs for each of the mixtures for each method. The SX demonstrated comparable or higher likelihood ratios in the sperm fraction STR profiles for all mixtures run for each of the three laboratories. The SX LRs were higher by 2 to 23 orders of magnitude. The likelihood ratios using STRmix and fold differences (SX/DE) are in supplemental Table S9. The increased allele calls observed with the SX resulted in better interpretations with STRmix, taking into account more information, thus resulting in higher LRs.

3.8. Variability in Recovery and Triplicate Samples

The variance observed in the average percent recovery of female and male DNA and the relative standard deviation (RSD) of the triplicate runs from each of the mixture sets was evaluated. The data for the SX method run by LAB 1 are in Table 1 as an example of the observed variation of the mock sample sets. The average percent recovery, determined by the observed DNA (ng) from the expected DNA (ng), ranged from 68.33% to 87.88% for the epithelial fractions (E) and from 60.16% to 81.56% for the sperm fractions (S). The RSD for the E fraction DNA obtained from each of the triplicate runs ranged from 5.18% to 17.88%, with one exception at 34.92%. (D mixture). The RSD for the S fractions ranged from 6.80% to 25.24%, with one exception at 42.87% (G mixture). Therefore, the majority of the sample sets showed good consistency with RSD values less than 30%, with a few exceptions.

4. Discussion

Current differential extraction methods have been shown to recover only 5–30% of the sperm from a sexual assault swab [5]. The NIJ backlog study (page 68) reports that 30–40% of SAK samples that screen positive for male DNA do not produce a CODIS-eligible profile [2]. The SX can improve the likelihood of obtaining a CODIS-eligible DNA profile in cases that would previously have resulted in insufficient DNA for analyses.
All quantification metrics to evaluate the effectiveness of the differential extraction methods’ ability to separate the female and male DNA components illustrated the SX outperformed the DE. STR analysis demonstrates the SX had higher recovery of unshared male alleles, higher proportions of male DNA in the mixed profiles, and better statistical inferences (i.e., higher LR) for inclusion of the male component than the DE.
The SX can be performed manually, semi-automated, or fully automated [22]. The method can be implemented by crime laboratories, for DNA analysis of sexual assault samples, using standard supplies and equipment that is routinely used in most crime laboratories such as centrifuges (adapter racks for SX are provided with kits) and ovens or heater shakers for incubations. High throughput automation can be implemented on a Hamilton STAR/SAE liquid handling platform for processing sexual assault kits to reduce current backlogs. Minimal training is required since the method is not analyst and technique-dependent since the membrane captures the sperm cells and is not reliant on manual pipetting skills to minimize sperm cell loss during the differential extraction process. The SX can be performed by a trained technician without the expertise required for a qualified DNA analyst, allowing the analyst to tend to tasks that require their expertise.

5. Conclusions

In conclusion, all three laboratories had similar trends for all mixtures, exhibiting good reproducibility across the laboratories. This interlaboratory study demonstrates the SX is robust and captures more male DNA, with less female carryover, resulting in more informative STR profiles than the DE. This study confirmed that sexual assault kit evidence containing semen would benefit from processing using the SX to provide the most informative probative male profile from these evidentiary-type samples. This is especially true for swabs containing very low sperm amounts.

Supplementary Materials

The following supporting information can be downloaded at: https://www.mdpi.com/article/10.3390/forensicsci3040043/s1. Supplementary Tables S1–S9. Table S1. Percentage Recovery, Standard Deviation and Relative Standard Deviation of Triplicates run with SpermX for LAB 1. Table S1.1. Average Percentage Recovery for the triplicate epithelial fractions (E) and sperm fractions (S) for mixtures A–D. Table S1.2. Standard Deviation (SD) and Relative Standard Deviation (RSD) of the triplicate DNA recoveries for the epithelial fractions (E) and sperm fractions (S). Table S2. Statistical significance for the total Y DNA recovery in the sperm fractions comparison of the SX and DE for each laboratory (alpha = 0.05). Data in Figure 1 and Figure 2. Table S3. Fold differences in total Y DNA (SX/DE) in the sperm fractions and lab averages. Data in Figure 1 and Figure 2. Table S4. Fold difference in S/Y ratios (DE/SX) in the sperm fractions and lab averages. Data in Figure 3. Table S5. Statistical significance for the average percent female carryover in the sperm fractions comparison of the SX and DE for each laboratory (alpha = 0.05). Data in Figure 5. Table S6. Fold Differences for higher DE Female Carryover (DE/SX) in the sperm fractions and lab averages. Data in Figure 5. Table S7. Percentage of unshared male alleles detected in the sperm fractions and fold differences (SX/DE). Data in Figure 6. Table S8. Percentage of the male component in the STR profile from the sperm fractions using STRmix and fold differences (SX/DE). Data in Figure 10. Table S9. Likelihood ratios using STRmix and fold differences (SX/DE). Data in Figure 11.

Author Contributions

Conceptualization: J.B.S., S.K.S., E.H., T.W. Methodology: J.B.S., S.K.S., E.H., J.B., J.N., M.F., T.W., H.B., H.H., M.-r.K. Data Curation: J.B.S., S.K.S., E.H., J.B., J.N., M.F., H.B., H.H., M.-r.K. Data analysis: J.B.S., H.B.; T.K., M.F., T.W., E.H. Writing: S.K.S.; J.B.S., T.K., M.F., T.W., E.H. All authors have read and agreed to the published version of the manuscript.

Funding

This research received no external funding.

Institutional Review Board Statement

The study was conducted according to the guidelines of the Declaration of Helsinki and approved by the Institutional Review Board and Ethics Committee of Advarra IRB (approval # MOD00865430 dated 12 February 2021).

Informed Consent Statement

Informed consent was obtained from all subjects involved in the study.

Data Availability Statement

Data is contained within the article or supplementary material. Any additional data is available on request from the corresponding author.

Conflicts of Interest

Joanne B. Sgueglia, Hailey Holt, Mah-Ro Khan, Hiromi Brown, and Sudhir Sinha are employees of InnoGenomics Technologies, LLC.; developer of the SpermX device. All other authors declare no conflict of interest.

Prior Presentations

Some information included in the submitted paper was presented at the Green Mountain DNA Conference (in person Burlington, VT, USA) in July 2022, and NIJ Forensic Technology Center of Excellence Webinar (Virtual), in August 2022, and the American Association of Forensic Sciences Annual conference (in person Orlando, FL, USA) in February 2023.

References

  1. National Sexual Assault Kit Initiative. The National Sexual Assault Kit Initiative (SAKI). 2023. Available online: https://sakitta.org/metrics/ (accessed on 10 April 2023).
  2. Peterson, J.; Johnson, D.; Herz, D.; Graziano, L.; Oehler, T. Sexual Assault Kit Backlog Study, NCJ Number 238500. 2012. Available online: https://nij.ojp.gov/library/publications/sexual-assault-kit-backlog-study (accessed on 3 January 2023).
  3. David, K. Sexual Assault Kit Processing at the Alaska Scientific Crime Detection Laboratory-Letter- Public Information. 1922. Available online: https://dps.alaska.gov/getmedia/ac3e3f7d-6812-45d3-a730-29e0eeb9527c/April-2022-Sexual-Assault-Kit-Processing-Workflow.pdf (accessed on 26 April 2023).
  4. Gill, P.; Jeffreys, A.J.; Werrett, D.J. Forensic application of DNA ‘fingerprints’. Nature 1985, 318, 577–579. [Google Scholar] [CrossRef] [PubMed]
  5. Klein, S.B.; Buoncristiani, M.R. Evaluating the efficacy of DNA differential extraction methods for sexual assault evidence. Forensic. Sci. Int. Genet. 2017, 29, 109–117. [Google Scholar] [CrossRef] [PubMed]
  6. Bogas, V.; Bento, A.; Serra, A.; Brito, P.; Lopes, V.; Sampaio, L.; Gouveia, N.; Cunha, P.; Balsa, F.; São-Bento, M.; et al. Validation of sampletype I-sep DL for differential extraction and purification with prepfiler express in the automate express DNA extraction system. Forensic. Sci. Int. Genet. Suppl. Ser. 2017, 6, e353–e354. [Google Scholar] [CrossRef]
  7. Paul, J. Project FORESIGHT Annual Report, 2020–2021. Faculty & Staff Scholarship. 3093. 2022. Available online: https://researchrepository.wvu.edu/faculty_publications/3093. (accessed on 26 April 2023).
  8. Volk, P.; Holt, A.; Chen, A.; Hanson, E.; Ballantyne, J. Enhancing the sexual assault workflow: Development of a rapid male screening assay incorporating molecular non-microscopic sperm identification. Forensic. Sci. Int. Genet. Suppl. Ser. 2019, 7, 21–22. [Google Scholar] [CrossRef]
  9. Timken, M.D.; Klein, S.B.; Kubala, S.; Scharnhorst, G.; Buoncristiani, M.R.; Miller, K.W.P. Automation of the standard DNA differential extraction on the Hamilton AutoLys STAR system: A proof-of-concept study. Forensic. Sci. Int. Genet. 2019, 40, 96–104. [Google Scholar] [CrossRef] [PubMed]
  10. Goldstein, M.C.; Cox, J.O.; Seman, L.B.; Cruz, T.D. Improved resolution of mixed STR profiles using a fully automated differential cell lysis/DNA extraction method. Forensic. Sci. Res. 2020, 5, 106–112. [Google Scholar] [CrossRef] [PubMed]
  11. Nittis, M.; Franco, M.; Cochrane, C. New oral cut-off time limits in NSW. J. Forensic. Leg. Med. 2016, 44, 92–97. [Google Scholar] [CrossRef] [PubMed]
  12. Spivak, H. National Best Practices for Sexual Assault Kits: A Multidisciplinary Approach. Available online: https://nij.ojp.gov/topics/articles/national-best-practices-sexual-assault-kits-multidisciplinary-approach (accessed on 3 January 2023).
  13. Sinha, S.K.; Brown, H.; Holt, H.; Khan, M.; Brown, R.; Sgueglia, J.B.; Loftus, A.; Murphy, G.; Montgomery, A. Development and validation of a novel method “SpermXTM” for high throughput differential extraction processing of sexual assault kits (SAKs) for DNA analysis. Forensic. Sci. Int. Genet. 2022, 59, 102690. [Google Scholar] [CrossRef] [PubMed]
  14. Casey, D.G.; Domijan, K.; MacNeill, S.; Rizet, D.; O’Connell, D.; Ryan, J. The Persistence of Sperm and the Development of Time Since Intercourse (TSI) Guidelines in Sexual Assault Cases at Forensic Science Ireland, Dublin, Ireland. J. Forensic. Sci. 2017, 62, 585–592. [Google Scholar] [CrossRef] [PubMed]
  15. Loftus, A.; Murphy, G.; Brown, H.; Montgomery, A.; Tabak, J.; Baus, J.; Carroll, M.; Green, A.; Sikka, S.; Sinha, S. Development and validation of InnoQuant® HY, a system for quantitation and quality assessment of total human and male DNA using high copy targets. Forensic. Sci. Int. Genet. 2017, 29, 205–217. [Google Scholar] [CrossRef] [PubMed]
  16. Fedder, J. Nonsperm Cells in Human Semen: With Special Reference to Seminal Leukocytes and their Possible Influence on Fertility. Arch. Androl. 1996, 36, 41–65. [Google Scholar] [CrossRef] [PubMed]
  17. Shewale, J.G.; Sikka, S.C.; Schneida, E.; Sinha, S.K. DNA profiling of azoospermic semen samples from vasectomized males by using Y-PLEXTM6 amplification kit. J. Forensic. Sci. 2003, 48, 127–129. [Google Scholar] [CrossRef] [PubMed]
  18. Gillooly, J.F.; Hein, A.; Damiani, R. Nuclear DNA content varies with cell size across human cell types. Cold Spring Harb. Perspect. Biol. 2015, 7, 1–27. [Google Scholar] [CrossRef] [PubMed]
  19. Qiagen. Available online: https://www.qiagen.com/us/products/human-id-and-forensics/investigator-solutions/qiaamp-dna-investigator-kit/ (accessed on 7 November 2022).
  20. Romsos, E.L.; Kline, M.C.; Farkas, N.; Duewer, D.L.; Toman, B. Certification of Standard Reference Material® 2372a Human DNA Quantitation Standard; Special Publication (NIST SP); National Institute of Standards and Technology: Gaithersburg, MD, USA, 2018. [Google Scholar] [CrossRef]
  21. Buckleton, J.S.; Bright, J.; Gittelson, S.; Moretti, T.R.; Onorato, A.J.; Bieber, F.R.; Budowle, B.; Taylor, D.A. The Probabilistic Genotyping Software STRmix: Utility and Evidence for its Validity. J. Forensic. Sci. 2019, 64, 393–405. [Google Scholar] [CrossRef] [PubMed]
  22. Simek, E.; Janssens, L. Assessment of an Automated Differential Separation Utilizing a Novel Nanofiber Filter for Sexual Assault Cases. In Proceedings of the International Symposium of Human Identification, Orlando, FL, USA, 13–16 September 2021; Available online: https://www.ishinews.com/events/assessment-of-an-automated-differential-separation-utilizing-a-novel-nanofiber-filter-for-sexual-assault-cases/ (accessed on 30 November 2023).
Figure 1. Average total male DNA and standard deviations in the sperm fractions for mixtures A–D (LAB 2 and LAB 3).
Forensicsci 03 00043 g001
Figure 2. Average total male DNA and standard deviations in the sperm fractions for mixtures E–H.
Forensicsci 03 00043 g002
Figure 3. Average total human (S) to male DNA (Y) ratios and standard deviations in the sperm fractions for mixtures E–H.
Forensicsci 03 00043 g003
Figure 4. Average percentage of male DNA recovered and standard deviations in the sperm fractions for mixtures E–H.
Forensicsci 03 00043 g004
Figure 5. Average percentage female carryover and standard deviations in the sperm fractions for mixtures E–H.
Forensicsci 03 00043 g005
Figure 6. Percentage of unshared male alleles recovered in the sperm fractions for mixtures E–H.
Forensicsci 03 00043 g006
Figure 7. Mixture H GlobalFiler™ profiles (LAB 2) for DE female only on the left side and SX full minor unshared male allele profile on the right side. Each box contains the allele number and the associated relative fluorescence units (RFU). The unshared male alleles are shown in purple boxes.
Forensicsci 03 00043 g007
Figure 8. Mixture H PowerPlex® Fusion profile (LAB 1) for DE. The single unshared male 29 allele is shown by the arrow for locus D21S11.
Forensicsci 03 00043 g008
Figure 9. Mixture H GlobalFiler™ purple channel profiles (LAB 3) for SX on the left side showing 5 unshared male alleles circled and no unshared male alleles detected for DE on the right side.
Forensicsci 03 00043 g009
Figure 10. STRmix™ male profile proportions in the sperm fractions for mixtures E–H.
Forensicsci 03 00043 g010
Figure 11. Likelihood ratios for the male profile probabilities in the sperm fractions for mixtures E–H.
Forensicsci 03 00043 g011
Table 1. Interlaboratory mixture swab sets.
Swab SetF:M RatioFemale (ng)Male (ng)
A100:1100010
B1000:125002.5
C1000:150005
D750:1750010
E600:115002.5
F1200:115001.25
G4545:115000.33
H18,182:115000.0825
Table 2. Fold difference in male percentage in the sperm fractions.
MixtureLabFold DifferenceAverage
ALAB 1Not Performed5.9
LAB 26.1
LAB 35.8
BLAB 1Not Performed9.9
LAB 210.8
LAB 38.9
CLAB 1Not Performed6.0
LAB 26.9
LAB 35.0
DLAB 1Not Performed1.5
LAB 21.6
LAB 31.4
ELAB 115.320.1
LAB 237.6
LAB 37.2
FLAB 123.022.4
LAB 230.1
LAB 314.2
GLAB 1167.8124.3
LAB 2165.3
LAB 339.9
HLAB 1878.21533.0
LAB 22787.9
LAB 3932.9
Table 3. Number of unshared male alleles detected for mixtures G and H.
MixtureLabSXDE
GLAB 13017
LAB 2141
LAB 3305
HLAB 1181
LAB 2320
LAB 3185
Disclaimer/Publisher’s Note: The statements, opinions and data contained in all publications are solely those of the individual author(s) and contributor(s) and not of MDPI and/or the editor(s). MDPI and/or the editor(s) disclaim responsibility for any injury to people or property resulting from any ideas, methods, instructions or products referred to in the content.

