Article

Wet Bone Characteristics Persist in Buried Bone after 10 Weeks: Implications for Forensic Anthropology

by
Anna Katharina Maier
1,
Alessia Manzella
1,
Andrea Bonicelli
2,
Emily L. Arnold
1,
Nicholas Márquez-Grant
1,* and
Peter Zioupos
3
1
Cranfield Forensic Institute, Cranfield University, Cranfield, London MK43 0AL, UK
2
School of Natural Sciences, University of Central Lancashire, Preston PR1 2HE, UK
3
Biomedical Engineering, School of Engineering, University of Hull, Hull HU6 7RX, UK
*
Author to whom correspondence should be addressed.
Forensic Sci. 2023, 3(3), 491-505; https://doi.org/10.3390/forensicsci3030034
Submission received: 23 July 2023 / Revised: 20 August 2023 / Accepted: 21 August 2023 / Published: 26 August 2023

Abstract

:
Assessing the timing of skeletal trauma significantly impacts the reconstruction of events surrounding death and deposition in forensic cases. However, there are no absolute time frames in which the characteristics of wet bone (peri-mortem) fractures transition to dry (post-mortem) fractures. The aim of this study was to attempt to identify a point within the post-mortem interval in which the characteristics of bone change from wet to dry bone properties. A total of 32 deer ribs were placed in a laboratory burial environment and a set of three were fractured with blunt force trauma every week during a ten-week period. All samples and the inflicted trauma effects were documented and analysed by macroscopic observation, scanning electron microscope (SEM) analysis, thermal analysis, biomechanical analysis, and attenuated total reflectance–Fourier transform infrared spectroscopy (ATR-FTIR). No significant difference was found in the macroscopic, microscopic, thermal, and biomechanical analyses of the trauma inflicted over the 10-week period. A significant difference was only found in the carbonate-to-phosphate ratio in analytical chemistry. The results suggest that interpreting wet bone characteristics in forensic anthropology as having been inflicted during the peri-mortem period (around the time of death) should also consider that these, in fact, could be inflicted well after death (post-mortem) as wet bone properties as this study has shown persist at least 10 weeks after death in a burial environment.

1. Introduction

The timing of skeletal trauma greatly impacts the reconstruction of events leading up to death and deposition and assists the forensic pathologist and coroner in the determination of the cause and manner of death. Recognising peri-mortem trauma [1,2] in particular, relies on assessing fracture characteristics of wet or fresh bone compared to dry bone (post-mortem) fractures. However, there is no absolute timeframe in which wet bone transforms to dry bone which results in different fracture characteristics [3,4]. A better understanding of the changes in the post-mortem interval will greatly enhance the interpretation of trauma in human skeletal remains.
This paper aims to identify a point, if possible, in which the characteristics of bone change from wet to dry bone properties within the first ten weeks after death. In order to address this aim, the following questions were addressed:
  • How long within a 10-week period does bone maintain its wet properties and its composition after death?
  • How does fracture morphology change macroscopically and microscopically in the first ten weeks?

2. Materials and Methods

2.1. Materials

A total of 32 ribs from four different rib cages of mature fallow (Damad ama) and roe (Capreolus capreolus) deer were used. All ribs were fresh and obtained within 24 h from death. Deer ribs were chosen for this research as they are deemed appropriate following the current literature due to the composition and lack of plexiform bone [5,6,7]. The study received institutional ethical approval from Cranfield University (CURES/12923/2021). The samples were randomized using the Excel code RANDBETWEEN and MATCH(LARGE) for weeks 1–9. A 10-week period was chosen as a pilot study due to the time and funding constraints of this project, but it also allowed for close and weekly monitoring of the samples. If wet bone properties were still observable at week 10, suggestions to extend the experiment were made as future recommendations. The samples for weeks 0 and 10 were chosen to be the same rib pairs within one rib cage for a direct comparison. The ribs were placed into 10-litre-volume boxes with Wickes® Multi-purpose Topsoil (pH 5.5–6.0) available online: https://www.wickes.co.uk/Wickes-Multi-Purpose-Top-Soil---25L/p/200247 (accessed on 4 May 2021)) around them. An additional set of 32 ribs (set-2) ran parallel to this study where ribs were left exposed on the surface [8]. These are taken into account for comparative purposes as the data are presented elsewhere [8]. Two ribs served as control and were not conditioned at all. In total, ten boxes were used, each containing a total of three buried ribs. The boxes were stored in a room at Cranfield University, UK. The room permitted some air to enter from the outside through a metal mesh door and was not heated or ventilated by any other means. Mosquito nets were added over the samples in week 2. Due to unforeseen circumstances, the samples were moved to a different room for one week (8 June 2021 to 15 June 2021) with no air influx and a large window. For ten weeks, three buried ribs were removed from the room weekly and stored in the freezer until the fracturing experiment. Between the time of receiving the samples, sample preparation, sample conditioning, and sample transfer between the conditioning site and the fracturing site, the samples were stored in a freezer at −20 °C [9,10]. Previous studies have shown that storage by freezing has only a small impact on bone properties [9].

2.2. Fracture Reproduction

Prior to inflicting trauma to the ribs, they were thawed and defleshed using a steel scourer and scalpel; and they were later wrapped in cling film to avoid losing any fragments that may occur during the fracturing process. The ribs were fractured simulating blunt force trauma. This was conducted in a 3-point bending rig using a DARTEC Series HC25 hydraulic material testing machine with a 25 kN load cell (Sensotec®, Honeywell, Co-lumbus, OH, USA). The samples were set up on two support beams (diameter 20 mm) which were 11 cm apart.
Loading was applied to each rib at a maximum deflection speed of 200 mm/s. The impacting piston was set up to move to a maximum deflection of 40 mm within a fifth of a second. The piston drove downwards, bending and breaking the sample and then retracted to the zero (the starting) position. The breaking itself occurred within 40 ms. This is of the order of magnitude and time frame thought to be equal to violent events such as when hitting and fracturing ribs in a criminal case; only car crashes are slightly faster with a loading phase that lasts about 25 ms [11,12].
The ribs were laid onto the machine to be hit on their lateral side. The load and deflection were monitored and recorded by the machine’s own Dartec® controller software (TOOLKIT 96, V4.09), and the data were captured at 20 kHz.

2.3. Analytical Methods

The ribs were analysed at macroscopic, microscopic, chemical, thermal, and biomechanical levels. The fractured ribs were photographed by a Nikon D3500. Additionally, the samples were recorded by digital radiographic imaging to identify and record trauma prior to examination. A Canon CXDI-410C Wireless Digital Radiography Detector, a Poskom 2.5 kW battery-powered X-ray generator, and CXDI Control Software NE were used to acquire the images. The ribs were all imaged at the same exposure factors of 1.6 mAs and 50 kV at an anode detector distance of 100 cm. The images were obtained at a relative exposure value (REX) of 700–900, and the window level and width were manually adjusted for each image. Using an ARGOFILE micro-motor hand drill with a diamond cutting wheel (22 mm OD with 3.175 mm mandrel) and spherical burr (Carbide 3.0 × 3.0 × 44 mm) piece, the bones were cut into two segments used for analysis in addition to a powder sample. The first segment was cut at about 1 cm above the fracture site, on only one side of the bone for the complete fractures and both sides of the bone for the incomplete fractures. A second 1 cm fragment was cut off the bone from the same rib half.

2.3.1. Macroscopic Analysis

Macroscopic analysis was documented following the traits from the current literature [3,4,13,14,15,16,17]:
  • Fracture type, which is differentiated between incomplete and complete fractures in addition to transverse, depressed, oblique, spiral, butterfly, comminuted, greenstick, and buckling fractures [3,15,17];
  • The fracture outline, also referred to as the shape of broken ends, was differentiated between jagged, intermediate, transverse, and curved [4,14,18];
  • Fracture angle, relating to the angle of the cortical bone surface to the fracture surface, which was categorized into right-angled, acute/sharp angle, and mixed [4,14];
  • The fractured edge/surface morphology, describing the texture of the surface of the fracture, can be described as rough with a bevelled or irregular surface or smooth [4,14];
  • Fracture lines were described as fractures radiating from the impact site [14,16];
  • The terms flaking or peeling were employed to describe the detachment of a bone layer, usually the cortex, on one side of the rib while the other side stays adjacent to the bone [13,16];
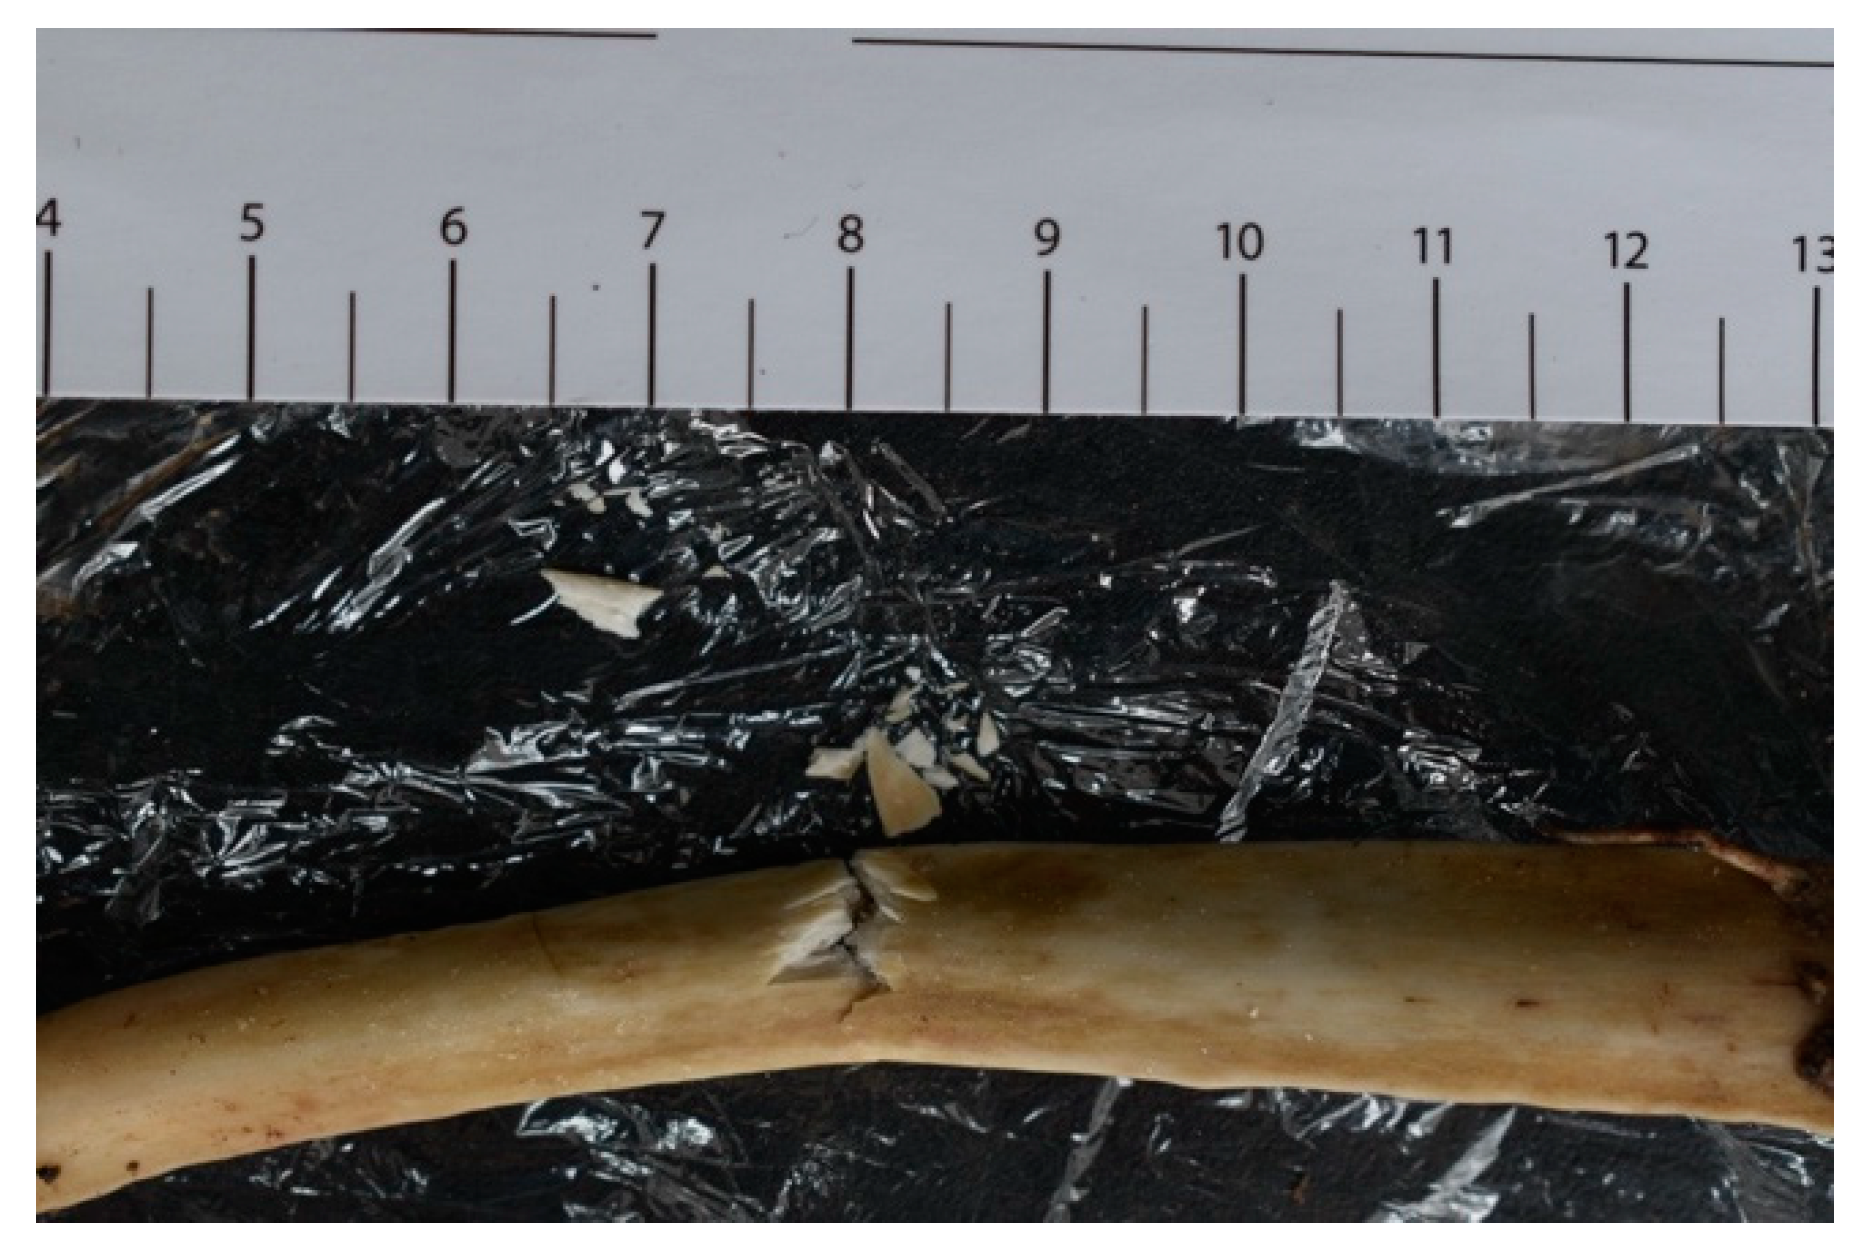
  • The term splintering was used in this study to describe small layers of bone detaching fully or partially in a different manner than peeling or flaking (Figure 1).

2.3.2. Biomechanical Analysis

A load-deflection graph was created by Data Manager 96 while fracturing the samples. The maximum deflection (mm) and maximum load (kN) were determined from the corresponding graphs. Following from this, the data were normalized, considering the exact dimensions of the samples (in mm). To normalize the samples, the deflection strain was proportional to 1/(b × a3), and the stress was proportional to 1/(b × a2), where “a” is the thickness and “b” is the width of each rib. Using the deflection and stress values, the cross-sectional area was calculated using Π × a × b/4. Next, the normalized load was calculated by multiplying the initial load by the stress divided by the average stress. The normalized energy was calculated by multiplying the original value by the average cross-sectional area divided by the cross-sectional area. The normalized values were the ones further used for statistical analysis.

2.3.3. Microscopic Analysis

The microscopic analysis was performed on a TESCAN VEGA 3 scanning electron microscope (SEM) using a backscattered electron detector in Univac low vacuum mode. The software used was Oxford Instruments Aztec, and each sample was examined in a wide-view mode for an overview and a depth mode for close-ups. Each sample was prepared by soaking it in Isopropyl Alcohol Cleaner for two minutes and leaving it to dry. Next, an eco-superior duster was used for dusting off the samples. Afterwards, the samples were mounted on an aluminium pin stub with carbon tabs, both by Agar Scientific Ltd. From the three samples retrieved each week, one was chosen and examined.
The following four features which are commonly represented in the literature were assessed for presence or absence [19,20]:
  • Collagen fibre pull-outs in areas of delamination at the convex side of the bone;
  • Grooving on the fractured edge/surface on a microscopic level;
  • Periosteal tearing, due to grooving or string-like appearances of the periosteal surface;
  • Subsurface microcracks along the surface of the fracture.

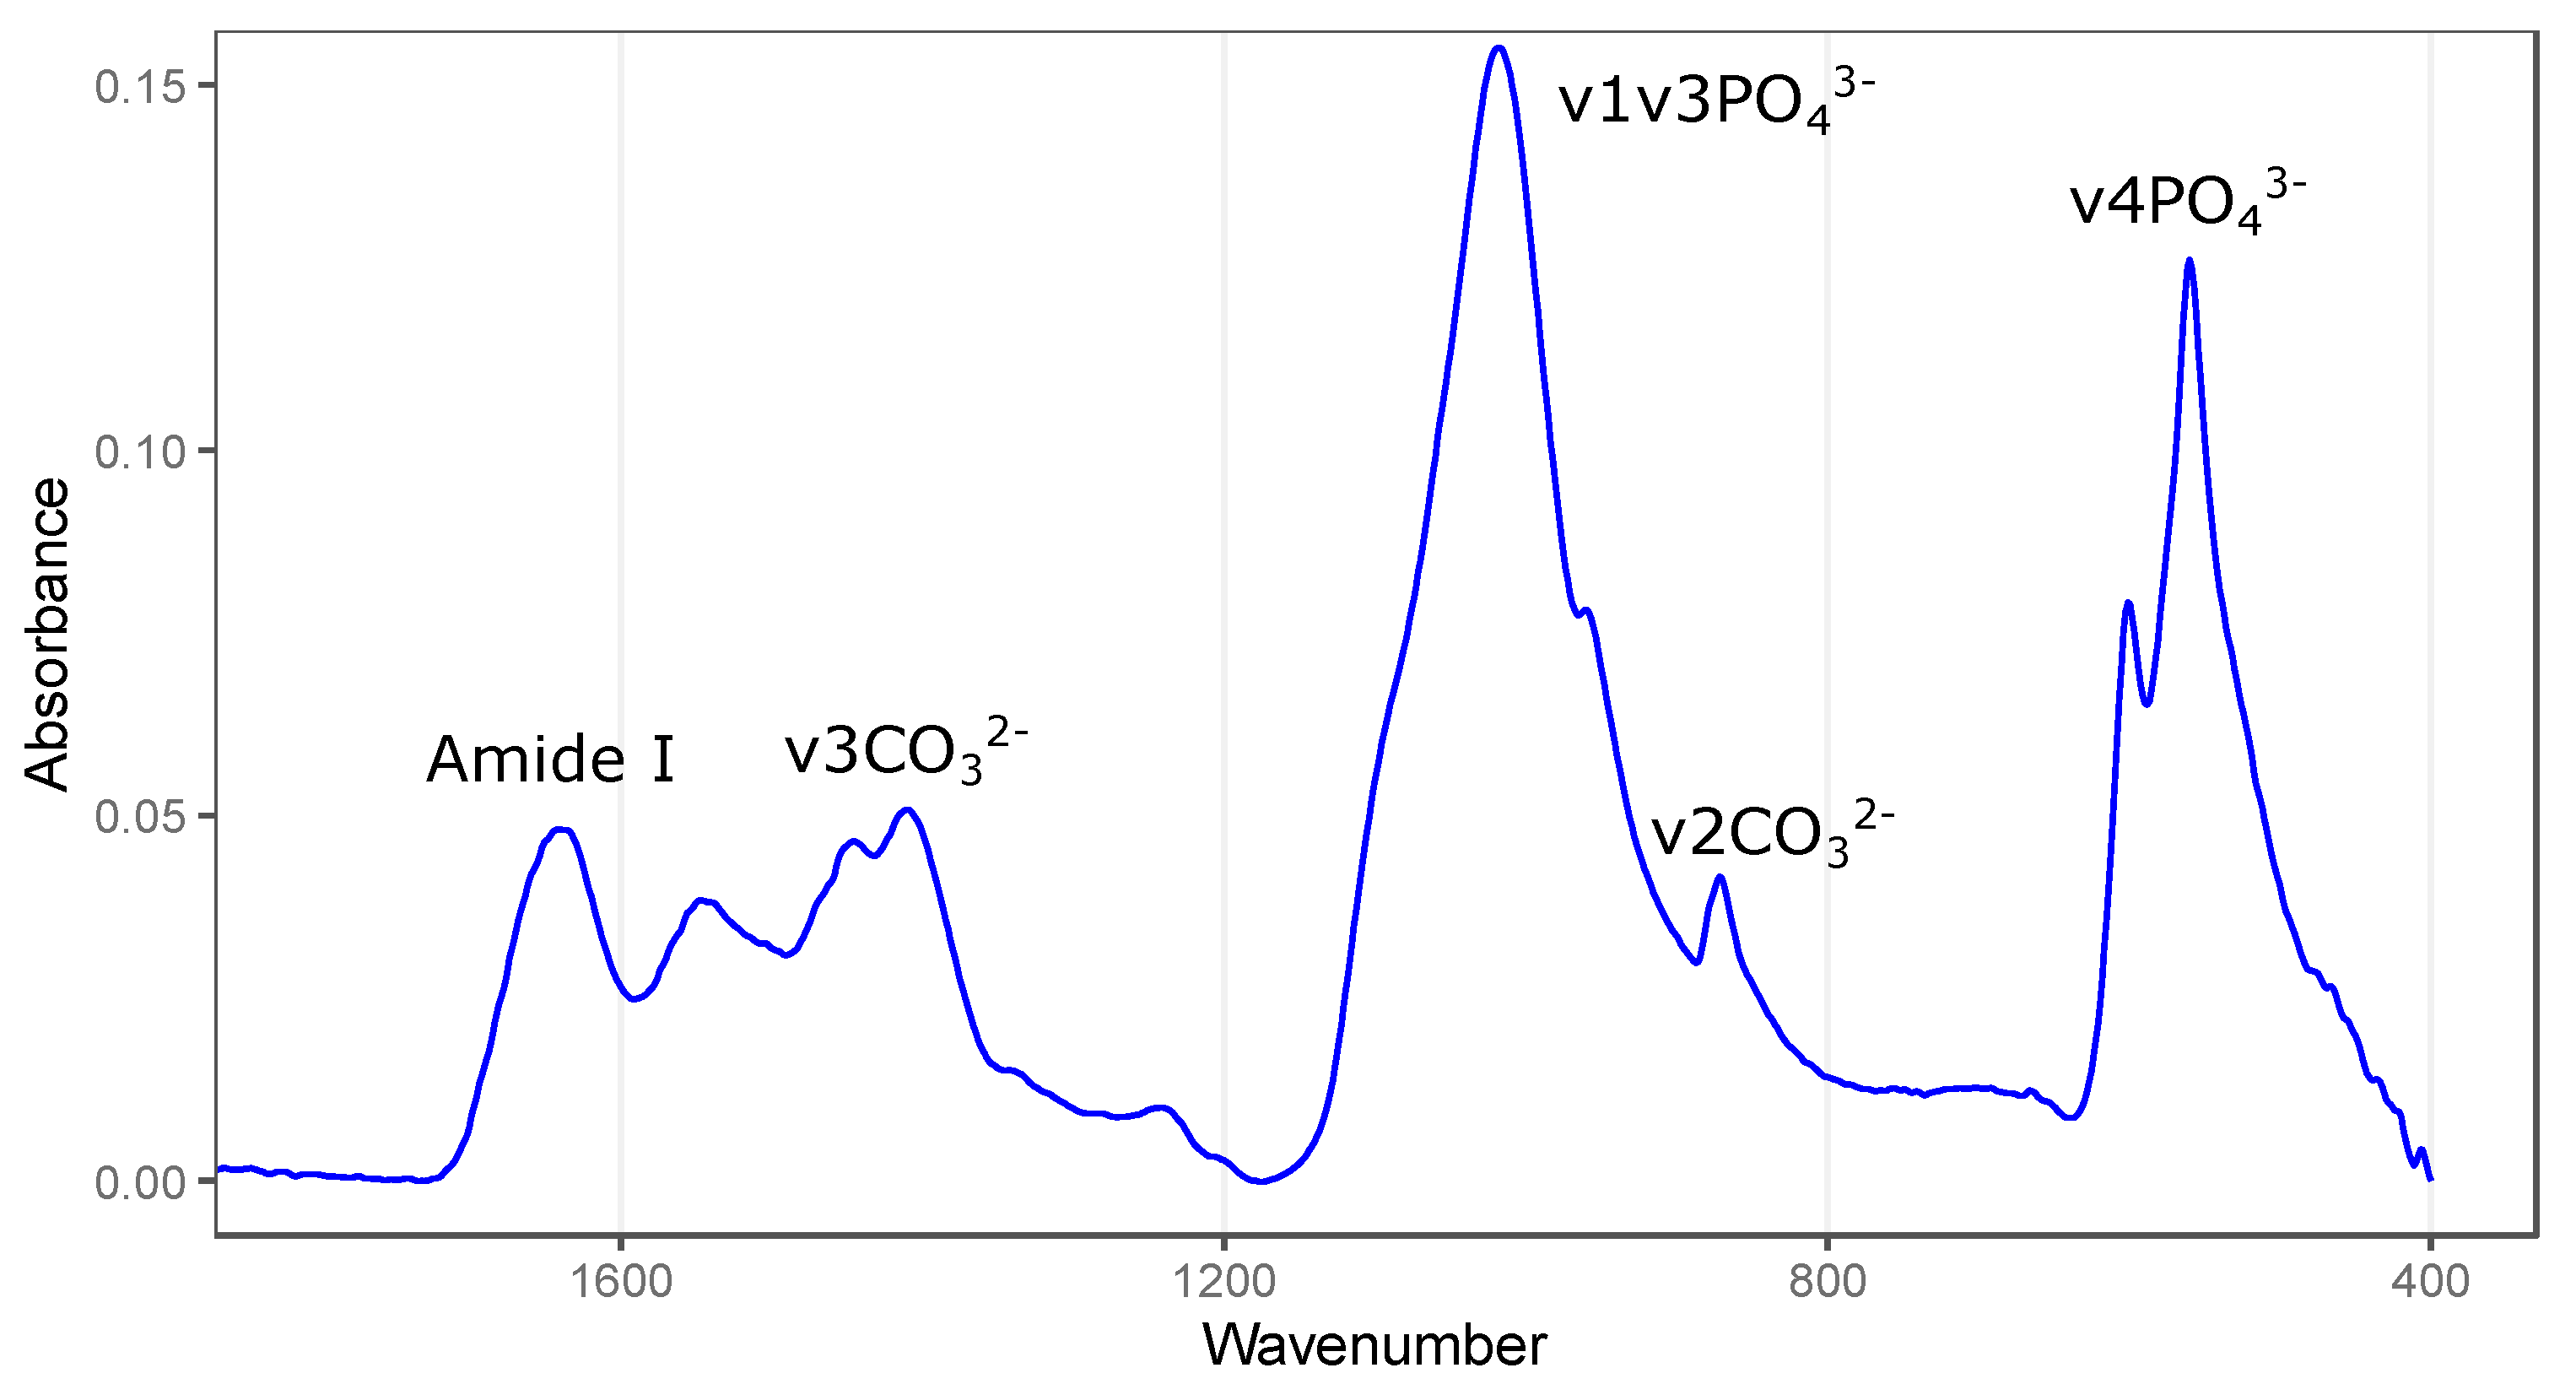
2.3.4. Fourier Transform Infrared Spectroscopy (FTIR)

FTIR can offer valuable insight into the quality of the structure, strength, and physicochemical properties of bone [15,21,22]. FTIR was performed on a Bruker® Alpha II Platinum in attenuated reflectance mode (ATR). The spectral data were assembled using the integrated OPUS software and processed using the Spectragryph® version 1.2.15 open-source software. Bone powder retrieved from each rib was analysed in triplicate. The ATR-FTIR was calibrated, and a performance qualification test was run before scanning the samples. The resolution was set to 4.0, and 25 background scans were completed at a resolution of 4 cm−1. Following current research, sample scans were performed per sample [23]. The mineral-to-matrix ratio, crystallinity content, and carbon-to-phosphate ratio were examined and calculated from the spectra [21,23,24,25].
To calculate these parameters, the intensity and peak values of ν1ν3 phosphate, ν2 carbonate, Amide I band, and phosphate were identified with individual baselines. The peaks were located at the following wavelengths: ν1ν3 Phosphate is located at 1200–9004 cm−1, AmideI1 at 1750–16,004 cm−1, ν2 Carbon at 890–8504 cm−1, and ν4 Phosphate at 650 cm−1, 565 cm−1, and 595 cm−1 (Figure 2) [23].
The following calculations (Table 1) were used to retrieve the parameters from the variables. Area integrations were calculated according to the above-mentioned parameters with the exception of the crystallinity index, for which peak height was calculated from the baseline.

2.3.5. Thermal Analysis

To identify the change in the physical properties of the samples, thermal analysis was conducted. When bone is heated, weight loss occurs in three stages: below 200 °C, 200 °C–600 °C, and between 700 °C and 900 °C [26,27,28,29]. The first weight loss is commonly attributed to the complete dehydration of the sample. The weight loss between 200 °C and 600 °C represents collagen denaturation and combustion and is followed by complete ashing of the bone powder. The final weight represents the percentage of mineral content in the tissue matrix [29,30]. This analysis was conducted by weighing each of the ~1 cm rib segments at a semi-wet weight after being thawed. Afterwards, the samples were placed in the desiccator (Gallenkamp Hotbox Oven) for four days at 37 °C and weighed again. Next, the samples were placed in small ceramic pots and placed in a Carbolite CWF 1100 furnace at 200 °C for 10 min and weighed and then at 600 °C for one hour, after which the ash weight was taken. The changes in the weight were calculated as percentages due to the variation in the volume of the samples. The data were further analysed for the stages of dehydration, organic combustion, and loss of mineral content [23].
Automated thermal analysis was conducted using a TGA/DSC 3+ instrument (Mettler Toledo, Indium calibrated) employing a two-phase procedure. The first phase involved a dynamic temperature ramp from 25 to 550 °C at a rate of 10 °C/min. Subsequently, the second phase consisted of maintaining a static temperature of 550 °C for 10 min to ensure complete elimination of the organic components and conversion of the bone into ashes. To regulate the chamber temperature, a continuous flow of room temperature water was utilised. The bone powder, weighing approximately 10 mg, was placed in 40 µL aluminium pans with flat bases. The weight measurements were recorded using a microbalance (Sartorius Genius ME235), with an empty crucible serving as the reference. STARe version 16.00 software was employed for analysing the obtained curves. The thermogravimetric curves (TGA) were segmented into three temperature ranges, and the step horizontal method was employed to determine the percentage weight loss. The dehydration of the sample was calculated between approximately 25 and 200 °C, while the organic weight loss was determined between approximately 200 and 550 °C. Enthalpy values were determined using linear integration on the differential scanning calorimeter curves, utilizing the identical temperature ranges. The initial endothermic occurrence signifies the energy needed for bone dehydration and the disruption of hydrogen bonds, whereas the subsequent exothermic event indicates organic combustion.

2.3.6. Statistical Analysis
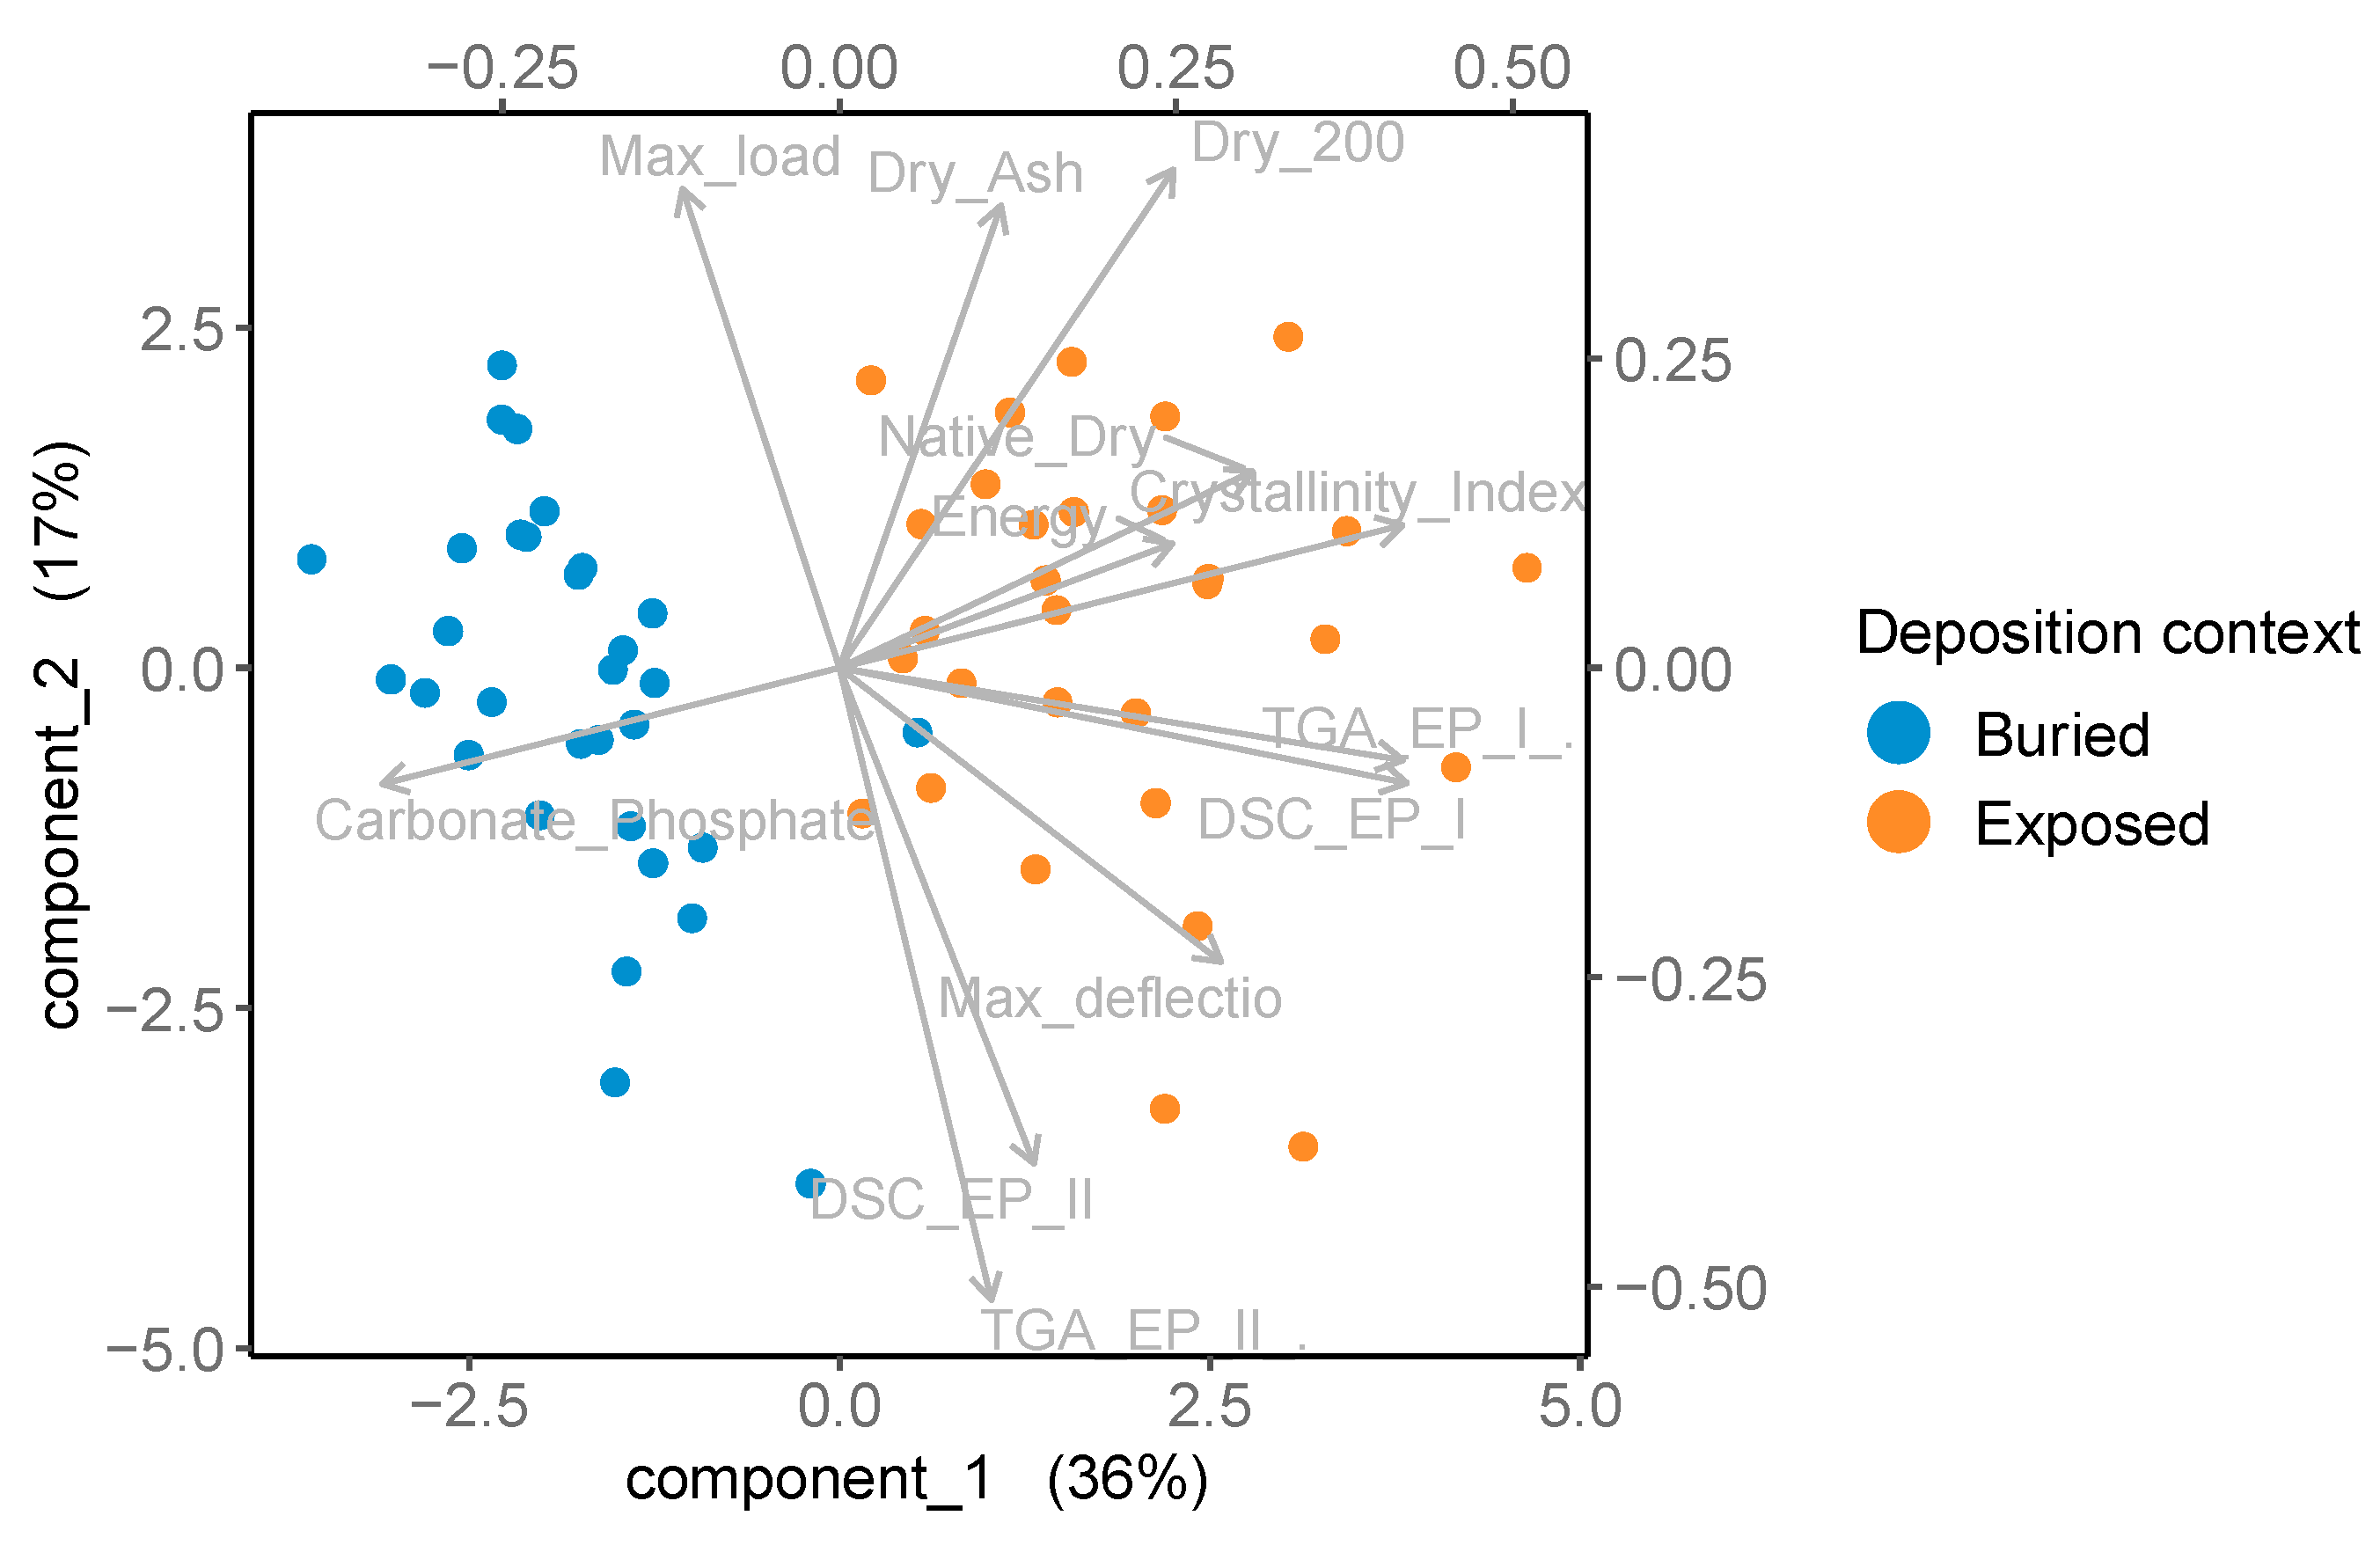
Statistical analysis was performed through the software R(Version 4.1.0), RStudio (Version 2022.12.0+353), and Microsoft Excel (Version 16). For each of the parameters, descriptive statistics were carried out. For all techniques performed in replicates’ data, the values were averaged. Principal Component Analysis (PCA) was employed to evaluate differences between surface vs. buried samples. Further univariate analysis was performed via Kruskal–Wallis and Dunn’s post hoc test, and the p-value was adjusted with false discovery rate correction.

3. Results

3.1. Deposition Environment
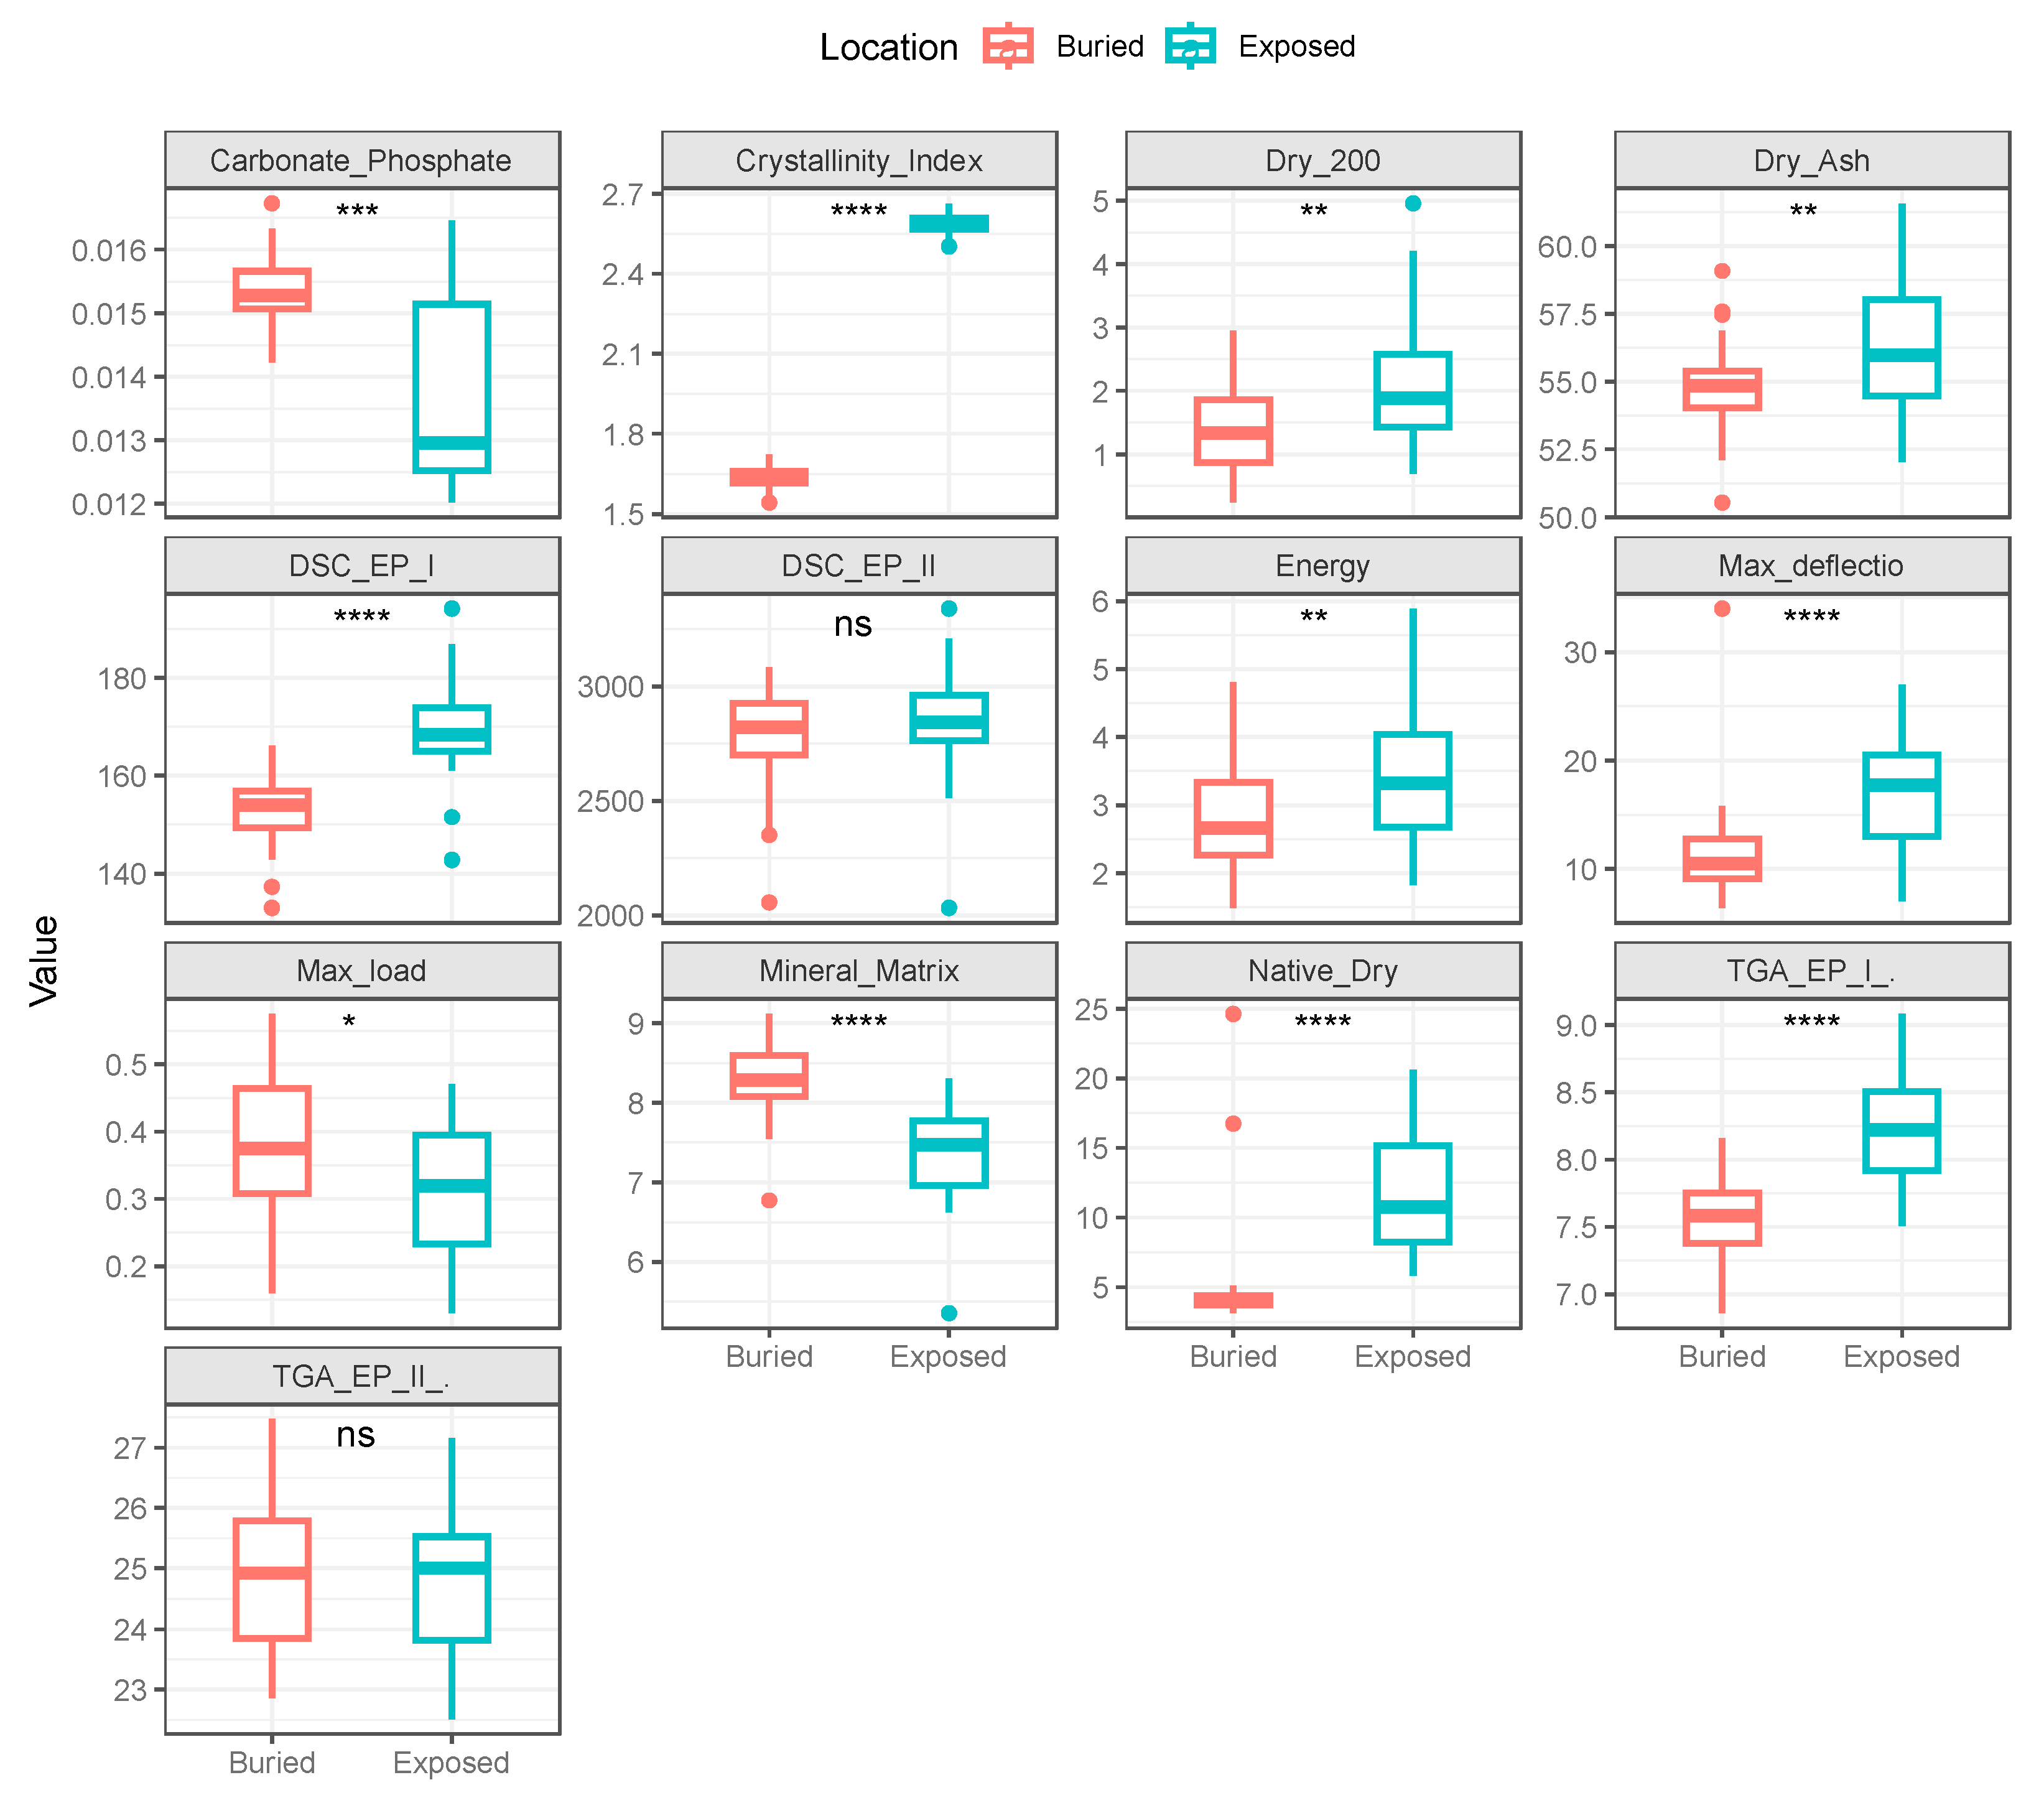
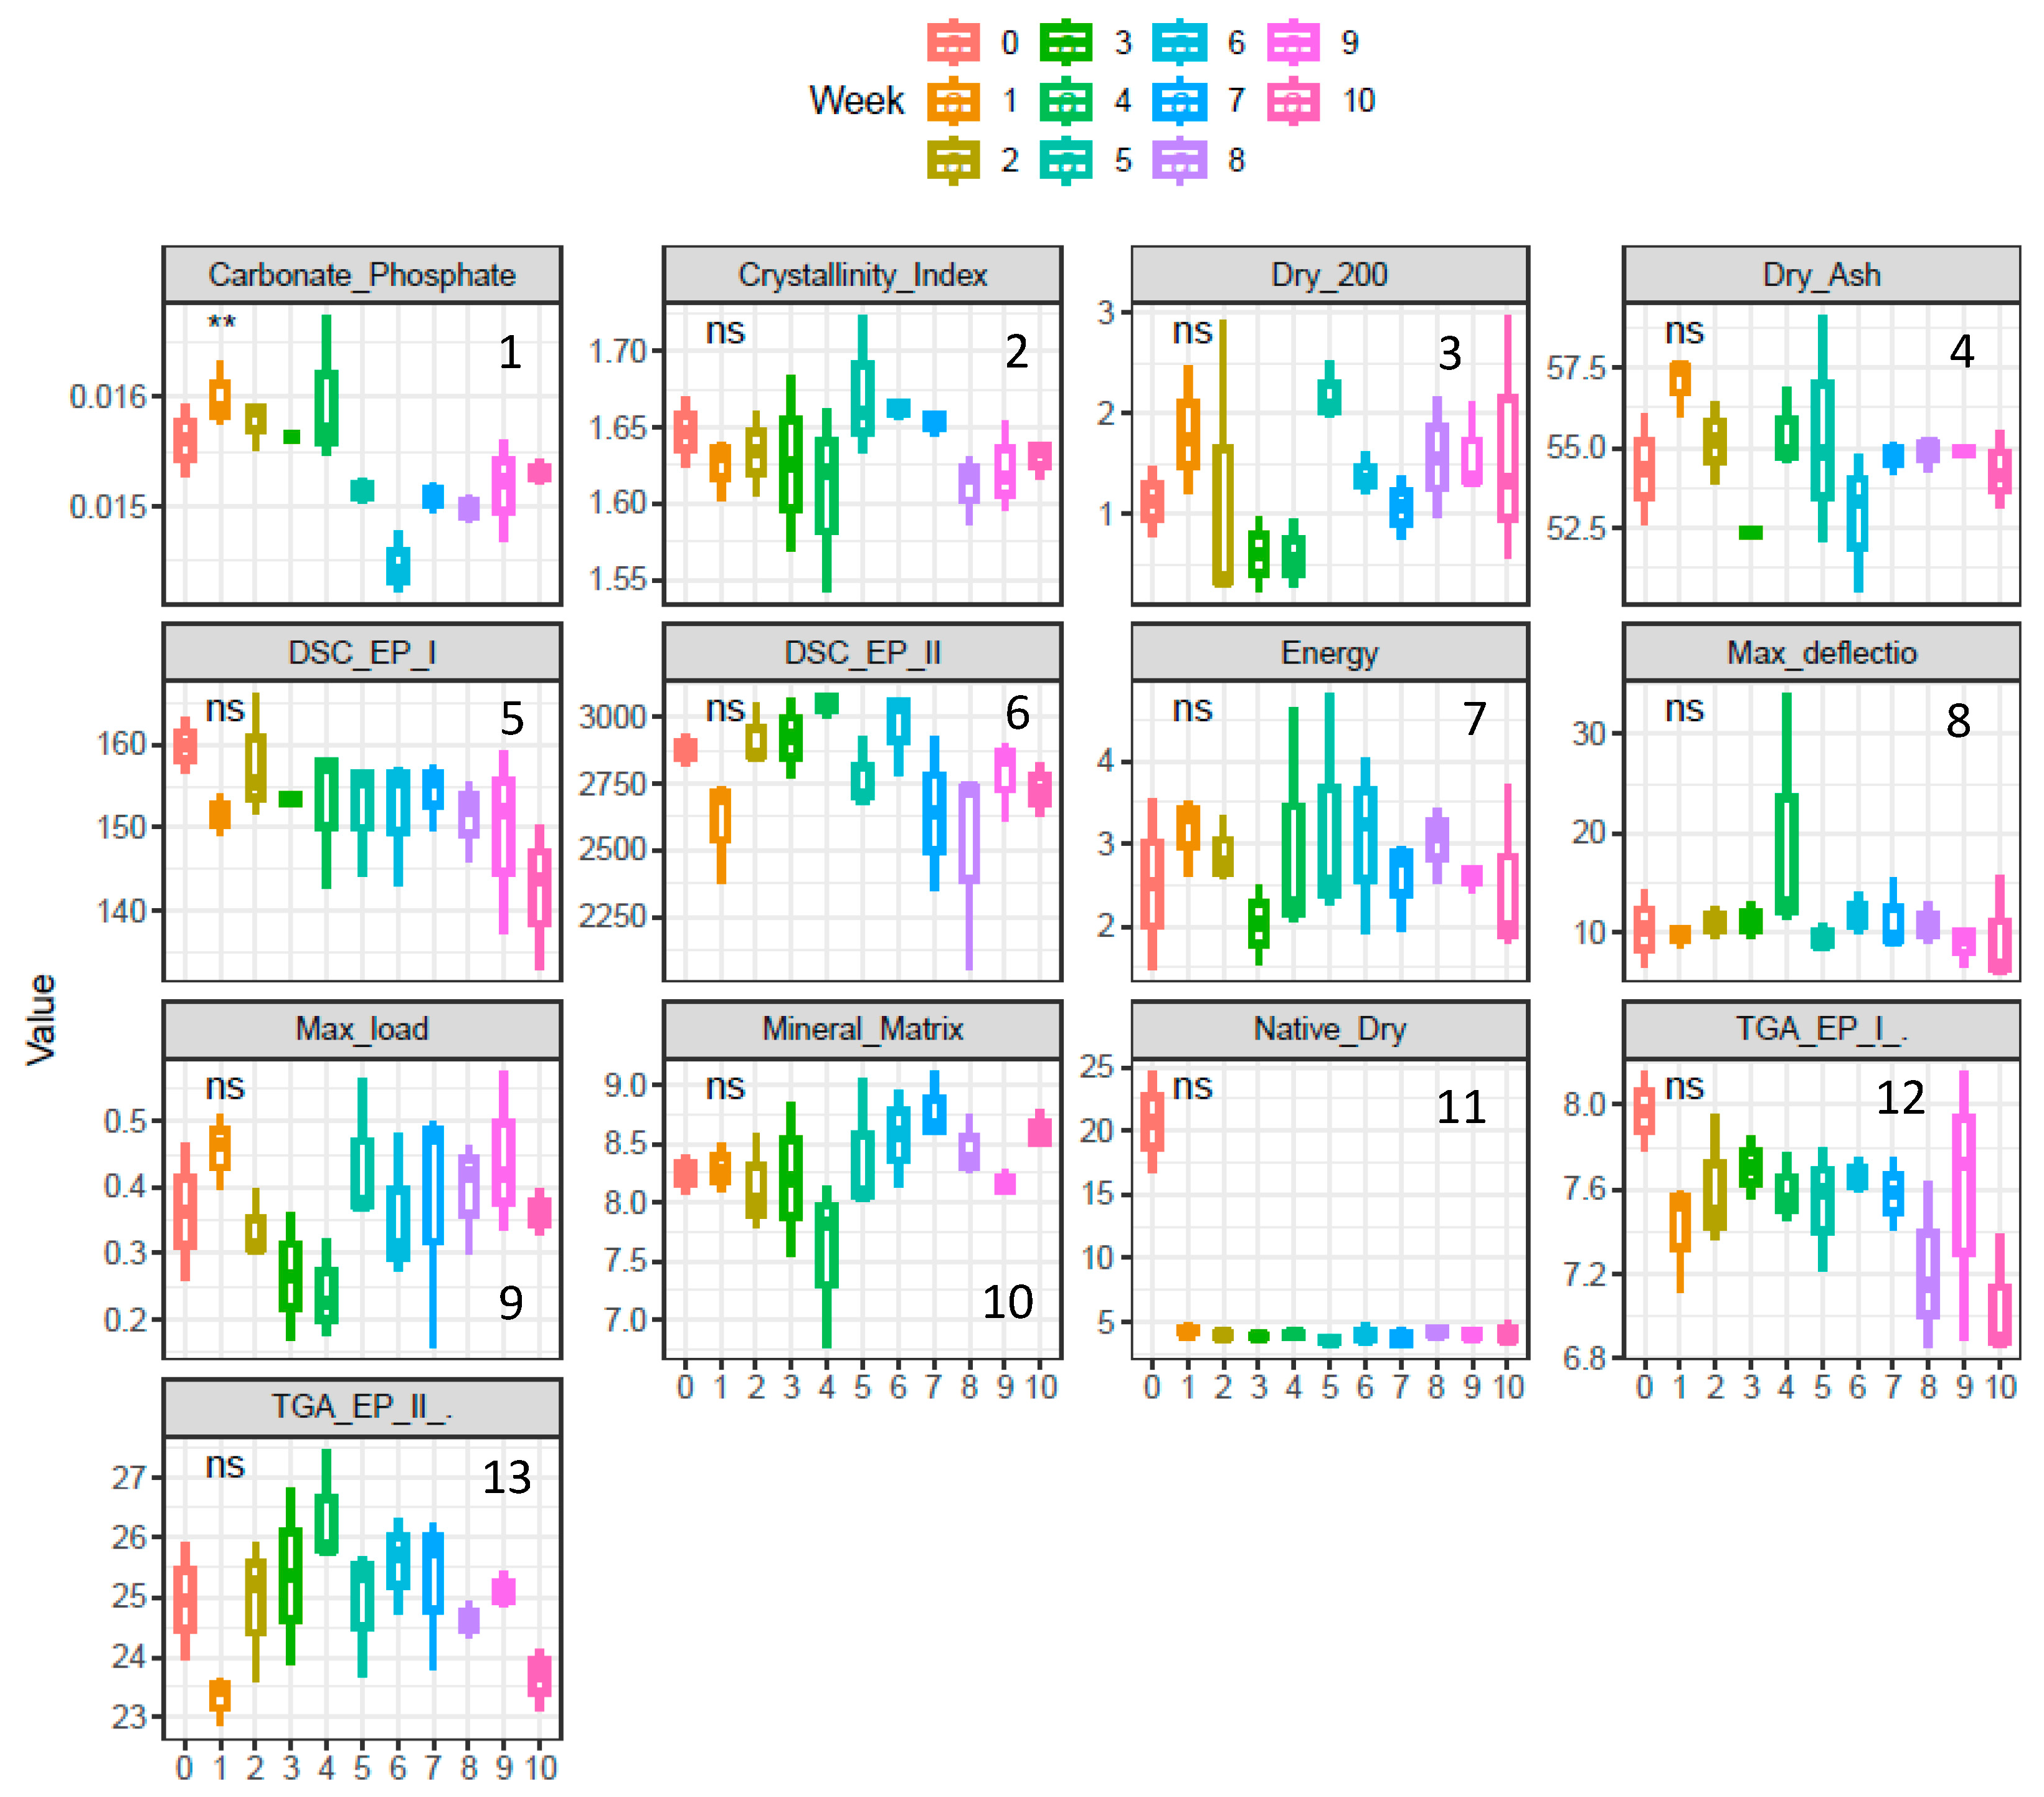
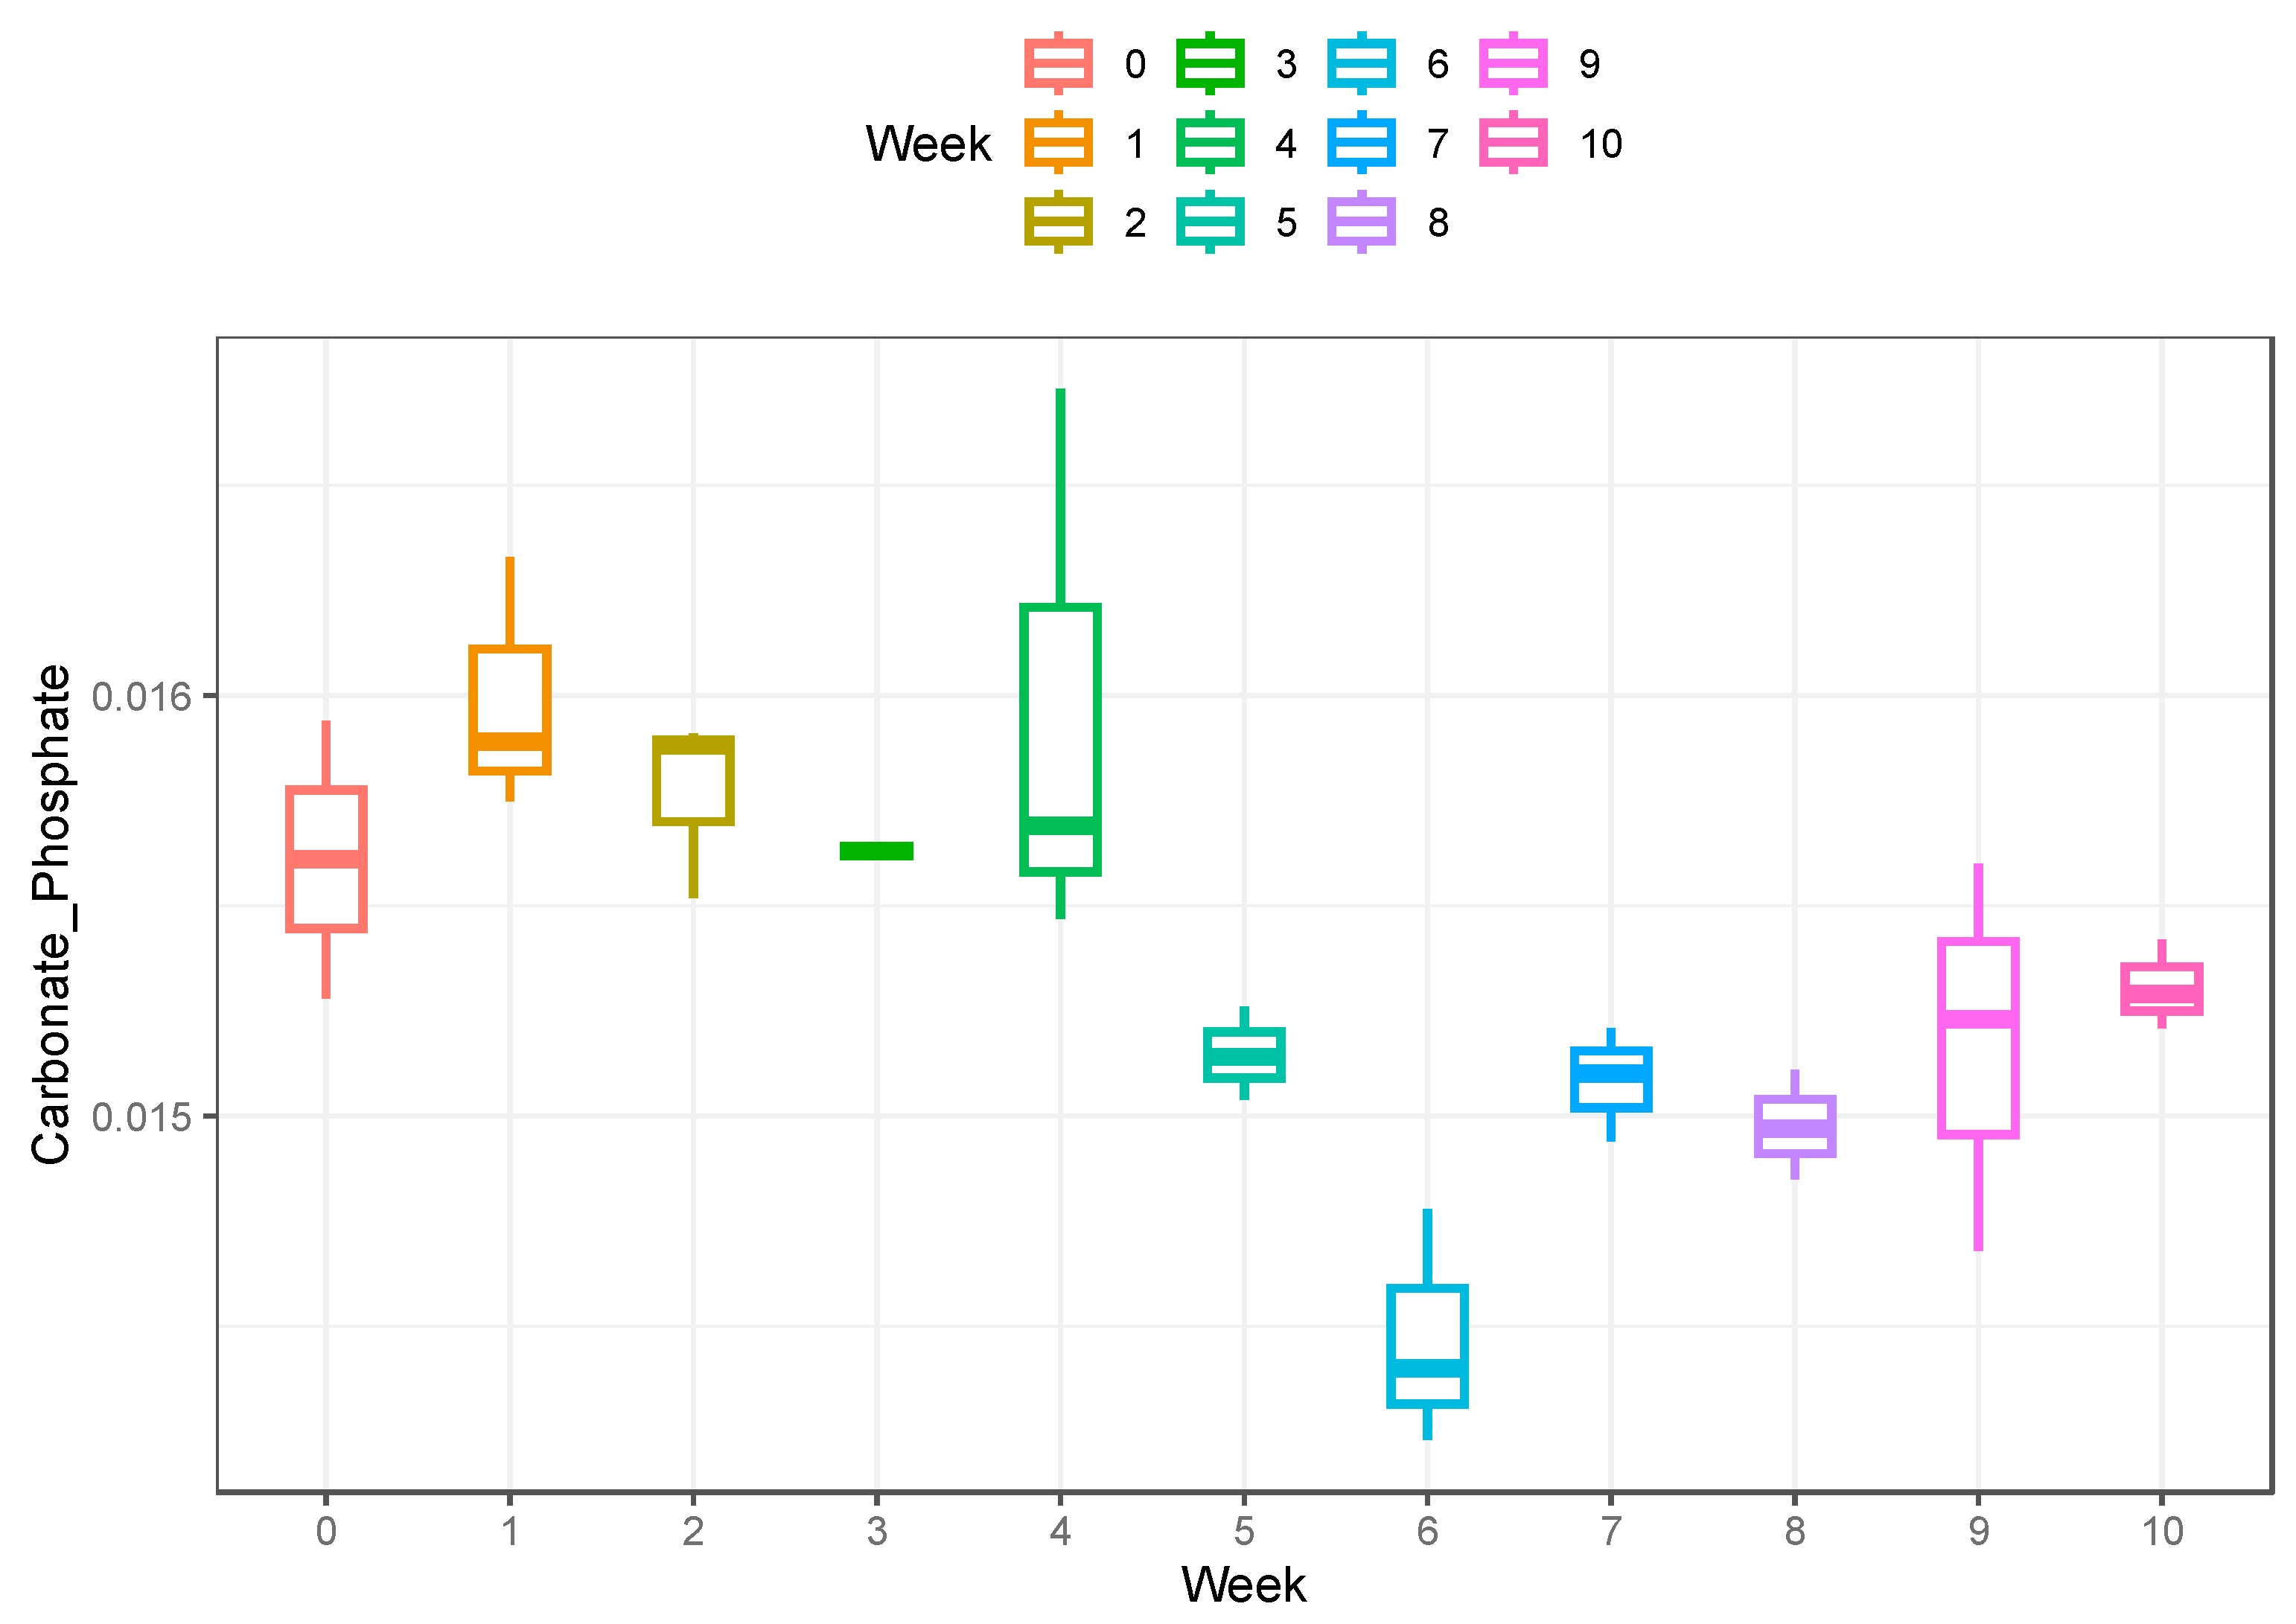
PCA revealed a distinct segregation between samples from buried and data [8] from a surface (exposed) depositional environment (Figure 3). This differentiation is evident through the contribution of component 1 (PC1), which accounts for 36% of the total variance (54%). By examining the biplot depicted in Figure 3, it becomes apparent that variables associated with bone dehydration exert a significant influence on PC1 and exhibit a negative correlation with the exposed (surface) group. On the other hand, the buried group displays distinctive characteristics related to the carbonate-to-phosphate ratio.
Upon conducting univariate analysis, it is noteworthy that the only two variables lacking statistical significance were those pertaining to organic combustion in thermal analysis. Notably, the exposed group demonstrates a significantly lower carbonate-to-phosphate ratio (p < 0.001), while the crystallinity index follows an inverse trend. Furthermore, the mineral-to-matrix ratio is also significantly lower in the exposed group. Both DSC and TGA analyses indicate a higher water weight loss in the exposed group. Mechanical analysis shows only maximum load to be lower in the exposed (surface) sample. Results are reported in Figure 4 and in Supplementary Table S1.

3.2. Buried Sample

This result section focuses mainly on the buried sample group. A complementary set of data (set 2) has been presented elsewhere [8]; and for informative purposes alone, a short comparison of the two sample groups is presented in Figure 4 and discussed later.

3.2.1. Macroscopic Analysis

A total of 72% (n = 23) of the rib fractures were classified as incomplete (Figure 1), in addition to 6% which presented complete oblique fractures (n = 2) and 22% complete transverse fractures (n = 7). The first oblique fracture was observed in week six. None of the samples presented butterfly fractures.
A transverse fracture outline was the most represented in 56% of the samples, followed by jagged fracture outlines in 25% and intermediate outlines in 19% of the samples. The fracture angle was only recorded for the complete fractures. Six mixed and three sharp fracture angles were recorded. With regards to fracture edge/surface morphology, 50% of the samples were classified as having smooth surfaces and 50% as rough surfaces. Week five presented solely rough fractures, while the control presented solely smooth surfaces.
Radiating fracture lines were observed in 75% of the fractures. Weeks five, seven, and ten had the lowest frequency of fracture lines, with just one out of three ribs presenting radiating fractures. Plastic deformation was found in 69% of the samples. In weeks one, four, seven, and ten, 100% of the samples presented with plastic deformation. No plastic deformation was observed in week six. Splintering was observed in 37% of the fractures, but no splintering was observed in the week four samples. No weeks were observed with 100% splintering. Flaking was observed in 31% of the samples, but flaking was absent in the control samples and in the week five samples. The highest frequency was observed in week one, with two out of three samples showing flaking. A total of 41% of the samples showed evidence of folding. Week one and six showed no folds, while in week four, 100% of the samples showed folding.

3.2.2. Biomechanical Analysis

The highest maximum load was 0.525 kN in week one, and the lowest maximum load was 0.131 kN also in week one; the largest maximum deflection was 26.5 mm in week nine, and the smallest was 7 mm in week eight. None of the variables show significance in the change. However, it is possible to notice that there is an increase in all variables at approximately five weeks, followed by a decrease.

3.2.3. Microscopic Analysis

Following the literature [19,20], the samples were expected to show evidence of collagen fibre pullout, micro-cracks along the surface of the fracture, periosteal tearing, and grooving of the fracture surface. However, these traits were not observed in the images retrieved from the samples. Nonetheless, osteons and fracture lines were observed. Microscopic fracture lines were found in all weeks except for week six. Osteons were observed in images of weeks four, six and nine. In some samples, the examination was not possible due to excess organic tissue within the sample.

3.2.4. Biophysical Characterisation

ATR-FTIR provided three parameters: the carbonate-to-phosphate ratio, crystallinity, and mineral-to-matrix ratio shown in Figure 5, plots 1, 2, and 10. These show no clear trends with PMI time. The carbonate-to-phosphate ratio declines gradually for the first 6–7 weeks and then it stays around a value of 0.015. The crystallinity index stays in the range 1.60 to 1.65 throughout the 10 weeks with no trend upwards or downwards. The mineral-to-matrix ratio increases ever so slightly from a ratio of 8.0 to 8.5 over this same PMI period.
The bone samples were evidently ‘wet’ (20% water percentage for a normal fresh hydrated bone) and then dried out to a loosely bound water content of less the 5% in the buried state (Figure 5, plot 11). The thermal analysis showed that the two parameters DSC_EP_I and TGA_EP_I declined gradually (but with scatter) over the 10 weeks. Meanwhile, the exothermic parameters DSC_EP_II and TGA_EP_II showed a random scatter for the first 6 weeks and then declined slightly. It is possible that after week seven some structural frame decomposition processes may start to significantly change the matrix composition and mechanics of the bone. Ashing of the sample in the furnace did not give any consistent result with decomposition time (Figure 5, plot 4).

4. Discussion

Combining all the analytical results, at no point in time during the ten weeks could a significant and/or consistent change be observed. Variations could be observed macroscopically and microscopically; however, these did not correlate systematically or consistently with the post-mortem interval of the samples. Furthermore, the composition of the bones did not change significantly throughout the 10-week period. This has implications for interpreting the timing of wet bone fractures in forensic anthropology.

4.1. Macroscopic Analysis

The results suggested that no features or traits reveal a clear pattern over time. Incomplete greenstick fractures were the most frequent type of fracture observed throughout the ten weeks. Because greenstick fractures are an indicator of wet bone and usually interpreted as perimortem trauma [16], this suggested that the samples remained in a relatively wet state for the first ten weeks after death. However, some complete fractures with dry bone characteristics were recorded, indicating that post-mortem characteristic traits could also be observed within the first ten weeks. Within the skeletal analysis in forensic anthropology, these results show that wet bone fractures interpreted as perimortem trauma can occur weeks after death.
Likewise, the fracture outlines presented both post- and peri-mortem traits. Jagged outlines, which appeared in 25% of the samples, are characteristic of peri-mortem trauma, while the transverse fracture, in 56% of the samples, can also be characteristic of post-mortem fractures [14]. Due to most of the fractures being incomplete, the fracture angle could only be examined in 28% (n = 9) of the cases. These presented both sharp and mixed-angled fractures but no right-angled fractures. Based on these results, one could conclude that in the first ten weeks after death, bones show no post-mortem characteristics [4,14].
Moreover, the fracture surface showed both smooth and rough morphologies at an even prevalence. As smooth surfaces are more common in peri-mortem fractures and rough surfaces are more common in post-mortem fractures [4,31], it is possible to conclude that the samples represent both peri- and post-mortem characteristics equally.
Furthermore, radiating fracture lines, which are more commonly found in perimortem fractures [14,16], were observed in 75% of the ribs, thus implying the presence of perimortem characteristics at least up to the first ten weeks after death. Similarly, plastic deformation is a trait of perimortem skeletal trauma [16] and was present in most ribs. Splintering was observed every week except for week four, with a higher frequency in weeks six and seven. This is another characteristic that showed no change in the wet bone properties throughout the ten-week period. Again, these have implications on how forensic anthropologists interpret peri-mortem trauma, which in this case is weeks into the post-mortem period.
In addition to splintering, flaking/peeling was seen in 31% of the samples, which is another characteristic of peri-mortem trauma [13,16].
Lastly, folds, observed in 41% of the samples, were another trait considered to be peri-mortem, were found every week except for the ribs in weeks one and six [16].
The variation within the weeks might be attributed to the difference in the size and number of the ribs, the randomization of them, intra-observer error, or biological variation [31,32]. Additionally, little research has been conducted on fracture timings in ribs in contrast to long bones [31], thus challenging the interpretation and significance of the results. Therefore, the examination of macroscopic parameters in ribs needs to be further explored.
Overall, the macroscopic results show both peri-and post-mortem characteristics in the fractures. It may be argued that macroscopic skeletal analysis in forensic anthropology cannot be diagnostic in ascertaining whether a fracture was produced around the time of death (week 0) or in later weeks after death.

4.2. Biomechanical Analysis

Both the original data and the normalized data showed no significant difference over time in the load, energy, and deflection. Furthermore, the data showed no visible trends, suggesting that even a higher sample number would not have had an impact on the significance level. No significant change in the biomechanical data suggests that the properties of the bone did not change. Again, these results reveal that peri-mortem characteristics [4] can be produced at least throughout 10 weeks post-mortem as the ribs still maintain their wet bone properties, at least in this case where the ribs have been buried in a controlled laboratory setting. Thus, it can be argued that biomechanical analysis may not be of value in the early post-mortem interval for fracture timing analysis.

4.3. Microscopic Analysis

The results of the microscopic analysis were of little value due to the lack of evidence found in the SEM images. Following Kieser et al. [19] and Bradley et al. [20], evidence of collagen fibre pull-outs, micro-cracks along the surface of the fracture, periosteal tearing, and grooving of the fracture surface should have been observed. Although some of these observations are based on the experience of the observers, despite soaking the samples in Isopropyl Alcohol Cleaner, leftover organic tissue was still found on the samples, making the subsurface examination impossible.
Radiating fracture lines, which is characteristic of peri-mortem trauma, were observed every week except for week six [14,16]. The presence of fracture lines at a higher frequency than the macroscopic analysis was attributable to the high magnification and cleanliness of the samples. The presence of these fracture lines indicate that the bones were still in a wet state when fractured.
The presence of osteons was evident throughout and with the naked eye in some samples like those we examined in weeks nine, six, and four. There were osteon pull-out characteristics in fracture surfaces, which alludes to a more ductile mode of fracture as opposed to the more brittle mode one encountered with the more highly mineralised plexiform or laminar bone. More plexiform bone being present can alter the overall density of bone, resulting in differences in trauma analysis [7]. This then again justifies the use of deer ribs as a model for human ribs in blunt force trauma analysis. Additionally, these results support other previous work [7,33], where deer bone was shown to be a suitable model for human bone because of suchlike structural and mechanical characteristics which resemble human bone.

4.4. FTIR

The results of the FTIR analysis only showed a significant difference in the carbonate-to-phosphate ratio (p = 8.7 × 10⁻¹⁰). As commented before, there was a gradual decline in the C/P value over the 10 weeks, but there was also a noticeable step-change in the data after week 4 (Figure 6).
This change would suggest a change in the amount of carbonate or phosphate in the bone samples [23]. However, no significant difference was observed in the mineral-to-matrix ratio or the crystallinity index. A significant change in the amount of phosphate would have been visible in the mineral-to-matrix ratio, as these are calculated with the same data [23]. Because these did not change, the significant difference in the carbonate-to-phosphate ratio is attributable to a change in the carbonate content in the bone. This is contradictory to the literature as collagen is the first component of bone to break down, followed by hydroxyapatite during decomposition [34,35]. However, other research has suggested that collagen degradation is dependent on temperature, time, and pH [36]. The low pH of the soil surrounding the bones may have impacted the degradation of collagen as the soil is one of the major influential factors on decomposition [37].
The crystallinity index showed no significant difference; however, a visible change was observed past week four, similar to the change in the carbonate-to-phosphate ratio. Moreover, a slight increase in values was observed from week one to three and again from four to seven and ten.
The mineral-to-matrix ratio did not show a significant or noteworthy trend in its values. Only weeks seven, eight, and nine showed a lower value, but this was not statistically significant. The mineral-to-matrix ratio included the values of phosphate and the organic component amide 1, the latter proteins that decompose at the beginning of bone decomposition [34,35]. It may be argued that because the ratio revealed no significant change, the bone decomposition process had not progressed to a stage which involved significant chemical alterations.
The correlation coefficients of the parameters analysed demonstrate a strong relationship with the mineral-to-matrix ratio. Thus, there was an increase in the former when there was a decrease in the mineral-to-matrix ratio.
Another strong relationship was observed between the crystallinity index and the mineral-to-matrix ratio. An increase in the crystallinity index resulted in an increase in the mineral-to-matrix ratio. Again, this might be due to the calculations involving the phosphate parameters.
With an increase in the crystallinity index, this might be simply attributable to the fact that a collagen content decrease relates to mineral content increase and that is linked to an increase in crystallinity values across the spectrum. All other parameters showed no correlation.

4.5. Thermal Analysis

Thermal analysis showed no significant differences between the weeks. This includes original or native weight versus dry weight, dry weight versus after 200 °C heating weight, and dry weight to ash. However, a decreasing trend was observed from week two to week ten in the weight changes from native to dry state. This weight loss was attributed to the loss of moisture that was bound in the bone’s matrix [29]. Thus, it would appear that the samples had a higher hydration level in the beginning and lost moisture over the ten weeks which in due course would also result in a change in the bone properties [38].
Furthermore, the weight loss from dry bone compared to the weight after being heated at 200 °C was not significantly different from week 1 to week 10. This demonstrated that the remaining moisture content in the bone matrix was similar in the samples of week 1 to week 10 and did not change the properties of the bone [29,38]. Because no significant difference was seen, this may indicate that the remaining hydration did not change throughout the ten weeks or that any change was insignificant.
The weight loss percentage from dry weight to ash weight was not significantly different between the weeks (p = 0.16). It is known that heating at a temperature of 600 °C combusts collagen and other organic components of the bone [29]. However, the absence of significant differences between the weeks suggests that the organic components of the bone had not changed between weeks 1 and 10. This might indicate that bone decomposition had not yet progressed far enough, resulting in the bone still presenting peri-mortem/wet characteristics when fractured.

4.6. Buried vs. Unburied

The comparison of buried bones and exposed or unburied bones [8] showed a significant difference in all the analytical techniques. In the biomechanical analysis, the statistical tests showed a significant difference between buried and exposed bones in the deflection, normalized load, and normalized energy. The deflection and normalized energy values were lower in the exposed bones than the buried ones, while the normalized load was higher in the exposed bones.
Moreover, the FTIR analysis showed significant differences in the crystallinity index, mineral-to-matrix ratio, and carbonate-to-phosphate ratio. Lastly, a significant difference was observed in the thermal analysis in the native to dry weight loss percentage, dry weight to weight after 200 °C, and the weight loss from dry to ash weight. The weight loss in the buried samples was generally higher than in the exposed samples for all three of the stages.
It may be argued that the presence or absence of soil had a significant impact on the decomposition rate of the bones, including the moisture level, the bone composition, the mineral and collagen of bone, and therefore the mechanical characteristics and the overall fracture behaviour.

4.7. Recommendations and Limitations

The statistical test results had limited value due to the small sample size within each week (N = 3). The authors recommend that future research studies widen the sample size, which should be statistically determined [39].
Moreover, this project relied on the observers’ experience in the macroscopic and microscopic examination and analysis of the sample [15], and this can be open to interpretation and thus subjective. Avoiding this error could be achieved by the examination of the samples by multiple experts independently, either through pictures or through direct physical examination.
Additionally, individual skeletal variation between the rib cages and between the ribs within one rib cage could have influenced the results [15]. This should be taken into consideration for future research, and the same rib should be taken from multiple rib cages of the same age and species to limit variation in size, shape, and composition. It may be perhaps necessary to explore these without freezing the bones too.

5. Conclusions

From the results of this study, it has become evident that fractures to bone can still present wet bone characteristics at least 10 weeks after death when deposited in a burial environment. The macroscopic analysis showed no significant differences or patterns in any of the traits examined during a period of 10 weeks. The biomechanical analysis showed no significant difference between any of the weeks or parameters either. The microscopic analysis was of little value due to the limited amount of data obtained; however, the use of deer bone is justified. In addition, the analytical chemistry analysis only showed differences in the carbonate-to-phosphate ratio. Moreover, the thermal analysis showed no significant difference between the weeks. The comparison of the buried and exposed bones showed a significant difference in all the parameters.
Consequently, when combining all the results, the data do not show that any significant difference was detected. This means that with the present set of methods, an interpretation of peri-mortem (around the time of death) trauma based on wet bone fractures has to consider that these fractures may have occurred weeks after death, as bone still retains its wet properties. Thus, the interpretation of fracture timing in forensic anthropology and distinguishing peri-mortem from post-mortem trauma cannot be conducted on wet vs. dry characteristics alone.

Supplementary Materials

The following supporting information can be downloaded at https://www.mdpi.com/article/10.3390/forensicsci3030034/s1, Table S1: Statistical results for buried and exposed rib samples; Table S2: Statistical data of variables to supplement Figure 5; Table S3: Statistical data of variables over 10 weeks decomposition to supplement Figure 5.

Author Contributions

Conceptualization, N.M.-G. and P.Z.; methodology, N.M.-G. and P.Z.; software, A.B. and E.L.A.; formal analysis, A.K.M., A.M., A.B., E.L.A. and P.Z.; investigation, A.K.M. and A.M.; data curation, A.K.M., A.B., E.L.A., N.M.-G. and P.Z.; writing—original draft preparation, A.K.M. and A.M.; writing—review and editing, A.K.M., A.B., N.M.-G. and P.Z.; visualization, A.K.M. and A.B.; supervision, N.M.-G. and P.Z.; project administration, N.M.-G. and P.Z. All authors have read and agreed to the published version of the manuscript.

Funding

This research received no external funding.

Institutional Review Board Statement

The animal study protocol was approved by the Ethics Committee of Cranfield University (CURES/12923/2021).

Informed Consent Statement

Not applicable.

Data Availability Statement

The data presented in this study are available on request from the corresponding author.

Acknowledgments

The authors would like to thank Thomas Delbey, Cranfield Forensic Institute, Cranfield University, for assisting with the FTIR analysis.

Conflicts of Interest

The authors declare no conflict of interest. The funders had no role in the design of the study; in the collection, analyses, or interpretation of data; in the writing of the manuscript; or in the decision to publish the results.

References

  1. Love, J.C.; Wiersema, J.M. Skeletal Trauma: An anthropological review. Acad. Forensic Pathol. 2016, 6, 463–477. [Google Scholar] [CrossRef]
  2. Passalacqua, N.V.; Rainwater, C.W. (Eds.) Skeletal Trauma Analysis: Case Studies in Context; John Wiley & Sons: Chichester, UK, 2015. [Google Scholar]
  3. Wedel, V.; Galloway, A. (Eds.) Broken Bones: Anthropological Analysis of Blunt Force Trauma; Charles C. Thomas Publisher Ltd.: Springfield, MO, USA, 2014. [Google Scholar]
  4. Kemp, W.L. Postmortem Change and its Effect on Evaluation of Fractures. Acad. Forensic Pathol. 2017, 6, 28–44. [Google Scholar] [CrossRef]
  5. Benedix, D.C. Differentiation of Fragmented Bone from South East Asia: The Histological Evidence. Ph.D. Thesis, University of Tennessee, Knoxville, TN, USA, 2004. [Google Scholar]
  6. Hillier, M.L.; Bell, L.S. Differentiating Human Bone from Animal Bone: A Review of Histological Methods. J. Forensic Sci. 2007, 52, 249–263. [Google Scholar] [CrossRef]
  7. Morris, Z.H. Quantitative and spatial analysis of the microscopic bone structures of deer (Odocoileus virginianus), dog (Canis familiaris), and pig (Sus scrofa domesticus). Master’s Thesis, Graduate School Louisiana State University, Baton Rouge, LA, USA, 2007. [Google Scholar]
  8. Manzella, A. Investigating skeletal trauma in the early Post-mortem Interval. Master’s Thesis, Cranfield University, Cranfield, UK, 2021. Available online: https://mta.cranfield.ac.uk/handle/1826.1/16552 (accessed on 1 June 2023).
  9. Linde, F.; Sørensen, H.C.F. The effect of different storage methods on the mechanical properties of trabecular bone. J. Biomech. 1993, 26, 1249–1252. [Google Scholar] [CrossRef]
  10. Jung, H.J.; Vangipuram, G.; Fisher, M.B.; Yang, M.; Hsu, S.; Bianchi, J.; Ronholdt, C.; Woo, S.L. The effects of multiple freeze–thaw cycles on the biomechanical properties of the human bone- patellar tendon-bone allograft. J. Orthop. Res. 2011, 29, 1193–1198. [Google Scholar] [CrossRef]
  11. Hansen, U.; Zioupos, P.; Simpson, R.; Currey, J.D.; Hynd, D. The Effect of Strain Rate on the Mechanical Properties of Human Cortical Bone. J. Od Biomech. Eng. 2008, 130, 011011. [Google Scholar] [CrossRef]
  12. Isa, M.; Fenton, T.; Deland, T.; Haut, R. Assessing Impact Direction in 3-point Bending of Human Femora: Incomplete Butterfly Fractures and Fracture Surfaces. J. Forensic Sci. 2017, 63, 38–64. [Google Scholar] [CrossRef]
  13. Moraitis, K.; Spiliopoulou, C. Identification and Differential Diagnosis of Perimortem Blunt Force Trauma in Tubular Long Bones. Forensic Sci. Med. Pathol. 2006, 2, 221–229. [Google Scholar] [CrossRef]
  14. Wheatley, B.P. Perimortem or Postmortem Bone Fractures? An Experimental Study of Fracture Patterns in Deer Femora. J. Forensic Sci. 2008, 53, 69–72. [Google Scholar] [CrossRef]
  15. Christensen, A.M.; Passalacqua, N.V.; Bartelink, E.J. Forensic Anthropology Current Methods and Practice; Academic Press: Oxford, UK, 2014. [Google Scholar]
  16. Scheirs, S.; Langenhorst, W.; Malgosa, A.; Ortega-Sánchez, M.; McGlynn, H.; Santos, C.; Jordana, X.; Rodriguez-Baeza, A.; Galtés, I. Perimortem fracture pattern in ribs by blunt force trauma. Int. J. Leg. Med. 2018, 132, 1205–1213. [Google Scholar] [CrossRef]
  17. Moini, J. Anatomy and Physiology for Health Professionals; Jones & Bartlett Learning: Burlington, MA, USA, 2020. [Google Scholar]
  18. Villa, P.; Mahieu, E. Breakage patterns of human long bones. J. Hum. Evol. 1991, 21, 27–48. [Google Scholar] [CrossRef]
  19. Kieser, J.; Weller, S.; Swain, M.N.; Waddell, J.N.; Das, R. Compressive rib fracture: Peri-mortem and post-mortem trauma patterns in a pig model. Leg. Med. 2013, 15, 193–201. [Google Scholar] [CrossRef] [PubMed]
  20. Bradley, A.L.; Swain, M.V.; Waddell, J.N.; Das, R.; Athens, J.; Kieser, J.A. A comparison between rib fracture patterns in peri- and post-mortem compressive injury in a piglet model. J. Mech. Behav. Biomed. Mater. 2014, 33, 67–75. [Google Scholar] [CrossRef] [PubMed]
  21. Paschalis, E.P.; Mendelsohn, R.; Boskey, A.L. Infrared Assessment of Bone Quality A Review. Clin. Orthop. Relat. Res. 2011, 469, 2170–2178. [Google Scholar] [CrossRef] [PubMed]
  22. Wescott, D.J. Postmortem change in bone biomechanical properties: Loss of plasticity. Forensic Sci. Int. 2019, 300, 164–169. [Google Scholar] [CrossRef]
  23. Bonicelli, A.; Zioupos, P.; Arnold, E.; Rogers, K.D.; Xhemali, B.; Kranioti, E.F. Age related changes of rib cortical bone matrix and the application to forensic age-at-death estimation. Sci. Rep. 2021, 11, 2086. [Google Scholar] [CrossRef]
  24. Wang, Q.; Zhang, Y.; Lin, H.; Zha, S.; Fang, R.; Wei, X.; Fan, S.; Wang, Z. Estimation of late postmortem interval using FTIR spectroscopy and chemometrics in human skeletal remains. Forensic Sci. Int. 2017, 281, 113–120. [Google Scholar] [CrossRef]
  25. Woess, C.; Unterberger, S.H.; Roider, C.; Ritsch-Marte, M.; Pemberger, N.; Cemper-Kiesslich JHatzer-Grubwieser, P.; Parson, W.; Pallua, J.D. Assessing various Infrared (IR) microscopic imaging techniques for post-mortem interval evaluation of human skeletal remains. PLoS ONE 2017, 12, e0174552. [Google Scholar] [CrossRef]
  26. Peters, F.; Schwarz, K.; Epple, M. The structure of bone studied with synchrotron X-ray diffraction, X-ray absorption spectroscopy and thermal analysis. Thermochim. Acta 2000, 361, 131–138. [Google Scholar] [CrossRef]
  27. Figueiredo, M.; Fernando, A.; Martins, G.; Freitas, J.; Judas, F.; Figueiredo, H. Effect of the calcination temperature on the composition and microstructure of hydroxyapatite derived from human and animal bone. Ceram. Int. 2010, 36, 2383–2393. [Google Scholar] [CrossRef]
  28. Pramanik, S.; Hanif, A.S.M.; Pingguan-Murphy, B.; Osman, N.A.A. Morphological change of heat treated bovine bone: A comparative study. Materials 2013, 6, 65–75. [Google Scholar] [CrossRef]
  29. Ellingham, S.T.D.; Thompson, T.J.U.; Islam, M. Thermogravimetric analysis of property changes and weight loss in incinerated bone. Palaeogeogr. Palaeoclimatol. Palaeoecol. 2015, 438, 239–244. [Google Scholar] [CrossRef]
  30. Mkukuma, L.D.; Skakle, J.M.S.; Gibson, I.R.; Imrie, C.T.; Aspden, R.M.; Hukins, D.W.L. Effect of the proportion of organic material in bone on thermal decomposition of bone mineral: An investigation of a variety of bones from different species using thermogravimetric analysis coupled to mass spectrometry, high-temperature X-ray diffraction, and Fourier transform infrared spectroscopy. Calcif. Tissue Int. 2004, 75, 321–328. [Google Scholar] [PubMed]
  31. Cattaneo, C.; Cappella, A. Distinguishing between Peri- and Post-Mortem Trauma on Bone. In Taphonomy of Human Remains: Forensic Analysis of the Dead and the Depositional Environment; Schotsmans, E.M.J., Márquez-Grant, N., Forbes, S.L., Eds.; John Wiley & Sons Ltd.: Chichester, UK, 2017; pp. 352–368. [Google Scholar]
  32. Wu AH, B.; Christenson, R.H. Analytical and assay issues for use of cardiac troponin testing for risk stratification in primary care. Clin. Biochem. 2013, 46, 969–978. [Google Scholar] [CrossRef] [PubMed]
  33. Kieser, D.C.; Kanade, S.; Waddell NJm Kieser, J.A.; Theis, J.; Swain, M.V. The deer femur—A morphological and biomechanical animal model of the human femur. Bio-Med. Mater. Eng. 2014, 24, 1693–1703. [Google Scholar] [CrossRef]
  34. Dent, B.B.; Forbes, S.L.; Stuart, B.H. Review of human decomposition processes in soil. Environ. Geol. 2004, 45, 576–585. [Google Scholar] [CrossRef]
  35. Janaway, R.C.; Percival, S.L.; Wilson, A.S. Decomposition of Human Remains. In Microbiology and Aging Clinical Manifestations; Percival, R.C., Ed.; Springer: New York, NY, USA, 2009; pp. 313–334. [Google Scholar]
  36. Collins, M.J.; Nielsen-Marsh, C.M.; Hiller, J.; Smith, C.I.; Roberts, J.P.; Prigodich, R.V.; Wess, T.J.; Csapò, J.; Millard, A.R.; Turner-Walker, G. The survival of organic matter in bone: A review. Archaeometry 2002, 44, 383–394. [Google Scholar] [CrossRef]
  37. Nawrocki, S.P. Forensic Taphonomy. In Handbook for Forensic Anthropology and Archaeology; Blau, S., Ubelaker, D.H., Eds.; Routledge: New York, NY, USA, 2016; pp. 373–401. [Google Scholar]
  38. Wieberg, D.A.; Wescott, D.J. Estimating the Timing of Long Bone Fractures: Correlation Between the Postmortem Interval, Bone Moisture Content, and Blunt Force Trauma Fracture Characteristics. J. Forensic Sci. 2008, 53, 1028–1034. [Google Scholar] [CrossRef]
  39. Binu, V.S.; Mayya, S.S.; Dhar, M. Some basic aspects of statistical methods and sample size determination in health science research. Ayu 2014, 35, 119–123. [Google Scholar]
Figure 1. Example of splintering (Week 7, Sample 42).
Forensicsci 03 00034 g001
Figure 2. Example of FTIR spectrum of bone powder, highlighting peaks of interests.
Forensicsci 03 00034 g002
Figure 3. Biplot of PCA analysis showing the variables driving the variance in the model. Keys: Carbonate_Phosphate: Carbonate-to-Phosphate ratio; Crystallinity_Index: Crystallinity Index; Dry_200: Weight loss between 200 and 600 °C; Dry_Ash: Weight loss after combustion; DSC_EP_I: Enthalpy values between 25 and 200 °C; DSC_EP_II: Enthalpy values between 200 and 550 °C; Energy: Normalised energy value; Max_deflectio: Maximum deflection; Max_load: Maximum load; Mineral_Matrix: Mineral-to-Matrix ratio; Native_Dry: Weight loss below 200 °C; TGA_EP_I_: TGA weight loss between 25 and 200 °C; TGA_EP_II_: TGA weight loss between 200 and 550 °C.
Forensicsci 03 00034 g003
Figure 4. Univariate difference between buried and exposed (surface) rib samples. Keys: Carbonate_Phosphate: Carbonate-to-Phosphate ratio; Crystallinity_Index: Crystallinity Index; Dry_200: Weight loss between 200 and 600 °C; Dry_Ash: Weight loss after combustion; DSC_EP_I: Enthalpy values between 25 and 200 °C; DSC_EP_II: Enthalpy values between 200 and 550 °C; Energy: Normalised energy value; Max_deflectio: Maximum deflection; Max_load: Maximum load; Mineral_Matrix: Mineral-to-Matrix ratio; Native_Dry: Weight loss below 200 °C; TGA_EP_I_: TGA weight loss between 25 and 200 °C; TGA_EP_II_: TGA weight loss between 200 and 550 °C. Asterisks refer to statistically significant results: * p ≤ 0.05, ** p ≤ 0.01, *** p ≤ 0.001, **** p ≤ 0.0001.
Forensicsci 03 00034 g004
Figure 5. Boxplot of all variables (plots 1 to 13 starting from top left) across the 10 weeks of decomposition with statistical tests in Supplementary Tables S2 and S3. Keys: Carbonate_Phosphate: Carbonate-to-Phosphate ratio; Crystallinity_Index: Crystallinity Index; Dry_200: Weight loss between 200 and 600 °C; Dry_Ash: Weight loss after combustion; DSC_EP_I: Enthalpy values between 25 and 200 °C; DSC_EP_II: Enthalpy values between 200 and 550 °C; Energy: Normalised energy value; Max_deflectio: Maximum deflection; Max_load: Maximum load; Mineral_Matrix: Mineral-to-Matrix ratio; Native_Dry: Weight loss below 200 °C; TGA_EP_I_: TGA weight loss between 25 and 200 °C; TGA_EP_II_: TGA weight loss between 200 and 550 °C. Asterisks refer to statistically significant results: ** p ≤ 0.01; ns = not statistically significant. Numbers (1–13) just label the different boxplots.
Forensicsci 03 00034 g005
Figure 6. Boxplot of Carbonate-to-Phosphate ratio over the 10 weeks of decomposition for the buried bones. Average value of C/P ratio for the first 4 weeks is around 0.01575, while afterwards it stays around a value of 0.015.
Forensicsci 03 00034 g006
Table 1. Calculation of Parameters.
Crystallinity IndexCarbonate-to-Phosphate RatioMineral-to-Matrix Ratio
(565 cm−1 + 595 cm−1)/565ν2 Carbon/ν1ν3 Phosphateν1ν3 Phosphate/Amide1
Disclaimer/Publisher’s Note: The statements, opinions and data contained in all publications are solely those of the individual author(s) and contributor(s) and not of MDPI and/or the editor(s). MDPI and/or the editor(s) disclaim responsibility for any injury to people or property resulting from any ideas, methods, instructions or products referred to in the content.

