1. Introduction
Canines have a highly developed olfactory system. This allows them to be an asset to different organizations [
1]. Canines are employed and trained for detection in various capacities, such as the location of human remains, search and rescue missions and detecting illicit materials [
1]. The primary focus of this study is illicit substances. It is hypothesized that canines alert to the discharged odor of the illicit substance, and not the physical illicit substance itself—as is the case with cocaine and its active odorant, methyl benzoate [
2,
3,
4,
5]. Currently, in routine traffic stops, many law enforcement teams have the aid of trained canines to alert if illegal substances are present. The fourth amendment has been brought up many times regarding whether it is an infringement upon an individual’s rights for these searches to occur. This has gathered both media attention and the attention of the courts. Several issues have been raised as a result of canines making alerts to areas where narcotic substances were either not present, or were no longer present, and these require further study.
The inspiration behind this study also came from a canine certification session. In Miami, Florida, canines were escorted by handlers through a series of boxes to see if they could indicate which boxes contained illicit substances. In the series, one blank box caused more than half of the training canines to alert to an odor. The canines were alerted by the second-to-last box. The contents of the box should not have caused an alert; however, it was in close proximity to a box that would. The last box contained a kilogram of cocaine. During the certification course, it was only this scenario that an empty box prompted unconfirmed alerts of that quantity. The hypothesis then was that the odors transported, or travelled, from one box to another, which led to the multiple unconfirmed alerts.
Canine detection has been misinterpreted in regard to routine vehicle stops. The thought is that the illicit substance is being identified by the canines. In actuality, the canine is being alerted to an odorant, or VOC, that is emitted into the surrounding area [
6]. For example, the actual cocaine molecule is not causing an alert in the canine. The actual alert is generated by methyl benzoate, a volatile cocaine byproduct [
7]. The active odor signature is a chemical within a sample that causes a trained and certified canine to be alerted [
8]. Multiple drugs have been recognized and identified this way, including methylenedioxy methamphetamine (MDMA), methamphetamine, and cocaine [
3,
9,
10,
11]. Since these are volatile substances, an attempt should be made to study them in real time using instrumentation that does not require the trapping of said volatiles or the need for a pre-concentration step. Direct Analysis in Real Time coupled to an Accurate Time-of-Flight Mass Spectrometer (DART-MS) is an instrument with ambient, soft ionization that allows for the introduction of samples in many forms (solids, liquids, and gases) directly and with little-to-no sample preparation [
12]. It has been validated to analyze inks, explosives, accelerants, fragrances, polymers, and various controlled substances [
13,
14,
15,
16,
17,
18,
19,
20,
21,
22,
23]. The capability to test samples in real time without pre-concentrating the specimen makes this type of research ideal to test with the DART. When held at a certain distance and sampled directly into the instrument stream, the DART can effectively interpret the headspace of volatile organic compounds (VOCs) [
24]. Therefore, the DART could likely interpret these same VOCs when held at various distances. This study focuses on cocaine and methamphetamine, which are two of the narcotics people most often misuse and which are encountered most often by law enforcement [
25]. As mentioned before, the active odorant for cocaine is methyl benzoate and the active odorant for methamphetamine is benzaldehyde [
7,
11].
2. Experimental
Approximately 5 mL of methyl benzoate and benzaldehyde, purchased from Sigma-Aldrich, Inc. (St. Louis, MO, USA), were stored separately in 20 mL disposable scintillation vials (Kimble Chase, Vineland, NJ, USA). The Direct Analysis in Real Time (DART) ion source (IonSense, Inc., Saugus, MA, USA) connected to an AccuTOF™ time-of-flight mass spectrometer (JMS-T100LC, JEOL USA, Peabody, MA, USA). Data collection and analysis were completed using JEOL MassCenter software (v1.3.4m). A 2 mg/mL solution of polyethylene glycol in methanol (PEG 600) was used for exact mass calibration. Calibration was performed by dipping the bottom end of a melting point tube (Kimble Chase) into the PEG 600 solution and “wanding” the bottom end of the melting point tube within the sample gap for a few seconds. Each data file of all samples collected would contain a calibration curve developed from the PEG 600.
First, data analysis occurs with ‘translating’ the data file in TSS Pro 3.0 (Shrader Analytical and Consulting Laboratories, Inc., Detroit, MI, USA). Before the calibration process, the area in the Reconstructed Ion Chromatogram (RIC) before the PEG peaks was completed by selecting the ‘perform background subtraction’ option. Following that, high-quality RIC profiles are extracted by choosing the button above RIC. It will conduct ‘CODA’ (Component Detection Algorithm), which converts complex data sets to a more straightforward interpretation. Next, the total data file was calibrated. This was performed by taking the average of the PEG peaks. After that, the mass spectrum was created. This was completed by recording the intensity and average of every peak in the RIC in a spreadsheet. Each sample and each run went through this exact process. In order to achieve correct identification of every peak in the spectra: the peak must be at or above 5% of relative intensity and the m/z of the analyte of interest must be within ±5 mDa. Any peaks below 5% in the spectra were not used, and anything exceeding the ±5 mDa range would not result in a positive identification of the sample of interest. The optimum temperature for the DART gas stream was determined to be 400 °C, and an orifice 1 voltage of 30 V was used for this study.
Two chemical standards were chosen. Each was sampled at 5 distances (0.5 m, 1 m, 1.5 m, 2 m, and 3 m). The objective was to determine the detection of the VOC samples by measuring the time it takes for the odors to transport through the distances. For this reason, during each run, a timer was used to note the moment the vial cap was opened. Each run involved the following steps: (1) begin sample run while simultaneously turning timer on; (2) sample PEG calibrant in triplicate; (3) open vial at specific distance away from the ion source while simultaneously pressing “lap” to mark the exact time the vial was moved; (4) hold vial open for two minutes; (5) cap the vial and simultaneously record moment vial was closed; and (6) directly sample the headspace of the sample vial (positive control). Each sample at each distance was performed in triplicate.
3. Results and Discussion
3.1. Methyl Benzoate
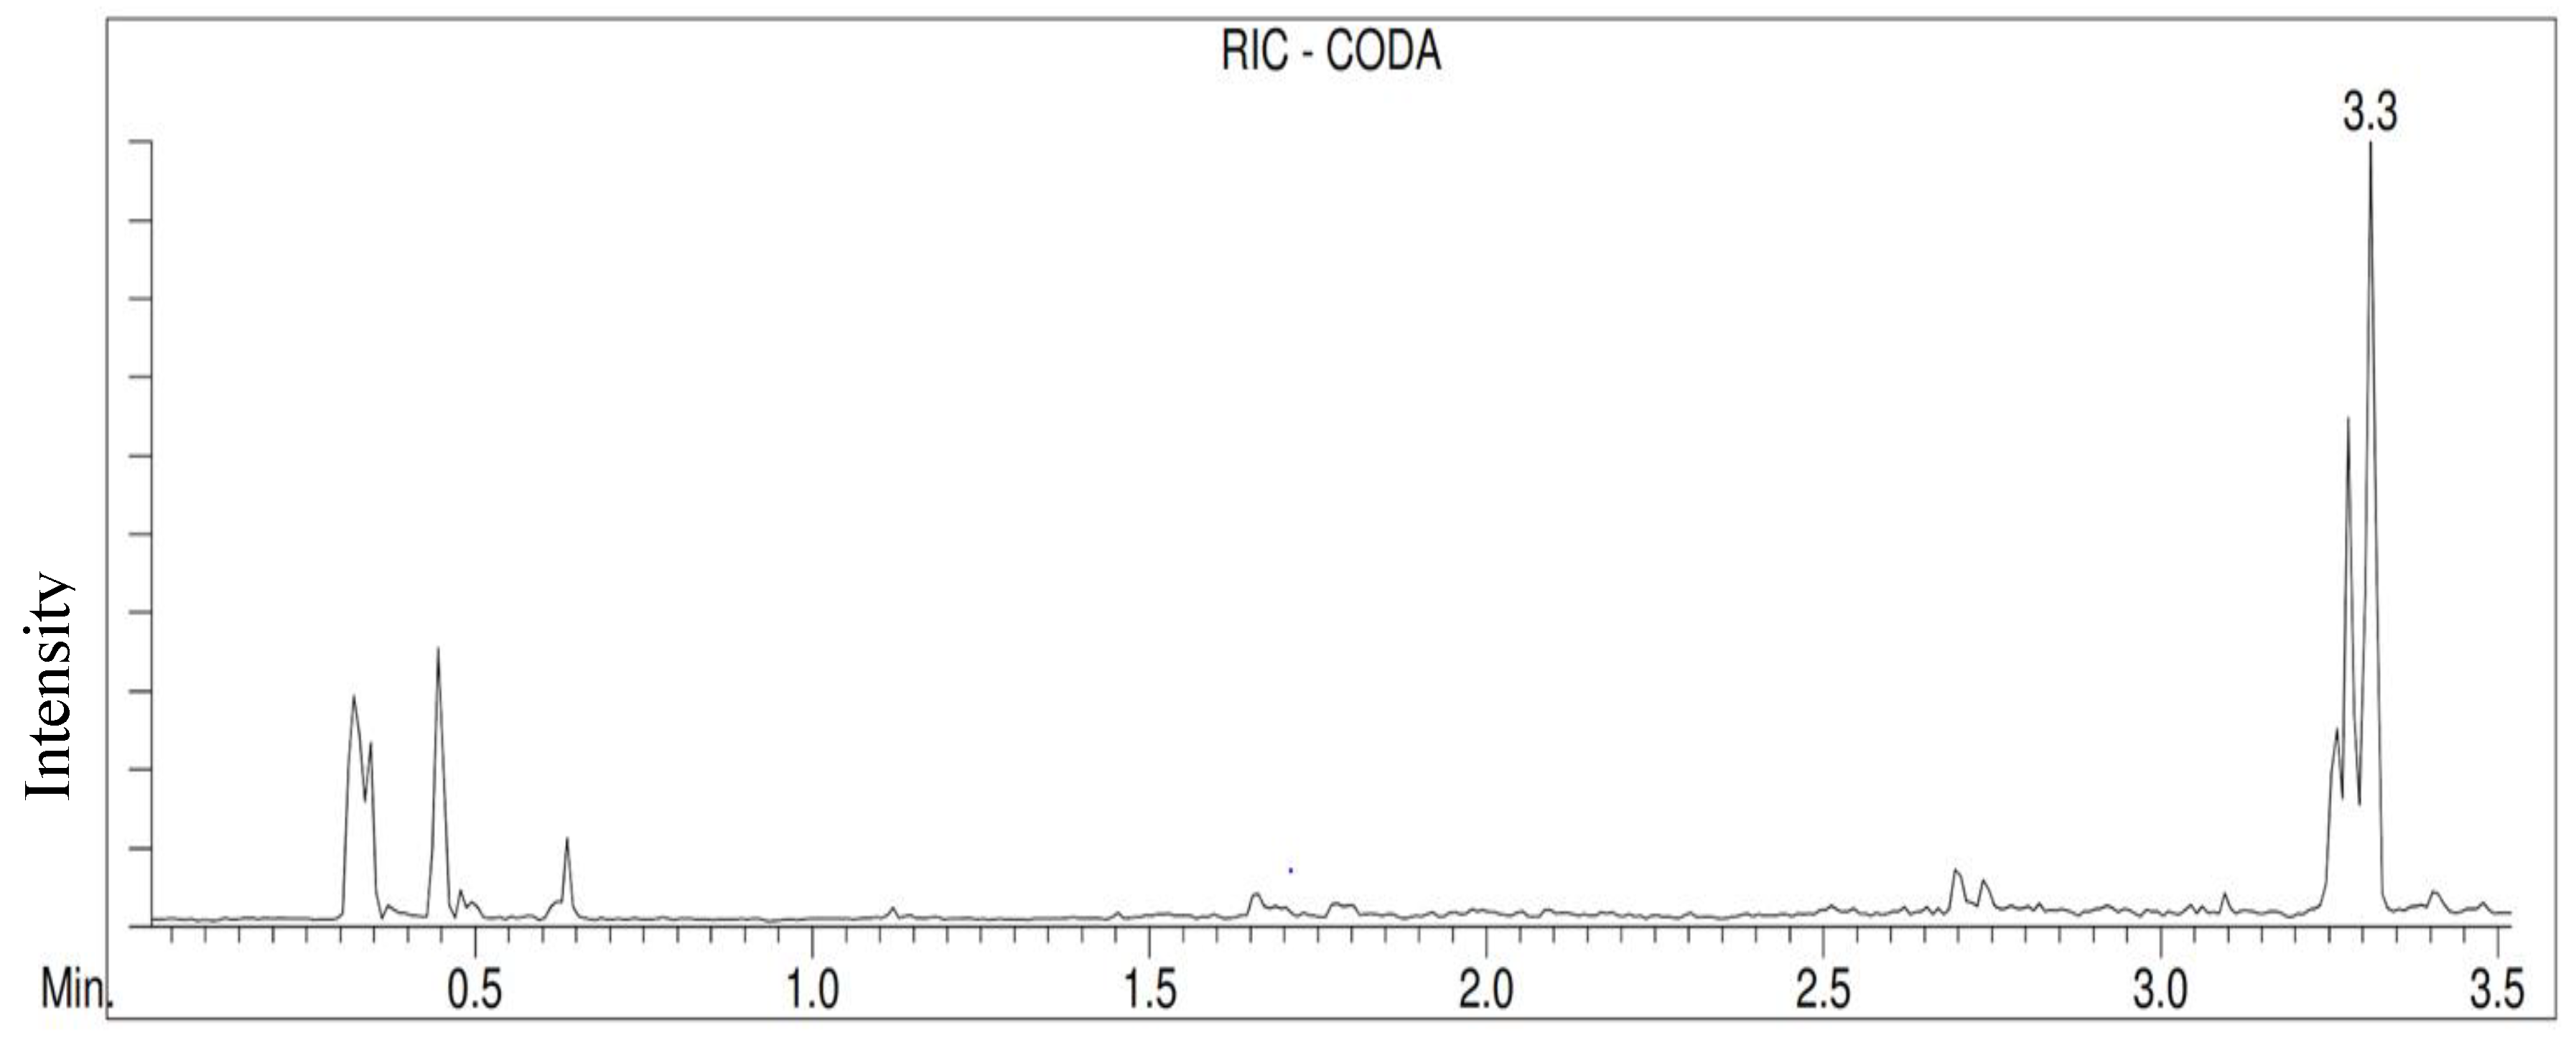
The first trial test of methyl benzoate can be seen in
Figure 1. It shows the RIC (after performing CODA) at a distance of 0.5 m.
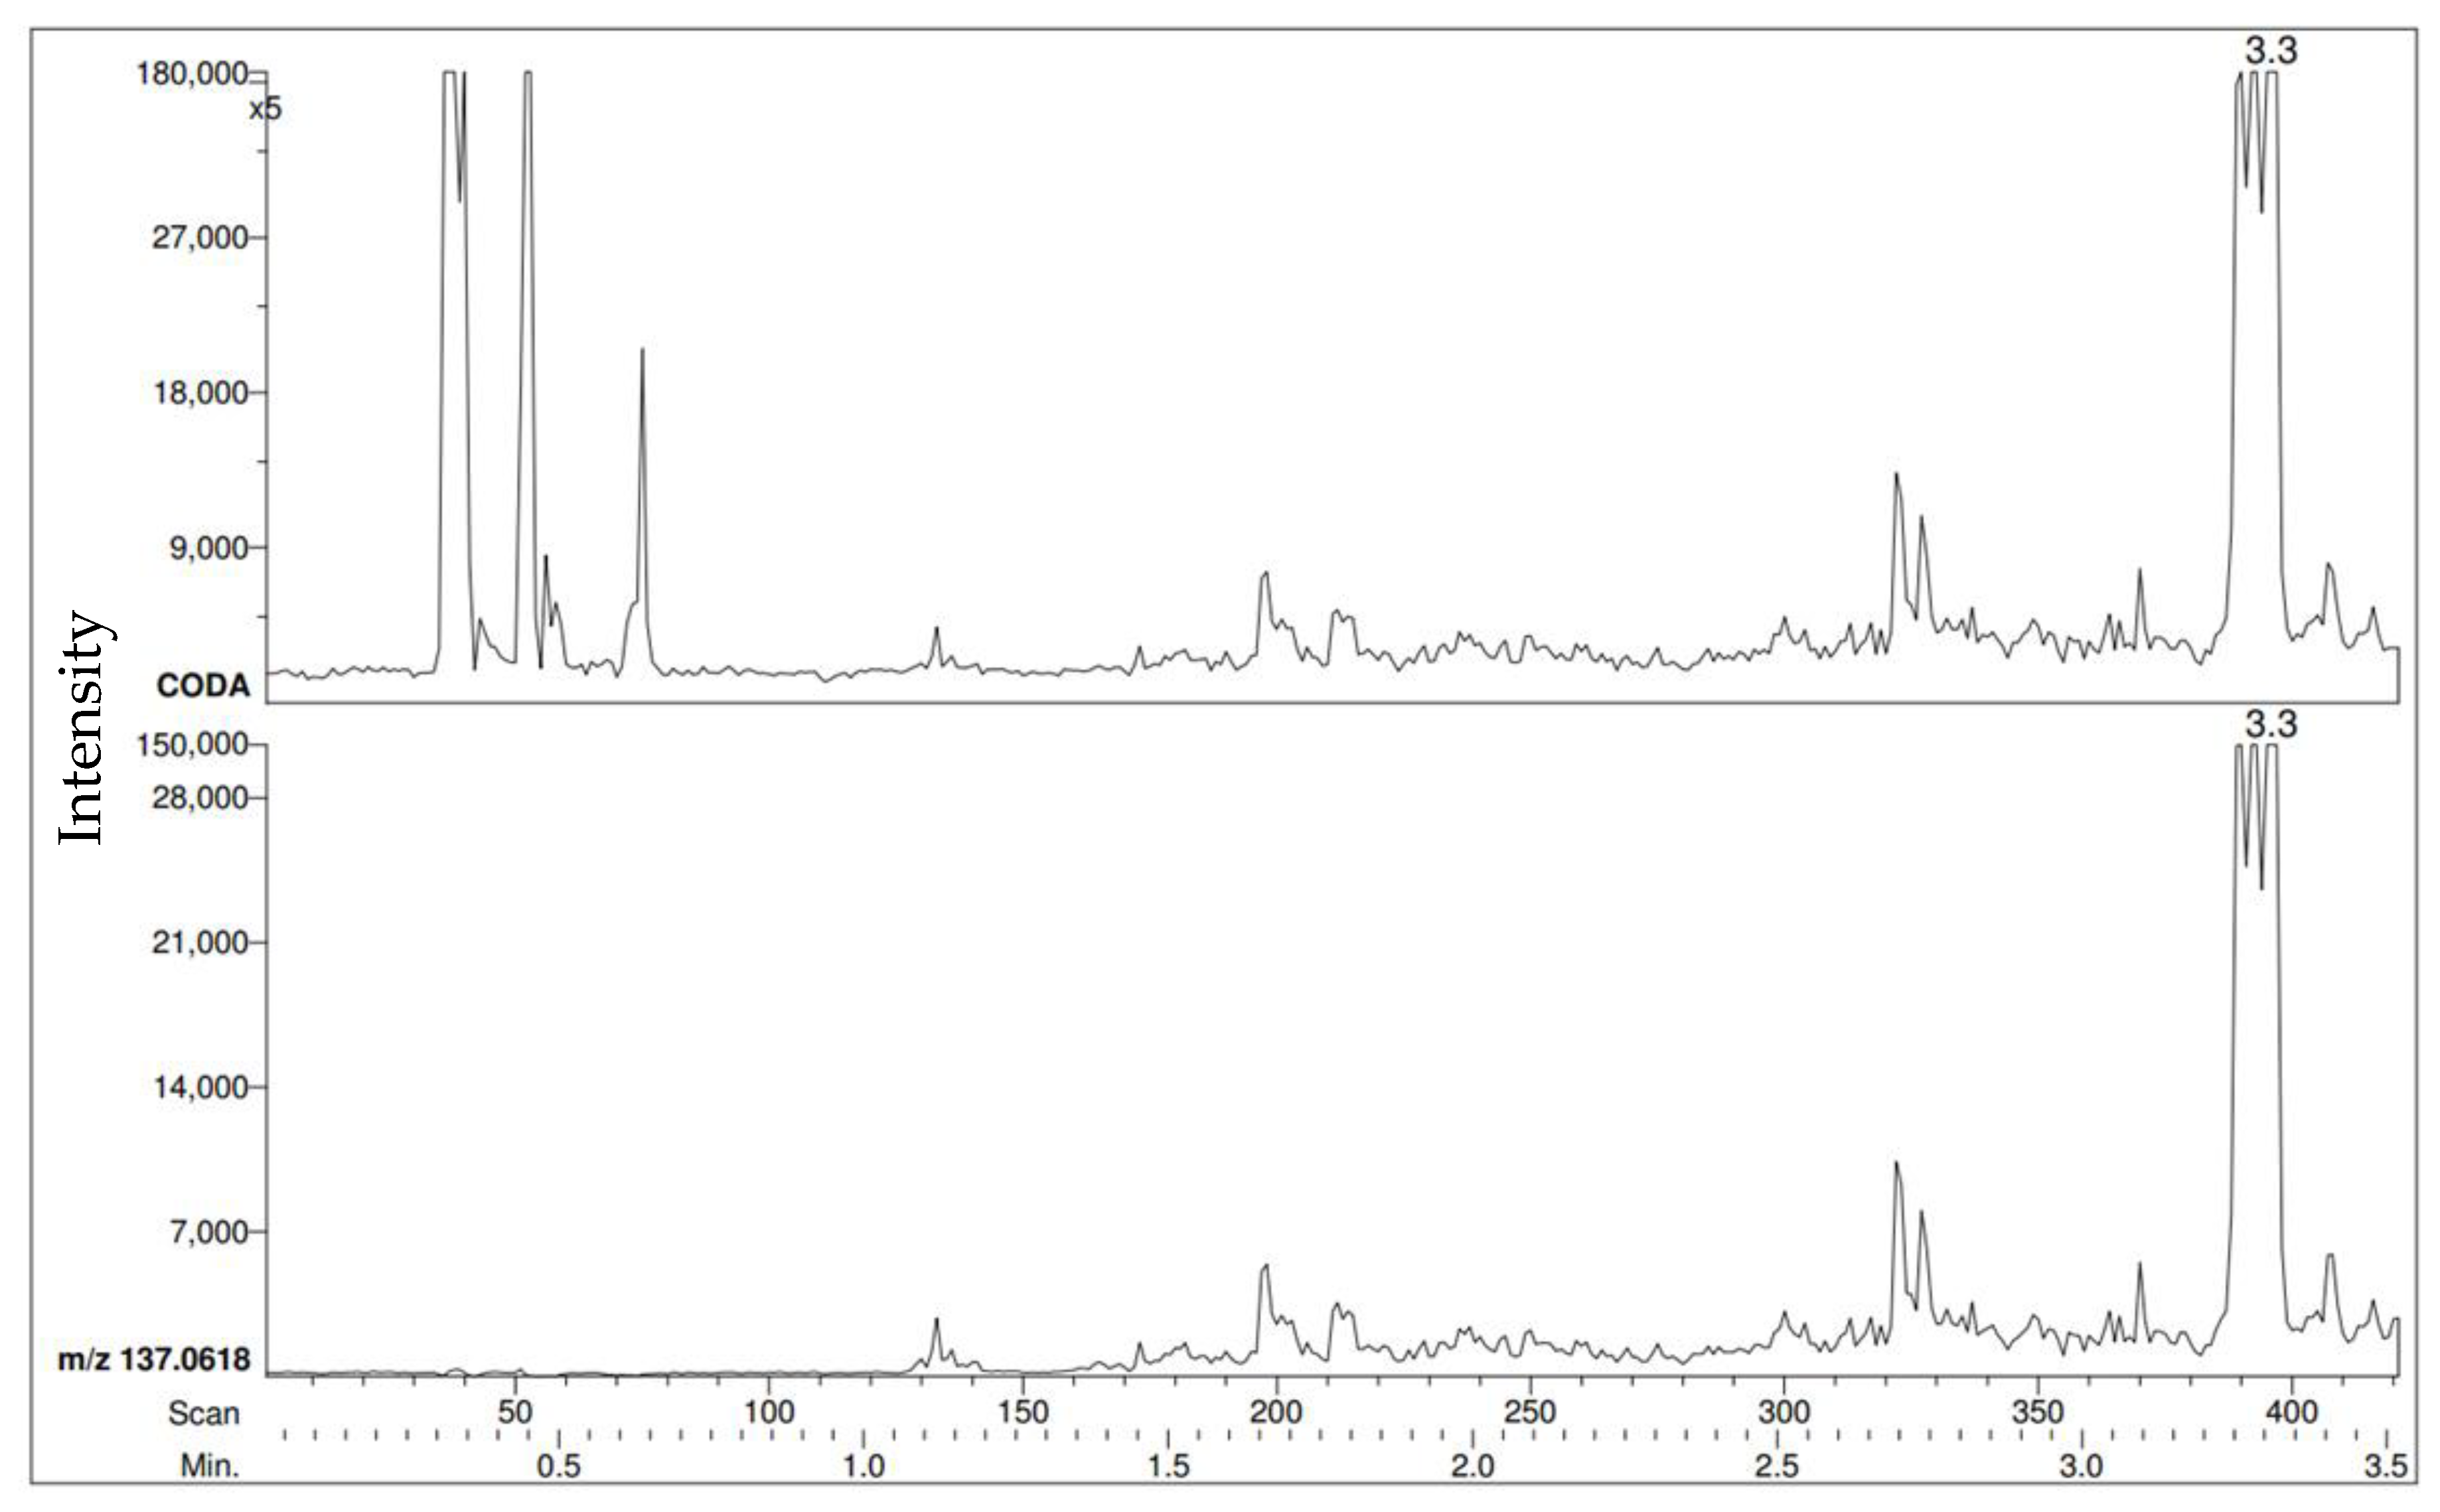
The PEG calibration standard peaks are the first visible peaks observed at the beginning of the RIC. At the end of each run, the positive control is directly sampled and can be seen as the last peaks in the RIC. The first detection of the methyl benzoate VOC is shown in
Figure 2. This was completed by choosing the
m/z of 137 (M + H of methyl benzoate) then creating a RIC that will only show a response where
m/z 137 was detected.
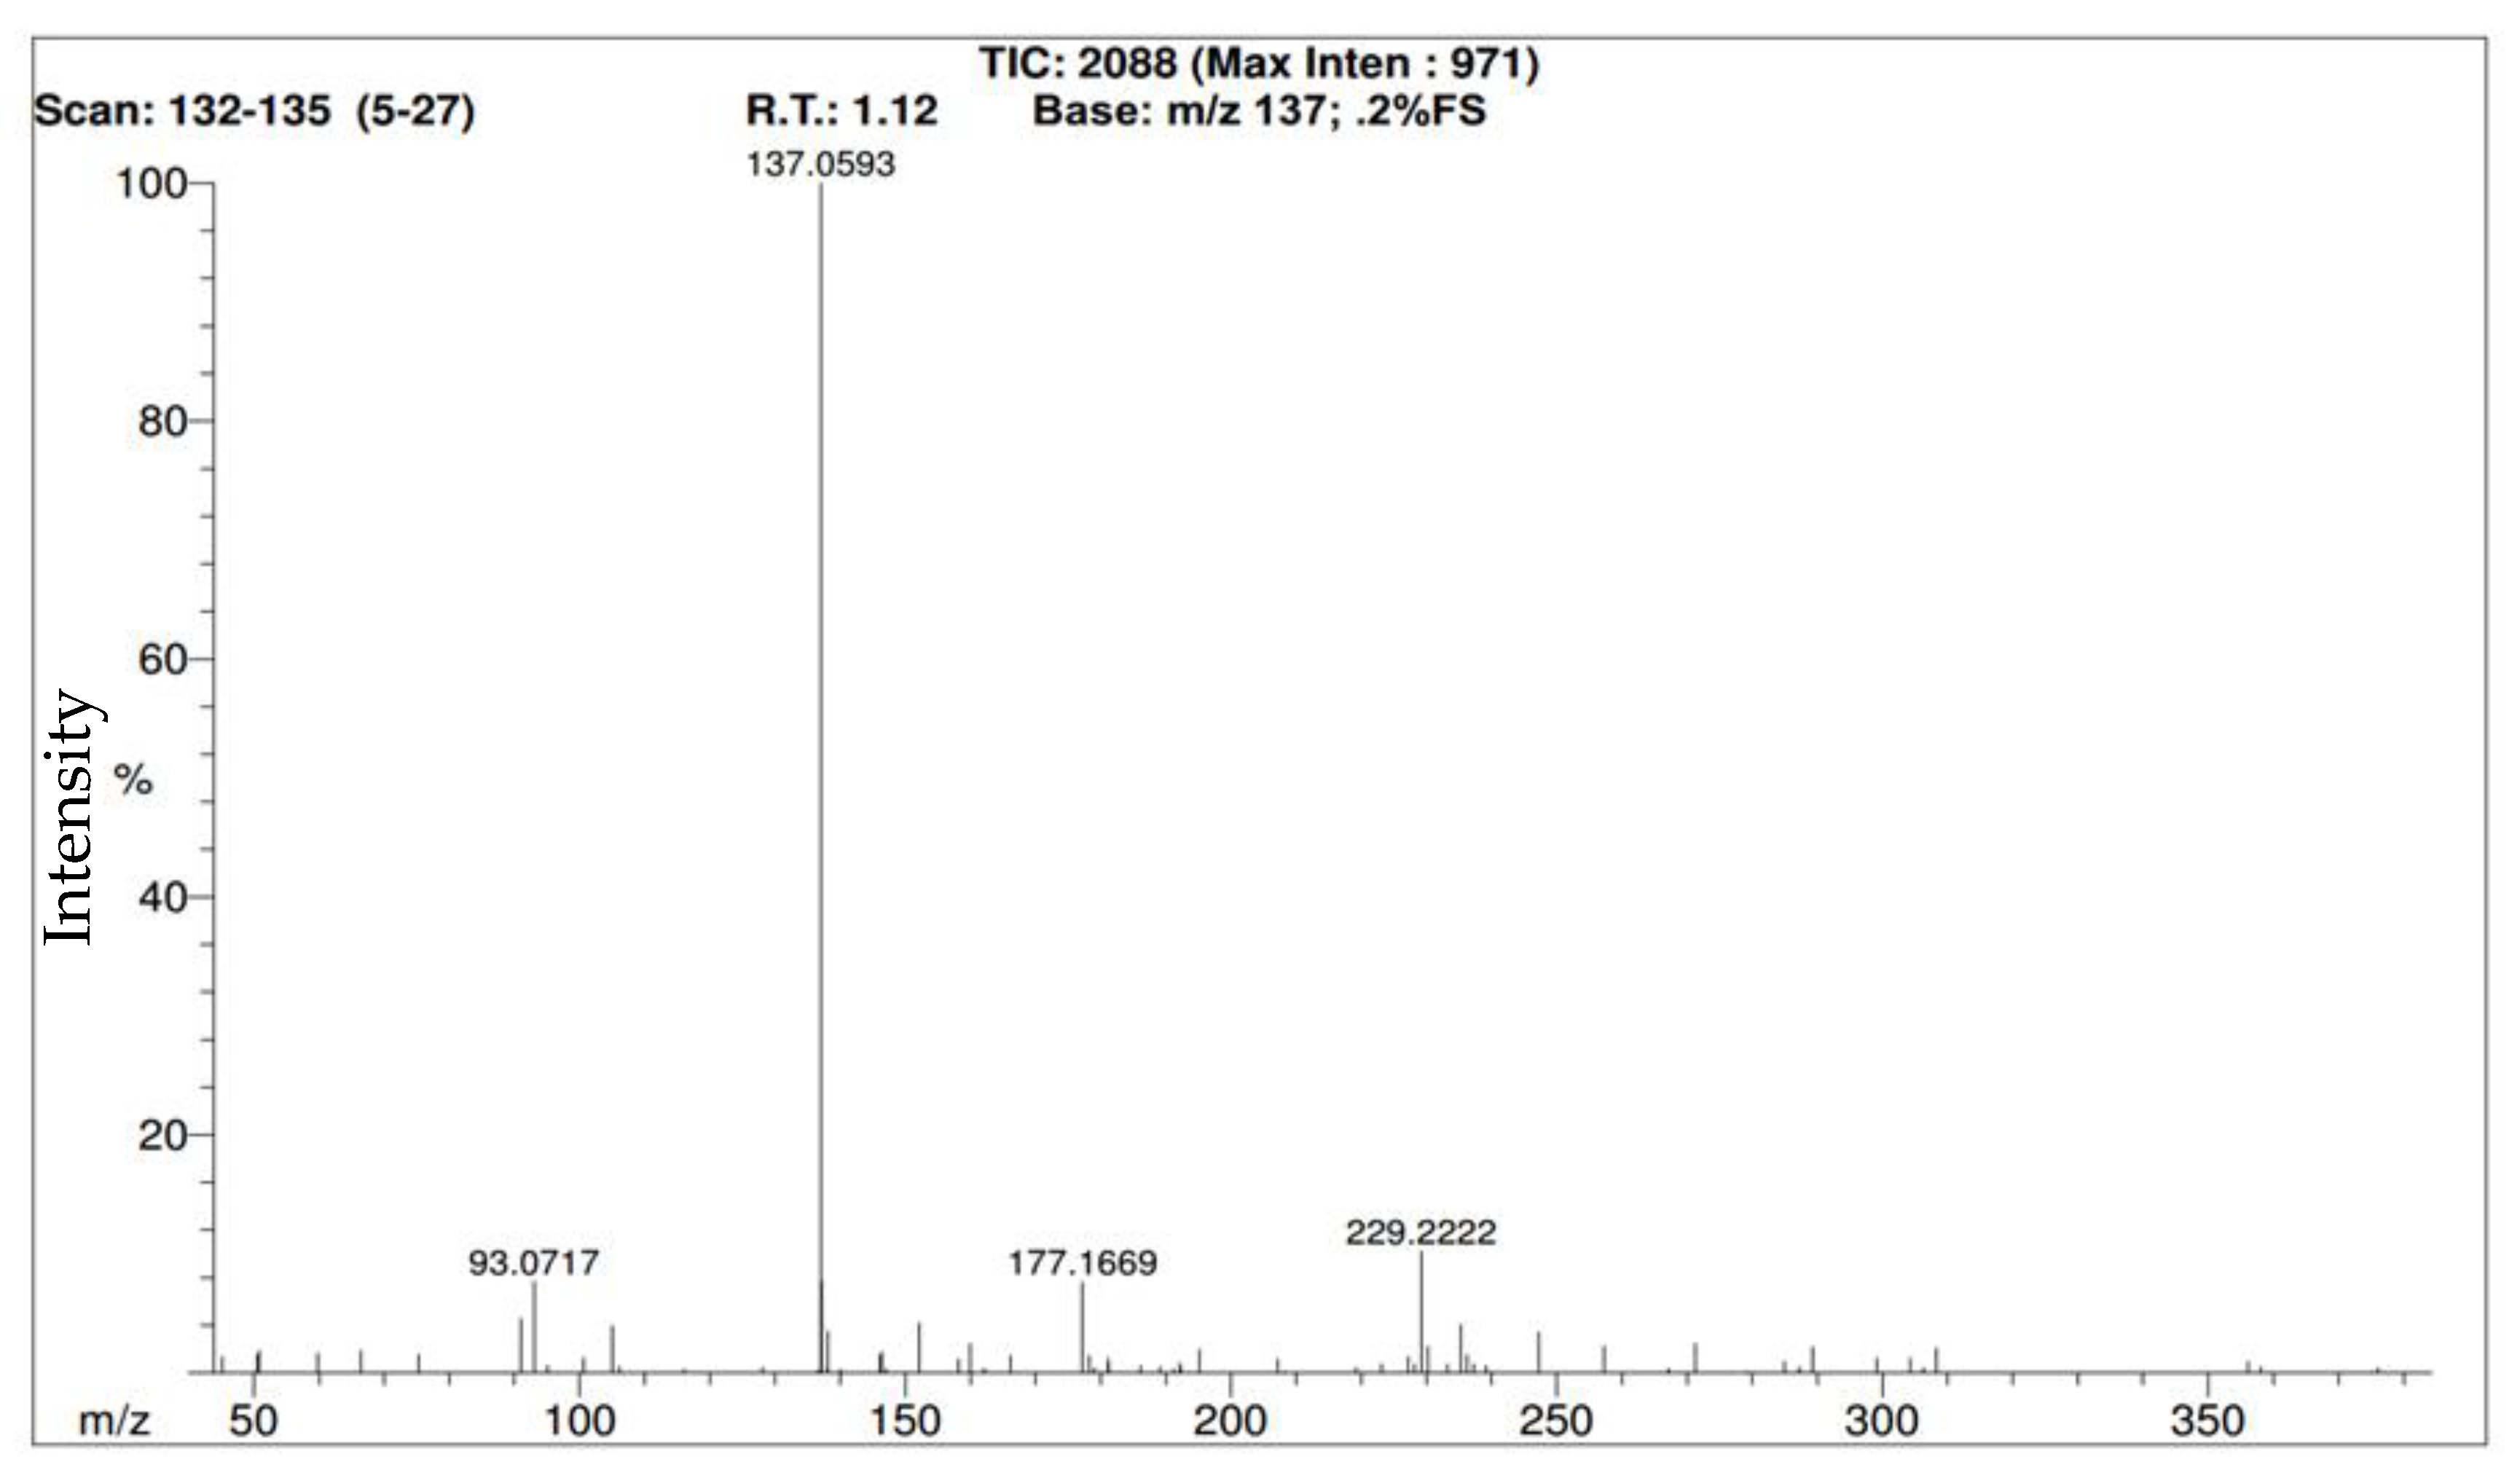
Following the creation of the RIC that shows 137 m/z responses, identifying the moment where the sample was first detected would be the next step. It is important that the observed m/z identified must be within 5 mDa of the theoretical m/z of the sample and the sample peak must not be below 5% in relative intensity.
Figure 3 illustrates the mass spectrum and ‘retention time’ (R.T.) of methyl benzoate when it was first identifiable. In this case, ‘retention time’ is technically incorrect because this is not a chromatographic technique. The software is identifying the moment when a molecule is detected. For trial #1 with methyl benzoate, the vial was opened at the 1:02 (one minute and two seconds) mark and was subsequently identified 5 s later (at 1:07 or 1.12 min). For clarity, please note that the time is both mentioned in (a) minutes and seconds and (b) minutes then fractions of a minute following a period. In trial #2 for methyl benzoate, the RICs are almost identical (
Figure 4), and while the cap was opened at the same time (1:02 min), it took 8 s for methyl benzoate to be detected (1:10 or 1.18 min) as detailed in the mass spectrum in
Figure 5. For trial #3 of methyl benzoate at the same distance, the cap was opened at 1:03 min and was subsequently detected after five seconds at 1:08 (or 1.13) min.
The results from these three trials are summarized in
Table 1. Methyl benzoate was then tested at a distance of 1 m. During trial #1, the run was started and the vial cap was opened after 56 s.
The vial cap was opened for trials #2 and #3 after 1 min and 1 min and 1 s, respectively. The summary for the methyl benzoate results at a distance of 1 m is shown in
Table 2.
The remaining results (methyl benzoate tested at distances 1.5 m, 2 m, and 3 m) are summarized in
Table 3.
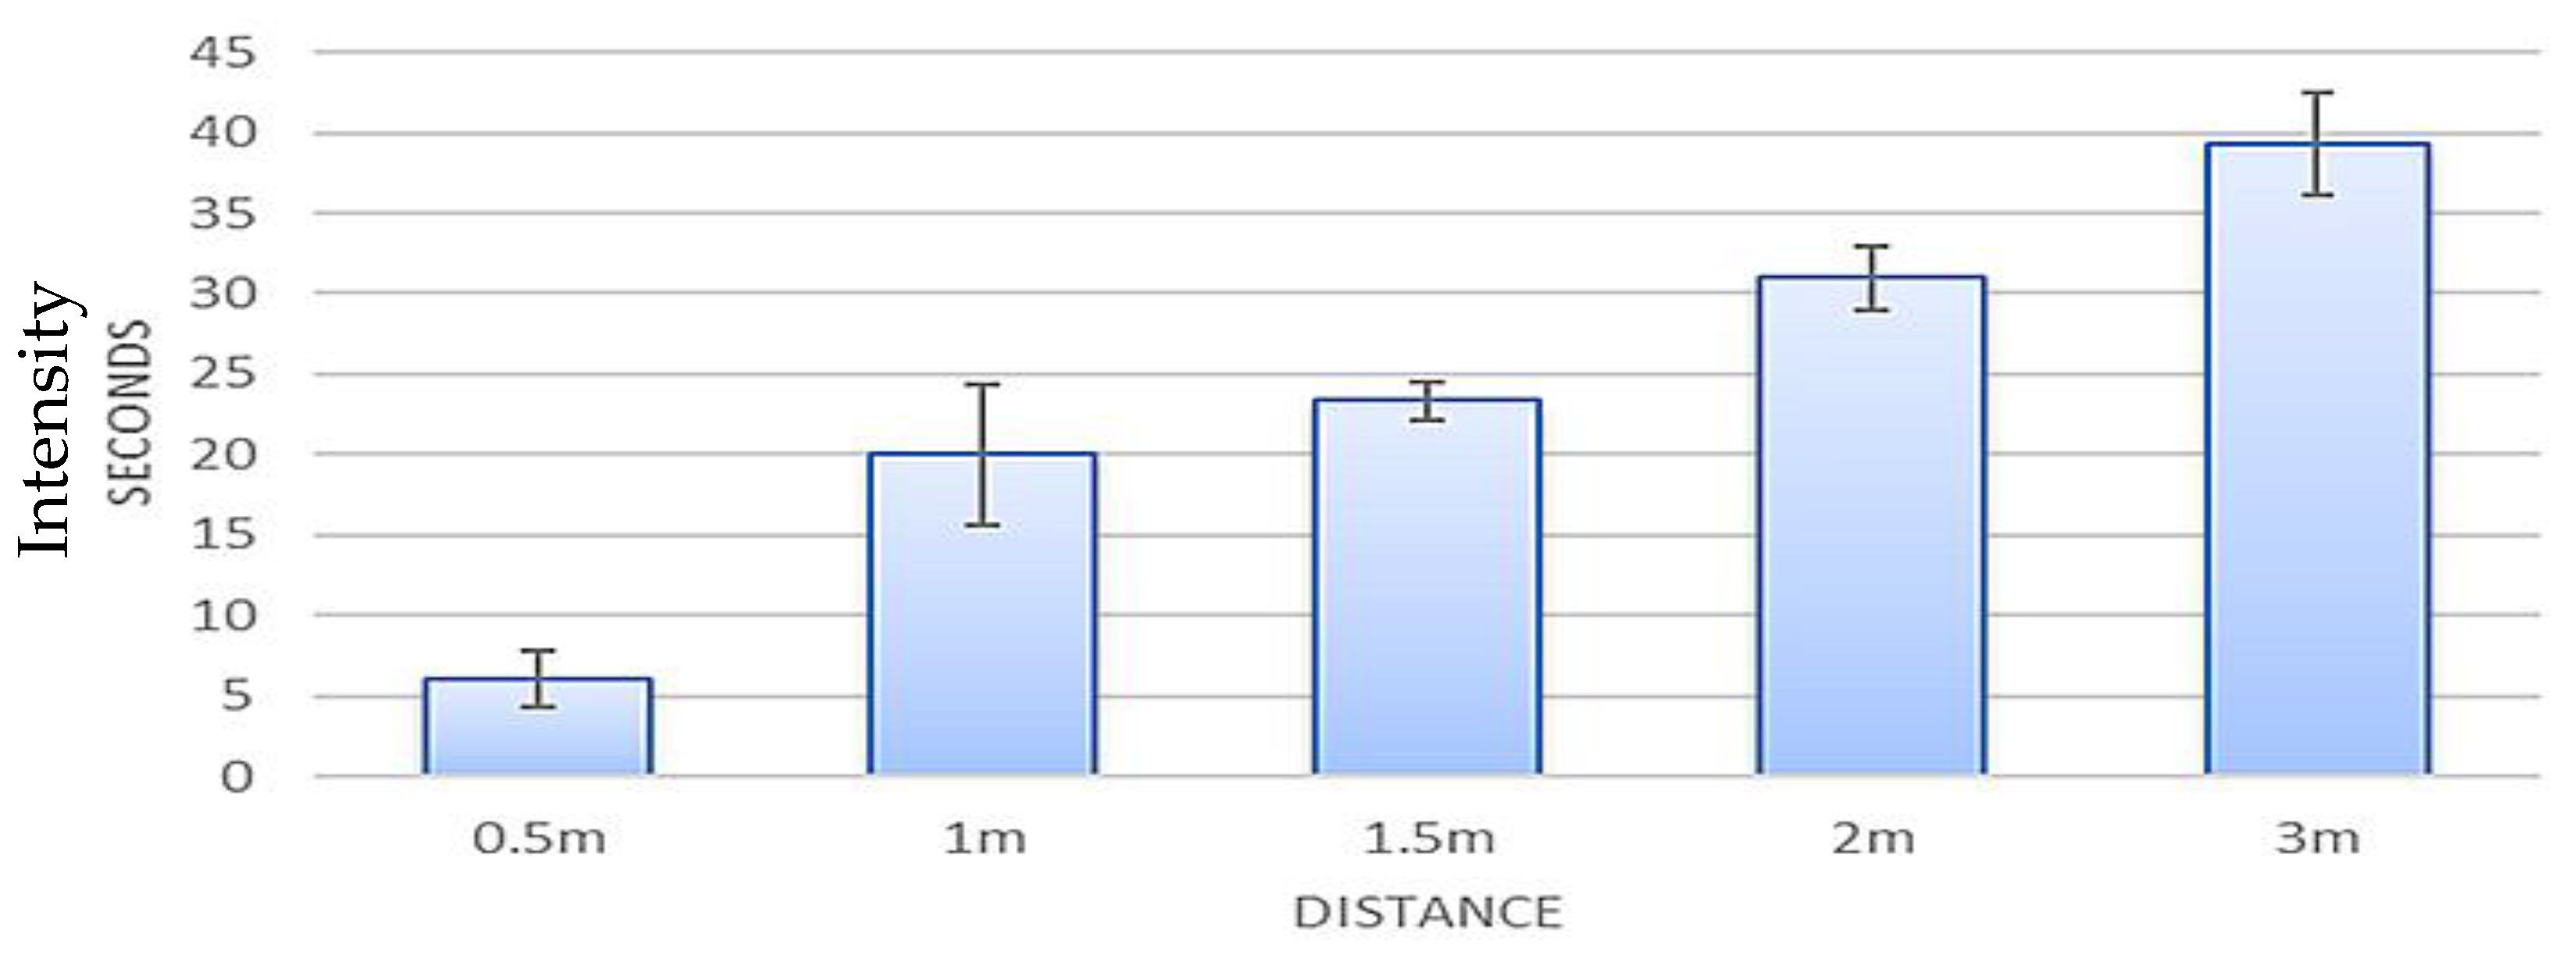
As shown in
Figure 6, methyl benzoate trial results are illustrated at varying distances. Error bars depict the standard deviations, and the averages of all trials were noted by plotting. As the graph shows, as the distance from the ion source increases, the time it takes to detect the sample increases.
3.2. Benzaldehyde
The results using benzaldehyde were comparable to methyl benzoate. In each of the trials, benzaldehyde was detected.
Table 4 shows the data for benzaldehyde at various distances (from 0.5 m through 3 m).
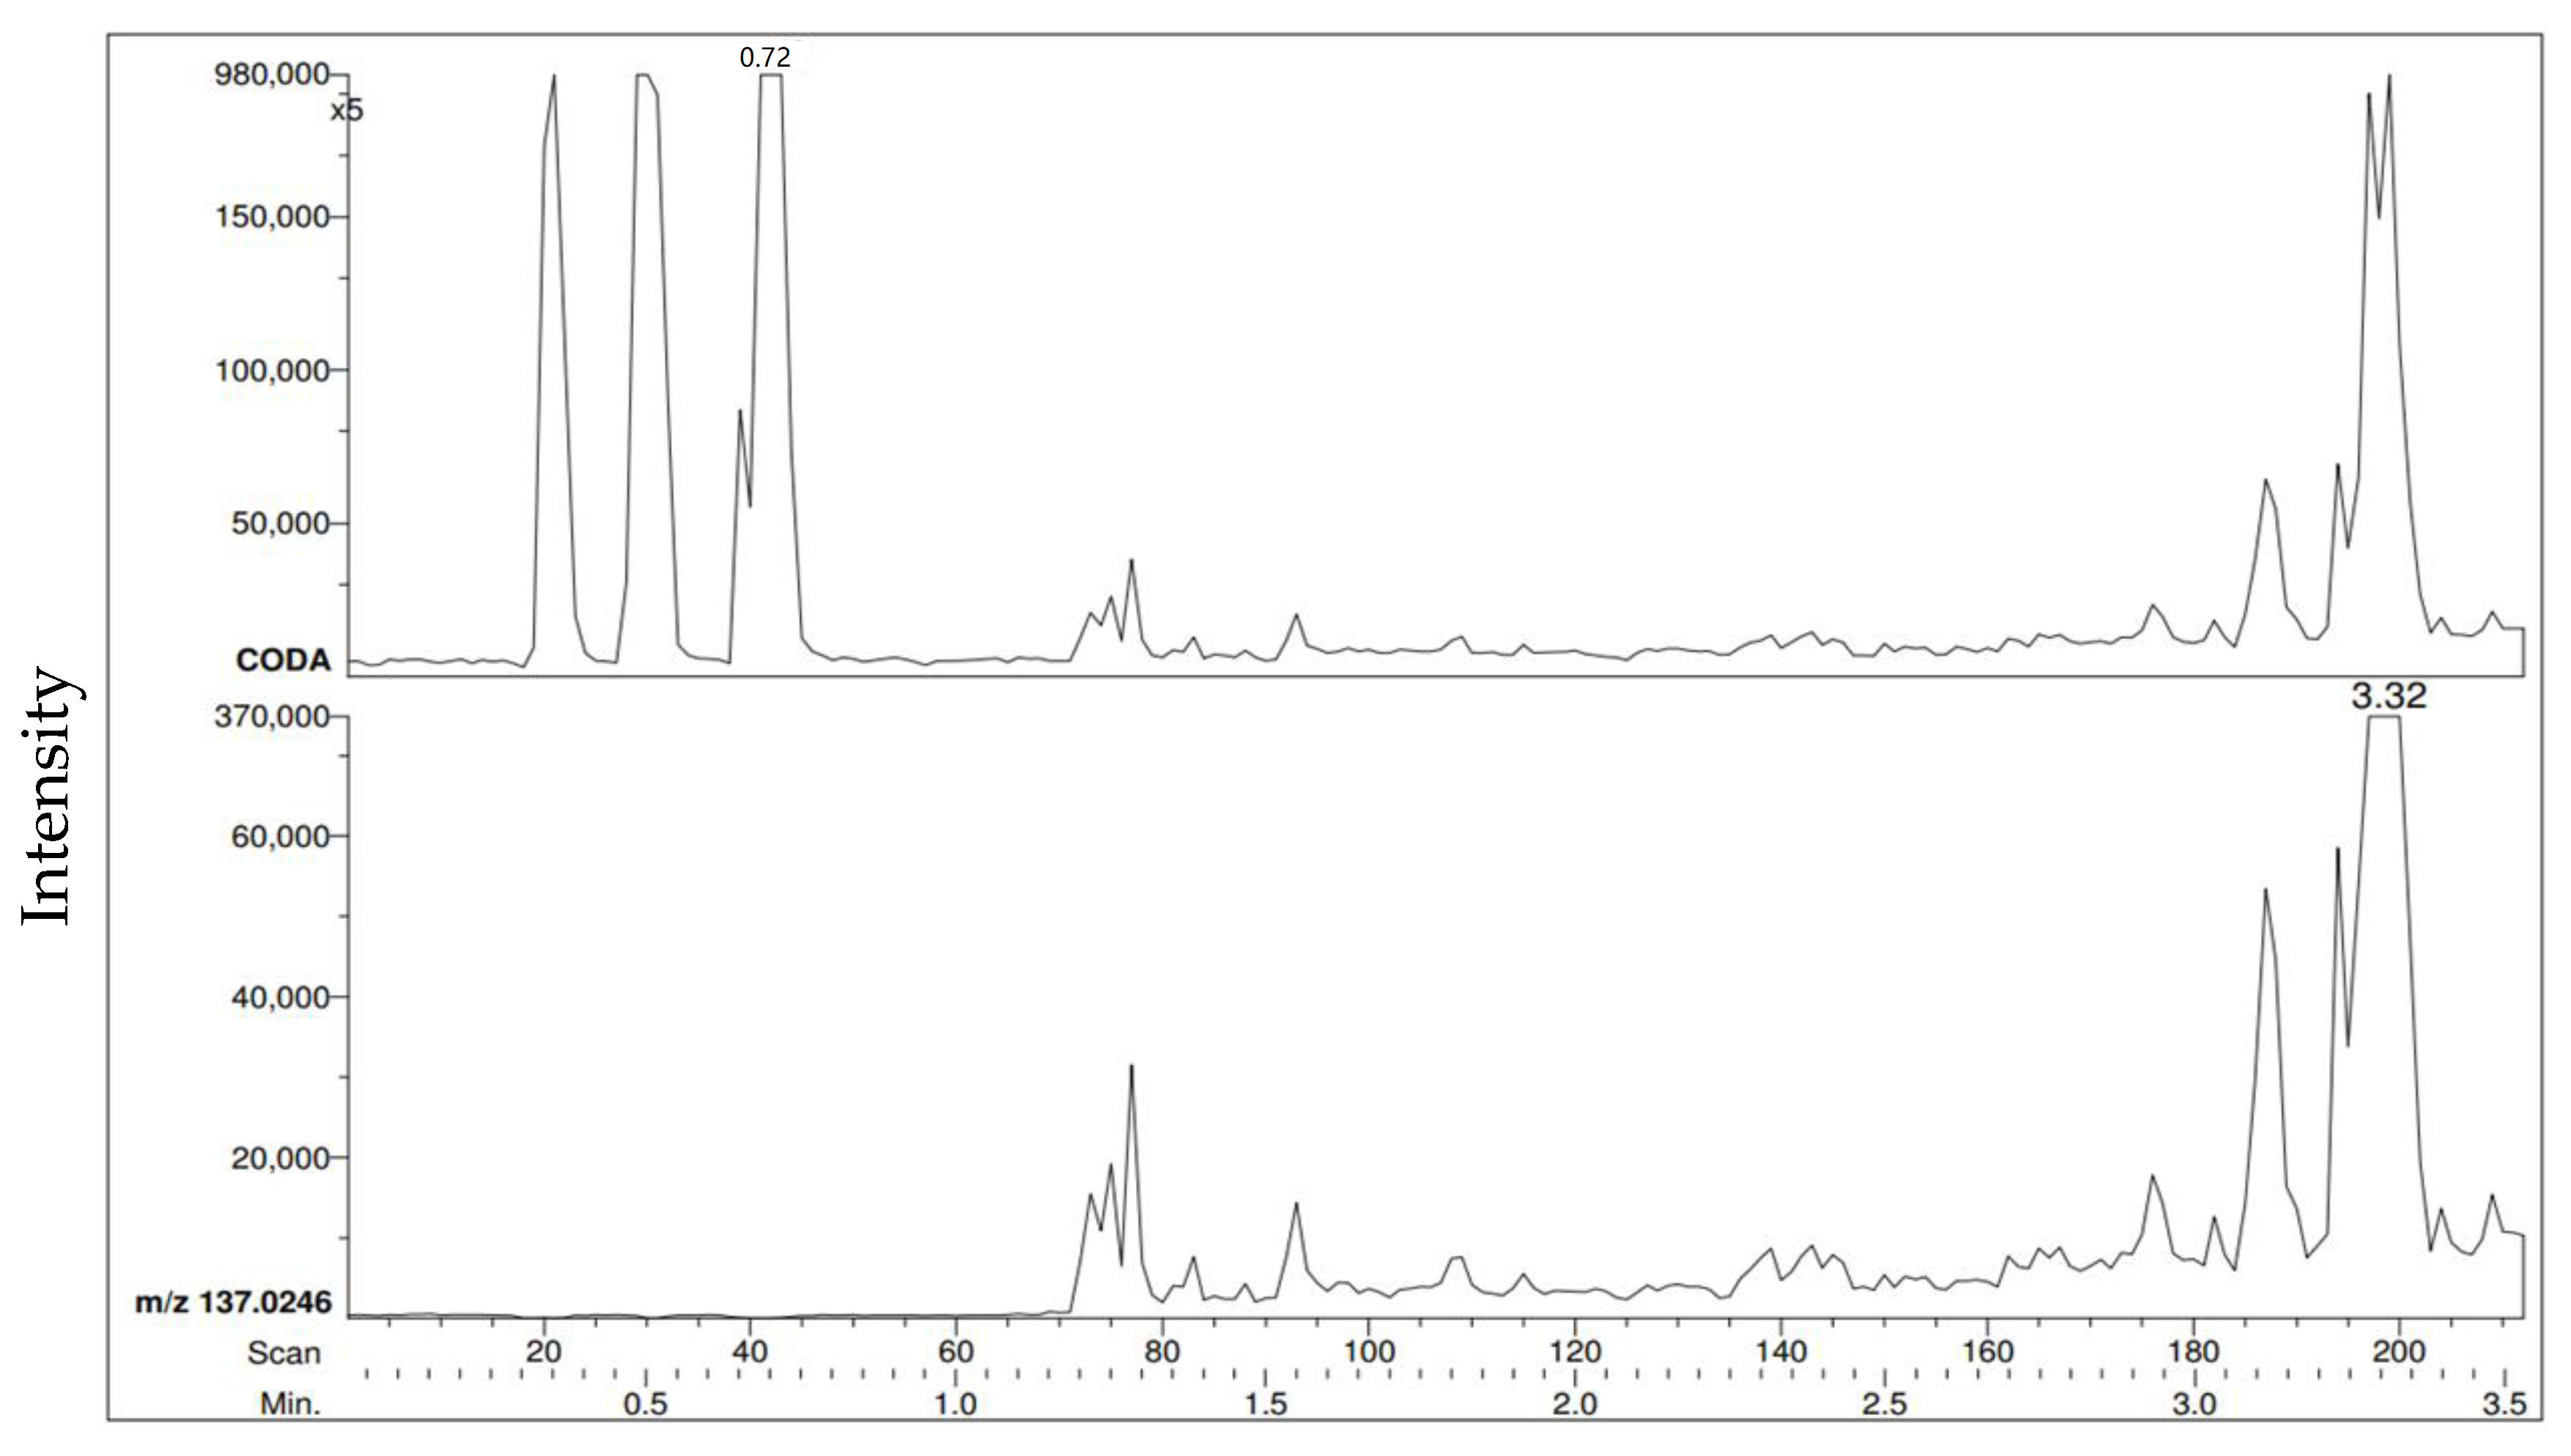
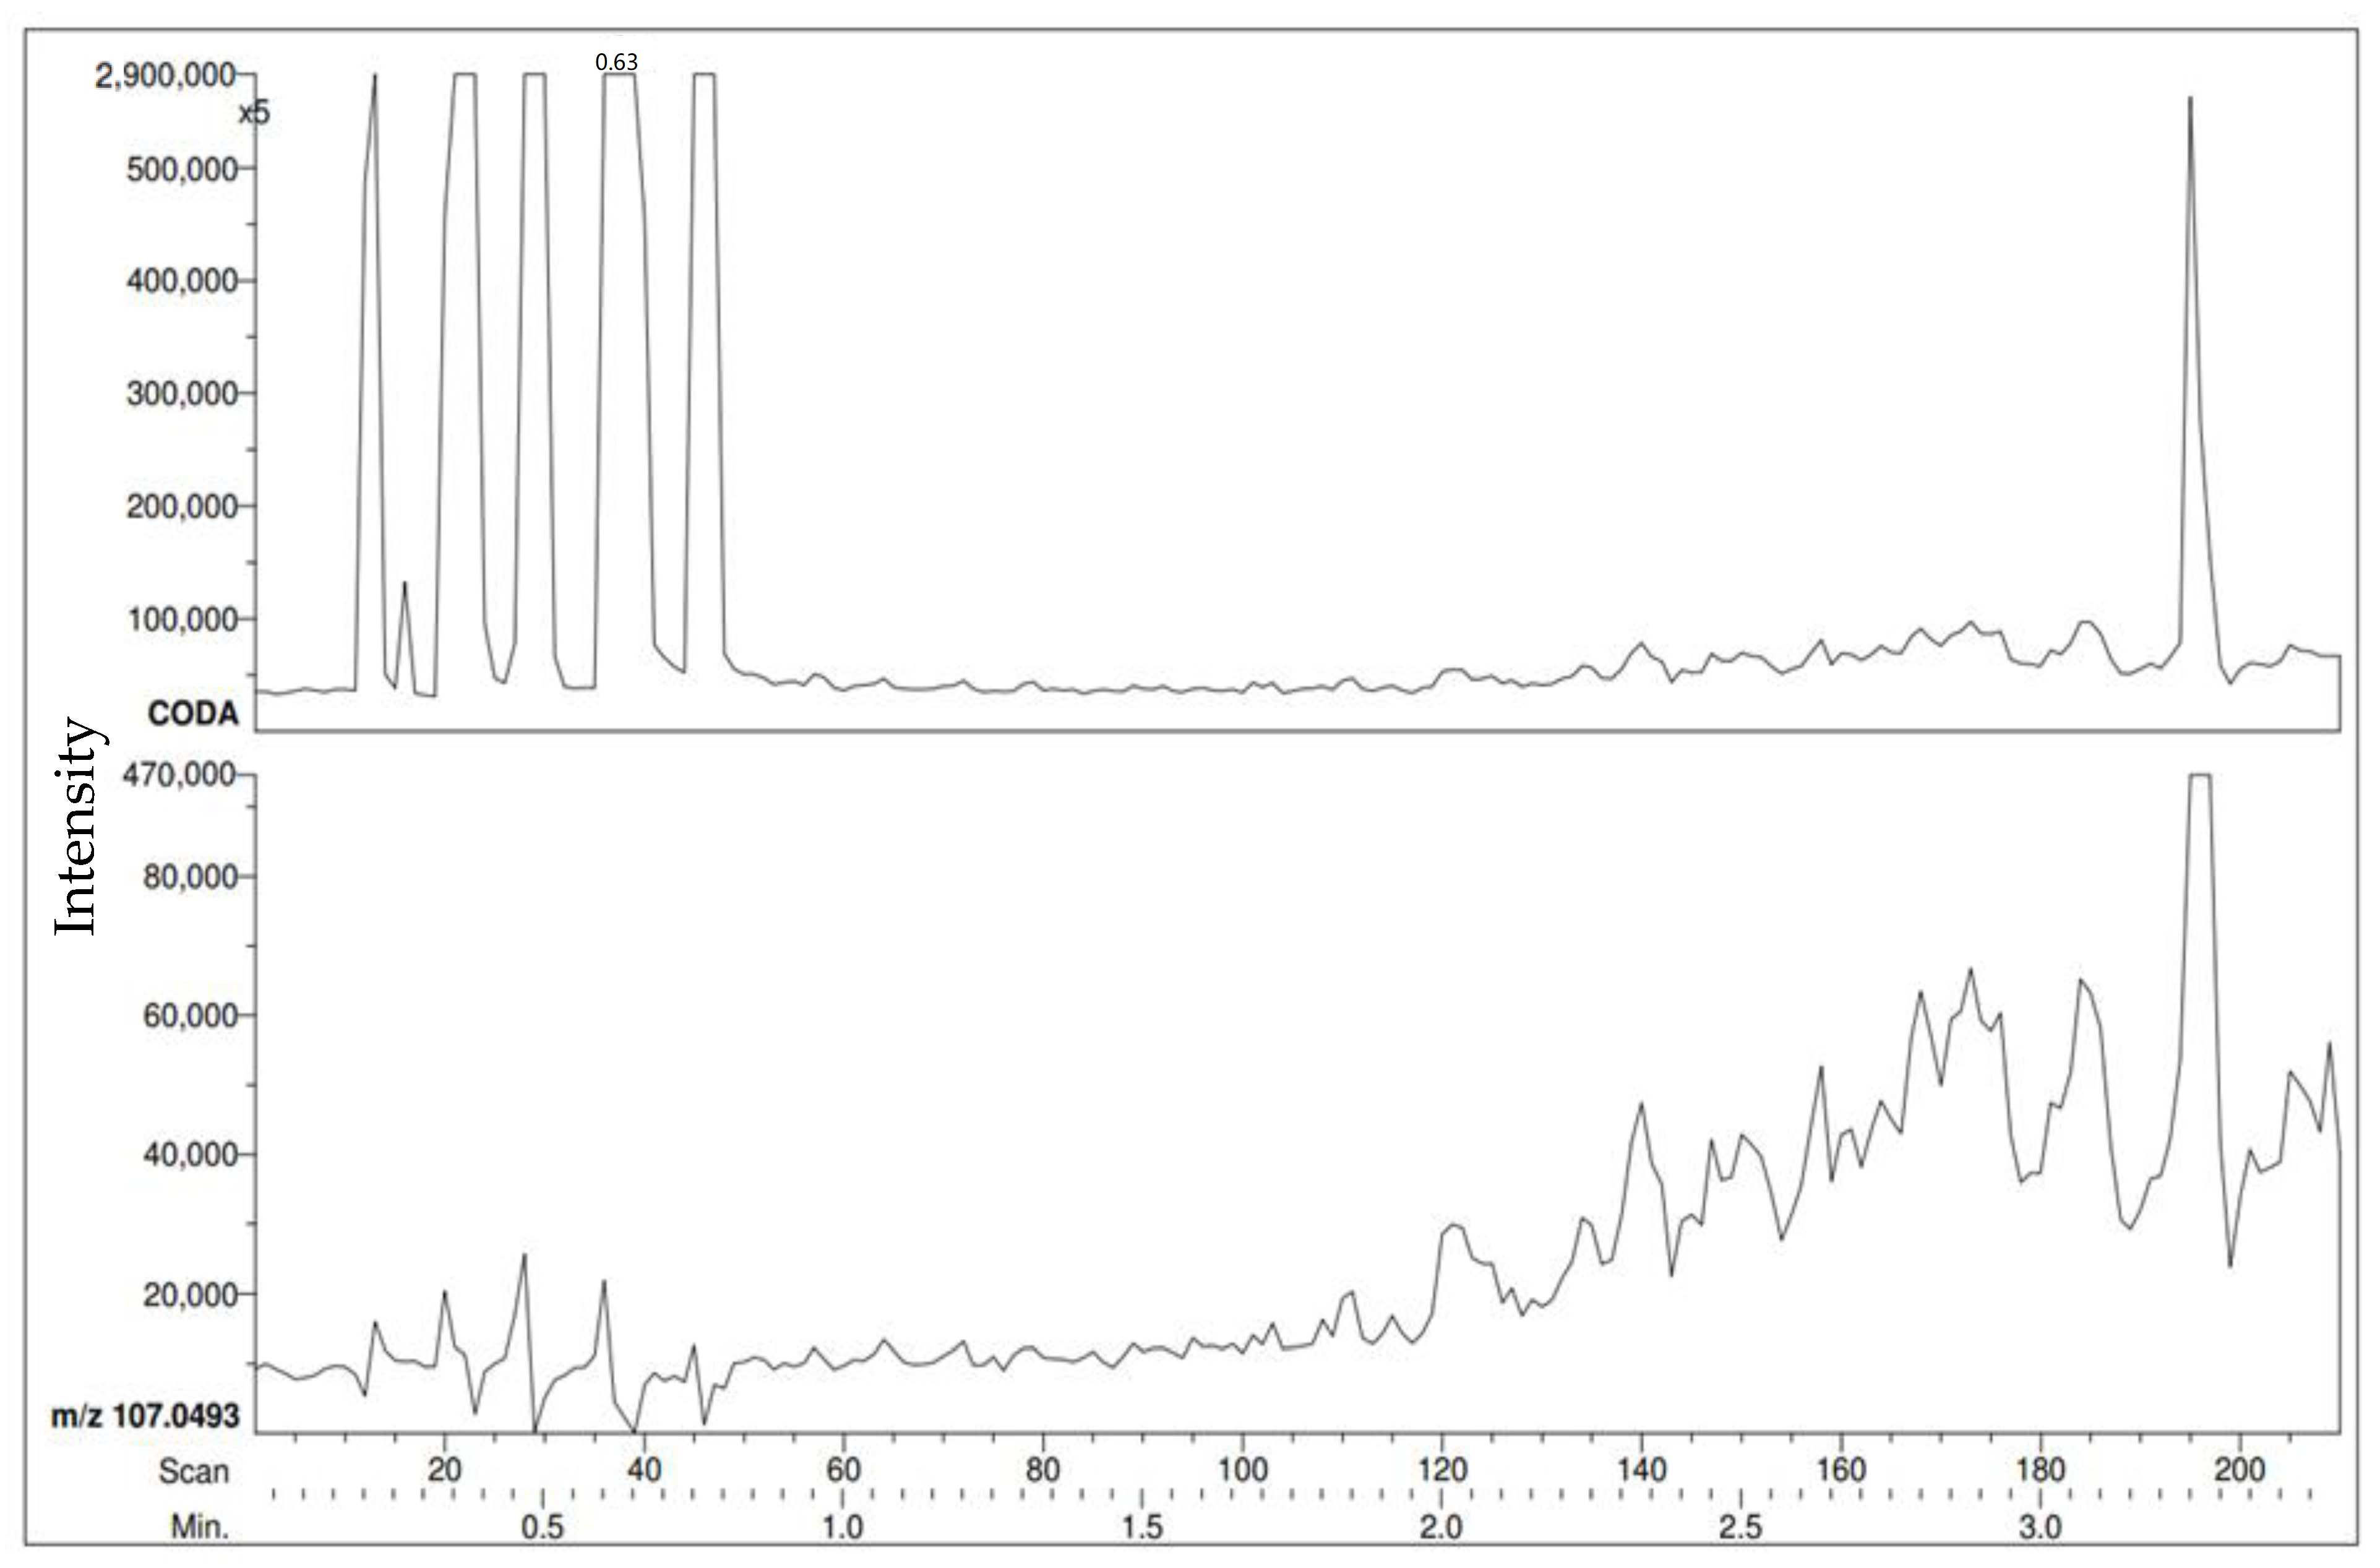
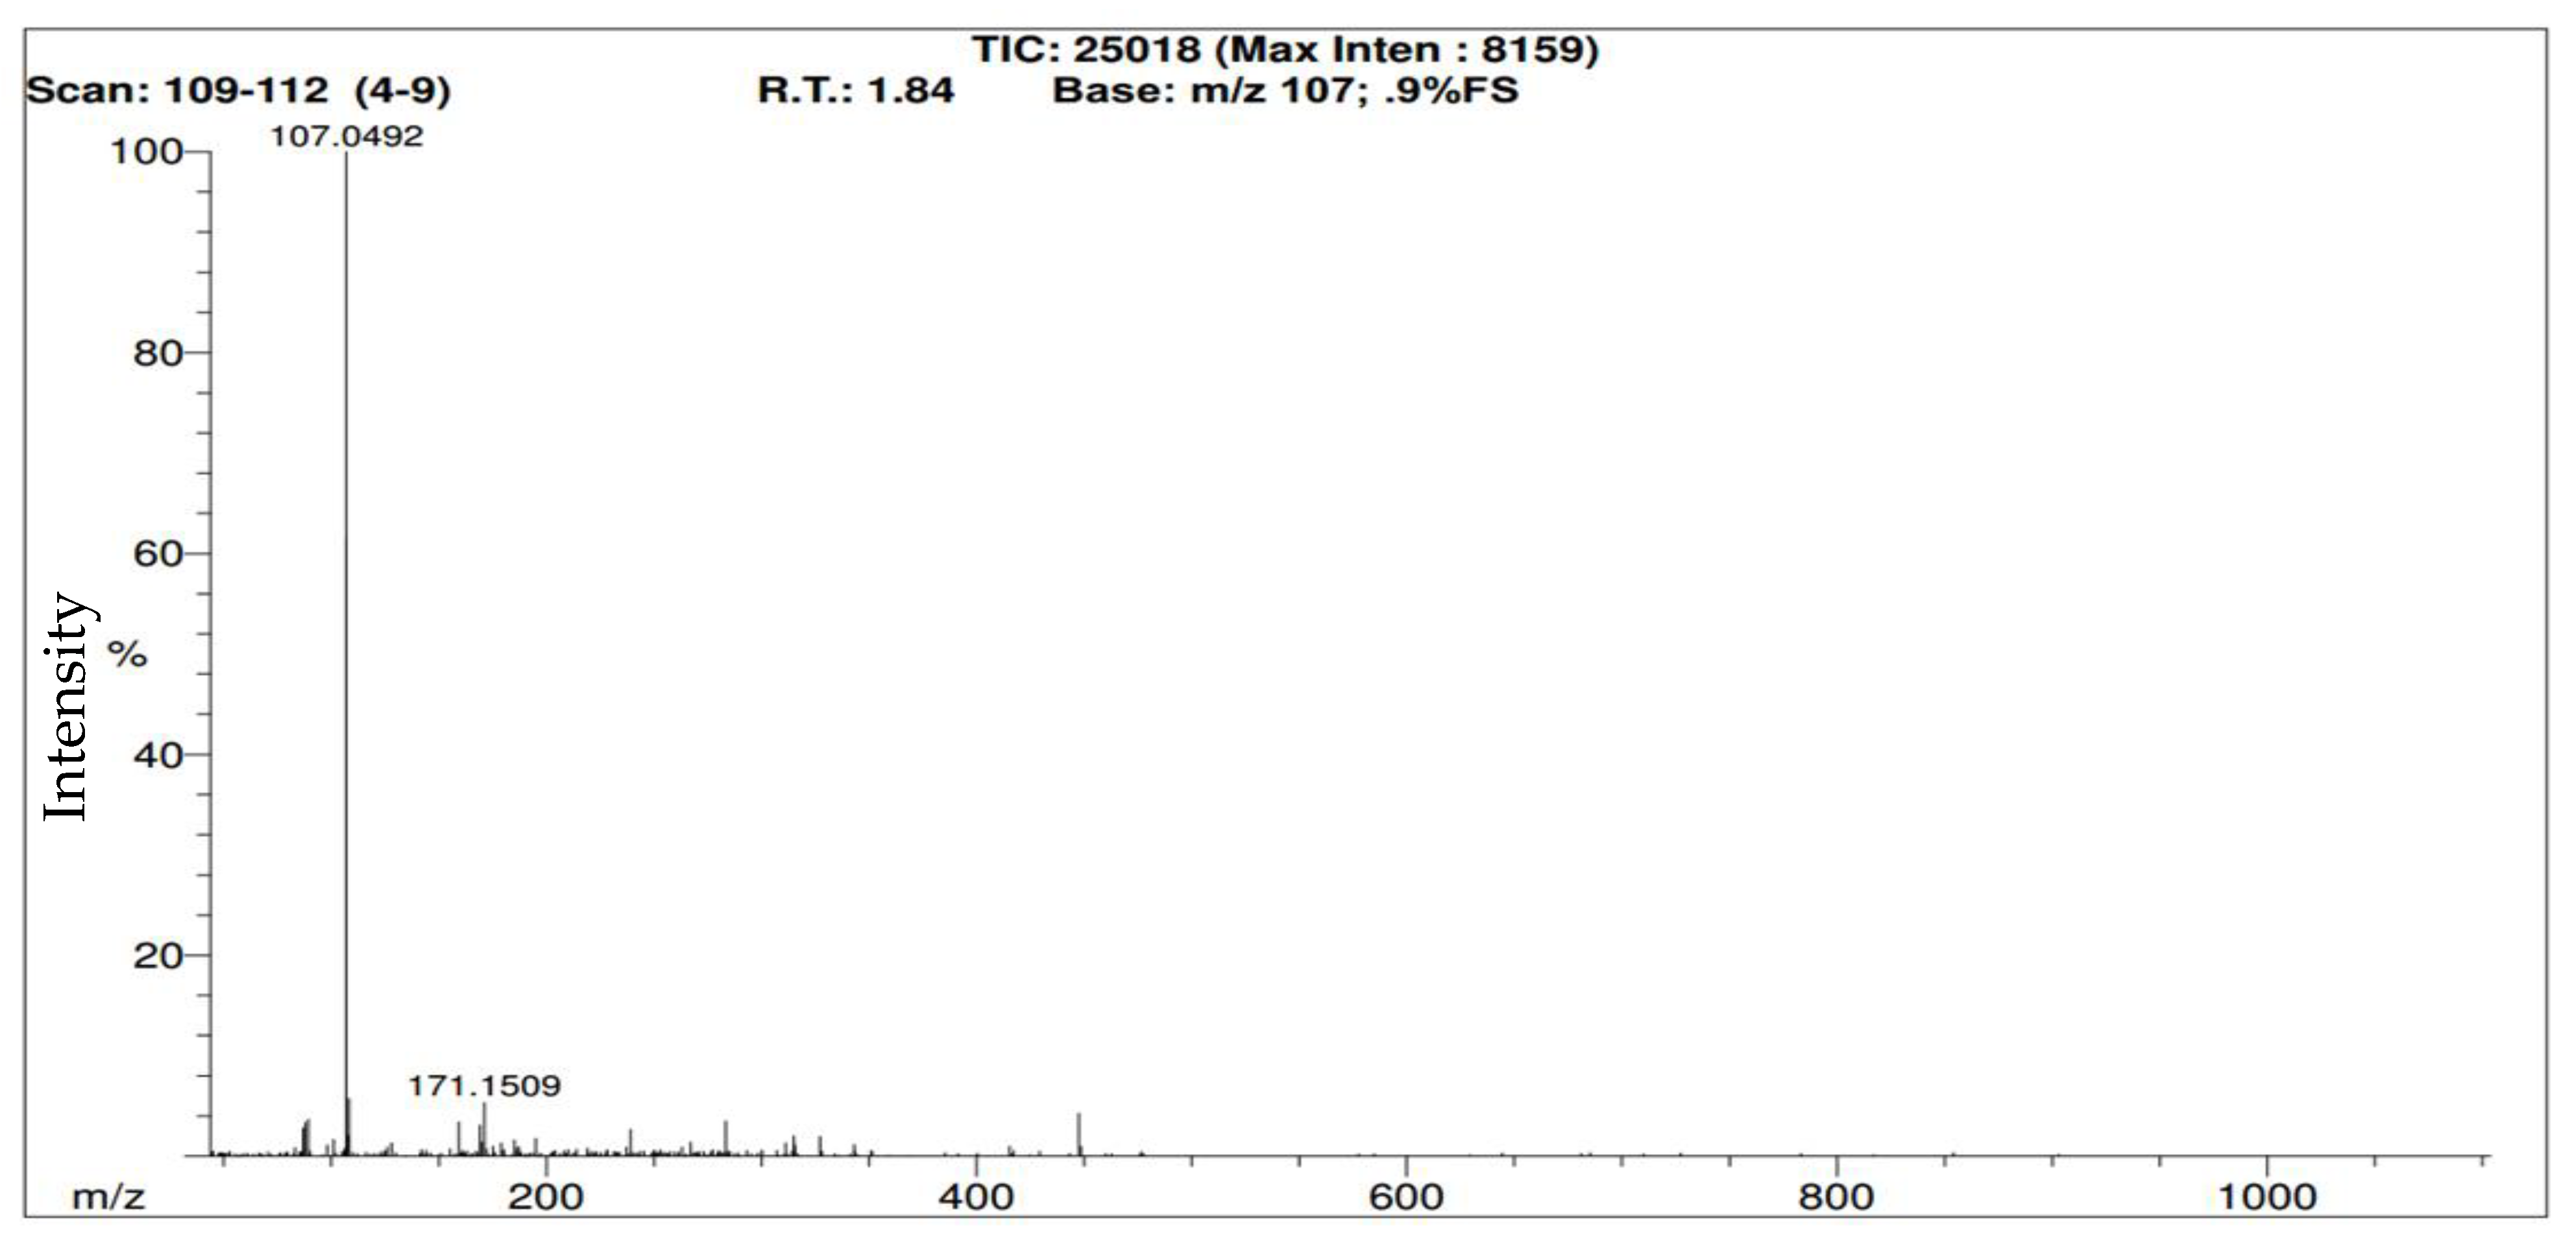
Figure 7 and
Figure 8 show an example of a benzaldehyde RIC and mass spectrum, respectively, at a distance of 2 m. As stated earlier,
Figure 7 illustrates that as the time increased, the intensity of the volatiles detected also increased. In this specific example, it took 44 s for benzaldehyde to be initially detected after the vial cap was opened.
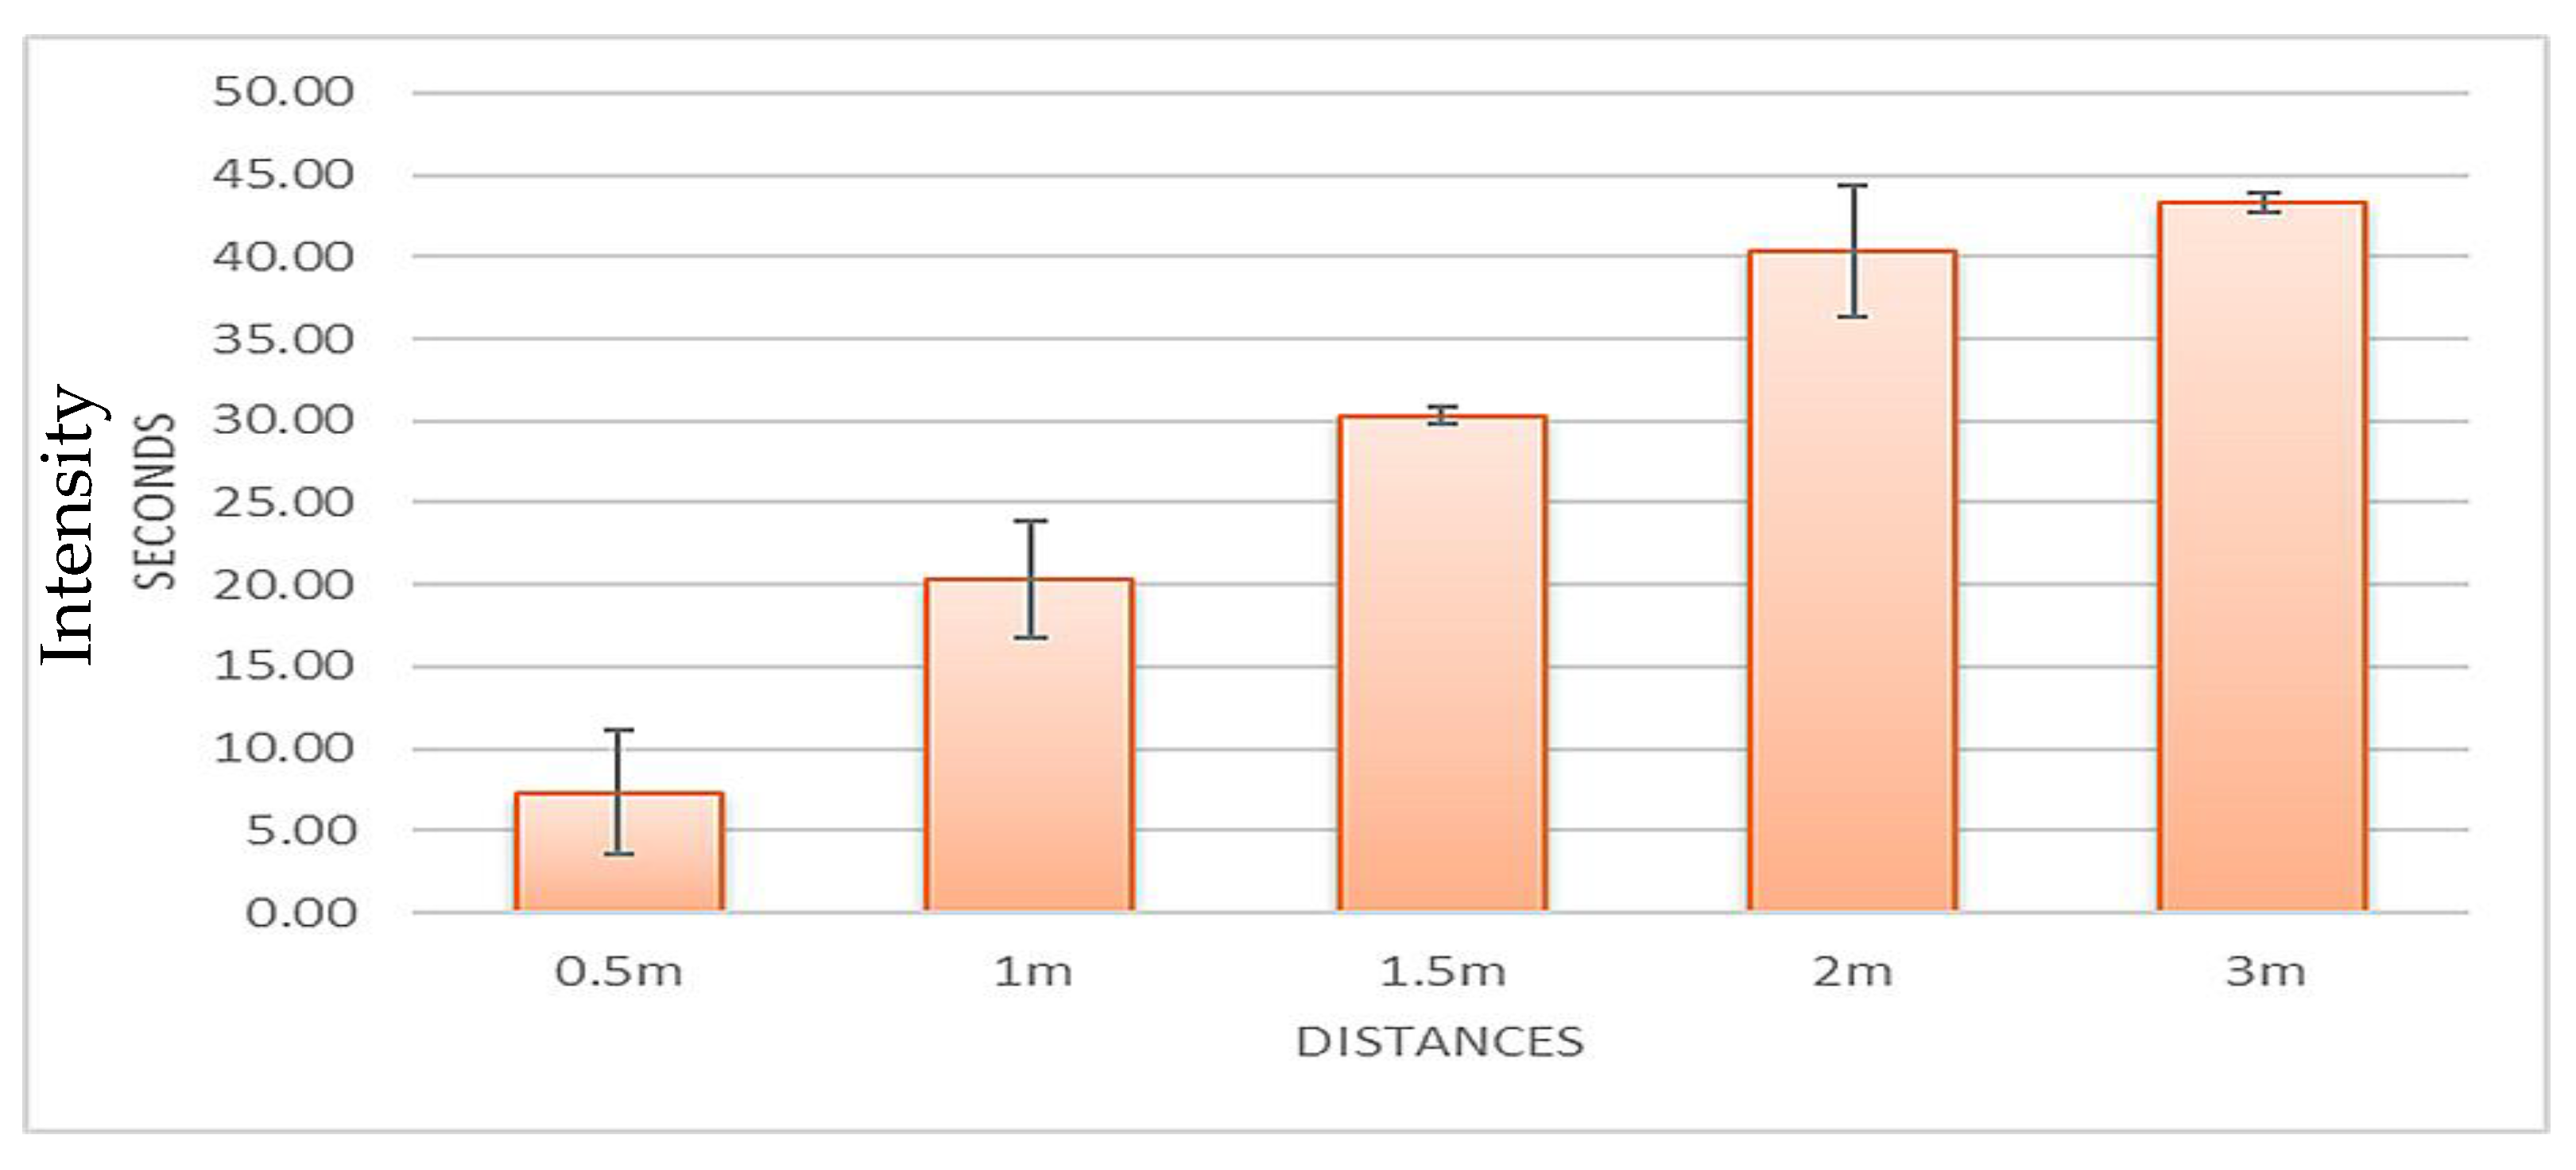
The data from
Table 4 was calculated by taking the average at each distance and then calculating the standard deviation, and the data are plotted in
Figure 9. At 0.5 m, it took 7.3 ± 3.8 s for benzaldehyde to be initially detected; at 1 m, it took 20.3 ± 3.5 s; at 1.5 m, it took 30.3 ± 0.6 s; at 2 m, it took 40.3 ± 4.0 s; and at 3 m, it took 43.3 ± 0.6 s.
4. Conclusions
The primary purpose of this study was to determine if the proximity of illicit substances in an area could prompt unconfirmed alerts made by canines in training. The two narcotic odorants selected for this study were methyl benzoate (cocaine) and benzaldehyde (methamphetamine). The hypothesis of this study was supported in that specific odorants do not need substantial time to travel from one location to another. The time required for methyl benzoate to travel 1.5 m was approximately 23 s on average. Approximately 30 s were needed for benzaldehyde to travel the same distance. It is important to note that the outcomes are based on what the instrument could detect. A canine’s ability to smell is more sensitive to these odors, so the values calculated in this study could serve as an upper limit; canines could presumably detect these odors sooner.
Author Contributions
T.A.Z.: Software, Data curation, and Writing—Original draft preparation; K.G.F.: Conceptualization, Supervision, and Methodology; H.K.H.: Writing—Reviewing and Editing; M.R.P.: Software and Validation. All authors have read and agreed to the published version of the manuscript.
Funding
This research received no external funding.
Institutional Review Board Statement
Not applicable.
Informed Consent Statement
Not applicable.
Data Availability Statement
Not applicable.
Acknowledgments
The authors would like to thank the Forensic Science Department at Virginia Commonwealth University for their cooperation and collaboration by allowing this research to be conducted at their facilities. The authors would also like to thank John Benson for his help during this project.
Conflicts of Interest
The authors declare that they have no conflict of interest.
References
- Kokocińska-Kusiak, A.; Woszczyło, M.; Zybala, M.; Maciocha, J.; Barłowska, K.; Dzięcioł, M. Canine Olfaction: Physiology, Behavior, and Possibilities for Practical Applications. Animals 2021, 11, 2463. [Google Scholar] [CrossRef] [PubMed]
- Curran, A.M.; Prada, P.A.; Furton, K.G. Canine human scent identifications with post-blast debris collected from improvised explosive devices. Forensic Sci. Int. 2010, 199, 103–108. [Google Scholar] [CrossRef] [PubMed]
- Lorenzo, N.; Wan, T.; Harper, R.J.; Hsu, Y.-L.; Chow, M.; Rose, S.; Furton, K.G. Laboratory and field experiments used to identify Canis lupus var. familiaris active odor signature chemicals from drugs, explosives, and humans. Anal. Bioanal. Chem. 2003, 376, 1212–1224. [Google Scholar] [CrossRef] [PubMed]
- Perr, J.M.; Furton, K.G.; Almirall, J.R. Application of a SPME-IMS detection system for explosives detection. Proc. SPIE 2005, 5778, 667–672. [Google Scholar] [CrossRef]
- Kranz, W.; Kitts, K.; Strange, N.; Cummins, J.; Lotspeich, E.; Goodpaster, J. On the smell of Composition C-4. Forensic Sci. Int. 2014, 236, 157–163. [Google Scholar] [CrossRef]
- Powell, N.A.; Ruffell, A.; Arnott, G. The Untrained Response of Pet Dogs to Human Epileptic Seizures. Animals 2021, 11, 2267. [Google Scholar] [CrossRef]
- Furton, K.G.; Hong, Y.-C.; Hsu, Y.-L.; Luo, T.; Rose, S.; Walton, J. Identification of odor signature chemicals in cocaine using solid-phase microextraction-gas chromatography and detector-dog response to isolated compounds spiked on U.S. paper currency. J. Chromatogr. Sci. 2002, 40, 147–155. [Google Scholar] [CrossRef] [Green Version]
- Furton, K.; Greb, J.; Holness, H. Scientific Working Group on Dog and Orthogonal Detector Guidelines (SWGDOG). 2010; 155p. Available online: https://www.ojp.gov/pdffiles1/nij/grants/231952.pdf (accessed on 14 January 2022).
- Macias, M. The Development of an Optimized System of Narcotic and Explosive Contraband Mimics for Calibration and Training of Biological Detectors. Ph.D. Thesis, Florida International University, Miami, FL, USA, 2009. [Google Scholar] [CrossRef]
- Hsu, Y.-L. Correlation of Detector Dog Alerts to Cocaine Decomposition Products Found in Illicit Forensic Specimens. Master’s Thesis, Florida International University, Miami, FL, USA, 1998; pp. 1–154. [Google Scholar]
- Vu, D.T. SPME/GC-MS characterization of volatiles associated with methamphetamine: Toward the development of a pseudomethamphetamine training material. J. Forensic Sci. 2001, 46, 1014–1024. [Google Scholar] [CrossRef]
- Pavlovich, M.J.; Musselman, B.; Hall, A.B. Direct analysis in real time—Mass spectrometry (DART-MS) in forensic and security applications. Mass Spectrom. Rev. 2018, 37, 171–187. [Google Scholar] [CrossRef]
- Zughaibi, T.A.; Steiner, R.R. Differentiating Nylons Using Direct Analysis in Real Time Coupled to an AccuTOF Time-of-Flight Mass Spectrometer. J. Am. Soc. Mass Spectrom. 2020, 31, 982–985. [Google Scholar] [CrossRef]
- Zughaibi, T.A.; Steiner, R.R. Forensic Analysis of Polymeric Carpet Fibers Using Direct Analysis in Real Time Coupled to an AccuTOF™ Mass Spectrometer. Polymers 2021, 13, 2687. [Google Scholar] [CrossRef] [PubMed]
- Swider, J.R. Optimizing accu time-of-flight/direct analysis in real time for explosive residue analysis. J. Forensic Sci. 2013, 58, 1601–1606. [Google Scholar] [CrossRef] [PubMed]
- Jones, R.W.; McClelland, J.F. Analysis of writing inks on paper using direct analysis in real time mass spectrometry. Forensic Sci. Int. 2013, 231, 73–81. [Google Scholar] [CrossRef] [PubMed] [Green Version]
- Jones, R.W.; Cody, R.B.; McClelland, J.F. Differentiating writing inks using direct analysis in real time mass spectrometry. J. Forensic Sci. 2006, 51, 915–918. [Google Scholar] [CrossRef] [PubMed] [Green Version]
- Chernetsova, E.S.; Morlock, G.E. Determination of drugs and drug-like compounds in different samples with direct analysis in real time mass spectrometry. Mass Spectrom. Rev. 2011, 30, 875–883. [Google Scholar] [CrossRef]
- Nilles, J.M.; Connell, T.R.; Durst, H.D. Quantitation of chemical warfare agents using the direct analysis in real time (DART) technique. Anal. Chem. 2009, 81, 6744–6749. [Google Scholar] [CrossRef]
- Steiner, R.R.; Larson, R.L. Validation of the direct analysis in real time source for use in forensic drug screening. J. Forensic Sci. 2009, 54, 617–622. [Google Scholar] [CrossRef]
- Lesiak, A.D.; Shepard, J.R. Recent advances in forensic drug analysis by DART-MS. Bioanalysis 2014, 6, 819–842. [Google Scholar] [CrossRef]
- Sisco, E.; Dake, J.; Bridge, C. Screening for trace explosives by AccuTOF™-DART®: An in-depth validation study. Forensic Sci. Int. 2013, 232, 160–168. [Google Scholar] [CrossRef]
- DeRoo, C.S.; Armitage, R.A. Direct identification of dyes in textiles by direct analysis in real time-time of flight mass spectrometry. Anal. Chem. 2011, 83, 6924–6928. [Google Scholar] [CrossRef]
- Busman, M.; Roberts, E.; Proctor, R.H.; Maragos, C.M. Volatile Organic Compound Profile Fingerprints Using DART–MS Shows Species-Specific Patterns in Fusarium Mycotoxin Producing Fungi. J. Fungi 2021, 8, 3. [Google Scholar] [CrossRef] [PubMed]
- Simon, S.L.; Domier, C.P.; Sim, T.; Richardson, K.; Rawson, R.A.; Ling, W. Cognitive performance of current methamphetamine and cocaine abusers. J. Addict. Dis. 2002, 21, 61–74. [Google Scholar] [CrossRef] [PubMed]
| Publisher’s Note: MDPI stays neutral with regard to jurisdictional claims in published maps and institutional affiliations. |
© 2022 by the authors. Licensee MDPI, Basel, Switzerland. This article is an open access article distributed under the terms and conditions of the Creative Commons Attribution (CC BY) license (https://creativecommons.org/licenses/by/4.0/).
