Article

Reintroduction of Indian Grey Hornbills in Gir, India: Insights into Ranging, Habitat Use, Nesting and Behavioural Patterns

1
Wildlife Division, Sasan-Gir, Junagadh 362135, India
2
The Corbett Foundation, P.O. Tera, Taluka Abdasa, Kutch 370660, India
3
Wildlife Circle, Junagadh 362001, India
4
Chief Wildlife Warden, Aranya Bhavan, Sector 10, Gandhinagar 382010, India
*
Author to whom correspondence should be addressed.
Birds 2025, 6(4), 58; https://doi.org/10.3390/birds6040058 (registering DOI)
Submission received: 20 August 2025 / Revised: 21 October 2025 / Accepted: 22 October 2025 / Published: 24 October 2025

Simple Summary

The Indian Grey Hornbill faced local extinction in the Gir National Park and Sanctuary, India, between 1950 and 1960. Indian Grey Hornbills were reintroduced in two phases: Twenty-eight birds were reintroduced in the first phase between 2021 and 2022, and 12 in the second phase during 2023. Five male birds were deployed with Platform Transmitter Terminal/Global System for Mobile Communications PTT/GSM transmitters during the first phase, and six more male birds were deployed with PTTs during the second phase. Birds exhibited significant exploratory behaviour during the initial phase of reintroduction and later settled within small areas. Four pairs of these birds were found breeding in the area, and focal bird sampling was used to record their breeding behaviour. To establish a sustainable population, the reintroduced individuals must successfully form pair bonds and establish nesting sites. A noteworthy outcome of this study was the successful breeding observed in one hornbill pair during the initial year of reintroduction, with an increase to three breeding pairs in the subsequent year.

Abstract

Reintroduction efforts of wildlife species seek to re-establish self-sustaining populations of targeted species within their historical ranges. Our study focuses on the Indian Grey Hornbill, which faced local extinction in the Gir National Park and Sanctuary, Gujarat, India. The last recorded direct sighting of the Indian Grey Hornbill in the study area dates back to the 1930s. Its presence gradually declined, leading to its eventual extinction in the region between 1950 and 1960. Since the declaration of Gir Forest as a sanctuary in 1965 and subsequently as a national park in 1975, habitat conditions have significantly improved. This positive trend created an opportunity for the reintroduction of the hornbills to establish a self-sustaining population. The reintroduction was conducted in two phases. During the first phase, twenty-eight birds were captured from known hornbill ranges within Gujarat, and five of them were equipped with PTT/GSM satellite transmitters. And in the second phase, twelve birds were captured, and six of them were fitted with PTTs to study their ranging patterns, habitat associations, and potential breeding activities. During the establishment or initial phase of reintroduction, the birds exhibited exploratory behaviour, resulting in larger home ranges (mean ± Standard Deviation, SD) (60.87 ± 68.51 km2), which gradually reduced to smaller home ranges (5.73 ± 10.50 km2) during later stages. Similarly, the daily and monthly distances travelled by the birds were significantly greater in the initial phase than in the later one. Nest site selection correlated significantly with girth at breast height (GBH) and tall trees. Our study provides essential information for hornbill reintroduction in the Gir landscape, aiding future conservation efforts for Indian Grey Hornbills.

1. Introduction

Reintroduction is one of many tools for addressing the decline in species’ distribution ranges. While these programs predominantly focus on threatened species, it is also noteworthy that species of lesser concern are frequently targeted as well [1]. Among mammals, reintroduction efforts have often focused on large-bodied species such as wolves, big cats, bears, and antelopes, reflecting their ecological importance as keystone or umbrella species [2]. In contrast, birds have been reintroduced across a broad spectrum of sizes and conservation status. For example, medium to large-sized gamebirds like the Western Capercaillie (Tetrao urogallus) [3], Great Bustard (Otis tarda) [4], and even Chukar Partridge (Alectoris chukar) [5] illustrate that bird reintroductions extend well beyond flagships, encompassing both the threatened and non-threatened species. The Common Pheasant (Phasianus colchicus) is another widely released species, introduced extensively across Europe and other regions primarily for game management rather than conservation, highlighting the diverse motivations behind bird translocations [6,7]. Several Phasianidae species have been introduced beyond their native range. The Chukar Partridge has been introduced in North America, New Zealand, and parts of Southern Africa [5]. In Europe, extensive releases of Red-legged Partridge (Alectoris rufa) have occurred outside their native range of Iberian distribution [8]. Captive-bred Oriental Pied Hornbills (Anthracoceros albirostris) have been reintroduced in Thailand and Singapore with breeding success [9]. Southern Ground Hornbill (Bucorvus leadbeateri) reintroduction in South Africa shows how group dynamics are essential for their survival [10]. The choice to reintroduce a species is not always driven by its globally threatened status [1]. Reintroduction programs may also be directed towards species that are locally threatened or extirpated and common elsewhere and are still listed as least concern on the IUCN Red List [11,12]. The relocation and translocation of different species have been carried out globally for the past century [13]. Rigorous monitoring and evaluation of reintroduction efforts developed much later during the 1980s, when it became clear that reintroduction programs were facing challenges [14,15,16]. Subsequent to this period, there has been extensive development and substantial monitoring of the reintroduction programs [17,18]. Such extensive development and monitoring provided valuable insights into the survival and habitat use of Red-billed Curassows (Crax blumenbachii) in Brazil, enabling researchers to evaluate outcomes and adapt specific strategies [19]. Similarly, multi-year studies of Oriental Storks (Ciconia boyciana) in Japan compared soft versus hard release methods and age classes, demonstrating how telemetry can guide technique selection [20].
The overall success of reintroduction projects hinges on the released species’ capacity to form self-sustaining populations in their new habitat, which includes factors such as fidelity to the release area, long-term survival, or successful breeding [21,22,23]. Successful reintroduction efforts may also be influenced to a greater extent by factors such as habitat quality, including food availability, predator abundance, anthropogenic disturbance, and the number of individuals released [16,24,25,26]. The ultimate aim of reintroduction projects should be the establishment of sustainable populations that closely emulate the behaviour and ecology of the original wild population [27].
The Indian Grey Hornbill occurs throughout the Indian sub-continent and is listed as ‘Least Concern’ on the IUCN Red List of Threatened Species [28]. Its population trend is currently believed to be stable, with a 95.56% increase in the frequency of sightings reported in 2022/23 relative to before 2000, as reported by the State of India’s Birds [29]. It occurs mainly in deciduous forests, open woodlands, thorn forests, rural cultivation areas, and urban gardens [30]. The species is considered to have undergone local extinction in the Saurashtra region between the 1950s and 1960s, with the last confirmed sighting recorded in 1936 [31]. However, there is a lack of literature regarding the status of Indian Grey Hornbills in Gir. All the records of the Indian Grey Hornbill in Gir are from Dharmakumarsinhji [31,32,33], presumably the only ornithologist who actively worked in the Saurashtra region at that time. Additionally, Gurubh [34], Khacher [35], Divyabhanusinh [36] and Rahmani [37] have also mentioned the historical occurrence of Indian Grey Hornbills in Gir. Based on such records, the Indian Grey Hornbill became rare in Gir only during the 1950s and 1960s [31,32,33]. Records in Dharmakumarsinhji [31] indicate that Indian Grey Hornbills were common and regularly sighted throughout the year and were plentiful during the winter months. Dharmakumarsinhji sighted the Indian Grey Hornbill till 1936 in Gir [31]. However, it is further described that the last reported sighting of it in Gir was in 1950 [31]. It is the only hornbill species found in Gujarat, where it is reported from the forested areas of south and central Gujarat, and has long been reported to be locally extinct from the Gir landscape [31,32,33,38]. Although Indian Grey Hornbills disappeared from the Gir landscape by the 1950s–1960s, the exact causes of their decline remain uncertain. Historical accounts [31,32,33,34,35,36,37] point to hunting pressure as a likely factor in their local extinction, rather than habitat loss. The dry deciduous forests of Gir, which remain largely intact today, continue to provide suitable habitat conditions for hornbills. While it is difficult to reconstruct past habitat conditions with certainty, the persistence of these forest types suggests that the species’ decline was not primarily habitat-driven and that reintroduction into Gir is ecologically feasible. Its long-term population trend in Gujarat is currently unknown, with the annual sighting frequency of only 0.1% in Gujarat compared to 0.31% for the rest of the country [29]. Although sighting frequencies in Gujarat are low, Gir continues to retain habitat features likely favourable for Indian Grey Hornbills. The landscape is dominated by dry deciduous forest with substantial tree species diversity, including many fruiting trees whose phenological observations in the nearby Girnar forest show fruiting peaks in December and long maturation periods, indicating extended availability of food resources [39].
In 2021, a reintroduction project was undertaken in the Gir landscape following the IUCN guidelines [40] to re-establish self-sustaining populations of the Indian Grey Hornbill within their historical range in the Gir landscape. The previously speculated threat of poaching of the Indian Grey Hornbills for the supposed medicinal values of their feathers during the 1950s [31,32,33] has diminished significantly since the declaration of Gir as a Sanctuary in 1965 and later part of the sanctuary as a National Park in 1975, and the enactment of the Wildlife (Protection) Act, 1972 [41]. Historically, adults and young of Indian Grey Hornbills were widely hunted for their meat and alleged medicinal properties [30]. The population of hornbills in Gir could have been a disjunct population, as there were hardly any other records of the species from the rest of Saurashtra [31,35,38]. Therefore, hunting seems to be a possible driver of hornbill decline in Gir. The species is considered uncommon to rare resident in Gujarat, with sightings from south and central Gujarat forest areas [38]. Its persistence in other parts of Gujarat was presumably due to a larger and connected population that might have sustained the pressure of hunting during the pre-independence era [33]. It indicates that local differences in hunting intensity, habitat extent, and initial population size may have influenced regional outcomes. At present, the Gir landscape is dominated by dry deciduous forests with a high diversity of fruit-bearing trees, which indicates the availability of food resources [42]. Rashid [41] mentions earlier attempt of Indian Grey Hornbill reintroduction in Gir during the 1970s; however, details on the exact year, location and number of birds are not available. Thus, it was recommended in the Management Plan for Gir Protected Areas [42] to reintroduce the Indian Grey Hornbill into their historical range. These recommendations were further based on the important role of hornbills as long-distance seed dispersers [43,44], which is crucial for maintaining regional tree diversity, reducing potential seed mortality, and facilitating forest regeneration [44].
The objective of this study was to restore the population of the Indian Grey Hornbill to its former range in the Gir landscape. The primary goal was to enhance the bird population to a robust size, enabling the species to be self-sustaining. Achieving this goal necessitates the successful survival of newly released birds during the establishment phase. Thus, newly released individuals must adapt to and settle in the reintroduced and unfamiliar habitat, form pairs, nest successfully, and produce sufficient offspring to offset mortality rates [45]. In the present study, we monitored hornbills using satellite telemetry to seek the following specific goals: (1) to determine whether the reintroduced birds were capable of pairing and nest in the released habitat, (2) document the breeding behaviour (if any) of the reintroduced birds, (3) determine the habitat and nest selection and (4) determine ranging patterns. We hypothesised that, immediately after release, reintroduced birds would show exploratory movements that translate into larger-ranging behaviour. Specifically, we predicted significantly greater home-range sizes and higher mean daily distances during the first few months compared with later, settled periods.

2. Materials and Methods

2.1. Study Area

Indian Grey Hornbills were reintroduced in the Gir landscape, one of the important protected areas in the ‘Asiatic Lion Landscape’ (ALL), Gujarat, India. ALL is a multi-use landscape located within the southwestern part of the Saurashtra peninsula in the Gujarat state in western India (Figure 1). It is composed of five protected areas, namely Gir National Park, Gir Wildlife Sanctuary, Paniya Wildlife Sanctuary, Mitiyala Wildlife Sanctuary, and Girnar Wildlife Sanctuary. The landscape spans nine districts, including Junagadh, Gir-Somnath, Amreli, Bhavnagar, Botad, Porbandar, Jamnagar, Rajkot, and Surendranagar, covering ~30,000 km2. This landscape represents a typical tropical semi-arid climatic zone, characterised by a tropical monsoon climate with distinct wet and dry seasons [46]. The area is characterised by three seasons: dry and hot summer (March–June), monsoon (July–October), and primarily dry winter (November–February). Climatic conditions during the study period remained within the typical range for the Gir–Saurashtra region, where long-term records (1981–2010) indicate an average daily maximum temperature of about 34.3 °C, a minimum of around 21.0 °C, and annual rainfall averaging approximately 115.5 mm [47].
Gir National Park and Sanctuary (21°55′ to 21°20′ N, 70°25′ to 71°15′ E) (Figure 1) covers an area of 1410.30 km2 and falls under very dry teak forest classification (type 5A) [48]. A total of eight major vegetation types are found within Gir National Park and Sanctuary: riverine woodland, thorn woodland, mixed valley community, Tectona-Acacia-Zizyphus woodland, Tectona-Boswellia-Sterculia woodland, Anogeissus-Boswellia-Lannea woodland, and Anogeissus-Terminalia woodland [49]. Hornbill nests and chicks face a suite of potential predators in India, the most important being climbing predators such as arboreal snakes and monitor lizards, in addition to diurnal raptors and small mammalian carnivores (e.g., civets and small cats), and occasionally other birds [50].

2.2. Study Species

The Indian Grey Hornbill is a small, brownish-grey hornbill found across India, Pakistan, and Nepal [30]. It inhabits deciduous forests, open woodlands, agricultural landscapes, and even urban gardens [51]. Primarily frugivorous, especially during the breeding season [52,53], it nests in natural or previously excavated tree cavities and shows strong fidelity to the same nest sites over successive years [51,54]. Although they do not excavate cavities, Indian Grey Hornbills may modify existing hollows slightly by cleaning or adjusting the entrance prior to sealing. The ongoing loss of their foraging and nesting habitats remains a major threat to the species [55].
In India, it is absent from the northeastern regions and at higher elevations in the Himalayas [30,56], and is widely distributed across the Eastern Ghats of India [54]. In the Eastern Ghats, its important sites are Sathyamangalam Wildlife Sanctuary, Hogenakal, Sri Venkateswara National Park, Sri Lankamalleswara Wildlife Sanctuary, Gundlabrameshwaram Wildlife Sanctuary, Nagarjuna Sagar-SriSailam Tiger Reserve and Penusila Narasimha Wildlife Sanctuary [57]. While highly adaptable to human-modified landscapes [58], it still depends on mature trees with large thickness for nesting and therefore remains closely tied to intact primary forests [55].
Diet studies in the Eastern Ghats reveal that Indian Grey Hornbills primarily feed on fruits, consuming 26 species from 16 plant families, with 83% of recorded feeding observations involving fruit, and only minor intake of insects and flowers [59]. Ficus species are especially important, contributing approximately 25% of the diet during the non-breeding season [58]. Similar patterns have been documented in central India, where species such as peepal (Ficus religiosa), banyan tree (F. benghalensis), and cluster fig (F. glomerata) dominate the diet [28]. Males have also been observed provisioning nests with fruits of Madras thorn (Pithecellobium dulce), jamun (Syzygium cumini), and Indian jujube (Ziziphus mauritiana) [60]. As an obligate frugivore, the species plays a key role as a seed disperser in dry forest ecosystems [61].
Breeding studies from the Eastern Ghats indicate that the breeding season spans from March to June, with an average nesting cycle of approximately 87 days, during which females remain sealed inside cavities for around 76 days [62]. All recorded nests in this region were located in riverine habitats, highlighting the importance of these areas for reproduction [62]. Females typically lay 2–5 eggs, with an incubation period of about 21 days, followed by roughly 45 days of fledgling care [60]. In central India, females remain sealed for slightly shorter periods, averaging around 65 days [60]. Females remain sealed inside the nest cavity throughout incubation and early chick rearing, relying entirely on the male for provisioning. Nest trees are usually tall, mature trees with substantial girth, often exceeding 2–7 m in height and large trunk diameters [62].
Males of the Indian Grey Hornbill can be identified by a larger casque and darker bill with yellowish tones along the culmen and lower mandible, while females have a smaller casque and a more uniformly yellowish bill with black near the base [51]. Males typically show darker circumorbital skin, whereas females may display paler or reddish tones, with iris colour also aiding sex identification [63]. Juveniles are distinguishable by their undeveloped casques and duller bill and facial colouration, requiring joint assessment of age and sex [60]. Ecologically, the species shows a strong preference for undisturbed habitats and relies heavily on large fruiting and cavity-bearing trees, making habitat degradation and the decline of key food plants major threats to its survival [55,64].

2.3. Capture and Release

According to the 2013 IUCN guidelines of reintroduction [40], we carried out reconnaissance to map food resources, potential nest trees, water, human disturbance and selected release sites in the Gir landscape that maximised habitat suitability [40]. The source birds were captured using established techniques that minimise stress, provide veterinary healthcare and screening, including body condition assessment and sexing and were uniquely marked with colour rings before release [40]. The intensive post-release monitoring involved satellite telemetry, with ground verification wherever feasible.
The hornbills were captured from the selected sites in the Aravalli Forest Division of Gujarat, approximately 380 km from the release location, in two phases (Figure 1). Aravalli lies in a semi-arid to arid climatic zone with dry scrub forest characterised by Acacia species, axlewood (Anogeissus latifolia), and Indian jujube (Ziziphus mauritiana), along with many fruit-bearing tree species [65], which are also commonly found tree species in the Gir Landscape. Before capturing the birds, we surveyed familiar locations in the Aravalli range that have extant hornbill populations within Gujarat. Capture sites were therefore selected in proximity to the release sites to minimise translocation distance and disturbance, and to preserve local adaptation and learned behaviours; an approach recommended in translocation guidance [40]. We specifically chose capture localities that matched the release area in habitat type (dry deciduous forests), structural features (abundant mature fruiting and cavity-bearing trees) and predator assemblage (presence of raptors and other natural predators), ensuring that released birds experienced similar ecological conditions before and after release [9,66]. We chose to reintroduce individuals from an extant wild population in Gujarat state rather than a captive-reared population, due to the high post-release survival rate of wild individuals [67,68]. Capture and handling protocols were designed in accordance with the IUCN/SSC Guidelines for Reintroductions [40]. All captured birds were adults, as confirmed by plumage and casque development (see Figure S1 for details). Birds were captured using the traditional knowledge of experienced trappers; mist nets (50 mm mesh; sourced from local fish market) were deployed along known hornbill flight paths and near fruiting trees in the early morning and late afternoon. Nets were monitored continuously, and birds were removed immediately upon capture to minimise stress. The selection of capture sites was justified on ecological and ethical grounds: sites were located within the same state and in habitats closely resembling the release area, including dry deciduous forests. This approach aligns with previous reintroduction studies that have sourced adults from ecologically similar regions to maximise survival and adaptation [18]. Figure S1 provides photographs of the capture process and the equipment used.
Captured birds were handled with care and kept in specially designed bird bags (16″ × 13″, L × H), and their heads were covered to minimise the capture stress if required. The captured birds were then transferred to transportation cages (36.2″ × 14.17″ × 20.07″, L × H × W), specially designed based on the accumulated expertise and practices of experienced trappers, which were covered during transportation to the release site. The birds were captured in October 2021, February 2022, March 2022 and December 2023 and were released at the targeted site in the morning hours only, and the time in captivity did not exceed 24 h. At the time of capture, each hornbill was weighed using an electronic digital weighing scale (±10 g accuracy) to ensure that transmitter load did not exceed the recommended 3–5% of body weight. In addition, tarsus diameter was measured using a digital vernier calliper (±0.1 mm precision) as a standard morphometric variable. No further body measurements or blood samples were taken in order to minimise handling time and stress to the birds before release (Figure S1).

2.4. Deployment of Transmitters and Colour Rings

A total of 28 birds were captured in the first phase, during three capture events (October 2021, February 2022, and March 2022). Of these, five males were fitted with back-mounted PTT/GSM satellite transmitters (<3% of body weight; solar-powered) (Table S1), while the remaining 23 individuals were marked with coloured rings (Table S1). All birds from this first phase were released immediately after capture and tagging on the same day. A second capture event was conducted in December 2023, during which 12 birds were captured. Six of these were fitted with PTTs, and the remaining six were marked with coloured rings; all were released on the same day. Across both phases, a total of 40 individuals were released (21 males and 19 females), corresponding to a male-to-female sex ratio of 1.10 [69]. Transmitters were deployed to the bird’s dorsal side using a 5 mm Teflon ribbon harness employing a crossband method with a knot on the sternum to secure placement [70,71]. We considered only males due to the unique breeding behaviour of the hornbill, where the female seals herself into the nest cavity during the breeding season for about two months [60]. During the incarceration period, there is a high chance of battery drainage, and the back-mounted transmitter may hinder her entry and movement into the nest cavity. For long-term monitoring, all the birds were also marked with colour rings on the metatarsus of the left leg. Each bird was marked with a set of two different-coloured rings, each having a unique code number engraved on it. The average weight of each ring was (0.28 ± 0.01 g). The average diameter of the left tarsus of birds (n = 19) was 7.08 ± 0.38 mm, and therefore, to ensure the safety of the birds, rings with a diameter of 8 mm were used.
Nine of the transmitters, weighing 5 g each and manufactured by GeoTrak (Apex, NC, USA), utilised the Argos Satellite Data Collection Relay System, while two transmitters (Ornitela, UAB, Vilnius, Lithuania), weighing 9 g each, transmitted data via the GSM network (Cellular phone). The Ornitela transmitters recorded GPS coordinates at 30 min intervals and transmitted the collected data every six hours, resulting in 48 location points per 24 h. In contrast, the GeoTrak transmitters exhibited somewhat irregular data transmission, as the tags were on a 10 h ON and 12 h OFF transmission cycle. The movements were monitored remotely through satellite-transmitted data at the Gir Hi-Tech Monitoring Unit, Sasan-Gir. Additionally, field staff monitored the colour-banded birds during their routine patrols (Table S2). The data for Ornitela and GeoTrak transmitters were downloaded from their official websites [72,73]. There were no mortalities or injuries to the birds during the entire process of capturing, tagging, and releasing them.

2.5. Home Range Estimation

Out of the 28 birds released in the first phase, two males were tagged on 28 October 2021 and another two on 24 February 2022. The fifth male was tagged on 3 March 2022. Transmitters remained active for a total of 305 days during the first phase. In the second phase, all six birds were tagged on 27 December 2023, and the transmitters remained active for a total of 488 days (Table S3). Due to unknown technical issues, all the transmitters ceased to function as the study progressed. We calculated the mean error radius rate for all location classes, and Location class-3 provided the most accurate locations and was thus used for all the analysis. For Ornitela, we used the mean Horizontal Dilution of Precision (HDOP) as a measure of location accuracy, and location fixes with an HDOP greater than two were excluded from the analysis. To estimate home ranges, we partitioned the location fixes of all individuals into initial and later phases of reintroduction, reflecting distinct behavioural stages after release. We used change point analysis to objectively identify breakpoints in movement behaviour that marked transitions between exploratory and settled phases. Specifically, we aggregated monthly home-range estimates for each individual and applied change point analysis to detect significant shifts in range size over time. This approach allowed us to distinguish periods of large, variable home ranges, characteristic of post-release exploration, from subsequent periods of reduced and more stable ranges, indicative of settlement. Thus, by relying on a statistical method rather than an arbitrary time cut-off, we were able to more accurately capture behavioural transitions in reintroduced hornbills, consistent with recommendations for analysing movement data in reintroduction studies [74,75]. During the initial phase, individuals exhibited extensive and variable movement patterns, likely driven by exploratory behaviour to locate suitable habitats, a pattern commonly observed in reintroduced populations [18]. Consequently, home range estimates for the initial phase were significantly larger and more variable compared to the later phase, consistent with findings from other reintroduction studies where animals stabilise their ranges over time [76]. To assess whether seasonal effects influenced ranging behaviour, we also classified monthly home ranges into two periods: breeding (March–June) and non-breeding (July–February), following the known breeding season of Indian Grey Hornbills [51,77]. For each individual, home range estimates (95% KDE) were grouped by season and analysed using linear mixed-effects models with season as a fixed effect and bird ID as a random effect to account for repeated measures within individuals.

2.6. Movement Patterns

Monthly and daily movement patterns were calculated for the initial and later phases of the reintroduction using the Tracking Analyst tool in ArcGIS (version 10.8; Esri, Redlands, CA, USA). Monthly distances were calculated as the total Euclidean distance travelled per month (in km), summing straight-line distances between consecutive location fixes within each month. Daily distances were computed as the average distance travelled per day (in km), obtained by dividing the total monthly distance by the number of days with sufficient location fixes (≥20 days per month).

2.7. Habitat Selection

To assess habitat use by the reintroduced hornbills, we first classified habitats using the most recent land-use/land-cover (LULC) map prepared by the Bhaskaracharya Institute for Space Applications and Geoinformatics (BISAG). This map identified eight habitat types within the Gir Protected Area, including dry mixed deciduous and teak forests, scrub, grasslands, Butea forest, desert thorn forest, Acacia senegal forest, and miscellaneous forest. Outside the protected area, six categories were recognised: open scrub, agricultural fields, horticulture, water bodies, human habitation, and other land-use types. We checked these categories during field surveys to ensure they matched the conditions on the ground. For each bird, we then measured the availability of these habitats as the proportion of each habitat type within its home range, defined by the 95% kernel density estimate (KDE). Use was measured as the proportion of GPS fixes falling within each habitat type. To compare use against availability, we applied Manly’s Selectivity Index [78].
wi = ui/ai divided by ∑(uj/aj)
where ui is the proportion of fixes in habitat i and ai is the proportion of habitat i available within the bird’s home range. Here, uj and aj represent the corresponding proportion of use and availability for all habitat types. Values greater than 1 indicate preference, values close to 1 suggest use proportional to availability, and values less than 1 indicate avoidance. Because the landscapes inside and outside Gir differ substantially, we calculated indices separately for individuals that remained within the protected area and for those that dispersed outside.

2.8. Breeding Behaviour

As the sightings of the hornbills increased during March and April, we conducted multiple searches, specifically to locate the potential nests, as the breeding season of the Indian Grey Hornbill occurs during the same months (March-July) [62]. We focused on tree species such as Indian gum tree (Sterculia urens), baheda (Terminalia bellirica), and east Indian copaiba balsam/gurjan (Dipterocarpus turbinatus) that hornbills usually choose to nest with particular characteristics such as tallness, thickness and high cavities [62,79]. We also focused our search on males carrying food and examining midden deposits of seeds below potential nest cavities [62]. The first nest was discovered on 5 June 2023, during the first year of reintroduction, but no detailed observations were carried out at this site to avoid disturbance during the first attempt of breeding by the reintroduced birds. This nest was reused in the second year, when we also located two additional nests on 23 May 2024. In total, four nests were discovered across the two-years period, of which three (the reused nest and the two new nests) were studied in detail. We measured nest tree features, including tree species, tree height, nest cavity height, and girth at breast height (GBH). To quantify surrounding vegetation, we established 30 m radius circular plots centred on each nest tree [79]. Within each plot, all trees with GBH ≥ 25 cm were recorded, identified to species, and measured for GBH and height. These data were used to calculate mean GBH, mean tree density, mean height, number of tree species, and number of cavities, as well as the average height of the first branch. The same protocol was applied in random plots of equal radius, placed 200 m from the nest plots in four cardinal directions [78], with the central tree serving as the analogue to the nest tree. The nest tree structural attributes were analysed separately from the surrounding vegetation. We used two-sample t-tests to assess differences in habitat variables between nest and random plots. The mean values of GBH, density, and tree height, together with the associated test statistics, are provided in Table S4. All measurements were carried out by the same person to maintain consistency across all plots. Breeding behaviour was monitored at three nests located during the second year following reintroduction. Because nest discovery from the small number (n = 40) of reintroduced birds in the vast Gir landscape was extremely challenging, observations were focused on the few accessible nests that could be located and confirmed. Once identified, each nest was observed in 3 h sessions conducted in the morning (600–900 h), afternoon (1200–1400 h), and evening (1600–1830 h). Observations were made from a camouflaged hide approximately 50 m from the nest using binoculars.
Two observers recorded the data using a Dictaphone and pre-designed data sheets. Pre-study observations were conducted to establish behaviours such as calling, perching, feeding, nest cleaning, and nest defence to be recorded during focal animal sampling. We divided each session into a 15 min observation period and recorded each behaviour as an instantaneous scan as it occurred. At all sessions, two observers alternately recorded the data. The time was noted at the onset and the end of each behaviour. Each of the three nests was observed for a total of 18, 16, and 13 days, respectively. All nests were discovered at a relatively late stage of the breeding cycle, when females had already begun breaking the mud seal and could be observed outside the cavity. This allowed us to record behaviours of both sexes at the Bhojde and Mindhori nests. At the Verwangda nest, however, the female remained incarcerated throughout the observation period, and all visible activities were performed by the male.

2.9. Statistical Analysis

To compare home-range dynamics across phases, we partitioned fixes into initial and later stages. We used change point analysis [74] to identify shifts in monthly home-range size, a method commonly applied in movement ecology to detect behavioural transitions [75]. Home-range areas were calculated using kernel density estimators (95% KDE) implemented in the adehabitatHR package in R (version 4.4.1, Vienna, Austria) [80,81]. We tested the hypothesis that home ranges of reintroduced birds are more extensive during the initial phase compared to the later phase, reflecting greater exploration of new habitats post-reintroduction. The dataset comprised 24 observations (home range estimates) from five individual birds, with variables including core areas (50% kernel density estimate, km2) and home ranges (95% kernel density estimate, overall home range, km2) measured across two phases (initial and later). Linear mixed-effects models (LMM) were used, with Phase as a fixed effect and bird ID as a random effect to account for individual variability (Table S5). Linear mixed-effects models were fitted using the lme4 package in R (version 4.4.1, Vienna, Austria) [82]. Due to non-normality of residuals (Shapiro–Wilk test, p < 0.05 for both core areas and home ranges), both response variables were log-transformed, improving normality (p = 0.11 for core areas, p = 0.09 for home ranges). The fixed effect of Phase was tested using a one-tailed contrast (initial > later) via the emmeans package in R (version 4.4.1, Vienna, Austria) [83].
The movement patterns were expressed as daily and monthly distances (km) across two phases (initial and later). Linear mixed-effects models were used, with Phase as a fixed effect and bird ID as a random effect to account for individual variability. Separate models were fitted for monthly (km/month) and daily (km/day) distances, with reintroduction phase (initial vs. later) as a fixed effect and bird ID as a random effect to account for repeated measures. Normality and homogeneity of variance were tested using the Shapiro–Wilk test and Levene’s test. Where assumptions were violated, Mann–Whitney U tests were used; otherwise, parametric t-tests were applied. Nest tree and habitat variables between nest and random plots were tested with two-sample t-tests (for normally distributed variables) or non-parametric equivalents where assumptions were violated. Behavioural observations (e.g., duration of calling, feeding, nest defence) were grouped by sex and nest site. To examine variation across nests, Kruskal–Wallis tests with post hoc Dunn’s tests (Bonferroni correction) were applied. Food provisioning data were analysed with a Chi-square test of independence on contingency tables (nests × food categories), with significant effects explored using standardised residuals and pairwise Chi-square tests adjusted with Bonferroni correction.

3. Results

3.1. Home Ranges

Transmitters were active for a cumulative total of 794 days across all tagged birds (n = 5). The lifespan of individual transmitters varied significantly, with the shortest lasting 0 days (failed on the same day) and the longest remaining active for 371 days (Table S3). We collected a total of 14,919 location fixes across all individuals; however, only the highest-accuracy data for PTTs (Class 3, n = 7320) were retained for analysis, with a mean error radius of 151 ± 1.48 m. For the GSM tag, the Horizontal Dilution of Precision was 1.40 ± 0.34.
We calculated home ranges for only five individuals: IGHM-2, IGHM-3, IGHM-7, IGHM-10, and IGHM-11, which had sufficiently large data sets to allow for the unbiased estimation of home ranges (Figure S2). During the initial reintroduction phase, mean home ranges (95% KDE ± SD) and core areas (50% KDE ± SD) were 60.87 ± 68.51 km2 and 8.43 ± 11.78 km2, respectively. In contrast, after the birds had settled (in the later phase), these estimates decreased to 5.73 ± 10.50 km2 (home ranges) and 1.02 ± 1.95 km2 (core areas) (Table 1).
Phase significantly predicted core area size (50% KDE; LMM: t = −2.021, p = 0.028), with model estimates decreasing from 5.73 km2 (initial) to 1.02 km2 (later). For 95% KDE home ranges, Phase effects were also significant (t = −2.506, p = 0.010), with a decline from 60.87 km2 to 8.43 km2. Significant between-bird variability was observed (random effect SD = 1.0425 for 50% KDE, 1.283 for 95% KDE on the log scale), with greater variation in overall home ranges (SD = 68.51 km2 in the initial phase for 95% KDE) than core areas (SD = 10.95 km2), indicating that individual birds differ substantially in their space use.
Seasonality appeared to influence the space use by hornbills. The linear mixed-effects model indicated that home ranges (95% KDE) tended to be larger in the non-breeding season than in the breeding season, although the effect was marginal (LMM: F = 3.94, df = 1, 18.7, p = 0.062). Estimated marginal means suggested higher log-transformed home ranges in the non-breeding season (emmean = 2.72, 95% CI: 0.63–4.81) compared to the breeding season (1.69, 95% CI: −0.41–3.80), with the contrast showing a tendency toward smaller home ranges during breeding (estimate = −1.02, p = 0.065) (Figure 2).

3.2. Movement Patterns

The mean (±SD) monthly and daily distances (km) covered during the initial phase were estimated to be 114. 57 ± 81.23 km and 4.3 ± 2.57 km, respectively. In contrast, these estimates dropped to 42.54 ± 28.44 (monthly) and 1.40 ± 0.93 (daily) km, respectively, during the later phase (Table 2).
A linear mixed-effects model for monthly distance showed a marginal reduction in the Later phase (estimate = −40.3 km, SE = 19.90, t = −2.025), with a non-significant trend (EMM contrast: 40.3 km, p = 0.0636). For daily distance, a log-transformed model revealed a significant reduction in the Later phase (estimate = −0.5595, SE = 0.1528, t = −3.661; EMM contrast: 0.559, p = 0.0022 on log scale), suggesting a difference of approximately 0.75 km/day when back-transformed. Individual variation was substantial, with random effect variances of 4343 (monthly) and 0.1325 (daily on log scale). These patterns align with reduced home ranges from the Initial to Later phase (61.00 km2 to 8.92 km2 for 95% KDE), indicating exploratory behaviour post-release, followed by settlement.

3.3. Nest Site Selection

The first nest was found on 5 June 2023, within one year of releasing the birds. This nest was monitored from 6 June 2023 to 26 June 2023. During the second year (2024), three additional nests were discovered between 11 and 23 May and were monitored from 29 May 2024 to 28 July 2024. Three of the nests were located on a Sterculia urens tree, and one nest was found on a Terminalia bellirica tree in a dry deciduous forest. All nests were present at sites having relatively low mean tree density (0.019 m2) compared to random sites (0.024 m2) (Table S4). However, the tree density had no significant (p = 0.36) effect on the nest site selection (Table S4). Only mean tree height (p = 0.04) and mean GBH (p = 0.001) differed significantly between the nest site and random plots (Table S4). Mean GBH (56.96 cm) was higher at nest site plots than at random plots (48.41 cm). The mean height of trees at nest site plots was shorter (7.50 m) than at random plots (8.44 m). Thus, hornbills selected nest sites that were relatively open, featuring mature and slightly shorter trees. The characteristic features of nesting trees, along with broad ecological parameters, are also provided in Table S6.

3.4. Behavioural Activities

We achieved a total sampling time of 34,632 min (total time spent recording the data), corresponding to 577 h and 12 min. We recorded observation data on 12 behavioural activities across all nest sites and grouped them by sex and nest site. A total of 14,899 min of sampling time was achieved at Bhojde nest corresponding to 248 h and 19 min followed by Mindhori (10,671 min; 177 h and 51 min), and Verwangda (9062 min; 151 h and 2 min). The actual activity time (total time during which birds were actively observed and data recorded) was 14 h and 6 min for Mindhori, 4 h and 18 min at Bhojde, and 7 h and 40 min at Verwangda nest site. A total of four nests were located over the two-year monitoring period, of which three nests from the second year were used for detailed feeding and behavioural observations. While these observations provide valuable baseline information on nesting and diet in the reintroduced population, we recognise that the small sample size limits broader inference, and results should be interpreted with caution.
Overall, each behaviour was recorded for an average of 0.98 ± 2.51 min (95% CI: 0.86–1.11). No significant differences were observed between male and female for any of the activities after Bonferroni correction (Table 3).
As shown in Table 3, there were no statistically significant differences between males and females in the duration of any activity. Although females tended to spend slightly more time on behaviours such as bill cleaning and nest cleaning, these patterns did not persist after correction for multiple comparisons. Feeding, preening, and peeping inside the nest were also broadly comparable between sexes, suggesting that both males and females contribute similarly to these aspects of parental care. When activity patterns were examined across nest sites, only feeding showed substantial variation, whereas other activities remained relatively consistent across all nest locations (Table 3). The Kruskal–Wallis tests revealed significant differences across nests for feeding (χ2 = 79.64, adjusted p < 0.001), but no significant differences for perching (χ2 = 3.86, adjusted p = 0.4340) or peeping inside the nest (χ2 = 4.42, adjusted p = 0.3276).
For feeding, the highly significant result (χ2 = 77.46, p = 0.05, adjusted p = 0.001) indicates substantial variation in feeding durations among the three nests. Post hoc Dunn’s tests with Bonferroni adjustment confirmed significant differences in feeding duration for all pairwise comparisons (Table 4). Specifically, the comparison between Bhojde and Mindhori showed the largest difference (Z = −8.505, adjusted p = 0.0001), followed by Mindhori vs. Verwangda (Z = 4.799, adjusted p = 0.0001), and Bhojde vs. Verwangda (Z = −2.830, adjusted p = 0.0140).
These results suggest that feeding durations are significantly shorter at Bhojde compared to Mindhori and Verwangda, and longer at Mindhori compared to Verwangda. For perching and peeping inside the nest, the lack of significance suggests that the mean durations of these activities are similar across the three nest sites. The male at Mindhori nest spent an average of 1.19 ± 3.47 min across all activities (95% CI: 0.85–1.53), while the female spent an average of 1.25 ± 2.19 min across all activities (95% CI: 0.99–1.50). Male spent the highest time in feeding 1.69 ± 4.63 min (95% CI: 1.02–2.36) and female also devoted most of her time in feeding 1.58 ± 2.44 (95% CI: 1.18–1.98) followed by nest cleaning (1.45 ± 2.30; 95% CI: 0.27–2.64). At the Bhojde nest site, the male spent an average of 0.99 ± 2.28 min (95% CI: 0.67–1.32) across all activities, while the female spent an average of 0.57 ± 0.63 min (95% CI: 0.44–0.69). The Bhojde male devoted the most time to calling (3.43 ± 3.76 min; 95% CI: 0.90–5.96), whereas the Bhojde female spent most of her time perching (0.76 ± 0.93 min; 95% CI: 0.44–1.08). At the Verwangda nest site, the female was still inside the nest cavity; therefore, only the male was available for observation. The Verwangda male spent an average of 0.79 ± 2.09 min across all activities, with the most time invested in feeding (0.65 ± 0.49 min; 95% CI: 0.56–0.73).

3.5. Feeding Behaviour

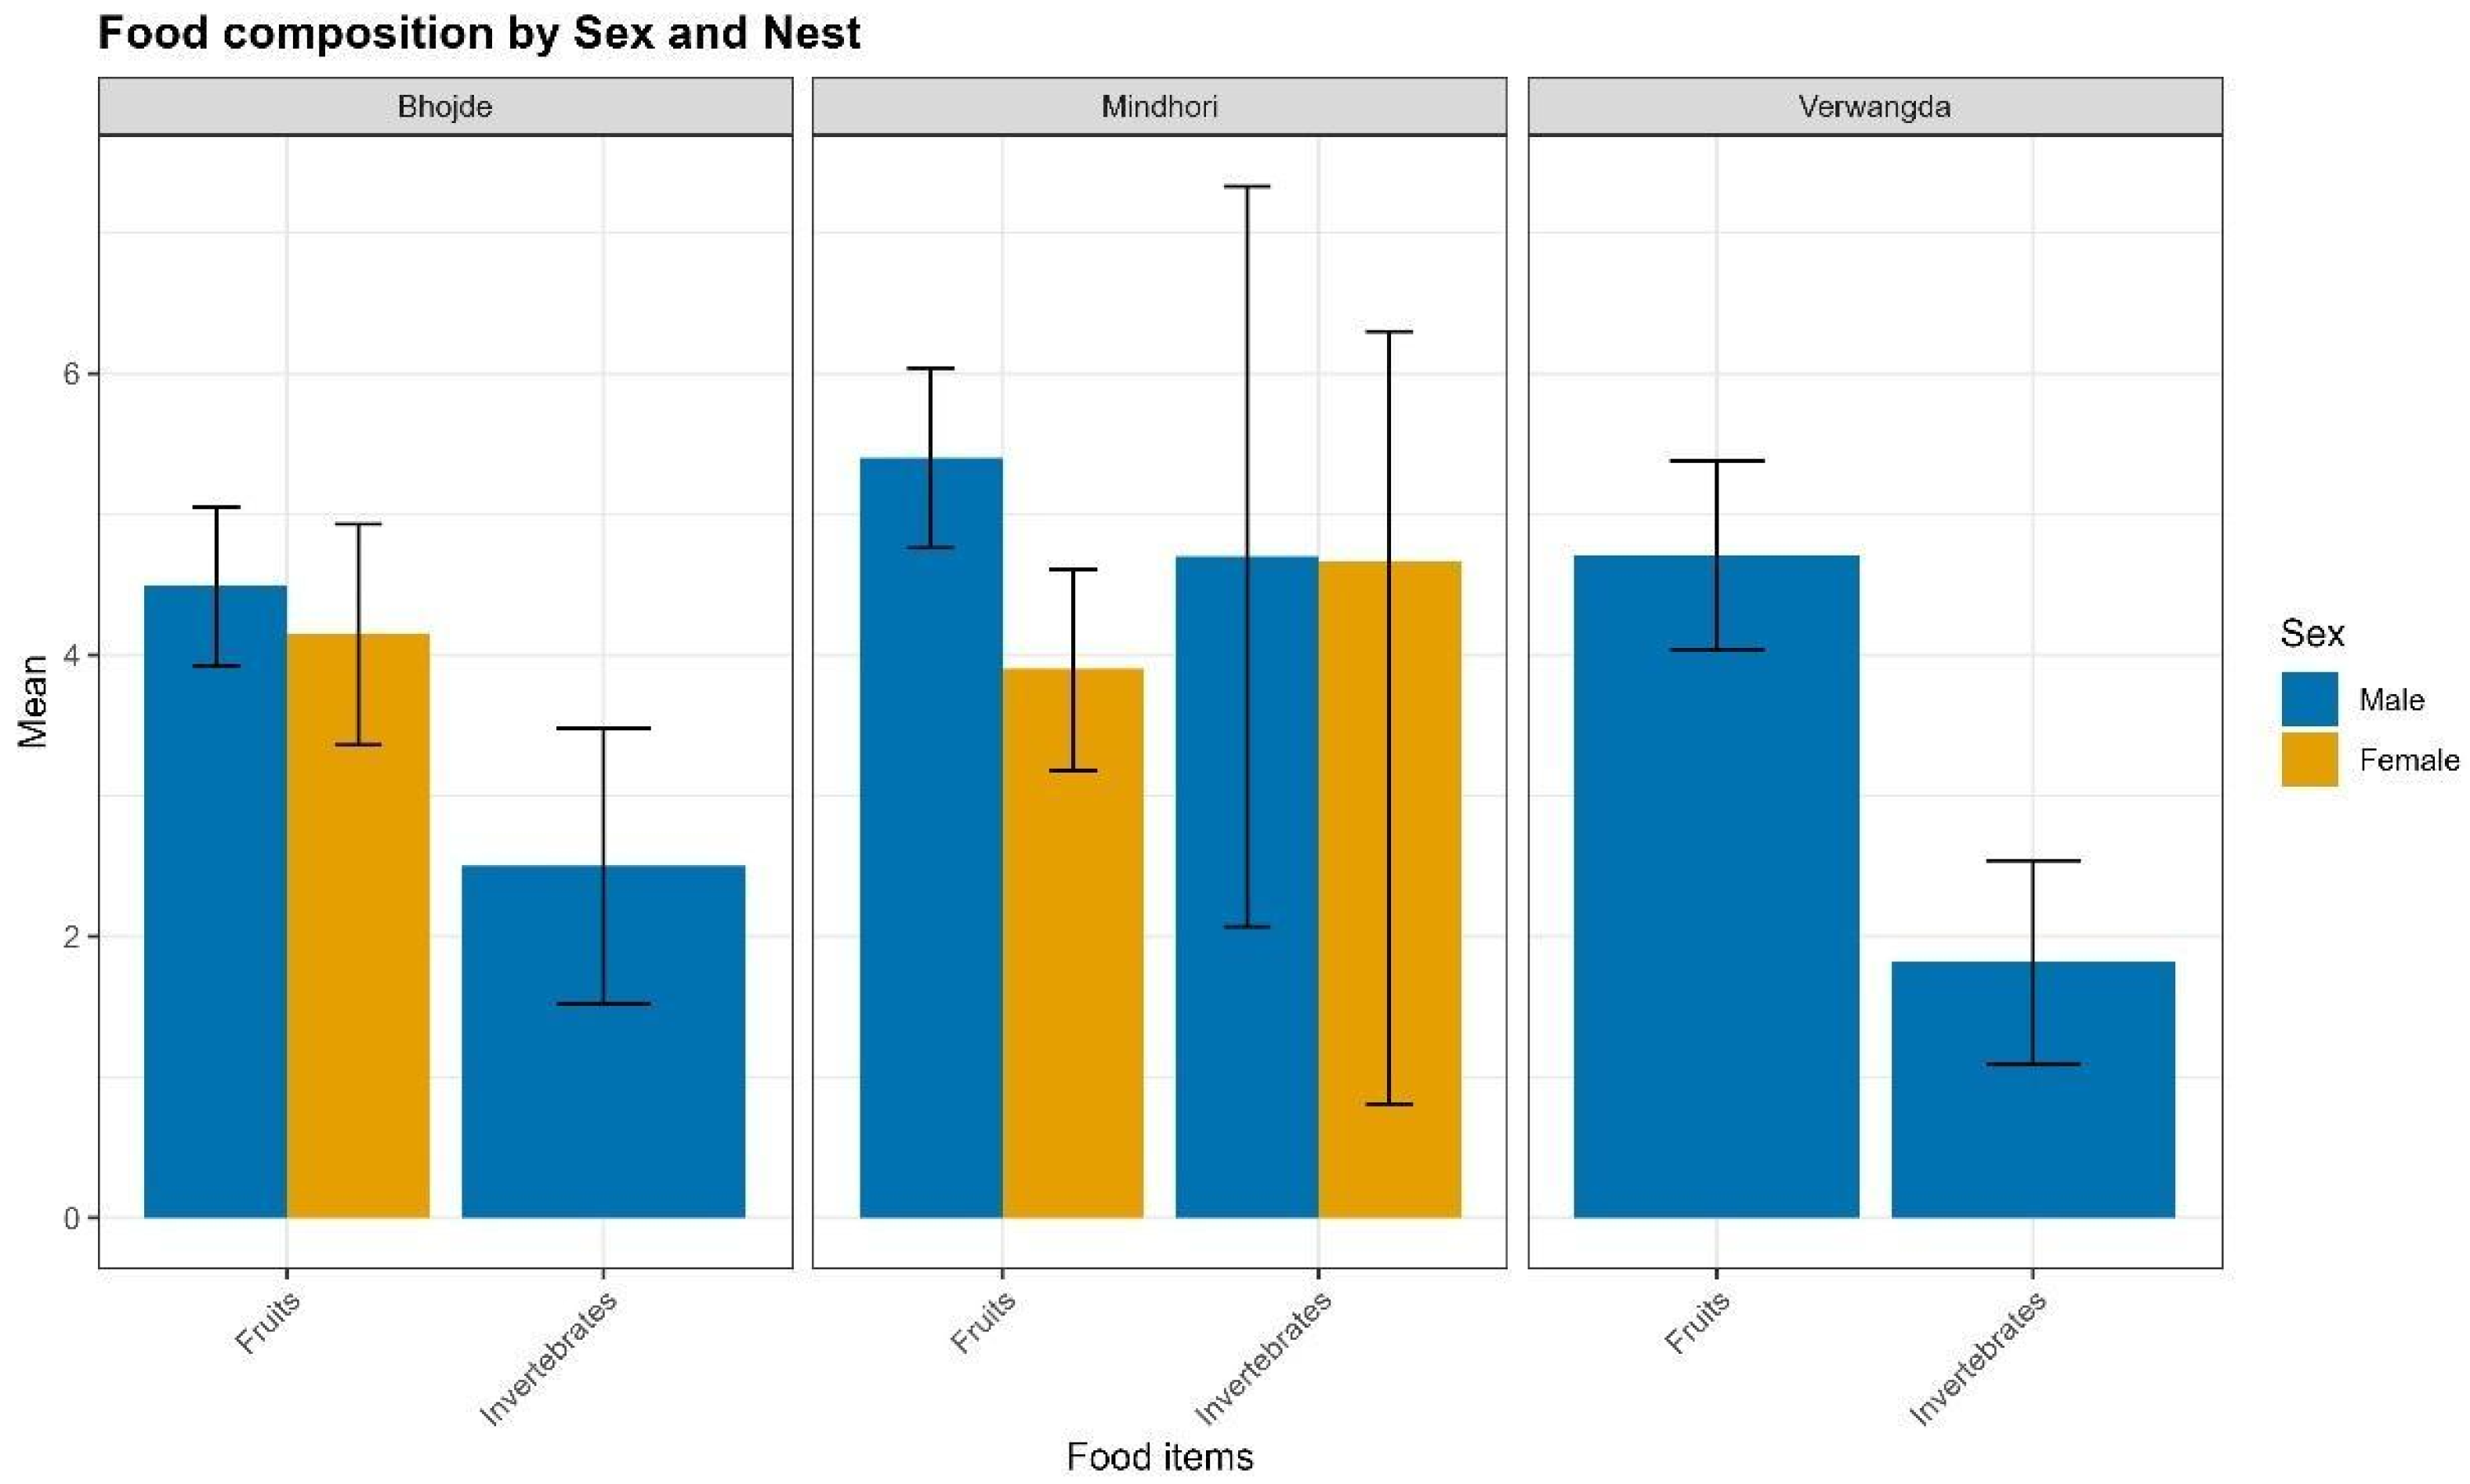
We observed a total of 589 behavioural acts involving feeding attempts across all three nest sites (Bhojde = 178, Mindhori = 302, and Verwangda = 109). The Chi-Square Test of Independence revealed a highly significant difference in the distribution of food counts across nests (χ2 = 162.9527, df = 2, p = 0.001). The contingency table indicated a higher proportion of invertebrates at Mindhori (257/932 = 0.275) compared to Bhojde (39/557 = 0.070) and Verwangda (20/429 = 0.046), with more moderate variation in fruit proportions (Mindhori: 0.721, Bhojde: 0.929, Verwangda: 0.932). Post hoc analysis with standardized residuals showed that Mindhori’s high invertebrate count (standardized residual = 12.7405) and low fruit count (residual = −12.7405) were the primary contributors to the difference, while Bhojde and Verwangda had higher fruit (residuals = 7.3552 and 7.2946, respectively) and lower invertebrate counts (residuals = −7.3552 and −7.2946). Pairwise Chi-Square tests confirmed significant differences between Mindhori and Bhojde (χ2 = 93.8159, adjusted p = 0.001) and Mindhori and Verwangda (χ2 = 90.4903, adjusted p = 0.001), but no significant difference between Bhojde and Verwangda (χ2 = 1.2488, adjusted p = 0.7914; Table 5).
While statistical tests indicated differences in the distribution of food types among nests, these results should be interpreted cautiously given the small sample size of nests and the short observation period. At Mindhori, a relatively higher proportion of invertebrates was recorded compared to Bhojde and Verwangda, where fruits dominated provisioning. These patterns may reflect local variation in food availability around the nests rather than consistent species-level differences in provisioning strategy. Thus, we present these results as preliminary observations that highlight the potential influence of site-specific resource availability on chick diet, which warrants further investigation through long-term monitoring of additional nests.
At Mindhori nest, while female was incarcerated, male made subsequent feeding visits at an average duration of 55.81 ± 37.00 min (95% CI: 41.99–69.62). After female came outside the nest the duration decreased to 49.25 ± 33.79 min (95% CI: 40.45–58.06). Female on the other hand, made subsequent feeding visits at an average duration of 40.88 ± 30.31 min (95% CI: 33.81–47.96). At Verwangda, male appeared at the nest with food after every 30.79 ± 31.00 min (95% CI: 23.75–37.83). Male and female at Bhojde nest site, visited after every 57.06 ± 43.01 min (95% CI: 44.14–69.98), and 51.08 ± 47.35 min (95% CI: 32.72–69.44), respectively.
Fruits of banyan (Ficus bengalensis), karamda (Carissa carandas), dhraman (Grewia tiliifolia), peepal (Ficus religiosa) and invertebrates, including insects, termites, katydids, and worms, were the frequently provided food items to the chicks (Figure 3). Reptiles such as garden lizards and chameleons were provided only in trace amounts. At the Mindhori nest site, the male had a feeding proportion of 0.62 and the female 0.37. An average of 5.11 ± 3.95 food items were delivered across each feeding bout. We observed a total of 178 feeding attempts at the Bhojde nest site, with the male having a higher proportion of 0.64 and the female having a proportion of 0.35. For the Bhojde nest site, an average of 4.24 ± 2.52 food items were delivered per feeding bout, with 12 items being the maximum in a single bout. The Verwangda nest site had the lowest count of feeding attempts (109), with only the male participating in feeding activities. The average food items provided per bout was 4.69 ± 3.44, with 17 food items being the highest in a single feeding bout at the Verwangda nest site.

3.6. Habitat Selection

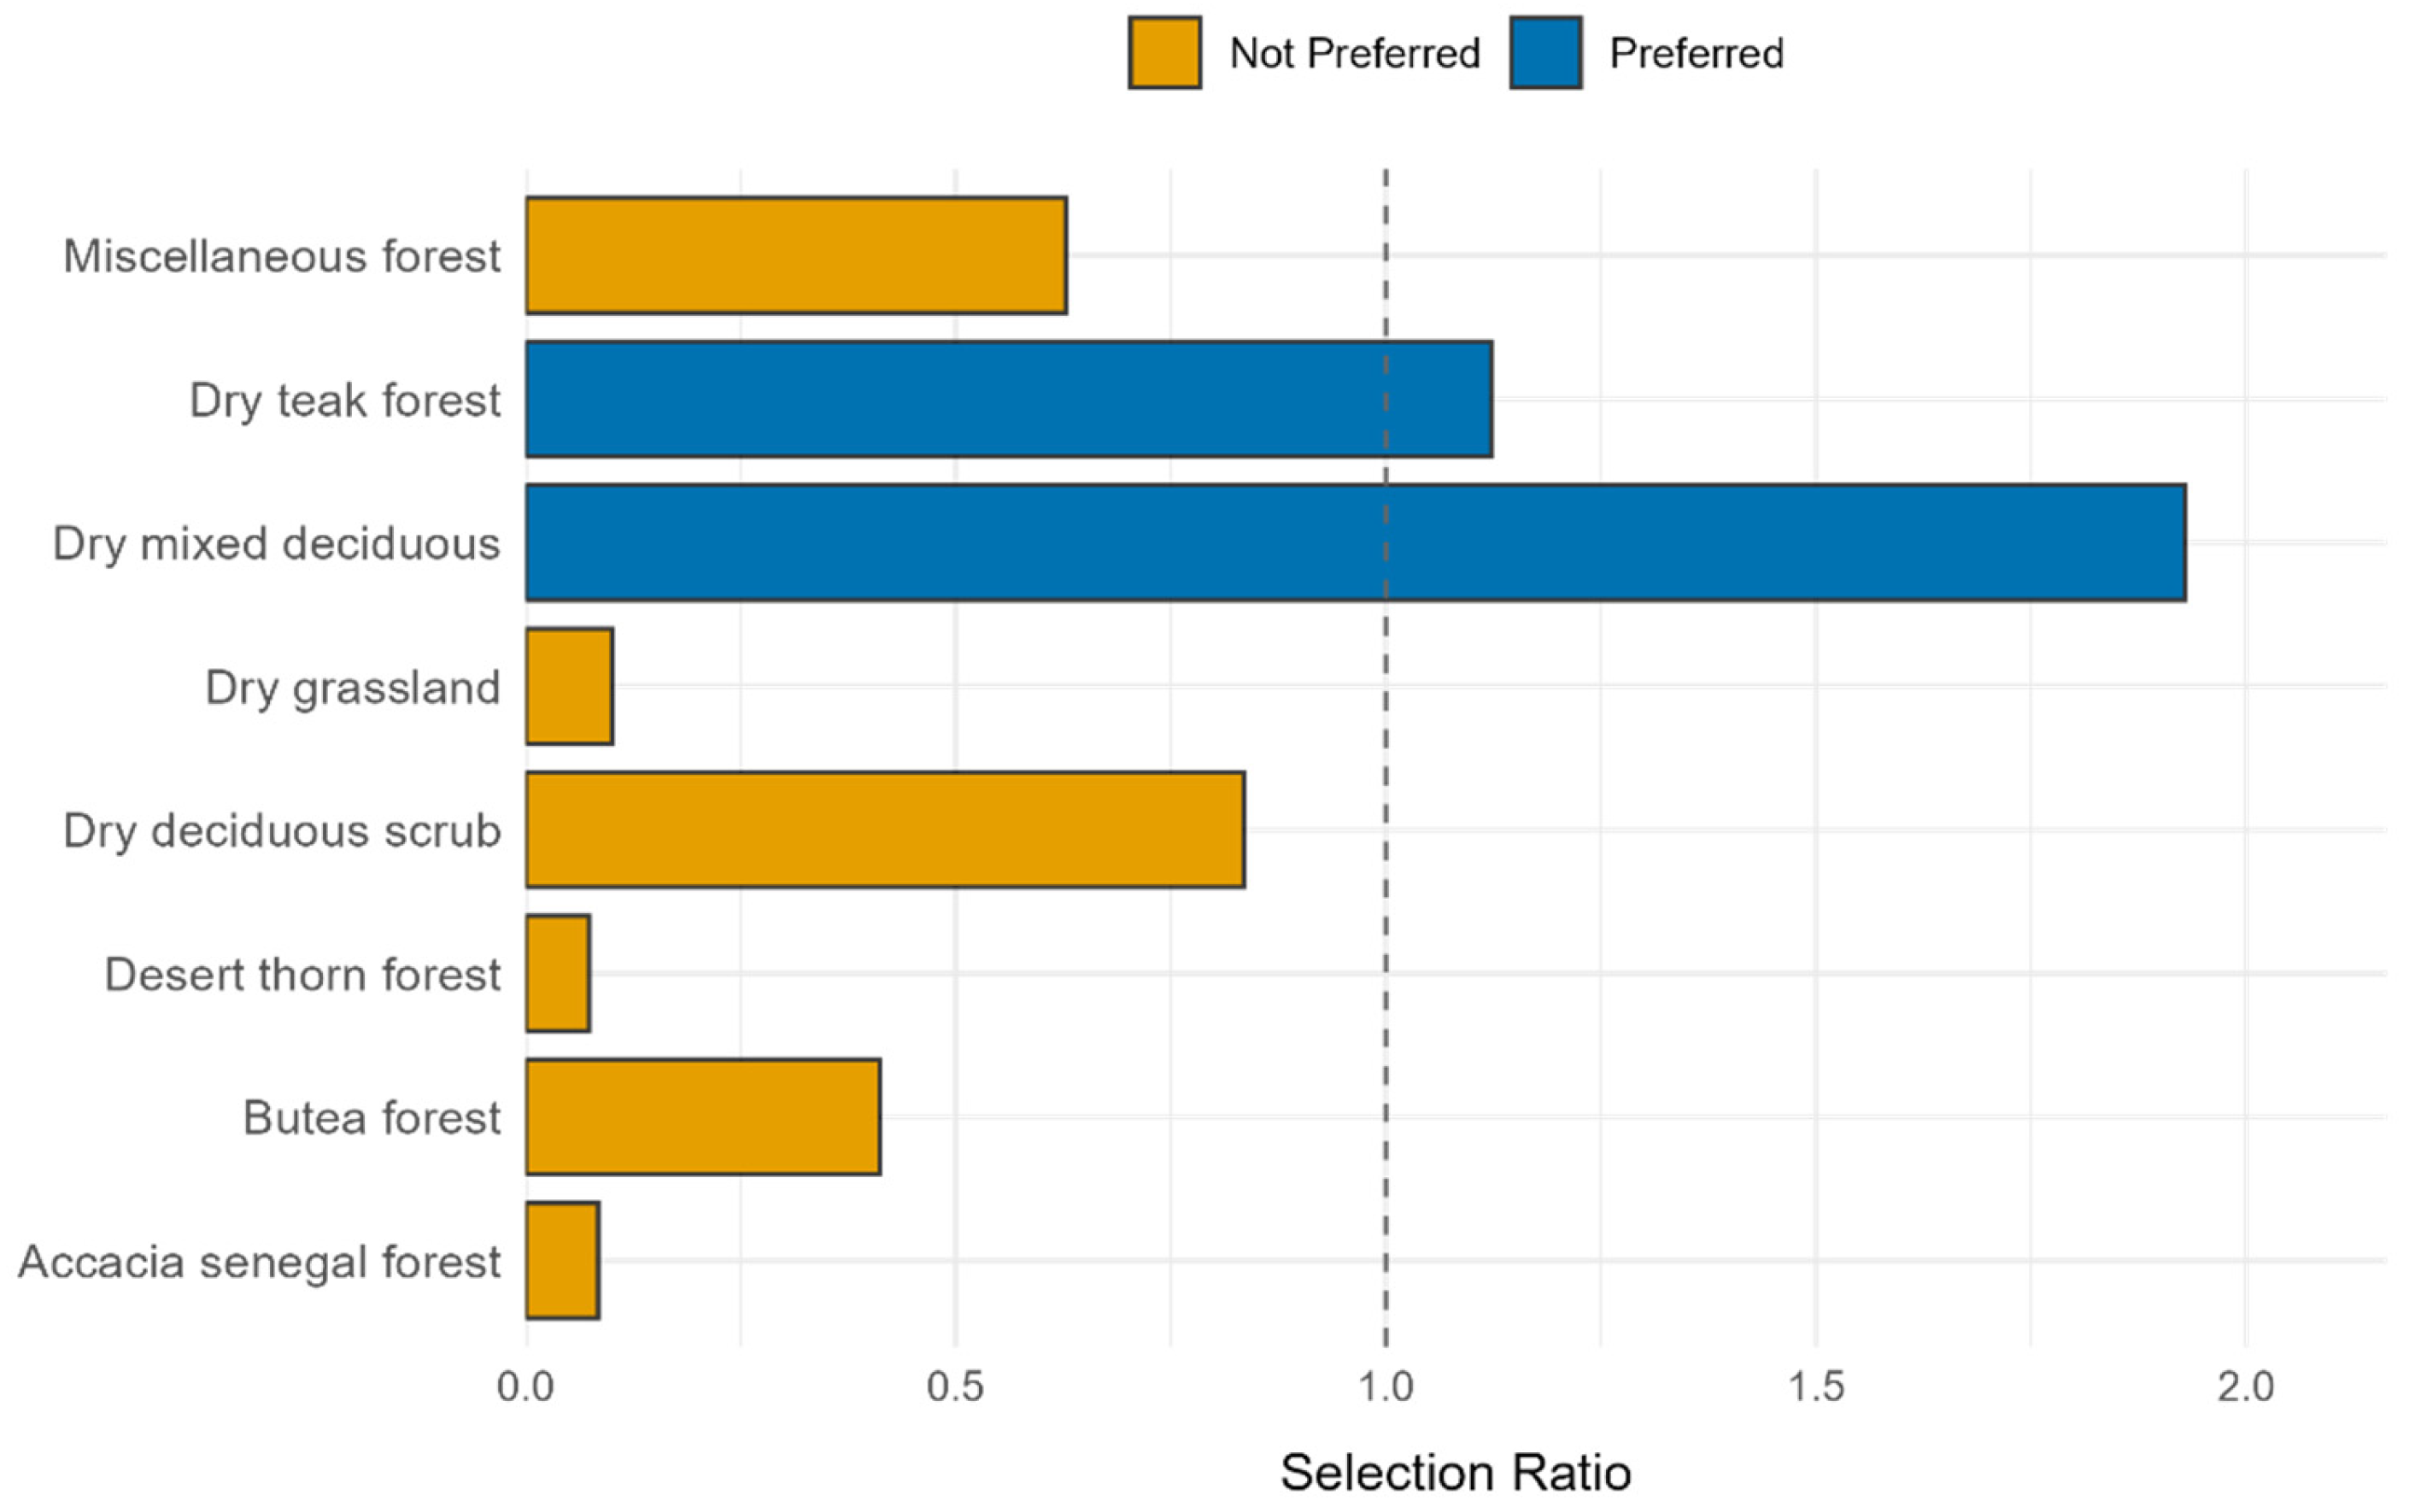
For the birds within the Gir Protected Area, the selection ratios ranged from 0.07 to 1.92, with a mean of 0.64. Habitats were categorised as “Preferred” if the selection ratio exceeded 1, indicating use greater than availability, and “Not Preferred” otherwise. Only two habitats, Dry mixed deciduous and Dry teak forest, exhibited a selection ratio of 1.92 and 1.12, classifying them as Preferred. All other habitats, including Dry deciduous scrub (0.83), Dry grassland (0.10), Butea forest (0.41), Desert thorn forest (0.07), Acacia senegal forest (0.08), and Miscellaneous Forest (0.62), were classified as Not Preferred (Figure 4).
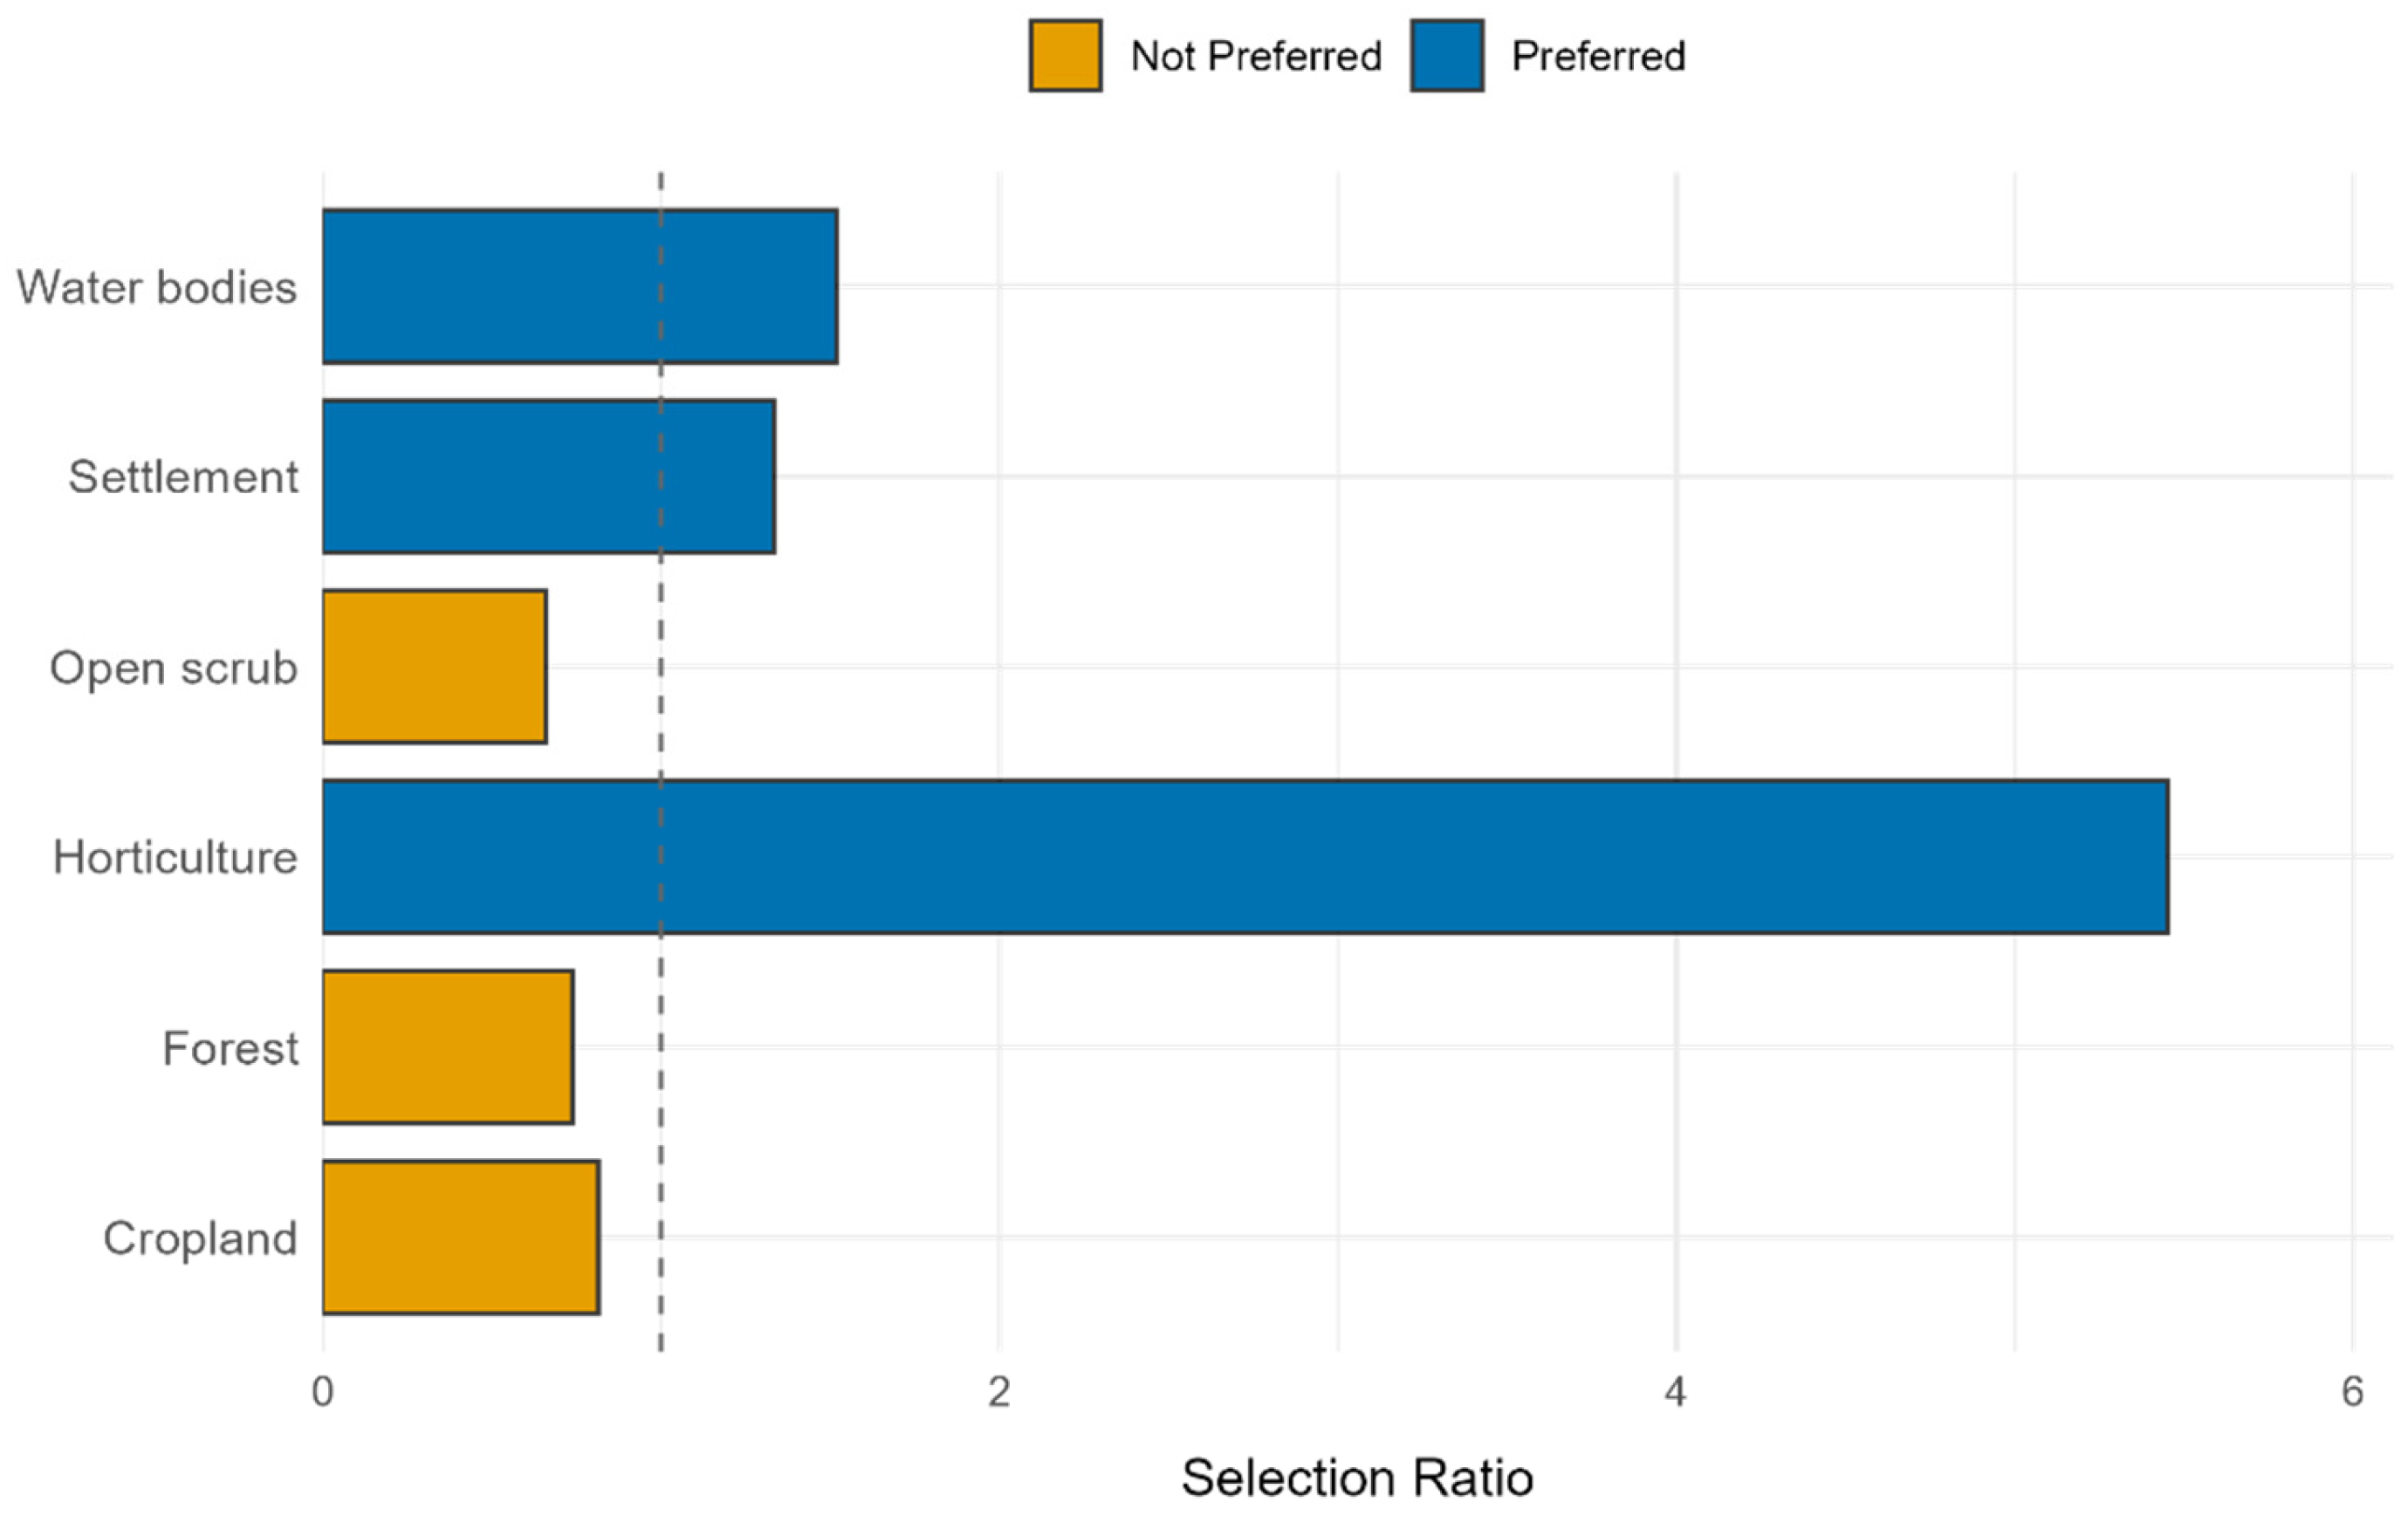
The birds that dispersed outside the protected area had a selection index ranging from 0.62 (open scrub) to 5.45 (horticulture). In addition to horticulture, Indian Grey Hornbills were seen in human habitation and over water bodies (Figure 5).

4. Discussion

Consistent with our hypothesis, the reintroduced Indian Grey Hornbills initially ranged widely after release, with large and variable home ranges and higher daily movement distances, consistent with exploratory behaviour in a new environment. Over time, both home range size and movement distances contracted markedly, indicating settlement into smaller areas. Nesting activity was observed within a year of release, with hornbills selecting relatively open sites on mature, cavity-bearing deciduous trees. Behavioural observations showed no strong sex-based differences in activity budgets, though feeding effort varied across nest sites, with Mindhori characterised by a higher reliance on invertebrates compared to the predominantly fruit-based diets at Bhojde and Verwangda. Habitat selection analyses revealed a preference for dry deciduous and teak forests within the protected area, while birds dispersing outside showed strong use of horticulture, water bodies, and even human habitation. Together, these results highlight both the adaptability of hornbills to novel conditions and the ecological factors shaping their post-release establishment.
Studies have shown that one out of three reintroduction projects fail to create a self-sustaining population [84]. At the same time, it is also argued that the establishment of a reintroduced population depends on the short-term local survival of the released individuals and their consequent breeding [18]. We achieved one of the primary goals of this study when one pair successfully produced a fledgling during the first breeding season, and three new nests were observed during the second breeding season. Indian Grey Hornbills are reported to breed from March to July [30,62], which spans the summer and early monsoon months. Our efforts to locate nests were also focused during the same months. Thus, there may be a chance of missing any nest built outside this period. The successful breeding of one hornbill pair during the first year and three more in the second year is an important aspect of establishing a new population during the establishment phase of its reintroduction in the Gir landscape.
The satellite telemetry indicated that hornbills ranged across vast areas during the initial months of the reintroductions compared to the later months of the reintroduction. This may be due to the exploratory behaviour of the reintroduced individuals, which occurs as a result of unfamiliarity with the habitat, food, and predators in new landscapes [23]. The movement into unfamiliar habitats is often risky and disorienting [85], which is why newly introduced individuals undertake intermittent exploratory movements into new habitats [86]. Hornbills settled during the later stages of reintroduction, suggesting the familiarity of the new individuals with their surroundings [87].
The movement patterns observed in Indian Grey Hornbills mirror those documented in several other avian reintroduction studies. For example, Hawaiian crows (Corvus hawaiiensis) displayed a pronounced exploratory phase immediately after release, followed by reduced movements and stronger site fidelity once settled [23]. Similar exploratory behaviour has been reported across a range of translocated birds, where larger initial ranges reflect the search for food and shelter in unfamiliar habitats [66]. Our findings suggest that this exploratory phase in hornbills is further shaped by seasonal influences. The seasonal analysis revealed a tendency for smaller home ranges during the breeding season compared to the non-breeding season, consistent with earlier reports that hornbills restrict their movements when nesting and defending territories [51,77]. Although this seasonal effect was only marginally significant, the overlap between exploratory behaviour and the onset of breeding likely explains the observed contraction in home ranges over time. This combination of exploratory movements and seasonal ecology highlights the complexity of space-use patterns in reintroduced populations and underscores the need to account for both behavioural transitions and breeding constraints in conservation planning.
The habitat selection ratios for birds within the Gir National Park and Sanctuary revealed significant variability in habitat preferences, with selection ratios ranging from 0.07 to 1.92 and a mean of 0.64. The high selection ratios for Dry mixed deciduous and Dry teak forest are particularly notable, potentially reflecting their ecological suitability for the Indian Grey Hornbill. Our results are in agreement with Balasubramanian et al. [55]. Indian Grey Hornbills were mostly found in Dry deciduous forests within the Gir National Park and Sanctuary, while the hornbills that had moved outside the Gir National Park and Sanctuary were found mostly in horticulture and habitats around human settlements. Hornbills used cavities in live trees as observed in previous studies [62,88]. We also report the reuse of nests by the Indian Grey Hornbill, as observed by Santhoshkumar and Balasubramanian [62].
In this study, hornbills selected sites that have slightly shorter and thicker trees though marginally taller trees were also available for nesting at random sites. However, tall trees at random sites had slightly lower girths compared to nest sites. Previous studies have also found that, along with tree height, their girth is also one of the critical predictors of selecting nest sites in hornbills [55,62]. In this study, hornbills selected nest sites that were not dense but were characterized by mature trees having substantial girth, but not overly tall. Such nesting preferences are valuable for conservation as they suggest preserving mature trees having substantial thickness for the successful breeding of reintroduced hornbills in the Gir landscape.
The findings presented here on feeding rates, diet composition, and nest-site characteristics are based on a very limited number of nests. As such, these results should be considered preliminary and indicative rather than definitive of the species’ broader ecological requirements in the Gir landscape. Future monitoring efforts aimed at locating and systematically studying a larger number of nests will be critical to confirm and expand upon these patterns. Our observations revealed that behavioural interactions varied noticeably between nests. As expected, females exhibited stable behavioural patterns across all sites, a consequence of their prolonged confinement within nest cavities during chick-rearing, a role well documented among cavity-sealing hornbill species [51,56]. On the other hand, the male at the Verwangda nest site showed a substantial increase in all activities compared to the males at the Mindhori and Bhojde nest sites. This pattern suggests that only the male was involved in almost all of the activities at the Verwangda nest site, mainly due to the confinement of the female inside the nest at the Verwangda site. The differences observed at each nest site suggest that environmental or biological factors unique to each nest site may drive these behavioural distinctions. Invertebrates were provisioned more frequently at the Mindhori nest site than at Bhojde and Verwangda, likely reflecting greater local availability of invertebrate prey. Conversely, the higher proportion of fruits at Bhojde and Verwangda suggests that provisioning patterns at these sites were shaped by the relative abundance of fruiting trees in the surrounding habitat. Differences in diet composition across the three monitored nests may in part reflect variation in local food availability and quality within each home range. Similar site-specific diet shifts have been noted in other hornbill populations in response to seasonal or spatial variation in food resources [59,77]. Future research should incorporate systematic assessments of fruiting tree abundance, seasonal variation in fruiting, and the availability of animal prey to link feeding behaviour with resource availability directly. Such data would provide important insights into how habitat quality shapes breeding success in reintroduced hornbill populations. Overall, our results indicated the importance of considering multiple interacting factors when determining the feeding behaviour. The significant effect of sex and nest site on feeding behaviour highlights the importance of both the intrinsic (sex) and extrinsic (site-specific) factors.
Reintroduction is globally recognized as an important part of conservation management; however, reintroduction programs are complex and often subject to uncertainties [89]. The uncertainties associated with reintroduction programs make it challenging to select or execute the optimal set of decisions or actions, resulting in a lower success rate for reintroduction programs in the past [16,67]. The successful breeding and recruitment of new individuals are important indicators of successful reintroduction, especially during the earlier phases of reintroduction [45]. Introducing new individuals into a new territory involves a complex interplay of ecological, behavioural, and environmental conditions such as suitable habitat, behavioural plasticity, predation and competition, human impact, and continuous monitoring. Based on our results, the appropriate site selection, such as preferred sites for nesting, post-release support based on each bird’s spatial behaviour, and abundance of fruiting trees, may be the critical component of future reintroduction programs in our study area.
Our findings contribute to a more general understanding of Indian Grey Hornbill behaviour while also highlighting the technical challenges of monitoring reintroduced birds. In particular, transmitter failure is a well-documented problem in avian telemetry studies, often linked to dense canopy cover that reduces solar charging and signal transmission [90,91]. Although we expected elevation to influence signal strength through its association with canopy density, our analysis revealed no significant relationship, suggesting that elevation alone is not a reliable predictor of transmission success. Similar results have been reported in studies where localised conditions such as microhabitat structure, weather, or behavioural factors like perching behaviour were stronger determinants of signal quality than topography [92,93]. The weak trend observed here may reflect site-specific variability or technical limitations of the tags themselves, underscoring the need for future work to explicitly disentangle the effects of canopy density, weather, and bird behaviour on telemetry performance.
Looking ahead, the long-term success of this reintroduction will depend on sustained monitoring of the population, particularly through systematic nest searches and detailed documentation of breeding biology to track recruitment over time [51,77]. Future work should also consider complementary approaches such as genetic monitoring, which would help assess genetic diversity and viability, along with broader ecological studies on diet and fine-scale habitat use to guide conservation management in the Gir landscape [56].
One of the key limitations of our study was the technical failure of several satellite transmitters, which reduced our ability to track individuals consistently, an issue also reported in other hornbill and large bird telemetry studies [66]. Although we were able to document breeding success in the Gir landscape, our capacity to identify multiple nest sites during the first year of reintroduction limited our inferences about nest tree preferences. In the following year, however, we located three additional nests, which allowed us to investigate nesting behaviour and social interactions in greater detail. Future studies could extend this work by examining how other habitat features, such as canopy cover, food availability, and proximity to water, shape nest site selection and its conservation implications. Our behavioural observations also highlighted the context-dependent nature of hornbill behaviour, which warrants closer examination of the underlying drivers, including resource distribution, predator pressure, and social dynamics. Although our observations did not capture the full incubation and brooding phases when females remain completely sealed, the late-stage discovery of nests provided a valuable opportunity to document parental care, food provisioning, and behavioural interactions during chick-rearing. Finally, equipping a larger number of individuals with satellite transmitters would provide long-term data to better understand spatial ecology, movement patterns, and settlement processes in reintroduced populations.

5. Conclusions

To establish a new population, the reintroduced birds need to pair and nest successfully. The most promising aspect of this study was the successful breeding of one hornbill pair during the first year of reintroduction and, later, three pairs during the second year of reintroduction. Hornbills explored vast areas within the study area and showed a preference for dry deciduous forests, such as mixed dry deciduous and dry teak forests. The nesting preferences suggest that preserving mature trees is crucial for supporting the hornbill population within the study area. The observations recorded during the feeding behaviour suggest that hornbills modulate their feeding strategies in response to varying environmental conditions. Future research could focus on exploring the underlying ecological drivers of these patterns, such as food availability, competition, or habitat quality. The observed behavioural patterns suggest that hornbills adapt their behaviours to specific ecological or social conditions, with males and females potentially optimizing their roles to suit the needs of each nest site. Further studies examining the underlying causes of these variations, such as resource availability, predator presence, or social structure, would be valuable in understanding the adaptive significance of these behavioural strategies. Due to their arboreal nature, we hypothesised that the transmitter failures might stem from insufficient solar charging. Nevertheless, no clear association was found between signal success and elevation, indicating that future investigations should consider behavioural, localized, or technical factors as potential contributors (Figure S3).

Supplementary Materials

The following supporting information can be downloaded at: https://www.mdpi.com/article/10.3390/birds6040058/s1, Figure S1: Photographic details showing the complete process of reconnaissance, capture, deployment of transmitters, colour sequence of rings, and the release of the satellite-tagged birds, Table S1: Details of 40 Indian Grey Hornbills deployed with satellite transmitters, colour rings and their respective release sites within the Gir National Park and Sanctuary, Table S2: Details of direct sightings of released Indian Grey Hornbills within Gir National Park and Sanctuary, Table S3: Summary of the satellite telemetry of eleven Indian Grey Hornbills in Gir National Park and Sanctuary, Gujarat, India. The first five birds (IGHM-1 to IGHM-5) were tagged during the first phase (October 2021 to March 2022), and the rest were tagged during the second phase (December 2023), Table S4: Comparison of the variables between the nest (n = 3) and random sites (n = 12) and summary of the Two-Sample t-test, Table S5: Results of Linear Mixed Models for monthly and daily distance covered during the Initial and Later phases of reintroduction and the reflected core areas (50% KDE) and overall home ranges (95% KDE) during the same stages (Initial and Later), Figure S2: Home range polygons of the satellite-tagged Indian Grey Hornbills and sightings of non-satellite-tagged individuals in Gir National Park and Sanctuary, Gujarat, India, Table S6: Characteristic features of nesting trees used by Indian Grey Hornbills in Gir Landscape, Figure S3: The scatter plot of elevation (X-axis) versus signal success (Y-axis) for the transmitters fitted on Indian Grey Hornbills to test the relationship between signal strength and elevation.

Author Contributions

Conceptualization, M.R. and A.S.; data curation, M.R., A.S., D.G., T.A.R. and T.D.; formal analysis, M.R., A.S., D.G., T.A.R., T.D., V.M., L.J. and Y.Z.; funding acquisition, M.R., A.S. and N.S.; investigation, M.R., D.G., T.A.R., V.M., L.J., Y.Z. and D.J.; methodology, M.R., D.G., A.S. and T.A.R.; project administration, M.R. and A.S.; resources, M.R., D.G., D.J., A.S. and N.S.; software, T.A.R., D.G., Y.Z. and L.J.; supervision, M.R., A.S. and N.S.; validation, M.R., D.G., A.S., T.A.R., L.J. and V.M.; visualization, M.R., T.A.R. and D.G.; writing—original draft, M.R., D.G. and T.A.R.; writing—review and editing, M.R., D.G., T.A.R., V.M., L.J., Y.Z., T.D. and D.J. All authors have read and agreed to the published version of the manuscript.

Funding

This research received no external funding. It was undertaken by the Wildlife Division, Sasan-Gir, Gujarat Forest Department, and is one of the division’s works. Therefore, the work was conducted according to the funds received under various heads for this purpose.

Institutional Review Board Statement

All scientific research activities involved in this study were carried out after obtaining due permission from the competent authority [Chief Wildlife Warden, Gujarat state, Gandhinagar, India, (letter no.: WLP/T.27/B/446/2021-22, dated 18 May 2021). All experimental methods and works were carried out in accordance with the relevant guidelines and regulations suggested by the Principal Chief Conservator of Forests (Wildlife) and Chief Wildlife Warden, Gujarat Forest Department, Government of Gujarat. The technical experts, experienced bird trappers and handlers, and qualified and experienced veterinarians carried out the tagging work.

Data Availability Statement

The original contributions presented in the study are included in the article/Supplementary Information; further inquiries can be directed to the corresponding author.

Acknowledgments

The authors would like to thank the Principal Chief Conservator of Forests and Head of Forest Force (PCCF&HoFF), Gujarat state, for their help and support. The field support extended by P. Purushothama, DCF Aravalli Forest Division, Modasa and his field staff, especially Manoj Taviyad, is duly acknowledged. We also acknowledge the technical support extended by the staff of The Corbett Foundation (TCF), and we especially thank Kedar Gore, for his constant support and encouragement. We are thankful to the Government of Gujarat and the Gujarat Forest Department for the permission and support of this important scientific study. We acknowledge the support, efforts and field observations by the field tracker team of Wildlife Division, Sasan-Gir. We also acknowledge the support of the staff at the Wildlife Division, Sasan-Gir, and personnel at the Gir Hi-Tech Monitoring Unit, Sasan-Gir, for helping to monitor the Indian grey hornbills satellite telemetry work.

Conflicts of Interest

The authors have no competing interests to declare relevant to this article’s content. The authors also declare that the territorial descriptions on the maps are based on Google Imagery, and we remain neutral regarding the country boundaries depicted.

References

  1. Evans, M.J.; Gordon, I.J.; Pierson, J.C.; Neaves, L.E.; Wilson, B.A.; Brockett, B.; Ross, C.E.; Smith, K.J.; Rapley, S.; Andrewartha, T.A.; et al. Reintroduction Biology and the IUCN Red List: The Dominance of Species of Least Concern in the Peer-Reviewed Literature. Glob. Ecol. Conserv. 2022, 38, e02242. [Google Scholar] [CrossRef]
  2. Albert, C.; Luque, G.M.; Courchamp, F. The Twenty Most Charismatic Species. PLoS ONE 2018, 13, e0199149. [Google Scholar] [CrossRef] [PubMed]
  3. Merta, D.; Kobielski, J.; Theuerkauf, J.; Gula, R. Towards a Successful Reintroduction of Capercaillies—Activity, Movements and Diet of Young Released to the Lower Silesia Forest, Poland. Wildl. Biol. 2016, 22, 130–135. [Google Scholar] [CrossRef]
  4. Burnside, R.J.; Carter, I.; Dawes, A.; Waters, D.; Lock, L.; Goriup, P.; Székely, T. The UK Great Bustard Otis tarda Reintroduction Trial: A 5-Year Progress Report. Oryx 2012, 46, 112–121. [Google Scholar] [CrossRef]
  5. Vernon, C.J.; Dean, W.R.J. The Introduction of the Chukar Partridge Alectoris chukar to Southern Africa. Ostrich 2022, 93, 157–159. [Google Scholar] [CrossRef]
  6. Chiatante, G.; Meriggi, A. Habitat Selection and Density of Common Pheasant (Phasianus colchicus) in Northern Italy: Effects of Land Use Cover and Landscape Configuration. Eur. J. Wildl. Res. 2022, 68, 26. [Google Scholar] [CrossRef]
  7. Ashrafzadeh, M.R.; Khosravi, R.; Fernandes, C.; Aguayo, C.; Bagi, Z.; Lavadinović, V.M.; Szendrei, L.; Beuković, D.; Mihalik, B.; Kusza, S. Assessing the Origin, Genetic Structure and Demographic History of the Common Pheasant (Phasianus colchicus) in the Introduced European Range. Sci. Rep. 2021, 11, 21721. [Google Scholar] [CrossRef]
  8. Baratti, M.; Ammannati, M.; Magnelli, C.; Dessì-Fulgheri, F. Introgression of Chukar Genes into a Reintroduced Red-Legged Partridge (Alectoris rufa) Population in Central Italy. Anim. Genet. 2005, 36, 29–35. [Google Scholar] [CrossRef]
  9. Chaiyarat, R.; Kongprom, U.; Manathamkamon, D.; Wanpradab, S.; Sangarang, S. Captive Breeding and Reintroduction of the Oriental Pied Hornbill (Anthracoceros albirostris) in Khao Kheow Open Zoo, Thailand. Zoo Biol. 2012, 31, 683–693. [Google Scholar] [CrossRef]
  10. Kemp, L.V.; Kotze, A.; Jansen, R.; Dalton, D.L.; Grobler, P.; Little, R.M. Review of Trial Reintroductions of the Long-Lived, Cooperative Breeding Southern Ground-Hornbill. Bird Conserv. Int. 2020, 30, 533–558. [Google Scholar] [CrossRef]
  11. Seddon, P.J.; Soorae, P.S.; Launay, F. Taxonomic Bias in Reintroduction Projects. Anim. Conserv. 2005, 8, 51–58. [Google Scholar] [CrossRef]
  12. Destro, G.F.G.; De Marco, P.; Terribile, L.C. Threats for Bird Population Restoration: A Systematic Review. Perspect. Ecol. Conserv. 2018, 16, 68–73. [Google Scholar] [CrossRef]
  13. Kleiman, D.G. Reintroduction of Captive Mammals for Conservation: Guidelines for Reintroducing Endangered Species into the Wild. BioScience 1989, 39, 152–161. [Google Scholar] [CrossRef]
  14. IUCN. The IUCN Position Statement on Translocation of Living Organisms: Introductions, Re-Introductions and Re-Stocking; IUCN: Gland, Switzerland, 1987. [Google Scholar]
  15. Lyles, A.M.; May, R.M. Problems in Leaving the Ark. Nature 1987, 326, 245–246. [Google Scholar] [CrossRef]
  16. Magdalena Wolf, C.; Garland, T.; Griffith, B. Predictors of Avian and Mammalian Translocation Success: Reanalysis with Phylogenetically Independent Contrasts. Biol. Conserv. 1998, 86, 243–255. [Google Scholar] [CrossRef]
  17. Seddon, P.J.; Armstrong, D.P.; Maloney, R.F. Developing the Science of Reintroduction Biology. Conserv. Biol. 2007, 21, 303–312. [Google Scholar] [CrossRef]
  18. Armstrong, D.P.; Seddon, P.J. Directions in Reintroduction Biology. Trends Ecol. Evol. 2008, 23, 20–25. [Google Scholar] [CrossRef]
  19. Bernardo, C.S.S.; Lloyd, H.; Olmos, F.; Cancian, L.F.; Galetti, M. Using Post-Release Monitoring Data to Optimize Avian Reintroduction Programs: A 2-Year Case Study from the Brazilian Atlantic Rainforest. Anim. Conserv. 2011, 14, 676–686. [Google Scholar] [CrossRef]
  20. Kuwabara, R.; Ohsako, Y.; Funakoshi, M.; Deguchi, T. Which Combination of Release Techniques and Ages Minimizes Post-Release Dispersal during Oriental Stork Reintroduction? J. Field Ornithol. 2024, 95, 6. [Google Scholar] [CrossRef]
  21. Armstrong, D.P.; Castro, I.; Alley, J.C.; Feenstra, B.; Perrott, J.K. Mortality and Behaviour of Hihi, an Endangered New Zealand Honeyeater, in the Establishment Phase Following Translocation. Biol. Conserv. 1999, 89, 329–339. [Google Scholar] [CrossRef]
  22. Martinez, L.A.; Lombardi, J.V.; Parker, I.D.; East, F.; Campbell, T.A.; Lopez, R.R. Long Live the Cat: Ocelot Population Viability in a Planned Reintroduced Population in Texas, USA. Ecosphere 2024, 15, e70044. [Google Scholar] [CrossRef]
  23. Smetzer, J.R.; Greggor, A.L.; Paxton, K.L.; Masuda, B.; Paxton, E.H. Automated Telemetry Reveals Post-Reintroduction Exploratory Behavior and Movement Patterns of an Endangered Corvid, ‘Alalā (Corvus hawaiiensis) in Hawai’i, USA. Glob. Ecol. Conserv. 2021, 26, e01522. [Google Scholar] [CrossRef]
  24. Armstong, D.P.; McLean, I.G. New Zealand Translocations: Theory and Practice. Pac. Conserv. Biol. 1995, 2, 39–54. [Google Scholar] [CrossRef]
  25. Moseby, K.E.; Hill, B.M.; Lavery, T.H. Tailoring Release Protocols to Individual Species and Sites: One Size Does Not Fit All. PLoS ONE 2014, 9, e99753. [Google Scholar] [CrossRef] [PubMed]
  26. King, A.C.; Reed, J.M. Successful Population Establishment from Small Introductions Appears to Be Less Common than Believed. PeerJ 2016, 4, e2440. [Google Scholar] [CrossRef] [PubMed]
  27. Meretsky, V.; Snyder, N.F.R.; Beissinger, S.R.; Clendenen, D.A.; Wiley, J.W. Quantity versus Quality in California Condor Reintroduction: Reply to Beres and Starfield. Conserv. Biol. 2001, 15, 1449–1451. [Google Scholar] [CrossRef]
  28. BirdLife International IUCN. Red List of Threatened Species: Ocyceros birostris. IUCN Red List Threathened Species. 2020. Available online: https://dx.doi.org/10.2305/IUCN.UK.2020-3.RLTS.T22682429A184951065.en (accessed on 12 March 2025).
  29. SoIB. State of India’s Birds, 2023: Range, Trends, and Conservation Status; The SoIB Partnership: New Delhi, India, 2023; Available online: https://stateofindiasbirds.in/ (accessed on 19 August 2025).
  30. Ali, S.; Ripley, S.D.; Society, B.N.H. Handbook of the Birds of India and Pakistan: Together with Those of Bangladesh, Nepal, Bhutan, and Sri Lanka, Compact ed.; Oxford University Press: Oxford, UK, 1983. [Google Scholar]
  31. Dharmakumarsinhji, R.S. Birds of Saurashtra; Times of India Press: Bombay, India, 1955. [Google Scholar]
  32. Dharmakumarsinhji, K.S. Wild Life Preservation in India. Annual Report for 1953 on the Western Region. J. Bombay Nat. Hist. Soc. 1954, 52, 865–873. [Google Scholar]
  33. Dharmakumarsinhji, K.S. The Changing Wildlife of Kathiawar. J. Bombay Nat. Hist. Soc. 1978, 75, 632–650. [Google Scholar]
  34. Gurubh, R. The Common Grey Hornbill in the Gir Forest. Newsl. Birdwatch. 1971, 11, 6–7. [Google Scholar]
  35. Khacher, L. The Birds of Gujarat—A Salim Ali Centenary Year Overview. J. Bombay Nat. Hist. Soc. 1996, 93, 331–373. [Google Scholar]
  36. Divyabhanusinh, C. The Story of Asia’s Lions; Marg Publication: Mumbai, India, 2005. [Google Scholar]
  37. Rahmani, A.R.; Islam, M.Z.; Kasambe, R.M. Important Bird and Biodiversity Areas in India: Priority Sites for Conservation (Revised and Updated); Bombay Natural History Society, Indian Bird Conservation Network, Royal Society for the Protection of Birds and BirdLife International (U.K.): Mumbai, India, 2016; pp. xii–1992. [Google Scholar]
  38. Ganpule, P. The Birds of Gujarat: Status and Distribution. Flamingo 2016, 8–12, 2–40. [Google Scholar]
  39. Jadeja, B.; Nakar, R. Phenological Studies of Some Tree Species from Girnar Reserve Forest, Gujarat India. Plant Arch. 2010, 10, 825–882. [Google Scholar]
  40. IUCN. Guidelines for Reintroductions and Other Conservation Translocations; IUCN: Gland, Switzerland, 2013; ISBN 978-2-8317-1609-1. [Google Scholar]
  41. Rashid, M.A. Wildlife and Its Conservation in Gujarat State. Cheetal 1979, 21, 36–42. [Google Scholar]
  42. Vasavada, D.T.; Rana, V.J.; Mohan, R. Management Plan for Gir Protected Areas; Wildlife Division, Gujarat Forest Department: Gandhinagar, India, 2022; Volume 1.
  43. Kitamura, S. Frugivory and Seed Dispersal by Hornbills (Bucerotidae) in Tropical Forests. Acta Oecol. 2011, 37, 531–541. [Google Scholar] [CrossRef]
  44. Naniwadekar, R.; Rathore, A.; Shukla, U.; Chaplod, S.; Datta, A. How Far Do Asian Forest Hornbills Disperse Seeds? Acta Oecol. 2019, 101, 103482. [Google Scholar] [CrossRef]
  45. Yu, X.; Li, X.; Huo, Z. Breeding Ecology and Success of a Reintroduced Population of the Endangered Crested Ibis Nipponia nippon. Bird Conserv. Int. 2015, 25, 207–219. [Google Scholar] [CrossRef]
  46. Rodgers, W.A.; Panwar, H.S. Planning a Wildlife Protected Area Network in India; Wildlife Institute of India: Dehradun, India, 1988. [Google Scholar]
  47. India Meteorological Department Met Centre Ahmedabad Current Weather and Climate Data. Available online: https://mausam.imd.gov.in/ahmedabad/ (accessed on 29 September 2025).
  48. Champion, H.G.; Seth, S.K. A Revised Survey of Forest Types of India; Government of India Press: New Delhi, India, 1968. [Google Scholar]
  49. Khan, J.A.; Chellam, R.; Rodgers, W.A.; Johnsingh, A.J.T. Ungulate Densities and Biomass in the Tropical Dry Deciduous Forests of Gir, Gujarat, India. J. Trop. Ecol. 1996, 12, 149–162. [Google Scholar] [CrossRef]
  50. Sridhar, S. Need for Designing and Fixing Artificial Nest Boxes to Conserve the Hornbills. Bird Behav. 2021, 61, 53. [Google Scholar]
  51. Kemp, A.C.; Woodcock, M. The Hornbills: Bucerotiformes; Bird Families of the World; Oxford University Press: Oxford, UK, 1995. [Google Scholar]
  52. Patil, N.; Chaturvedi, N.; Hegde, V. Food of Common Grey Hornbill Tockus birostris (Scopoli). J. Bombay Nat. Hist. Soc. 1997, 94, 408–410. [Google Scholar]
  53. Kasambe, R. Indian Grey Hornbill: Study of the Ecology and Breeding Behaviour of Indian Grey Hornbill Ocyceros birostris in Central India; Lambert Academic Publishing: Saarbrücken, Germany, 2011. [Google Scholar]
  54. Kemp, A.C. A Review of the Hornbills: Biology and Radiation. Living Bird 1979, 17, 5–136. [Google Scholar]
  55. Balasubramanian, P.; Santhoshkumar, E.; Anbarasu, C. Vegetation Features and Restoration Initiatives in the Indian Grey Hornbill Habitats in Sathyamangalam Wildlife Sanctuary, Eastern Ghats, India. Raffles Bull Zool 2011, 24, 53–57. [Google Scholar]
  56. Poonswad, P.; Kemp, A.C.; Strange, M. Hornbills of the World: A Photographic Guide; Draco Publishing and Distribution Pte Limited: Singapore, 2013. [Google Scholar]
  57. Balasubramanian, P.; Vijayan, V.S.; Prasad, S.N.; Venkitachalam, R. Status and Distribution of the Hornbills in the Eastern Ghats. Project Report; Salim Ali Centre for Ornithology and Natural History: Coimbatore, India, 2005. [Google Scholar]
  58. Gadikar, A. Adaptations of the Indian Grey Hornbill Ocyceros birostris in an Urban Environment. Indian Birds 2017, 13, 167–168. [Google Scholar]
  59. Santhoshkumar, E.; Balasubramanian, P. Food Habits of Indian Grey Hornbill Ocyceros birostris in Sathyamangalam Forest Division, Eastern Ghats, India. J. Bombay Nat. Hist. Soc. (JBNHS) 2014, 111, 90–97. [Google Scholar] [CrossRef]
  60. Charde, P.; Kasambe, R.; Tarar, J. Breeding Behaviour of Indian Grey Hornbills in Central India. Raffles Bull. Zool. Suppl. 2011, 24, 59–64. [Google Scholar]
  61. Santhoshkumar, E.; Balasubramanian, P. Seed Dispersal by the Indian Grey Hornbill Ocyceros birostris in Eastern Ghats, India. Ecotropica 2011, 17, 71–77. [Google Scholar]
  62. Santhoshkumar, E.; Balasubramanian, P. Breeding Behaviour and Nest Tree Use by Indian Grey Hornbill Ocyceros birostris in the Eastern Ghats, India. Forktail 2010, 26, 82–85. [Google Scholar]
  63. Pittie, A. A Note on the Circumorbital Skin Colour of Indian Grey Hornbill Ocyceros birostris. J. Bombay Nat. Hist. Soc. 2003, 100, 141. [Google Scholar]
  64. Anggraini, K.; Kinnaird, M.; O’Brien, T. The Effects of Fruit Availability and Habitat Disturbance on an Assemblage of Sumatran Hornbills. Bird Conserv. Int. 2000, 10, 189–202. [Google Scholar] [CrossRef]
  65. Singh, H.S. Protected Areas and Natural Heritage Sites of Gujarat; Gujarat Biodiversity Board: Gandhinagar, India, 2014.
  66. Lee, S.C.R.; Hodgson, D.J.; Bearhop, S. What Has Biotelemetry Ever Done for Avian Translocations? Mov. Ecol. 2022, 10, 57. [Google Scholar] [CrossRef]
  67. Fischer, J.; Lindenmayer, D.B. An Assessment of the Published Results of Animal Relocations. Biol. Conserv. 2000, 96, 1–11. [Google Scholar] [CrossRef]
  68. Tavecchia, G.; Viedma, C.; Martínez-Abraín, A.; Bartolomé, M.-A.; Gómez, J.A.; Oro, D. Maximizing Re-Introduction Success: Assessing the Immediate Cost of Release in a Threatened Waterfowl. Biol. Conserv. 2009, 142, 3005–3012. [Google Scholar] [CrossRef]
  69. Donald, P.F. Adult Sex Ratios in Wild Bird Populations. Ibis 2007, 149, 671–692. [Google Scholar] [CrossRef]
  70. Sivakumar, K.; Jhala, Y.; Bhardwaj, G.; Mohan, A. Study on Ecology and Migration of Lesser Florican (Sypheotides indica) in Western India Using Satellite Techniques; Project Report, 80; Wildlife Institute of India: Uttarakhand, India, 2016. [Google Scholar]
  71. Ram, M.; Vasavada, D.; Tikadar, S.; Gadhavi, D.; Rather, T.A.; Jhala, L.; Zala, Y. Breeding and Non-Breeding Home Range, and Dispersal Patterns of The Critically Endangered Lesser Florican Sypheotides indicus (Miller, 1782). J. Bombay Nat. Hist. Soc. (JBNHS) 2022, 119, 3–10. [Google Scholar] [CrossRef]
  72. CLS Argos System. ARGOS Satellite Telemetry Data Portal. Available online: http://argos-system.cls.fr/argos-cwi2/login.html (accessed on 12 March 2023).
  73. Ornitela. GPS-GSM Wildlife Tracking Platform. Available online: https://cpanel.glosendas.net/ (accessed on 24 April 2023).
  74. Gurarie, E.; Andrews, R.D.; Laidre, K.L. A Novel Method for Identifying Behavioural Changes in Animal Movement Data. Ecol. Lett. 2009, 12, 395–408. [Google Scholar] [CrossRef] [PubMed]
  75. Killick, R.; Eckley, I.A. Changepoint: An R Package for Changepoint Analysis. J. Stat. Softw. 2014, 58, 1–19. [Google Scholar] [CrossRef]
  76. Moehrenschlager, A.; Macdonald, D.W. Movement and Survival Parameters of Translocated and Resident Swift Foxes Vulpes velox. Anim. Conserv. 2003, 6, 199–206. [Google Scholar] [CrossRef]
  77. Datta, A. An Ecological Study of Sympatric Hornbills and Fruiting Patterns in a Tropical Forest in Arunachal Pradesh. Ph.D. Thesis, Saurashtra University, Rajkot, India, 2001. [Google Scholar]
  78. Manly, B.F.J.; McDonald, L.L.; Thomas, D.L.; McDonald, T.L.; Erickson, W.P. Resource Selection by Animals: Statistical Design and Analysis for Field Studies, 2nd ed.; Kluwer Academic Publishers: Dordrecht, The Netherlands, 2002; pp. 46–82. ISBN 978-0-306-48151-2. [Google Scholar]
  79. Datta, A.; Rawat, G.S. Nest-Site Selection and Nesting Success of Three Hornbill Species in Arunachal Pradesh, North-East India: Great Hornbill Buceros bicornis, Wreathed Hornbill Aceros undulatus and Oriental Pied Hornbill Anthracoceros albirostris. Bird Conserv. Int. 2004, 14, S39–S52. [Google Scholar] [CrossRef]
  80. Calenge, C. The Package “Adehabitat” for the R Software: A Tool for the Analysis of Space and Habitat Use by Animals. Ecol. Model. 2006, 197, 516–519. [Google Scholar] [CrossRef]
  81. R Core Team. R: A Language and Environment for Statistical Computing; R Foundation for Statistical Computing: Vienna, Austria, 2023; Available online: https://www.r-project.org/ (accessed on 4 December 2023).
  82. Bates, D.; Mächler, M.; Bolker, B.; Walker, S. Fitting Linear Mixed-Effects Models Using Lme4. J. Stat. Softw. 2015, 67, 1–48. [Google Scholar] [CrossRef]
  83. Lenth, R. Emmeans: Estimated Marginal Means, Aka Least-Squares Means, R Package Version 1.9. 0. 2023; R Foundation for Statistical Computing: Vienna, Austria, 2024. Available online: https://CRAN.R-project.org/package=emmeans (accessed on 19 August 2025).
  84. Griffith, B.; Scott, J.M.; Carpenter, J.W.; Reed, C. Translocation as a Species Conservation Tool: Status and Strategy. Science 1989, 245, 477–480. [Google Scholar] [CrossRef]
  85. Brown, J.S.; Kotler, B.P. Hazardous Duty Pay and the Foraging Cost of Predation. Ecol. Lett. 2004, 7, 999–1014. [Google Scholar] [CrossRef]
  86. Schmitz, P.; Caspers, S.; Warren, P.; Witte, K. First Steps into the Wild-Exploration Behavior of European Bison after the First Reintroduction in Western Europe. PLoS ONE 2015, 10, e0143046. [Google Scholar] [CrossRef]
  87. Fryxell, J.M.; Hazell, M.; Börger, L.; Dalziel, B.D.; Haydon, D.T.; Morales, J.M.; McIntosh, T.; Rosatte, R.C. Multiple Movement Modes by Large Herbivores at Multiple Spatiotemporal Scales. Proc. Natl. Acad. Sci. USA 2008, 105, 19114–19119. [Google Scholar] [CrossRef]
  88. Mudappa, D.C.; Kannan, R. Nest-Site Characteristics and Nesting Success of the Malabar Gray Hornbill in the Southern Western Ghats, India. Wilson Bull. 1997, 109, 102–111. [Google Scholar]
  89. Taylor, G.; Canessa, S.; Clarke, R.H.; Ingwersen, D.; Armstrong, D.P.; Seddon, P.J.; Ewen, J.G. Is Reintroduction Biology an Effective Applied Science? Trends Ecol. Evol. 2017, 32, 873–880. [Google Scholar] [CrossRef] [PubMed]
  90. Kenward, R.E. A Manual for Wildlife Radio Tagging; Academic Press: London, UK, 2000; ISBN 978-0-08-057420-2. [Google Scholar]
  91. Bridge, E.S.; Thorup, K.; Bowlin, M.S.; Chilson, P.B.; Diehl, R.H.; Fléron, R.W.; Hartl, P.; Kays, R.; Kelly, J.F.; Robinson, W.D.; et al. Technology on the Move: Recent and Forthcoming Innovations for Tracking Migratory Birds. BioScience 2011, 61, 689–698. [Google Scholar] [CrossRef]
  92. Hebblewhite, M.; Haydon, D.T. Distinguishing Technology from Biology: A Critical Review of the Use of GPS Telemetry Data in Ecology. Philos. Trans. R. Soc. B Biol. Sci. 2010, 365, 2303–2312. [Google Scholar] [CrossRef]
  93. Kays, R.; Crofoot, M.C.; Jetz, W.; Wikelski, M. Terrestrial Animal Tracking as an Eye on Life and Planet. Science 2015, 348, aaa2478. [Google Scholar] [CrossRef]
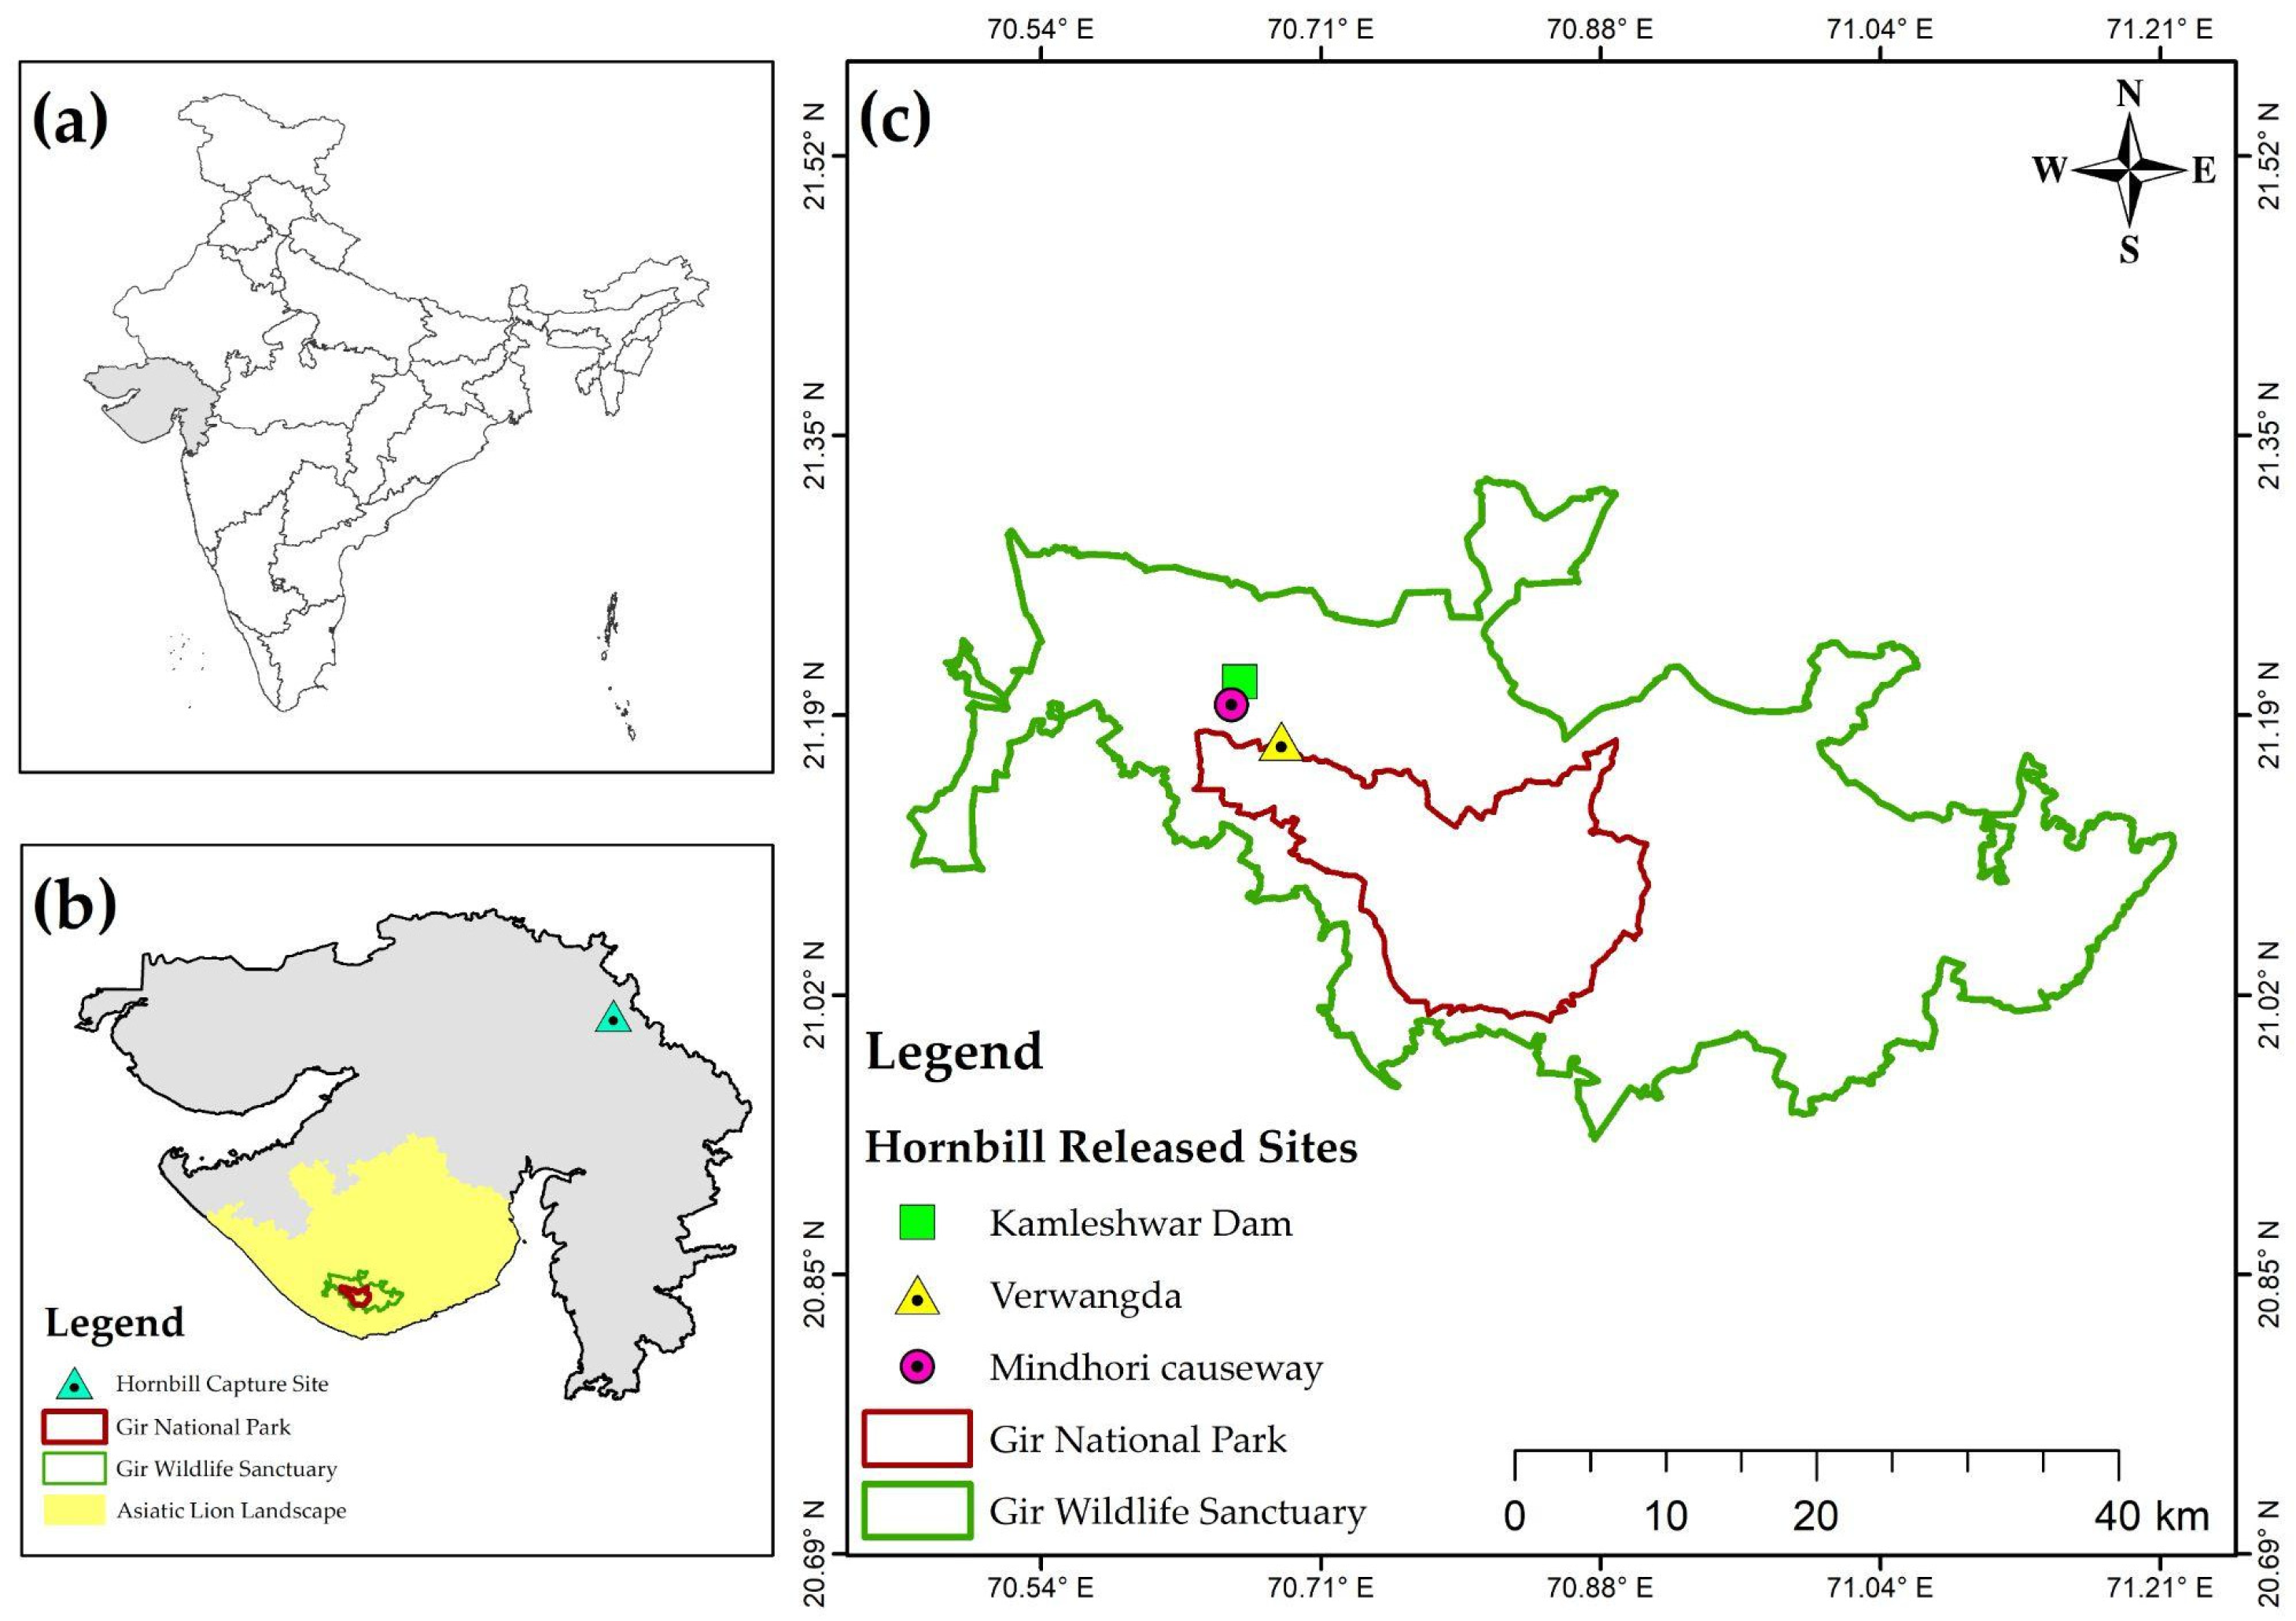
Figure 1. Illustrates the study area and includes three panels. Panel (a) depicts the location of Gujarat state within India. Panel (b) showcases the Asiatic Lion Landscape, Gir National Park and Sanctuary, and the capture site for Indian Grey Hornbills in northern Gujarat. Panel (c) provides an overview of Gir National Park and Sanctuary, along with the specific release sites.
Birds 06 00058 g001
Figure 2. Seasonal variation in home range size (95% KDE) kernel density estimation of reintroduced Indian Grey Hornbills in the Gir landscape. Boxplots show the distribution of individual monthly home range estimates (n = 24 observations from five individuals) grouped by breeding (March–June) and non-breeding (July–February) seasons. The Y-axis is presented on a log scale to accommodate variation across individuals. Black dots represent individual monthly estimates.
Birds 06 00058 g002
Figure 3. Mean number of food items delivered to nestlings by Indian Grey Hornbills across three nest sites (Bhojde, Mindhori, and Verwangda), grouped by sex (male in blue, female in orange). Food items were categorised as fruits or invertebrates, and error bars represent standard errors of the mean.
Birds 06 00058 g003
Figure 4. Habitat selection ratios (Manly’s) for Indian Grey Hornbills within Gir Protected Area across eight habitat types, with bars indicating selection ratios. Habitats with a selection ratio greater than one (blue) are classified as preferred, and those with a selection ratio less than one (orange) as not preferred. The dashed vertical line indicates a selection ratio equal to 1.
Birds 06 00058 g004
Figure 5. Habitat selection ratios (Manly’s) for Indian Grey Hornbills outside Gir Protected Area across six habitat types, with bars indicating selection ratios. Habitats with a selection ratio greater than one (blue) are classified as preferred, and those with a selection ratio less than one (orange) as not preferred. The dashed vertical line indicates a selection ratio equal to 1.
Birds 06 00058 g005
Table 1. Estimates of core areas and overall home ranges at 50% (kernel density estimation) KDE and 95% (kernel density estimation) KDE during the Initial and the Later phase of reintroduction for Indian Grey Hornbills. The Initial Phase encompassed the first three months following release, while the Later Phase was defined as the period beyond this interval.
Bird IDMonthCore Area (50% KDE) Km2Overall Home Range
(95% KDE) Km2
Phase
IGHM2November-20215.9970.12Initial
December-20216.1059.93Initial
January-20221.417.76Later
February-20228.0343.04Later
March-20221.6910.16Later
April-20220.010.05Later
May-20221.007.00Later
June-20220.100.48Later
IGHM3Feb–March 20210.111.11Initial
IGHM7January-202432.19207.60Initial
February-202416.7297.47Initial
IGHM10January-20240.805.13Initial
February-20241.5310.12Initial
March-20240.593.70Later
April-20241.578.60Later
May-20240.512.75Later
June-20240.623.96Later
July-20240.301.75Later
August-20240.241.02Later
September-20240.080.40Later
October-20240.090.43Later
November-20240.050.23Later
December-20240.090.41Later
IGHM11January–February 20243.9835.44Initial
Table 2. Estimates of monthly and daily distance travelled by Indian Grey Hornbills during the Initial and Later phases of the reintroduction. The Initial Phase encompassed the first three months following release, while the Later Phase was defined as the period beyond this interval.
Bird IDMonthMonthly Distance (km)Daily Distance (km)Phase
IGHM2November 202164.832.16Initial
December 202160.181.94Initial
January 202239.021.26Later
February 202250.331.74Later
March 20229.920.32Later
April 202210.270.34Later
May 20229.040.29Later
June 20226.150.32Later
IGHM3March 2022151.784.34Initial
April 202271.404.46Initial
IGHM7January 2024158.415.11Initial
February 2024317.0510.93Initial
IGHM10January 202489.762.9Initial
February 202479.082.73Initial
March 202475.222.43Later
April 2024772.57Later
May 202456.341.82Later
June 2024105.153.51Later
July 202462.442.01Later
August 202451.221.65Later
September 202436.281.21Later
October 202440.271.30Later
November 202419.590.65Later
December 202432.471.05Later
IGHM11January 2024115.613.73Initial
February 202437.624.7Initial
Table 3. Results of statistical comparisons of activity durations by sex (male vs. female) across three nest sites of Indian Grey Hornbills. Mann–Whitney U tests were used for most activities, with a two-sample t-test applied to “peeping inside nest,” which met parametric assumptions. Reported means (mean amount of time spent in activity) for males and females are provided for descriptive purposes only and were not used as test parameters. Mean-Male and Mean-Female represent the average time in minutes spent by males and females in each activity. Adjusted p-values were obtained using the Bonferroni correction to control for multiple comparisons.
ActivityMean-Male
(± SD)
Mean-Female
(± SD)
Statisticp-ValueAdjusted p-ValueTest
Bill Cleaning0.46 ± 0.730.73 ± 1.86176.000.060.40Mann–Whitney
Feeding1.11 ± 3.251.24 ± 1.9441926.000.251.00Mann–Whitney
Nest Cleaning1.04 ± 0.721.45 ± 0.41316.000.080.48Mann–Whitney
Perching0.76 ± 2.00.58 ± 1.9033414.500.691.00Mann–Whitney
Preening1.80 ± 1.992.07 ± 2.3237.000.481.00Mann–Whitney
Peeping inside Nest0.14 ± 0.660.16 ± 0.34−0.530.601.00t-test
Table 4. Results of the post hoc Dunn’s test comparing the feeding duration of Indian Grey Hornbills across three nest sites (Bhojde, Mindhori, and Verwangda). The test was applied following a significant Kruskal–Wallis result for overall differences among sites. Negative Z values indicate that the first site in the comparison had shorter feeding durations relative to the second, while positive Z values indicate longer durations. Adjusted p-values were obtained using the Bonferroni correction to control for multiple comparisons.
ComparisonZ Statisticp-ValueAdjusted p-Value
Bhojde-Mindhori−8.50500.010.0001
Bhojde-Verwangda−2.83000.0470.014
Mindhori-Verwangda4.79900.010.0001
Table 5. Results of pairwise Chi-Square tests comparing food counts (fruit vs. invertebrates) across three Indian Grey Hornbill nest sites (Bhojde, Mindhori, and Verwangda). The overall Chi-Square Test of Independence indicated highly significant variation in diet composition among sites (χ2 = 162.95, df = 2, p = 0.001). Post hoc pairwise comparisons with Bonferroni-adjusted p-values revealed that Mindhori differed significantly from both Bhojde and Verwangda, driven by a higher proportion of invertebrates and lower fruit counts at Mindhori. No significant difference was detected between Bhojde and Verwangda.
ComparisonStatisticAdjusted p-Value
Bhojde vs. Mindhori93.810.001
Bhojde vs. Verwangda1.240.79
Mindhori vs. Verwangda90.400.001
Disclaimer/Publisher’s Note: The statements, opinions and data contained in all publications are solely those of the individual author(s) and contributor(s) and not of MDPI and/or the editor(s). MDPI and/or the editor(s) disclaim responsibility for any injury to people or property resulting from any ideas, methods, instructions or products referred to in the content.