Article

Long-Term Changes in Bird Communities in the Urban Parks of Mar del Plata City, Argentina

1
Departamento de Ecología, Genética y Evolución, Facultad de Ciencias Exactas y Naturales, Universidad de Buenos Aires—IEGEBA (CONICET-UBA), Intendente Güiraldes 2160, Ciudad Universitaria, Pab 2, Piso 4, Buenos Aires C1428EGA, Argentina
2
Centro de Salud Mental Comunitaria “Mauricio Goldenberg”, Universidad Nacional de Lanús, Consejo Nacional de Investigaciones Científicas y Técnicas (CONICET), Remedios de Escalada B1826GLC, Argentina
*
Author to whom correspondence should be addressed.
Birds 2024, 5(4), 814-831; https://doi.org/10.3390/birds5040054
Submission received: 2 November 2024 / Revised: 3 December 2024 / Accepted: 5 December 2024 / Published: 10 December 2024

Simple Summary

Urbanization is related to the loss of biodiversity and alteration of ecosystem processes. However, long-term changes in the southern hemisphere’s bird communities have been scarcely analyzed in urban areas. The general objective of this work was to analyze changes in bird species richness, diversity, and composition in parks located in the urban and suburban landscapes of Mar del Plata City (Argentina) between 2003 and 2018. The results showed increased species richness and diversity in all parks by 2018. The species composition in parks significantly differed between urban and suburban landscapes and years. In conclusion, we observed differences in the bird community between years and landscape types. However, the long-term changes in the bird community were not associated with increased urbanization within parks or the surrounding landscape. Instead, the changes in the local bird community were more related to regional bird species population changes associated with climate warming and increased crop cover.

Abstract

Urbanization is related to the loss of biodiversity and alteration of ecosystem processes. However, long-term changes in the southern hemisphere’s bird communities have been scarcely analyzed in urban areas. The general objective of this work was to analyze changes in bird species richness, diversity, and composition in parks located in the urban and suburban landscapes of Mar del Plata City (Argentina) between 2003 and 2018. Additionally, we aimed to analyze whether these changes were associated with an increase in urbanization or with alterations in the parks’ habitat structure. Tree cover showed significantly lower coverage during 2018. The results showed increased species richness and diversity in all parks by 2018. Rarefaction curves showed that the park bird richness did not differ between the landscapes surrounding parks, but the Shannon and Simpson diversities were higher in parks in suburban landscapes than in parks in urban landscapes. The Shannon and Simpson diversities showed higher values in suburban parks during 2018. However, the diversity values were similar between years in parks in urban landscapes. The species composition was significantly different between landscapes and years. Species turnover was the most predominant pattern of species dissimilarity between landscapes, and species nestedness explained the most dissimilarity between years. Nestedness between years was related to the population increase in many bird species in 2018. In conclusion, we observed differences in the park bird communities between years and landscape types. However, the long-term community changes were not associated with an urbanization increase. Instead, the changes in the local bird community were more related to regional bird species population changes associated with climate warming and increased crop cover.

1. Introduction

Urbanization is a process related to the settlement of humans in natural or rural habitats [1,2,3,4], which implies a loss of biodiversity and the alteration of ecosystem processes [5]. Bird communities may undergo changes in their structure and composition, related to the alterations caused by urbanization in habitat characteristics, the availability of food and water, ecosystem processes, and the presence of nesting sites, predators, competitors, and diseases [6,7]. Moreover, numerous studies have shown that urban areas often experience a loss of native species, replaced by a few non-native species adapted to urban conditions [8]. This species replacement occurs globally, resulting in biotic homogenization in urban environments [9,10,11]. Thus, some species tend to thrive, while others are negatively affected, resulting in the dominance of a select few species, particularly those adapted to a human presence [6,12,13,14]. This dominance is reflected in the abundance of house sparrows (Passer domesticus), european starlings (Sturnus vulgaris), and rock pigeons (Columba livia) in many cities worldwide [6,15]. These species are typically granivorous, ground-feeding, and resident species [16,17,18]. In contrast, in environments with low to intermediate levels of urbanization, species with insectivorous and aerial foraging habits are favored [16,19,20]. Moreover, species that avoid urban areas tend to nest on the ground, thus being affected by pedestrian disturbances and predators in cities [21,22]. Additionally, many native species in urban environments face reduced natural habitats, increased competition, diseases, parasites, or intolerance to human activities [6].
Urban parks are patches dominated by vegetation whose habitat structure favors the presence of many bird species in cities [23,24]. For this reason, it is crucial to analyze possible long-term changes in these communities to determine whether their attributes are affected by urbanization. Several studies have shown long-term changes in bird communities in urban parks [25,26,27,28,29,30]. Recher and Serventy [26] analyzed long-term changes in a 400 ha urban park and found a loss of bird species related to changes in the habitat structure of the park and its surroundings. Due to a decrease in native vegetation and the planting of exotic species, the establishment of new bird species was favored, and the abundance of originally inhabiting species decreased. Morneau et al. [25] studied the bird richness and abundance changes in Montreal urban parks over 15 years. Their study revealed an increase in bird occurrence associated with changes in vegetation, the installation of bird feeders, and the colonization of new bird species, some exotic, during the study period. In Latin America, these types of studies are scarce [31].
The invasion of exotic bird species can influence the temporal dynamics of bird communities in urban environments [25]. A higher abundance of exotic species is often observed in urban settlements than in natural habitats [32]. These environments are more likely to host non-native species due to the significant flow between cities, which increases the probability of spreading plants, animals, and diseases [33]. Therefore, anthropogenic activities tend to influence the dispersal ranges of several species, favoring their expansion [34].
Several exotic species, such as the Rose-ringed Parakeet (Psittacula krameri) and the European Starling (Sturnus vulgaris), have invaded urban areas, probably affecting native bird communities negatively through biotic interactions [35,36]. The European Starling is considered one of the most successful invasive species and has already colonized various parts of the world [37]. In Argentina, it was first recorded in 1987 within the Palermo district of Buenos Aires [38], and it is found in more than 20% of the city’s green areas [39]. These invasions by opportunistic exotic species, which have a commensal relationship with humans, can lead to changes in the bird community over time due to competition for nesting sites and food [37]. Starlings nest in tree cavities produced by natural degradation [40]. Several authors have recorded repeated attempts by starlings to occupy the nests of native cavity-nesting species, such as the Green-barred Woodpecker (Colaptes melanochloros) or other woodpecker species [41,42,43,44,45].
On the other hand, the temporal dynamics of bird species in urban parks may be related to their regional population changes [29]. A recent long-term analysis along the urban gradient of Mar del Plata City (Argentina) showed several population increases in bird species, which were probably related to regional population increases. These species were the Eared Dove (Zenaida auriculata), the Spot-winged Pigeon (Patagioenas maculosa), and the Picazuro Pigeon (Patagioenas picazuro), granivorous species that probably benefitted from climate warming and increased regional crop cover [46]. On the other hand, exotic species such as Passer domesticus showed population decreases [46]. However, whether these bird population changes also occur in urban parks is unknown.
The objective of this study was to explore the changes that occurred between 2003 and 2018 in the abundance, richness, and species composition of birds in parks located in urban and suburban landscapes within Mar del Plata City, Argentina. In the study area, Leveau and Leveau [47] found that richness was negatively associated with the coverage of buildings around the parks. Therefore, suburban parks are expected to have higher bird richness and diversity due to their higher surrounding vegetation coverage compared to urban parks. A potential decrease in vegetation coverage in the parks or their surroundings over the years will affect the community structure by decreasing the bird richness and replacing species that require more vegetation with those adapted to urban settlements and a human presence.
On the other hand, the species composition is expected to vary between urban and suburban parks because some species rely more on a human presence for feeding or use buildings as shelters or nesting sites [48]. In contrast, other species prefer to avoid humans’ presence and choose areas with more vegetation or greater insect availability [47]. Furthermore, the species composition is expected to differ between years due to the introduction of invasive species such as Sturnus vulgaris or the expansion of common species like Zenaida auriculata, Patagioenas maculosa, or Patagioenas picazuro [25,37].

2. Study Area and Methods

2.1. Study Area

This study was carried out in Mar del Plata City (38° 00′ S, 57° 33′ W; 618,989 inhabitants in 2018), located in Central–Eastern Argentina (Figure 1). Mar del Plata is characterized by its coastline, dominated by beaches and cliffs. The city is situated in the Pampas ecoregion and surrounded by farmlands, pastures used for domestic livestock grazing, some lagoons, and small patches of preserved grasslands [49]. The average annual temperature is 14.1 °C, and the average annual precipitation is 923.6 mm (National Meteorological Service).

2.2. Sampling Methods

Bird abundance and species composition data were collected in twelve urban parks between 2003 and 2018 (Figure 1; see Leveau and Leveau [47]). Twelve parks, ranging in size from 1 to 4 hectares, were selected. Each park was considered an experimental unit. Two visits were conducted for each park in each year, one during two to three days in July (winter) and the other during two to three days in October–November (spring), within the first four hours after sunrise and on days without rain or strong winds. We recorded the number of bird species and individuals present using the fixed-radius point count method [50]. An observer detected all birds seen or heard for 5 min within a 25 m radius, except those flying over the area without feeding activity [51]. In 1-hectare parks, we analyzed a single point from the center of the park, and, in parks of up to 4 hectares, two points were taken, separated by at least 100 m [52].

2.3. Park Classification

The level of urbanization was measured using the Image J software version 1.54k [53] to classify the parks according to their surrounding landscape types. We extracted aerial photographs from the Google Earth Pro software version 7.3.6.9796 to examine a radius of 500 m surrounding each park. The percentage of the area occupied by tall buildings, low buildings, houses with front and back gardens, and areas with impermeable coverage or pavement was recorded (Figure 2). In parks adjacent to the coast, the area beyond the shoreline was excluded from the 500 m radius, as it was not initially considered a primary habitat for bird populations. Within this framework, parks where more than 50% of the area was covered by tall buildings, low buildings, or houses without gardens or impermeable coverage were assigned to the “urban landscape” category [54]. Parks surrounded by residential areas comprising more than 50% of the landscape, characterized by tree abundance and houses with front and back gardens, were categorized as “suburban landscapes”. This analysis was carried out for parks in 2003 and 2018, aiming to analyze interannual changes in the landscape types surrounding the parks. Finally, we identified six parks of each landscape type for each year. Although parks of different sizes were selected (1–4 ha), their areas did not significantly differ between both landscape categories (urban–suburban) (Mann–Whitney test, U = 19; p = 0.937), indicating similar sampling efforts for both categories.

2.4. Habitat Structure in Parks

During 2003, the percent coverage of trees, bushes, grass, and cement or bare ground was visually estimated in the field up to 25 m from the bird observation point. In 2018, vegetation coverage was estimated from the same points using photographs. For each photograph, we estimated the visual percent coverage of vegetation, cement, and bare ground up to 25 m away, and then the four values were averaged at each point. In parks with two sampling points, we calculated the average coverage between both points.

2.5. Species Richness and Diversity

Based on the sampling data, a species accumulation database was compiled, documenting the accumulated species richness for each year, considering both parks with more than one sampling point and the two visits conducted at each park. We estimated the alpha diversity value for each park and calculated the Hill number, representing the effective number of equally abundant species [55]. The parameter q of the Hill number defines its sensitivity to the species abundance. Species richness has q = 0, whereas the Shannon diversity and inverse Simpson diversity (hereafter Simpson diversity) have q = 1 and 2, respectively. Therefore, species richness represents all species in a site, the Shannon diversity is the number of common species, and the Simpson diversity is the number of dominant species [56].
We calculated the Hill numbers for each park with the hill_taxa function of the hillR package [57]. In addition, the accumulated Hill numbers for each landscape type (urban/suburban) during the two periods were analyzed through rarefaction curves using 999 bootstraps in the online software iNEXT version March 30 2024 [58]. We compared the rarefaction curves at the minimum sample coverage, which was the proportion of the individuals that belonged to the species detected in the sampling unit [56]. Following the recommendations of MacGregor-Fors and Payton [59], we established significant differences between curves when the 84% confidence intervals did not overlap.

2.6. Species Composition

Differences in the species composition between years and park landscape types were analyzed using a permutational multivariate analysis of variance with the adonis function from the vegan package [60], employing the Bray–Curtis dissimilarity index (BC). The BC index [61] considers the species abundance across different communities. The dissimilarity index varies between 0 and 1, with the minimum value reached when both sites have the same species composition. The resulting R2 value from the adonis function corresponds to the data variance explained by the tested variables, on a scale from 0 to 1. With the dissimilarity matrix, we performed nonmetric multidimensional scaling (NMDS) in two dimensions, a technique that involved ordering the parks based on the dissimilarity in their species compositions. We carried out NMDS using the metaMDS function from the vegan package [60]. The relationship between the observed dissimilarities and the distances of the NMDS analysis was evaluated through a Shepard plot and the stress value.
The contribution of each bird species to the BC dissimilarity observed between years and landscapes was analyzed using the simper function of the vegan package [57]. This function generated a list with the species ordered from the highest to the lowest contribution. One of the resulting columns showed the accumulated percentage contribution, where a cutoff line is usually set at 80% accumulation [62], meaning that species contributing to 80% of the dissimilarity were considered. Furthermore, the analysis included a ratio between the average dissimilarity of each species and the standard deviation of the dissimilarity across different years or landscapes. A ratio greater than 1 indicated that the species significantly influenced the dissimilarity between groups and that the variation among parks within the same group was low [62].
Additionally, we analyzed the contribution of the nested species composition or species turnover to the observed dissimilarity in the studied parks. A nested species composition occurs when a site’s composition is a subset of another with greater richness, reflecting non-random species loss. In contrast, species turnover suggests that some species are replaced by others among sites [63]. There may be a combination of both phenomena among communities. We conducted this analysis using the beta.pair.abund function of the betapart package [64], utilizing the BC dissimilarity matrix and calculating three distance matrices, which corresponded to the total dissimilarity between pairs of sites and the diversity components of the abundance gradient—analogous to nested with incidence patterns—and balanced variation of abundances—analogous to turnover with incidence patterns [65]. We used the adonis function to analyze whether the turnover and nested dissimilarities differed among the parks in urban or suburban landscapes or between years.

2.7. Data Analysis

2.7.1. Habitat Structure in Parks

Habitat structure differences between different years and landscapes types (urban/suburban parks) were analyzed. A linear mixed-effects model was used for tree and grass coverage, with parks as a random factor due to a repeated-measures design where each park was sampled twice, once in 2003 and again in 2018. This analysis was conducted using the lme function of the nlme package [66] in the R software version 3.6.1 [67]. The model’s assumptions, including homoscedasticity and normality, were checked. The homoscedasticity assumption was tested using Levene’s test from the carr package [68], which tests the null hypothesis that the population variances of different groups are equal. Additionally, Pearson residuals versus predicted plots were analyzed, where the residuals should be homogeneously distributed across the range of predicted values, and no pattern should be detected. The normality assumption was checked using the Shapiro–Wilk test, with the null hypothesis that the population was normally distributed, and a QQ plot. A heteroscedasticity correction was applied to the tree coverage model using the varIdent error structure, also from the nlme package.
For the grass coverage analysis, paired t-tests were used with data subgroups to compare the grass coverage between different years within urban and suburban parks and assess differences between the landscapes for each year separately. The t-test also verified the adherence to the assumptions of independence, normality, and homoscedasticity of residuals.
Since the residuals did not follow a normal distribution for the bush and concrete coverage analysis, the differences between parks of different landscapes in each year were analyzed using a Mann–Whitney (MW) test. Additionally, we used a Wilcoxon signed-rank test (W) to examine the differences between years for the same parks, as this is a non-parametric test for dependent data.

2.7.2. Bird Richness and Diversity per Park

Firstly, the effect of the landscape type (urban and suburban) and year on the bird richness per park was evaluated using a generalized linear mixed model (GLMM). Richness is a discrete variable; hence, a Poisson distribution was employed. We calculated a dispersion statistic based on Pearson residuals and the model’s degrees of freedom to assess the presence of under- or over-dispersion. Since under-dispersion was detected in the data, a Conway–Maxwell–Poisson error distribution was modeled using the glmmTMB package [69]. The detection of under-dispersion in the data implies that the variance of the response variable is lower than expected for a Poisson distribution. This might be due to the model fitting extremely well to outliers or to too many response variables or interactions [70]. Due to the lack of independence between observations from different years at the same site, each park was considered a random factor.
We assessed the assumption of homoscedasticity of residuals through a Pearson residuals plot against the predicted values. Finally, we selected variables using the likelihood ratio test (LRT) and evaluated the significance of the model compared to a null model (a model lacking explanatory variables). We generated plots using the sjPlot package version 2.8.17 [71] and ggplot2 version 3.5.1 [72]. All analyses were conducted using the R software [67].
The bird diversity data per park corresponding to the Shannon and Simpson Hill numbers were fitted to a GLMM with a Gaussian error structure using the nlme package. We treated the parks as a random variable due to the lack of independence between temporal data from the same park. We checked the model’s adherence to the assumptions of homoscedasticity using a Pearson residuals plot against the predicted values and the Levene test. We assessed normality assumptions through the Shapiro–Wilk test and a QQ plot. Heteroscedasticity in the residuals was addressed using the varIdent function. Model variables were selected using the likelihood ratio test, and the significance of the model compared to a null model was quantified. Once we selected the best model, its parameters were estimated using the restricted maximum likelihood (REML) method. While the maximum likelihood (ML) method is suggested for the comparison of models, it underestimates the variance and standard error estimates. Therefore, after model selection, parameter estimation was conducted using the REML method, which considers the loss of degrees of freedom when estimating fixed effects and produces unbiased variance estimators [70]. Finally, plots were generated using the sjPlot and ggplot2 packages.

3. Results

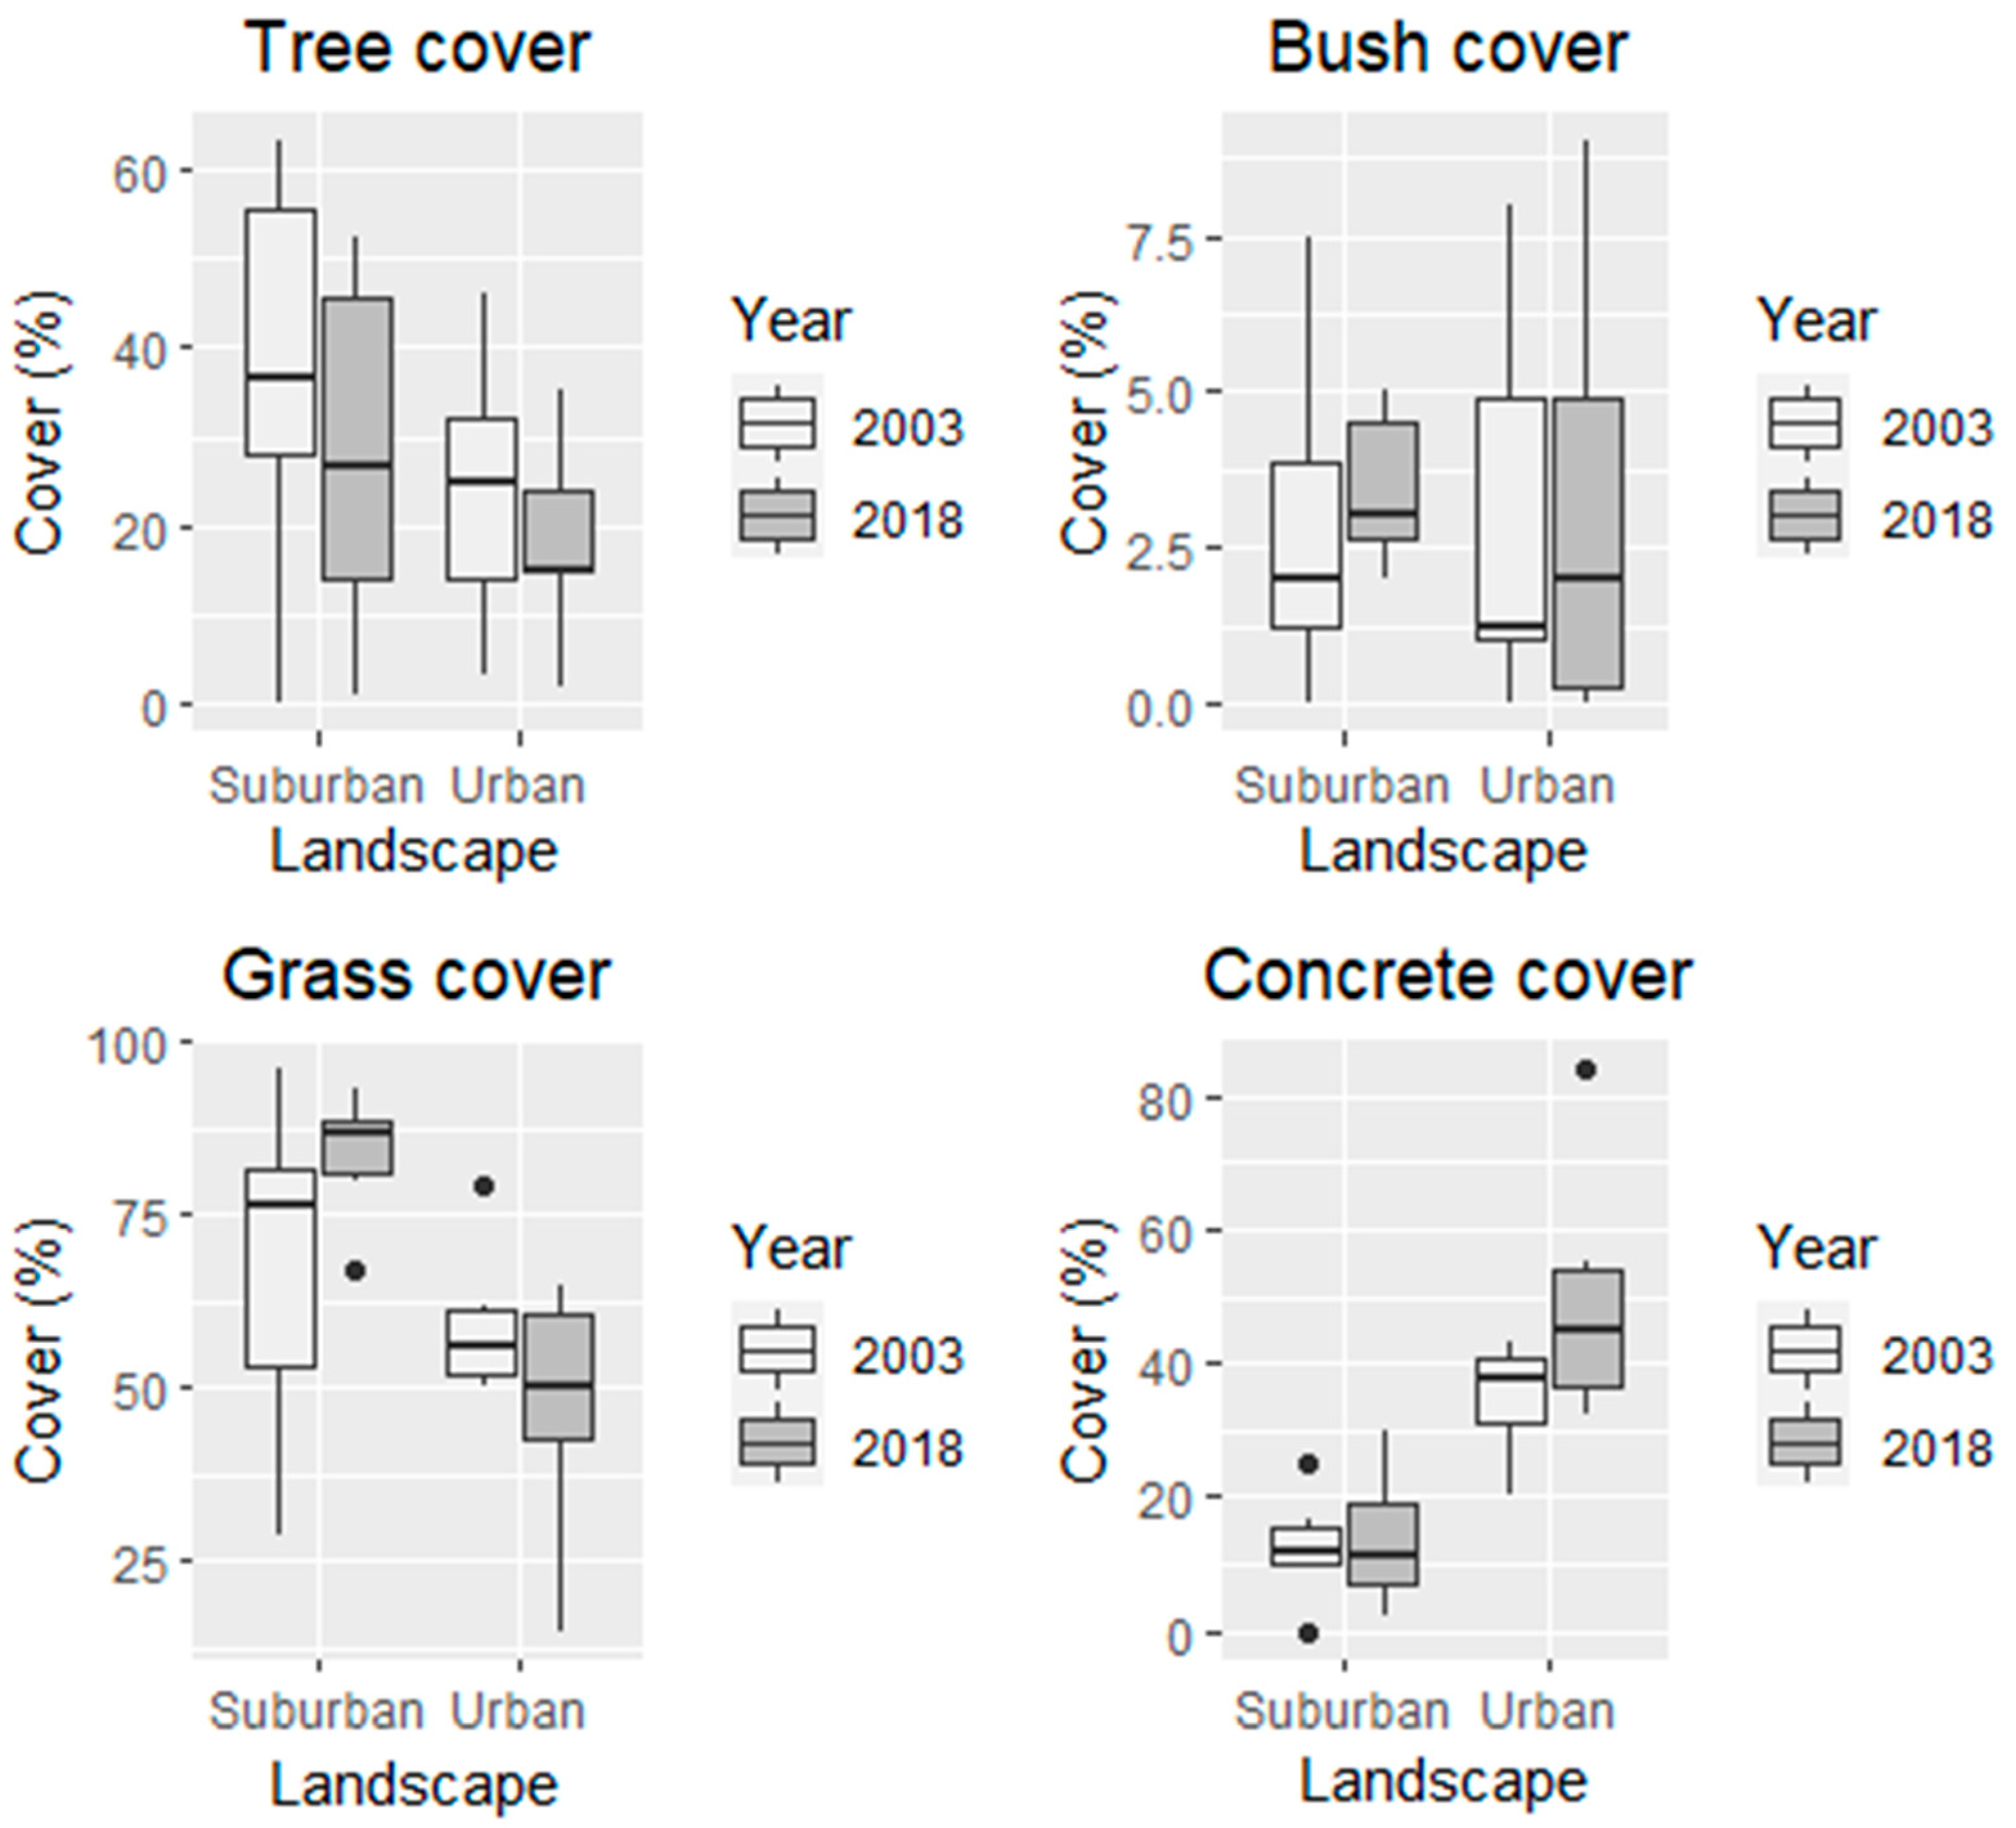
3.1. Park Habitat Structure

The model that best explained the percentage of tree cover included the variables landscape and year (LRT = 6.583; p = 0.037). In 2018, the tree cover was significantly lower than in 2003 (t = −2.387; p = 0.036; Figure 3). However, no differences in tree cover were observed between landscapes (t = −1.288; p = 0.227; Figure 3).
Regarding the percentage cover of bushes, no significant differences were found between years in either urban (W = 8.000; p = 1.000) or suburban parks (W = 4.500; p = 0.498; Figure 3). Similarly, there were no differences between landscapes in bush cover in 2003 (MW = 19.500; p = 0.871) or 2018 (MW = 21.000; p = 0.686; Figure 3).
The grass cover model indicated a significant interaction between the variables ‘landscape’ and ‘year’ (t = −2.458; p = 0.034). The grass cover did not vary between urban and suburban parks in 2003 (t = 0.784; df = 10; p = 0.451) but significantly changed between landscapes in 2018, being higher in suburban parks (t = 4.285; df = 10; p = 0.002; Figure 3). However, no significant differences were observed between years in urban (t = 1.706, df = 5; p = 0.149) or suburban (W = 3.000; p = 0.142) parks.
The concrete cover was significantly higher in urban than suburban parks in 2003 (MW = 1.000; p = 0.008) and 2018 (MW = 0.000; p = 0.005; Figure 3). However, there were no changes in concrete cover between years in either urban (W = 1.000; p = 0.059) or suburban (W = 8.000; p = 0.675) parks (Figure 3).

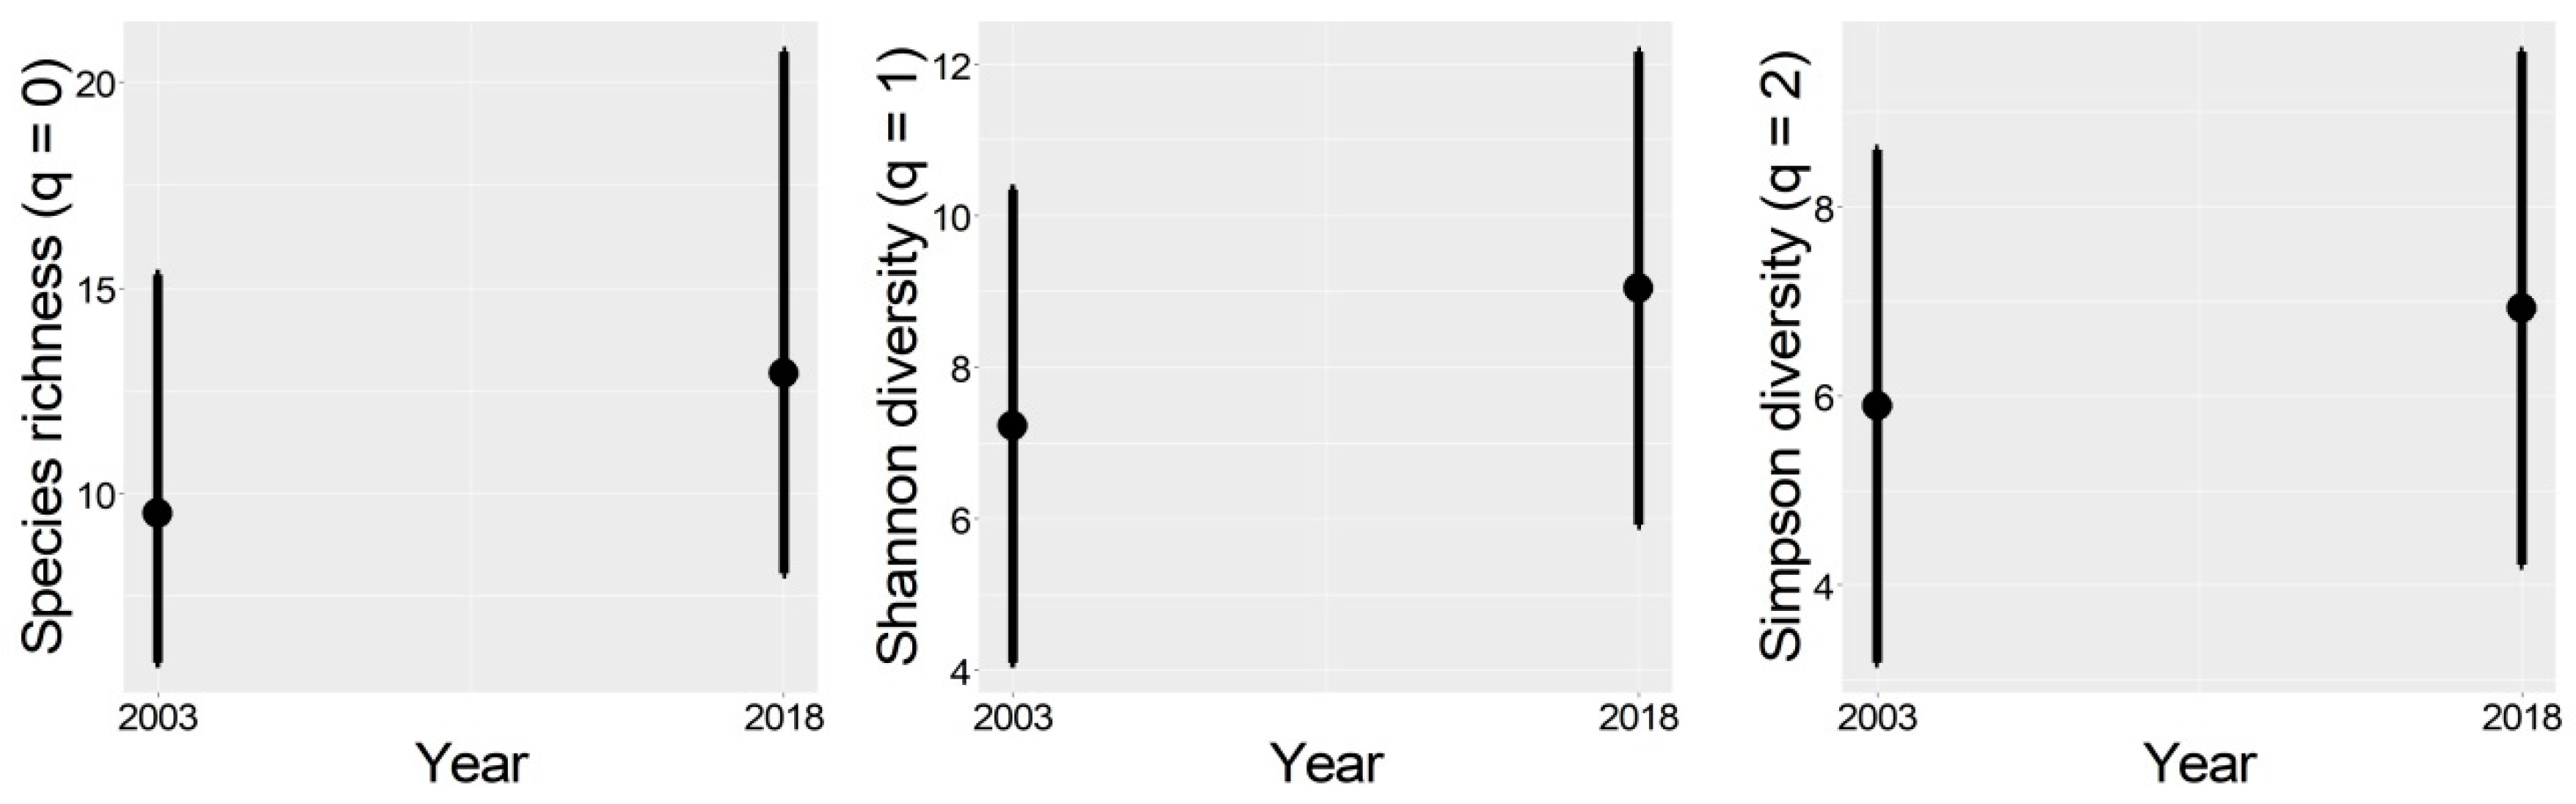
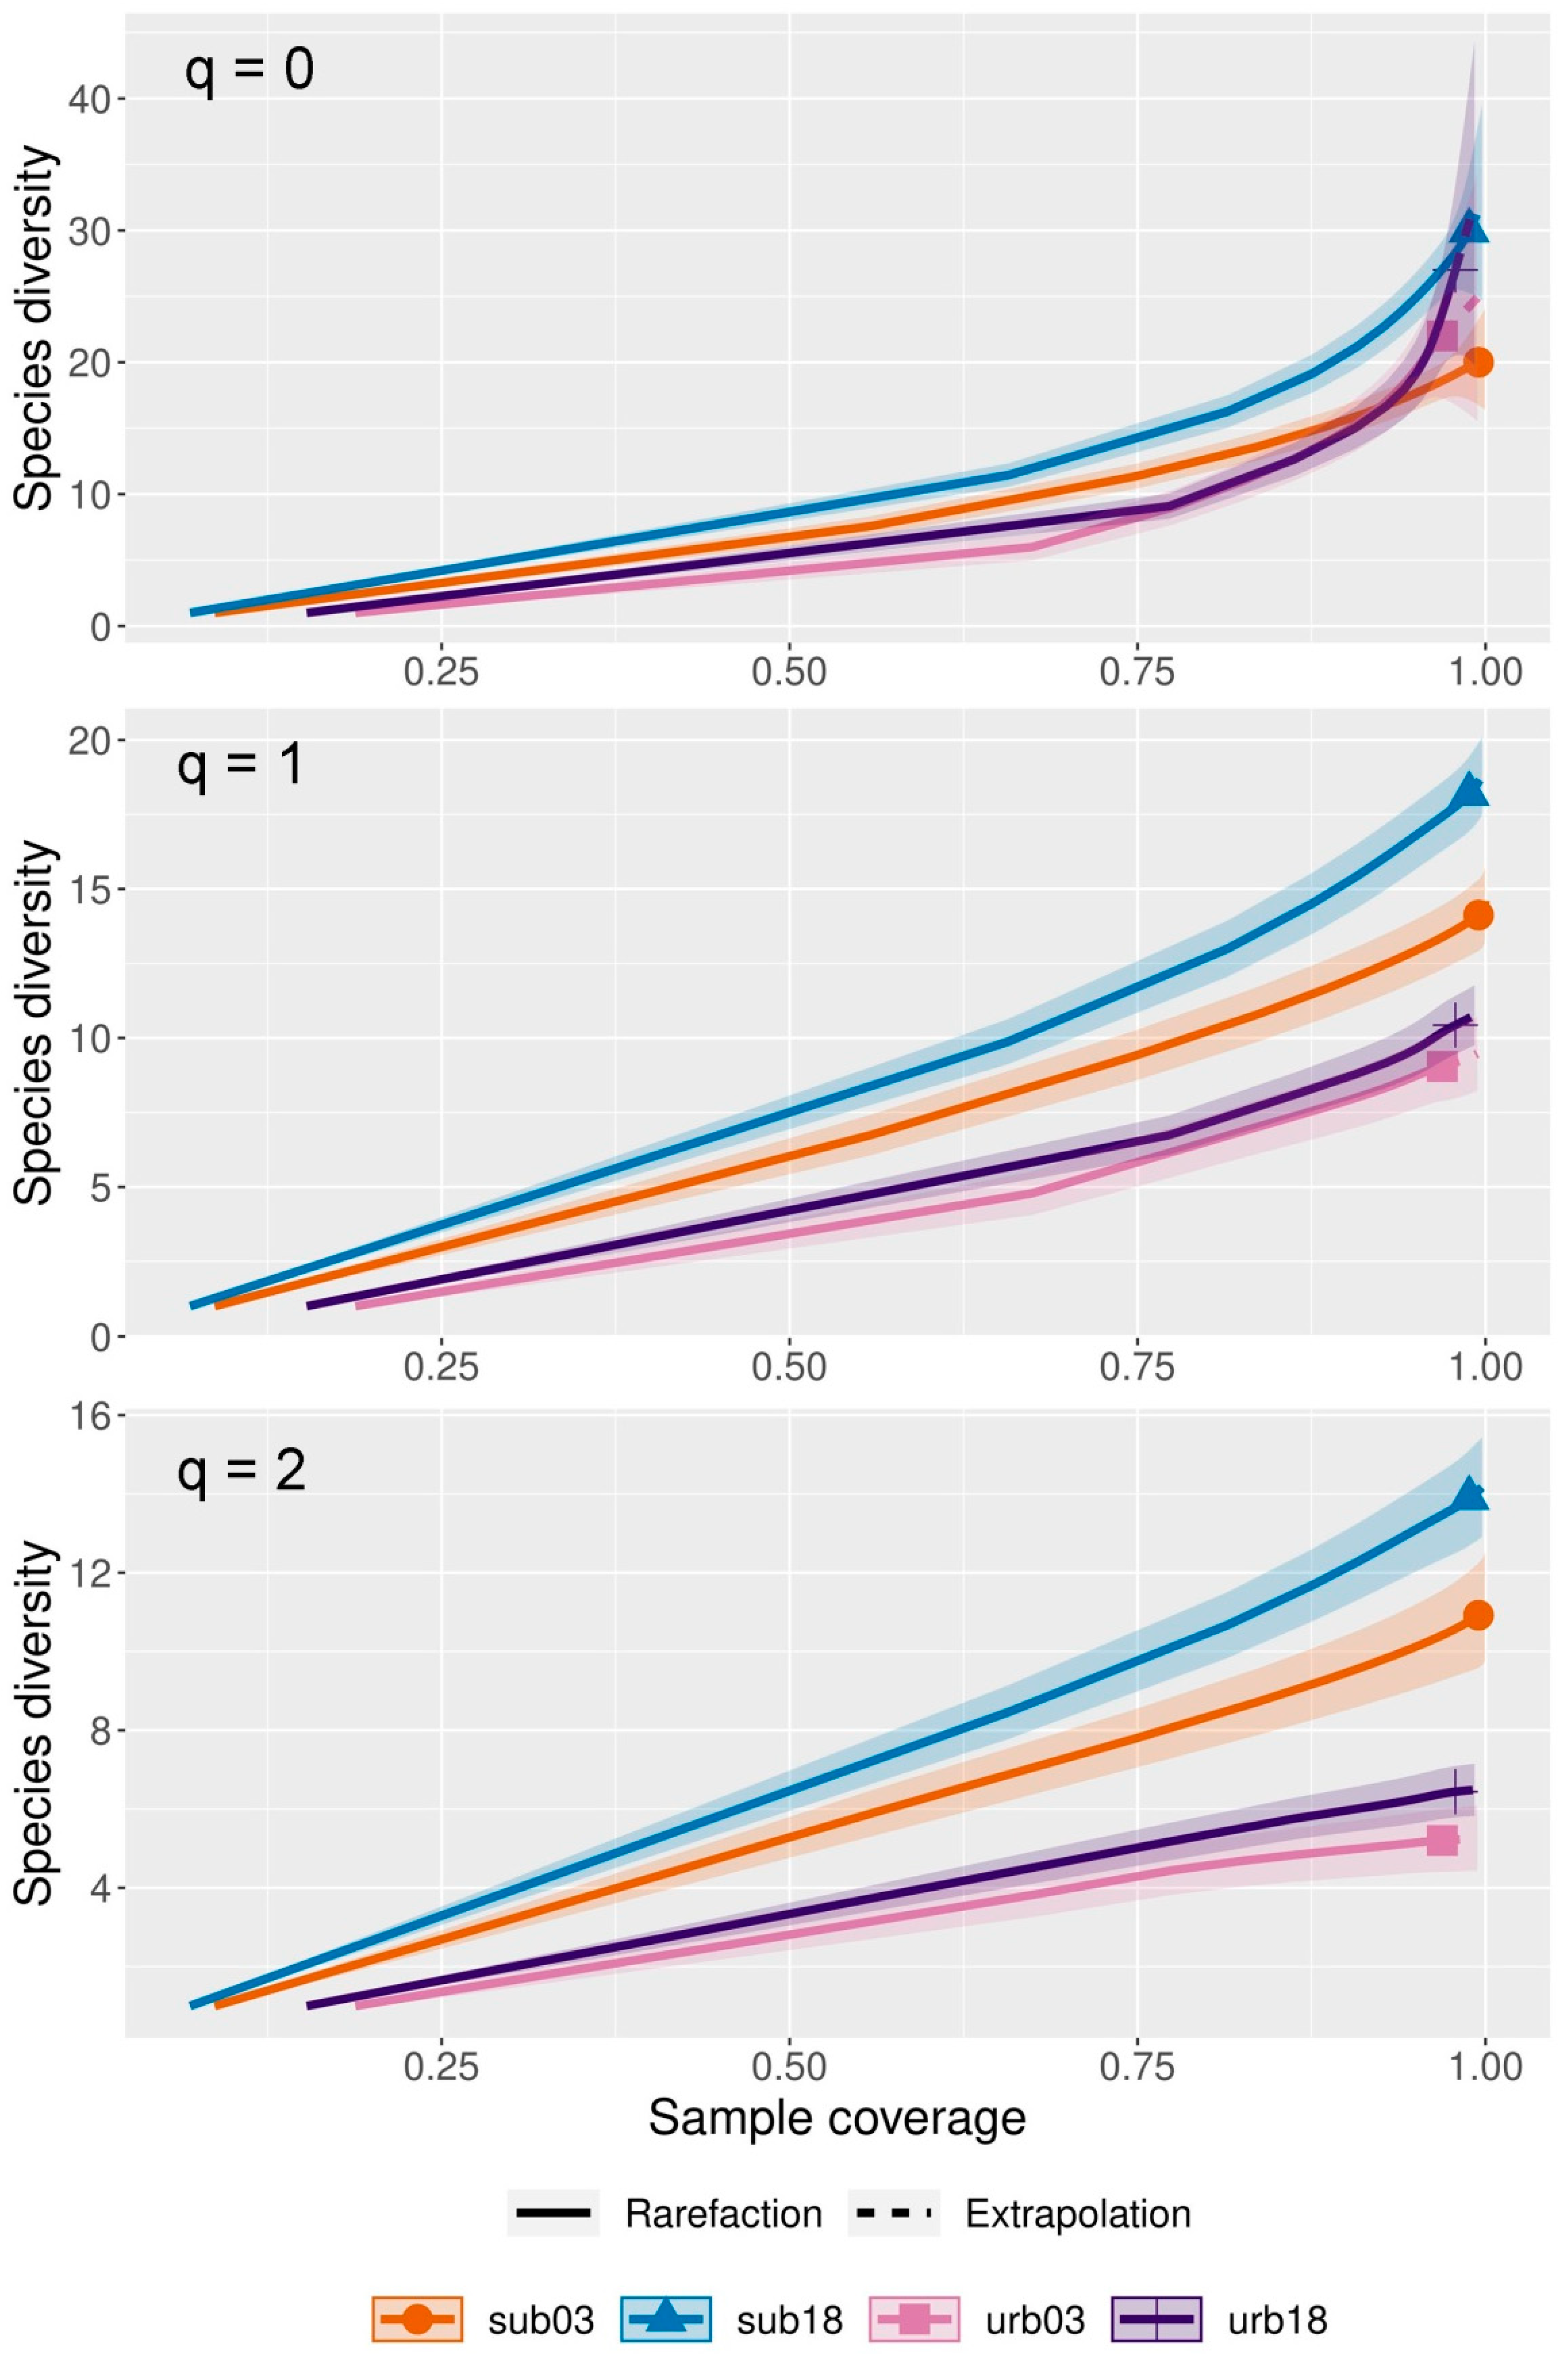
3.2. Bird Richness and Diversity

A total of 35 bird species were recorded, with 25 species detected in 2003 (22 in urban parks and 20 in suburban parks) and 33 species in 2018 (27 in urban parks and 30 in suburban parks) (Table 1).
The best models explaining the species richness, Shannon diversity, and Simpson diversity of birds per park included only the year (Table 2) and showed significant increases in 2018 (Figure 4).
The rarefaction curves of the species richness values did not differ between the landscape types in 2003 or 2018 (Figure 5). On the other hand, the species richness in suburban areas was higher in 2018 than in 2003, whereas it remained stable between years in urban parks. During both years, the Shannon and Simpson diversities were higher in suburban landscapes than in urban landscapes (Figure 5). Moreover, these diversities increased significantly in 2018 compared to 2003 in suburban landscapes and were stable between years in urban landscapes.

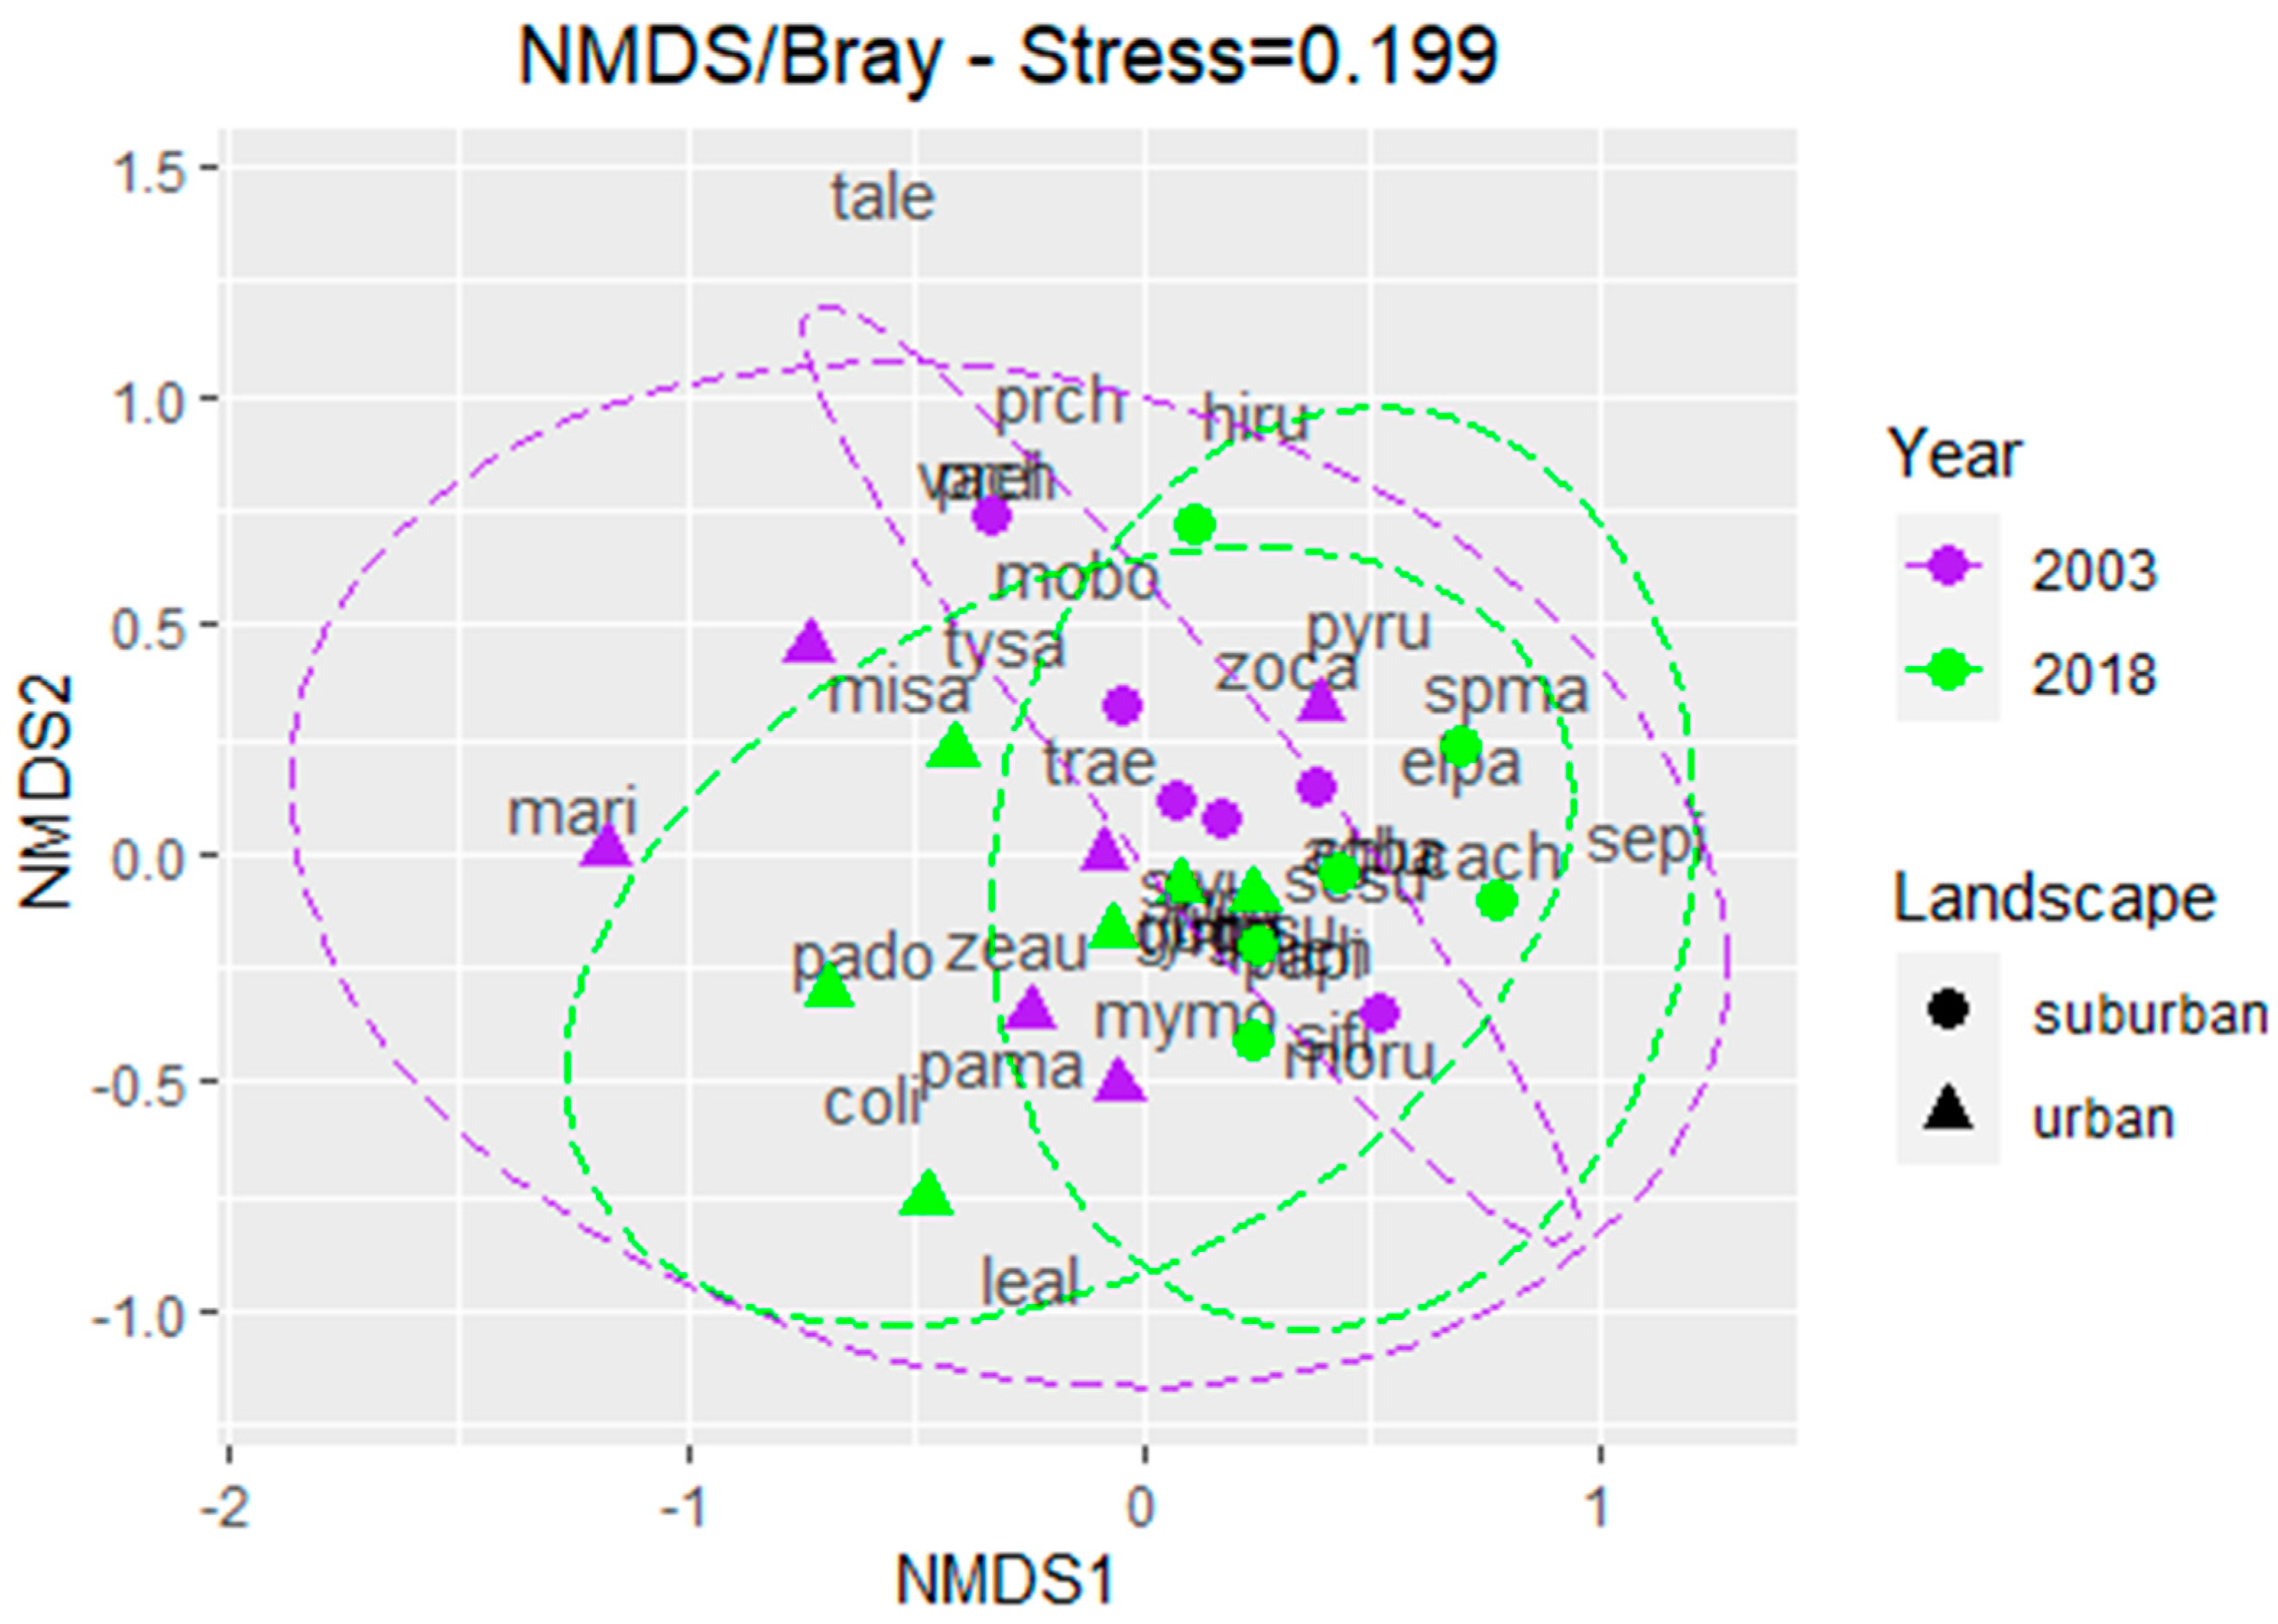
3.3. Species Composition

The adonis analysis showed significant differences in the species composition between landscapes (R2 = 0.115; p = 0.004) and years (R2 = 0.137; p = 0.001). The NMDS analysis (Figure 6) and simper showed associations between bird species, landscapes, and years (2D stress = 0.199).
The simper analysis revealed that 13 species contributed to 81% of the dissimilarity between landscapes (Table 3). The species that most influenced this dissimilarity were Zenaida auriculata, Patagioenas picazuro, Furnarius rufus, Pitangus sulphuratus, Turdus rufiventris, and Zonotrichia capensis. Zenaida auriculata was more abundant in urban parks, whereas Patagioenas picazuro, Furnarius rufus, Pitangus sulphuratus, Turdus rufiventris, and Zonotrichia capensis were more abundant in suburban parks.
Between 2003 and 2018, the simper analysis (Table 4) showed that 13 species contributed to 82% of this dissimilarity. The species that most influenced the dissimilarity between years were Zenaida auriculata, Sturnus vulgaris, Patagioenas picazuro, Furnarius rufus, Turdus rufiventris, Molothrus bonariensis, and Pitangus sulphuratus. In 2018, Zenaida auriculata, Patagioenas picazuro, Sturnus vulgaris, Furnarius rufus, and Turdus rufiventris increased in abundance. Conversely, Molothrus bonariensis and Pitangus sulphuratus decreased in abundance during the same period.
The total BC species dissimilarity of the parks in 2003 was 0.845. Within this dissimilarity, 0.772 was attributed to balanced abundance variation (species turnover) and 0.073 to the abundance gradient (nestedness). In 2018, the dissimilarity was 0.838, with 0.761 of this dissimilarity attributed to balanced abundance variation and 0.078 to the abundance gradient. Additionally, the dissimilarity matrix analysis revealed significant differences in dissimilarity between park landscape types due to balanced abundance variation (R2 = 0.182; p = 0.002) and between years (R2 = 0.110; p = 0.012), while the dissimilarity between parks due to the abundance gradient showed significant differences only between years (R2 = 0.249; p = 0.040).

4. Discussion

Analyzing long-term changes in bird communities is fundamental to understanding and predicting the impact of global change factors, such as climate change and land use change, on the dynamics of bird populations. This study revealed an increase in bird richness and diversity in the parks of Mar del Plata in 2018 compared to 2003, suggesting potential changes in bird communities over time. Additionally, we observed distinct species compositions between landscapes and years. However, unlike other studies examining temporal changes [26], the absence of increased urbanization surrounding the parks suggests that these changes may not be linked to such processes.

4.1. Bird Richness and Diversity Between Landscapes

As expected, suburban parks exhibited greater bird diversity than urban parks. The rarefaction curve analysis demonstrated higher taxonomic diversity in suburban parks in both years. Previous studies have reported similar results when examining urban–suburban gradients, with decreasing diversity or richness with higher urbanization levels [16,19,73]. Tall buildings, commercial centers, limited tree-lined sidewalks or grassy areas, and few houses with front and back gardens dominated the urban parks’ landscape matrix. This landscape matrix likely provides fewer bird resources than one with greater vegetation coverage, such as suburban parks [74]. Additionally, Leveau and Leveau [47] found a positive correlation between the building coverage in Mar del Plata and vehicular and pedestrian traffic, negatively affecting birds’ presence [75,76,77]. Suburban parks have more grass coverage and less cement coverage than urban parks, making them more advantageous habitats for ground-feeding species such as Furnarius rufus, Passer domesticus, and Patagioenas picazuro, while also providing suitable foraging opportunities for aerial insectivores like Pitangus sulphuratus [22]. The landscape matrix surrounding suburban parks consists of wooded areas, houses with front and back gardens, sidewalks with grass, bushes or trees, golf courses, cemeteries, or other parks that provide vegetation structures utilized by some birds as resources, such as tree-nesting birds [22].
Conversely, the lower evenness in the abundance distribution in urban parks may be due to a few highly abundant species, such as Zenaida auriculata, Passer domesticus, and Patagioenas maculosa. These species are typically more abundant and dominate urban environments by taking advantage of human-provided food and the presence of buildings for nesting [19,22,48,78]. In other studies [16,19,79,80], Passer domesticus, Sturnus vulgaris, and Columba livia were the dominant species usually associated with urban environments. However, in our case, Columba livia and Sturnus vulgaris were not dominant species in these types of parks. On the contrary, Sturnus vulgaris exhibited greater abundance in suburban parks, and Columba livia showed low abundance.

4.2. Bird Richness and Diversity Between Years

Contrary to our expectations of a decrease in species richness due to potential increases in urbanization surrounding the parks, an increase in the average diversity and richness per park was observed in 2018. Since no increment in urbanization was observed around the parks, as hypothesized, this rise could be associated with processes such as species invasion or expansion and the increased abundance of common species in the region (see also Leveau [46]). During 2018, increases in the abundance of several species were observed, such as Zenaida auriculata, Patagioenas picazuro, Patagioenas maculosa, Sturnus vulgaris, Turdus rufiventris, Hirundo rustica, and Setophaga pitiayumi. Sturnus vulgaris is an introduced species that was successfully established in Mar del Plata City in 2002 [81]. Initially, it was predominantly found in urban environments, but its distribution was expanded to suburban and rural areas [37,82].
The rarefaction curve analyses showed differences between years within suburban parks based on the Shannon and Simpson indices. In 2018, suburban parks exhibited significantly higher numbers of common and dominant species compared to 2003. In contrast, no differences were seen in urban parks between years. On one hand, most species that increased in abundance during 2018 were more common in suburban parks. Therefore, the habitat structure of the suburban parks probably benefited the settlement of these species that expanded their distribution or increased their abundance in the region [46].
On the other hand, the increase in the diversity of suburban parks may suggest the role of local factors, such as resource increases due to vegetation succession, which could not be measured in the field. Several authors have observed that the species richness increases over time, especially in suburban parks, and is associated with tree growth, which could provide more bird resources [25,83].

4.3. Bird Species Composition Between Landscapes

The species composition exhibited significant differences across landscapes. The turnover of individuals of different species primarily explains the dissimilarity in composition and taxonomic diversity among communities between urban and suburban landscapes. Zenaida auriculata, Patagioenas picazuro, Furnarius rufus, Pitangus sulphuratus, Turdus rufiventris, and Zonotrichia capensis were the species that most influenced the dissimilarity among landscapes. Zenaida auriculata was more abundant in urban parks. This species feeds on the ground but has an omnivorous diet, directly or indirectly benefiting from the variety of food that humans provide [84,85]. Patagioenas picazuro, Furnarius rufus, Pitangus sulphuratus, Turdus rufiventris, and Zonotrichia capensis were more abundant in suburban parks and predominantly forage on the ground. Therefore, they likely benefited from suburban parks with less cement coverage and, in 2018, greater grass coverage than urban parks.

4.4. Bird Species Composition Between Years

A turnover in species composition was also observed between 2003 and 2018. The patterns that most contributed to this dissimilarity between the two time periods included the introduction and successful establishment of Sturnus vulgaris and the increase in the abundance of Zenaida auriculata, Patagioenas picazuro, Furnarius rufus, and Turdus rufiventris. On the other hand, the temporal turnover of individuals may be related to the declines in Pitangus sulphuratus, Molothrus bonariensis, and Passer domesticus. Due to the number of species showing population increases being higher than the number of species declining, a pattern of nestedness was also observed between years. Therefore, there was an increase in the number of individuals of different species in the parks during 2018.
Since no increase in urbanization was observed in the surrounding areas of the parks, and the vegetation structure did not significantly change across the years, these changes in composition and abundance could be associated with a change in the landscape matrix at a larger scale, such as expansions in surrounding agricultural areas [46]. The development of agroecosystems is also known to influence the abundance and composition of bird species, particularly benefiting those associated with cultivated lands, such as Zenaida auriculata and Patagioenas picazuro [86,87].
Pitangus sulphuratus, Molothrus bonariensis, and Passer domesticus have shown population declines between 2003 and 2018. Passer domesticus has shown population declines in cities worldwide, and several causes, such as increased pollution, increased socioeconomic status, increased predation pressure, and a decrease in herbaceous vegetation, have been related to these declines [80,88,89,90,91]. In our study, the population increases in similar ecological species, such as Sturnus vulgaris and Zenaida auriculata, could have negatively impacted the populations of Molothrus bonariensis and Passer domesticus through competition for feeding and nesting sites [46].

5. Conclusions

In conclusion, we observed significant changes in the bird communities of Mar del Plata, both across years and among different types of parks. Without urbanization changes surrounding the parks, these community changes were related to long-term regional increases in the abundance of various bird species. We recommend measuring additional variables possibly associated with the observed bird community differences between landscapes and across years, such as vegetation succession. In addition, continuous yearly censuses of the bird communities in urban parks could reveal more detailed long-term trends in bird species. The results highlight the importance of long-term data in obtaining more insights into urban bird community dynamics.

Author Contributions

Conceptualization, L.M.L. and C.M.L.; methodology, L.M.L., C.M.L. and L.G.; software, L.G. and L.M.L.; validation, L.M.L., C.M.L. and L.G.; formal analysis, L.G. and L.M.L.; investigation, L.M.L., C.M.L. and L.G.; resources, L.G. and L.M.L.; data curation, L.G. and L.M.L.; writing—original draft preparation, L.G.; writing—review and editing, L.M.L., C.M.L. and L.G.; visualization, L.M.L., C.M.L. and L.G.; supervision, L.M.L.; project administration, L.M.L.; funding acquisition, L.M.L. All authors have read and agreed to the published version of the manuscript.

Funding

This research was funded by the Agencia Nacional de Promoción de la Investigación, el Desarrollo Tecnológico y la Innovación, PICT 2015-0978.

Institutional Review Board Statement

Not applicable.

Informed Consent Statement

Not applicable.

Data Availability Statement

The datasets generated and/or analyzed during the current study are available upon request to the corresponding author.

Conflicts of Interest

The authors declare no conflicts of interest.

References

  1. Berry, B.J.L. Urbanization. In The Earth as Transformed by Human Action; Cambridge University Press: Cambridge, UK, 1990; pp. 103–119. [Google Scholar]
  2. Meyer, W.B.; Turner, B.L. Human population growth and global land-use/cover change. Annu. Rev. Ecol. Syst. 1992, 23, 39–61. [Google Scholar] [CrossRef]
  3. Houghton, R.A. The worldwide extent of land-use change. BioScience 1994, 44, 305–313. [Google Scholar] [CrossRef]
  4. Marzluff, J.M.; Hamel, N. Land use issues. In Encyclopedia of Biodiversity; Levin, S.A., Ed.; Elsevier: Amsterdam, The Netherlands, 2001; pp. 659–673. [Google Scholar]
  5. Grimm, N.B.; Faeth, S.H.; Golubiewski, N.E.; Redman, C.L.; Wu, J.; Bai, X.; Briggs, J.M. Global Change and the Ecology of Cities. Science 2008, 319, 756–760. [Google Scholar] [CrossRef]
  6. Marzluff, J.M. Worldwide urbanization and its effects on birds. In Avian Ecology and Conservation in an Urbanizing World; Marzluff, J.M., Bowman, R., Donnelly, R., Eds.; Springer: Boston, MA, USA, 2001; pp. 19–47. [Google Scholar]
  7. Shanahan, D.F.; Strohbach, M.W.; Warren, P.S.; Fuller, R.A. The challenges of urban living. In Avian Urban Ecology; Oxford University Press: Oxford, UK, 2014; pp. 3–20. [Google Scholar]
  8. McKinney, M.L. Urbanization as a major cause of biotic homogenization. Biol. Conserv. 2006, 127, 247–260. [Google Scholar] [CrossRef]
  9. McKinney, M.L.; Lockwood, J.L. Biotic homogenization: A few winners replacing many losers in the next mass extinction. Trends Ecol. Evol. 1999, 14, 450–453. [Google Scholar] [CrossRef] [PubMed]
  10. Rahel, F.J. Homogenization of Freshwater Faunas. Annu. Rev. Ecol. Syst. 2002, 33, 291–315. [Google Scholar] [CrossRef]
  11. Olden, J.D.; Poff, N.L. Toward a Mechanistic Understanding and Prediction of Biotic Homogenization. Am. Nat. 2003, 162, 442–460. [Google Scholar] [CrossRef]
  12. Johnston, R.F. Synanthropic birds of North America. In Avian Ecology and Conservation in an Urbanizing World; Marzluff, J.M., Bowman, R., Donnelly, R., Eds.; Springer: Boston, MA, USA, 2001; pp. 49–67. [Google Scholar]
  13. Beissinger, S.R.; Osborne, D.R. Effects of urbanization on avian community organization. Condor 1982, 84, 75–83. [Google Scholar] [CrossRef]
  14. Bezzel, E. Birdlife in intensively used rural and urban environments. Ornis Fenn. 1985, 62, 90–95. [Google Scholar]
  15. Emlen, J.T. An urban bird community in Tucson, Arizona: Derivation, structure, regulation. Condor 1974, 76, 184–197. [Google Scholar] [CrossRef]
  16. Leveau, L.M.; Leveau, C.M. Comunidades de aves en un gradiente urbano de la ciudad de Mar del Plata, Argentina. El Hornero 2004, 19, 13–21. [Google Scholar] [CrossRef]
  17. Chace, J.F.; Walsh, J.J. Urban effects on native avifauna: A review. Landsc. Urban Plan. 2006, 74, 46–69. [Google Scholar] [CrossRef]
  18. Jokimäki, J.; Suhonen, J.; Jokimäki-Kaisanlahti, M.L.; Carbó-Ramírez, P. Effects of urbanization on breeding birds in European towns: Impacts of species traits. Urban Ecosyst. 2016, 19, 1565–1577. [Google Scholar] [CrossRef]
  19. Clergeau, P.; Savard, J.P.L.; Mennechez, G.; Falardeau, G. Bird abundance and diversity along an urban-rural gradient: A comparative study between two cities on different continents. Condor 1998, 100, 413–425. [Google Scholar] [CrossRef]
  20. Conole, L.E.; Kirkpatrick, J.B. Functional and spatial differentiation of urban bird assemblages at the landscape scale. Landsc. Urban Plan. 2011, 100, 11–23. [Google Scholar] [CrossRef]
  21. Jokimäki, J.; Huhta, E. Artificial nest predation and abundance of birds along an urban gradient. Condor 2000, 102, 838–847. [Google Scholar] [CrossRef]
  22. Leveau, L.M. Bird traits in urban–rural gradients: How many functional groups are there? J. Ornithol. 2013, 154, 655–662. [Google Scholar] [CrossRef]
  23. Fernández-Juricic, E. Avifaunal Use of Wooded Streets in an Urban Landscape. Conserv. Biol. 2000, 14, 513–521. [Google Scholar] [CrossRef]
  24. Carbó-Ramírez, P.; Zuria, I. The value of small urban greenspaces for birds in a Mexican city. Landsc. Urban Plan. 2011, 100, 213–222. [Google Scholar] [CrossRef]
  25. Morneau, F.; Décarie, R.; Pelletier, R.; Lambert, D.; DesGranges, J.L.; Savard, J.P. Changes in breeding bird richness and abundance in Montreal parks over a period of 15 years. Landsc. Urban Plan. 1999, 44, 111–121. [Google Scholar] [CrossRef]
  26. Recher, H.F.; Serventy, D.L. Long term Changes in the Relative Abundances of Birds in Kings Park, Perth, Western Australia. Conserv. Biol. 1991, 5, 90–102. [Google Scholar] [CrossRef]
  27. Murgui, E. Population trends in breeding and wintering birds in urban parks: A 15-year study (1998–2013) in Valencia, Spain. Rev. Catalana D’Ornitologia 2014, 30, 30–40. [Google Scholar]
  28. Fidino, M.; Limbrick, K.; Bender, J.; Gallo, T.; Magle, S.B. Strolling through a Century: Replicating Historical Bird Surveys to Explore 100 Years of Change in an Urban Bird Community. Am. Nat. 2022, 199, 159–167. [Google Scholar] [CrossRef] [PubMed]
  29. Skjelvik, C.E.; Dale, S. Bird population changes in urban green spaces explained by regional population trends. Urban Ecosyst. 2024, 27, 1339–1347. [Google Scholar] [CrossRef]
  30. Fidino, M.; Magle, S.B. Trends in Long-Term Urban Bird Research. In Ecology and Conservation of Birds in Urban Environments; Murgui, E., Hedblom, M., Eds.; Springer International Publishing: Cham, Switzerland, 2017; pp. 161–184. [Google Scholar]
  31. Stiles, F.G.; Rosselli, L.; De La Zerda, S. Changes over 26 years in the avifauna of the Bogotá region, Colombia: Has climate change become important? Front. Ecol. Evol. 2017, 5, 58. [Google Scholar] [CrossRef]
  32. Lepczyk, C.A.; La Sorte, F.A.; Aronson, M.F.; Goddard, M.A.; MacGregor-Fors, I.; Nilon, C.H.; Warren, P.S. Global Patterns and Drivers of Urban Bird Diversity. In Ecology and Conservation of Birds in Urban Environments; Murgui, E., Hedblom, M., Eds.; Springer International Publishing: Cham, Switzerland, 2017; pp. 13–33. [Google Scholar]
  33. Rebele, F. Urban ecology and special features of urban ecosystems. Glob. Ecol. Biogeogr. Lett. 1994, 4, 173–187. [Google Scholar] [CrossRef]
  34. Lodge, D.M. Biological invasions: Lessons for ecology. Trends Ecol. Evol. 1993, 8, 133–137. [Google Scholar] [CrossRef]
  35. Pârâu, L.G.; Strubbe, D.; Mori, E.; Menchetti, M.; Ancillotto, L.; Kleunen, A.V.; White, R.L.; Luna, Á.; Hernández-Brito, D.; Louarn, M.L.; et al. Rose-ringed parakeet Psittacula krameri populations and numbers in Europe: A complete overview. Open Ornithol. J. 2016, 9, 1–13. [Google Scholar] [CrossRef]
  36. Craig, A.J.F.K. Common Starling (Sturnus vulgaris Linnaeus, 1758). In Invasive Birds: Global Trends and Impacts; Downs, C.T., Hart, L.A., Eds.; CABI: Wallingford, UK, 2020; pp. 9–24. [Google Scholar]
  37. Pinto, E.D.E. Range expansion of the European Starling Sturnus vulgaris in Argentina. Ardeola 2005, 52, 359–364. [Google Scholar]
  38. Pérez, J. Estornino pinto en la Capital Federal. Nuestras Aves 1988, 17, 359–364. [Google Scholar] [CrossRef]
  39. Ifran, N.R.; Fiorini, V.D. European starling (Sturnus vulgaris): Population density and interactions with native species in Buenos Aires urban parks. Ornitol. Neotrop. 2010, 21, 507–518. [Google Scholar]
  40. Feare, C. The Starling; Oxford University Press: Oxford, UK, 1984. [Google Scholar]
  41. Menguel, R.M. The Birds of Kentucky; Ornithological Monographs No. 3; 1965. [Google Scholar]
  42. Weitzel, N.H. Nest-site competition between the European Starling and native breeding birds in northwestern Nevada. Condor 1988, 90, 515–517. [Google Scholar] [CrossRef]
  43. Ingold, D.J. Nesting phenology and competition for nest sites among Red-headed and Red-bellied Woodpeckers and European Starlings. Auk 1989, 106, 209–217. [Google Scholar]
  44. Ibañez, L.M.; Girini, J.M.; Palacio, F.X.; Fiorini, V.D.; Montalti, D. Interacciones entre el estornino pinto (Sturnus vulgaris) y aves nativas de Argentina por el uso de cavidades. Rev. Mex. Biodivers. 2017, 88, 477–479. [Google Scholar] [CrossRef]
  45. Zárate, V.; Juncosa Polzella, A.S. Usurpación de Nido de Carpintero del Cardón (Melanerpes cactorum) por Parte de Estornino Pinto (Sturnus vulgaris). Nuestras Aves 2020, 65, 58–60. [Google Scholar] [CrossRef]
  46. Leveau, L.M. Long-term directional changes in urban bird communities of Mar del Plata City, Argentina. Front. Ecol. Evol. 2024, 12, 1457476. [Google Scholar] [CrossRef]
  47. Leveau, L.M.; Leveau, C.M. Does urbanization affect the seasonal dynamics of bird communities in urban parks? Urban Ecosyst. 2016, 19, 631–647. [Google Scholar] [CrossRef]
  48. Zhou, D.; Chu, L.M. How would size, age, human disturbance, and vegetation structure affect bird communities of urban parks in different seasons? J. Ornithol. 2012, 153, 1101–1112. [Google Scholar] [CrossRef]
  49. Morello, J.; Matteucci, S.D.; Rodriguez, A.F.; Silva, M.E.; Mesopotámica, P.; Llana, P. Ecorregiones y Complejos Ecosistémicos de Argentina. Orientación Gráfica Ed. B. Aires. 2012. [Google Scholar]
  50. Hutto, R.L.; Pletschet, S.M.; Hendricks, P. A fixed-radius point count method for nonbreeding and breeding season use. Auk 1986, 103, 593–602. [Google Scholar] [CrossRef]
  51. Bibby, C.J.; Burgess, N.D.; Hill, D.A. Bird Census Techniques; Academic Press: London, UK, 1992. [Google Scholar]
  52. Bibby, C.J.; Jones, M.; Marsden, S. Bird Surveys; Expedition Advisory Centre: London, UK, 1998. [Google Scholar]
  53. Schneider, C.A.; Rasband, W.S.; Eliceiri, K.W. NIH Image to ImageJ: 25 years of image analysis. Nat. Methods 2012, 9, 671–675. [Google Scholar] [CrossRef]
  54. Ferenc, M.; Sedláček, O.; Fuchs, R. How to improve urban greenspace for woodland birds: Site and local-scale determinants of bird species richness. Urban Ecosyst. 2014, 17, 625–640. [Google Scholar] [CrossRef]
  55. Jost, L.; González-Oreja, J. Midiendo la diversidad biológica: Más allá del índice de Shannon. Acta Zool. Lilloana 2012, 1–2, 3–14. [Google Scholar]
  56. Chao, A.; Chiu, C.H.; Jost, L. Unifying Species Diversity, Phylogenetic Diversity, Functional Diversity, and Related Similarity and Differentiation Measures Through Hill Numbers. Annu. Rev. Ecol. Evol. Syst. 2014, 45, 297–324. [Google Scholar] [CrossRef]
  57. Li, D. hillR: Taxonomic, functional, and phylogenetic diversity and similarity through Hill Numbers. J. Open Source Softw. 2018, 3, 1041. [Google Scholar] [CrossRef]
  58. Chao, A.; Ma, K.H.; Hsieh, T.C. User’s guide for iNEXT online: Software for interpolation and Extrapolation of species diversity. Code 2016, 30043, 1–14. [Google Scholar]
  59. MacGregor-Fors, I.; Payton, M.E. Contrasting diversity values: Statistical inferences based on overlapping confidence intervals. PLoS ONE 2013, 8, e56794. [Google Scholar] [CrossRef] [PubMed]
  60. Oksanen, J.; Blanchet, F.G.; Friendly, M.; Kindt, R.; Legendre, P.; McGlinn, D.; Minchin, P.R.; O’hara, R.B.; Simpson, G.L.; Solymos, P.; et al. vegan: Community ecology package. R Package Version 2013, 2, 321–326. [Google Scholar]
  61. Bray, J.R.; Curtis, J.T. An ordination of the upland forest communities of southern Wisconsin. Ecol. Monogr. 1957, 27, 326–349. [Google Scholar] [CrossRef]
  62. Zhou, D.; Chu, L.M. Do avian communities vary with season in highly urbanized Hong Kong? Wilson J. Ornithol. 2014, 126, 69–80. [Google Scholar] [CrossRef]
  63. Baselga, A. Partitioning the turnover and nestedness components of beta diversity. Glob. Ecol. Biogeogr. 2010, 19, 134–143. [Google Scholar] [CrossRef]
  64. Baselga, A.; Orme, D.; Villeger, S.; De Bortoli, J.; Leprieur, F.; Logez, M.; Henriques-Silva, R.; Martinez-Santalla, S.; Martin-Devasa, R.; Gomez-Rodriguez, C.; et al. Betapart: Partitioning Beta Diversity into Turnover and Nestedness Components. R Package Version 1.5. 2; 2021. [Google Scholar]
  65. Baselga, A. Separating the two components of abundance-based dissimilarity: Balanced changes in abundance vs. abundance gradients. Methods Ecol. Evol. 2013, 4, 552–557. [Google Scholar] [CrossRef]
  66. Pinheiro, J. nlme: Linear and nonlinear mixed effects models. R Package Version 2011, 3, 1. [Google Scholar]
  67. Team, R.C. R: A Language and Environment for Statistical Computing; R Foundation for Statistical Computing: Vienna, Austria, 2020. [Google Scholar]
  68. Fox, J.; Weisberg, S. An R Companion to Applied Regression; Sage Publications: Thousand Oaks, CA, USA, 2018. [Google Scholar]
  69. Brooks, M.E.; Kristensen, K.; Van Benthem, K.J.; Magnusson, A.; Berg, C.W.; Nielsen, A.; Skaug, H.J.; Machler, M.; Bolker, B.M. glmmTMB balances speed and flexibility among packages for zero-inflated generalized linear mixed modeling. R J. 2017, 9, 378–400. [Google Scholar] [CrossRef]
  70. Zuur, A.F. (Ed.) Mixed Effects Models Extensions in Ecology with R; Springer: New York, NY, USA, 2009. [Google Scholar]
  71. Lüdecke, D. sjPlot: Data visualization for statistics in social science. R Package Version 2021, 2, 1–106. [Google Scholar]
  72. Wickham, H. ggplot2: Elegant Graphics for Data Analysis; Springer: New York, NY, USA, 2009. [Google Scholar]
  73. Garaffa, P.I.; Filloy, J.; Bellocq, M.I. Bird community responses along urban–rural gradients: Does the size of the urbanized area matter? Landsc. Urban Plan. 2009, 90, 33–41. [Google Scholar] [CrossRef]
  74. Leveau, L.M. Relaciones aves–habitat en el sector suburbano de Mar del Plata, Argentina. Ornitol. Neotrop. 2013, 24, 201–212. [Google Scholar]
  75. Fernández-Juricic, E.; Tellería, J.L. Effects of human disturbance on spatial and temporal feeding patterns of Blackbird Turdus merula in urban parks in Madrid, Spain. Bird Study 2000, 47, 13–21. [Google Scholar] [CrossRef]
  76. Fernández-juricic, E. Avian spatial segregation at edges and interiors of urban parks in Madrid, Spain. Biodivers. Conserv. 2001, 10, 1303–1316. [Google Scholar] [CrossRef]
  77. Patón, D.; Romero, F.; Cuenca, J.; Escudero, J.C. Tolerance to noise in 91 bird species from 27 urban gardens of Iberian Peninsula. Landsc. Urban Plan. 2012, 104, 1–8. [Google Scholar] [CrossRef]
  78. MacGregor-Fors, I.; Morales-Pérez, L.; Quesada, J.; Schondube, J.E. Relationship between the presence of House Sparrows (Passer domesticus) and Neotropical bird community structure and diversity. Biol. Invasions 2010, 12, 87–96. [Google Scholar] [CrossRef]
  79. Blair, R.B. Creating a homogeneous avifauna. In Avian Ecology and Conservation in an Urbanizing World; Marzluff, J.M., Bowman, R., Donnelly, R., Eds.; Springer: Boston, MA, USA, 2001; pp. 459–486. [Google Scholar]
  80. Shaw, L.M.; Chamberlain, D.; Evans, M. The House Sparrow Passer domesticus in urban areas: Reviewing a possible link between post-decline distribution and human socioeconomic status. J. Ornithol. 2008, 149, 293–299. [Google Scholar] [CrossRef]
  81. Isacch, J.P.; Isacch, J. Estornino Pinto (Sturnus vulgaris) en la ciudad de Mar del Plata (Provincia de Buenos Aires, Argentina). Nuestras Aves 2004, 47, 33. [Google Scholar] [CrossRef]
  82. Jensen, R.F. Nuevos registros de estornino pinto (Sturnus vulgaris) para el sureste de la provincia de Entre Ríos, Argentina. Nuestras Aves 2008, 53, 22. [Google Scholar] [CrossRef]
  83. Munyenyembe, F.; Harris, J.; Hone, J.; Nix, H. Determinants of bird populations in an urban area. Aust. J. Ecol. 1989, 14, 549–557. [Google Scholar] [CrossRef]
  84. Kark, S.; Iwaniuk, A.; Schalimtzek, A.; Banker, E. Living in the city: Can anyone become an ‘urban exploiter’? J. Biogeogr. 2007, 34, 638–651. [Google Scholar] [CrossRef]
  85. Croci, S.; Butet, A.; Clergeau, P. Does urbanization filter birds on the basis of their biological traits. Condor 2008, 110, 223–240. [Google Scholar] [CrossRef]
  86. Narosky, T. Las aves de la Provincia de Buenos Aires: Distribución y Estatus; Asociación Ornitológica del Plata: Buenos Aires, Argentina, 1993. [Google Scholar]
  87. Krapovickas, S.; Di Giacomo, A.S. Conservation of pampas and campos grasslands in Argentina. Parks 1998, 8, 47–53. [Google Scholar]
  88. Dandapat, A.; Banerjee, D.; Chakraborty, D. The case of the Disappearing House Sparrow (Passer domesticus indicus). Vet. World 2010, 3, 97. [Google Scholar]
  89. Berigan, L.A.; Greig, E.I.; Bonter, D.N. Urban house sparrow (Passer domesticus) populations decline in North America. Wilson J. Ornithol. 2020, 132, 248–258. [Google Scholar] [CrossRef]
  90. Palacio, F.X.; Ibañez, L.M.; Maragliano, R.E.; Montalti, D. Urbanization as a driver of taxonomic, functional, and phylogenetic diversity losses in bird communities. Can. J. Zool. 2018, 96, 1114–1121. [Google Scholar] [CrossRef]
  91. Campbell, C.E.; Jones, D.N.; Awasthy, M.; Castley, J.G.; Chauvenet, A.L. Big changes in backyard birds: An analysis of long-term changes in bird communities in Australia’s most populous urban regions. Biol. Conserv. 2022, 272, 109671. [Google Scholar] [CrossRef]
Figure 1. Left: Location of Mar del Plata City in Argentina. Right: Mar del Plata City and sampled parks.
Birds 05 00054 g001
Figure 2. Landscape composition using ImageJ software (Version 1.54k), measuring the urban level within a 500 m radius of Urquiza Park in 2003.
Birds 05 00054 g002
Figure 3. Box plots showing the percentage of tree, bush, grass, and concrete cover observed in urban and suburban parks in Mar del Plata in 2003 and 2018. The boxes represent the interquartile range (first, second, and third quartile). The horizontal lines in the middle of the box represent the median. The vertical lines represent the maximum and minimum coverage values. Points indicate outliers.
Birds 05 00054 g003
Figure 4. Species richness, Shannon diversity, and Simpson diversity between years. The dots correspond to the average values per park, whereas the vertical lines are the 95% confidence intervals.
Birds 05 00054 g004
Figure 5. Rarefaction curves of Hill numbers (species richness, q = 0; Shannon diversity, q = 1; and Simpson diversity, q = 2) with sample coverage for urban (urb) and suburban (sub) parks in 2003 and 2018 in Mar del Plata City, Argentina. The shaded bands represent the 84% confidence intervals.
Birds 05 00054 g005
Figure 6. Nonmetric multidimensional scaling (NMDS) based on dissimilarity calculated with the Bray–Curtis index between urban and suburban parks in 2003 and 2018 in Mar del Plata City, Argentina. Sites marked with triangles correspond to urban parks, and those marked with circles correspond to suburban parks. The violet color represents parks in 2003, and the green color represents parks in 2018. Ellipses represent 95% confidence intervals between landscapes types and years. See Table 1 for species names.
Birds 05 00054 g006
Table 1. Abundance of species observed in urban and suburban parks in Mar del Plata City (Argentina) in 2003 and 2018.
20032018
SpeciesAbbreviationUrban ParksSuburban ParksUrban ParksSuburban Parks
Vanellus chilensisvach0011
Columba liviacoli2090
Patagioenas picazuropapi9201923
Patagioenas maculosapama1210717
Zenaida auriculatazeau37398032
Guira guiragugu0010
Chlorostilbon luciduschlu1002
Leucochloris albicollisleal0011
Milvago chimangomich251443
Myiopsitta monachusmymo031841
Furnarius rufusfuru10211519
Elaenia parvirostriselpa0204
Serpophaga subcristatasesu2013
Pyrocephalus rubinuspyru7100
Machetornis rixosusmari1320
Pitangus sulphuratuspisu617912
Tyrannus melancholicustyme1633
Tyrannus savanatysa2002
Progne chalybeaprch0014
Progne elegansprel0011
Tachycineta leucorrhoatale0500
Hirundo rusticahiru00215
Troglodytes aedontrae1316
Turdus rufiventristuru581213
Mimus saturninusmisa14974
Sturnus vulgarisstvu001137
Sicalis flaveolasifl0001
Zonotrichia capensiszoca41118
Setophaga pitiayumisepi0005
Agelaioides badiusagba1734
Molothrus bonariensismobo713611
Molothrus rufoaxillarismoru0022
Chloris chloriscach2603
Spinus magellanicusspma5026
Passer domesticuspado71153917
Table 2. Final generalized linear mixed models showing the relationship between species richness, Shannon diversity, and Simpson diversity and period (year) during 2003–2018 in urban parks of Mar del Plata City, Argentina. LRT, likelihood ratio test; *** p < 0.001, ** p < 0.01, * p < 0.05.
EstimateStd. Errorz/t ValuepLRT
Species richness (q = 0)Intercept2.2600.09424.1390.0009.646 ***
Year 20180.3060.0833.6880.000
Shannon diversity (q = 1)Intercept7.2260.9187.8670.0008.708 **
Year 20181.8120.5293.4240.006
Simpson diversity (q = 2)Intercept5.9000.8307.1050.0004.630 *
Year 20181.0260.4512.2760.044
Table 3. Simper analysis indicating the contribution of each species to the dissimilarity between landscapes in the parks of the city of Mar del Plata in 2003 and 2018. The asterisk (*) highlights species with a significant impact on landscape dissimilarity, as evidenced by a mean–SD ratio greater than 1.
SpeciesAverage ContributionSDMean–SD RatioAverage Abundance in UrbanAverage Abundance in SuburbanCumulative Contribution
Zenaida auriculata0.0960.0721.340 *9.7505.9170.138
Passer domesticus0.0880.1030.8499.1672.6670.265
Patagioenas maculosa0.0850.1280.6669.0001.5830.388
Patagioenas picazuro0.0420.0391.064 *2.3333.5830.448
Milvago chimango0.0420.0510.8191.3334.0000.508
Myiopsitta monachus0.0410.0540.7631.5003.6670.568
Sturnus vulgaris0.0300.0370.8220.9173.0830.612
Furnarius rufus0.0290.0251.140 *2.0833.3330.653
Mimus saturninus0.0240.0350.7071.7501.0830.688
Molothrus bonariensis0.0240.0250.9851.0832.0000.723
Pitangus sulphuratus0.0240.0201.161 *1.2502.4170.757
Turdus rufiventris0.0220.0211.048 *1.4171.7500.789
Zonotrichia capensis0.0190.0181.048 *0.4171.5830.816
Table 4. Simper analysis indicating the contribution of each species to the dissimilarity between 2003 and 2018 in the parks of the city of Mar del Plata. The asterisk (*) highlights species with a significant impact on landscape dissimilarity, as evidenced by a mean–SD ratio greater than 1.
SpeciesAverage ContributionSDMean–SD RatioAverage Abundance in 2003Average Abundance in 2018Cumulative Contribution
Patagioenas maculosa0.1010.1390.7300.25010.3330.144
Zenaida auriculata0.0920.0711.304 *6.3339.3330.275
Passer domesticus0.0750.0790.9527.1674.6670.381
Milvago chimango0.0510.0550.9170.5834.7500.453
Myiopsitta monachus0.0500.0610.8320.2504.9170.524
Sturnus vulgaris0.0410.0381.075 *0.0004.0000.582
Patagioenas picazuro0.0380.0331.144 *2.4173.5000.637
Furnarius rufus0.0260.0211.209 *2.5832.8330.673
Molothrus bonariensis0.0230.0221.044 *1.6671.4170.706
Mimus saturninus0.0230.0310.7411.9170.9170.739
Turdus rufiventris0.0220.0201.126 *1.0832.0830.771
Pitangus sulphuratus0.0210.0171.228 *1.9171.7500.800
Zonotrichia capensis0.0150.0150.9591.2500.7500.821
Disclaimer/Publisher’s Note: The statements, opinions and data contained in all publications are solely those of the individual author(s) and contributor(s) and not of MDPI and/or the editor(s). MDPI and/or the editor(s) disclaim responsibility for any injury to people or property resulting from any ideas, methods, instructions or products referred to in the content.

