Article

Data Types and the Phylogeny of Neoaves

by
Edward L. Braun
* and
Rebecca T. Kimball
*
Department of Biology, University of Florida, Gainesville, FL 32611, USA
*
Authors to whom correspondence should be addressed.
Birds 2021, 2(1), 1-22; https://doi.org/10.3390/birds2010001
Submission received: 15 November 2020 / Revised: 14 December 2020 / Accepted: 15 December 2020 / Published: 5 January 2021
(This article belongs to the Special Issue Feature Papers of Birds 2021)

Abstract

:

Simple Summary

Some of the earliest studies using molecular data to resolve evolutionary history separated birds into three main groups: Paleognathae (ostriches and allies), Galloanseres (ducks and chickens), and Neoaves (the remaining ~95% of avian species). The early evolution of Neoaves, however, has remained challenging to understand, even as data from whole genomes have become available. We have recently proposed that some of the conflicts among recent studies may be due to the type of genomic data that is analyzed (regions that code for proteins versus regions that do not). However, a rigorous examination of this hypothesis using coding and non-coding data from the same genomic regions sequenced from a relatively large number of species has not yet been conducted. Here we perform such an analysis and show that data type does influence the methods used to infer evolutionary relationships from molecular sequences. We also show that conducting analyses using models of sequence evolution that were chosen to minimize reconstruction errors result in coding and non-coding trees that are much more similar, and we add to the evidence that non-coding data provide better information regarding neoavian relationships. While a few relationships remain problematic, we are approaching a good understanding of the evolutionary history for major avian groups.

Abstract

The phylogeny of Neoaves, the largest clade of extant birds, has remained unclear despite intense study. The difficulty associated with resolving the early branches in Neoaves is likely driven by the rapid radiation of this group. However, conflicts among studies may be exacerbated by the data type analyzed. For example, analyses of coding exons typically yield trees that place Strisores (nightjars and allies) sister to the remaining Neoaves, while analyses of non-coding data typically yield trees where Mirandornites (flamingos and grebes) is the sister of the remaining Neoaves. Our understanding of data type effects is hampered by the fact that previous analyses have used different taxa, loci, and types of non-coding data. Herein, we provide strong corroboration of the data type effects hypothesis for Neoaves by comparing trees based on coding and non-coding data derived from the same taxa and gene regions. A simple analytical method known to minimize biases due to base composition (coding nucleotides as purines and pyrimidines) resulted in coding exon data with increased congruence to the non-coding topology using concatenated analyses. These results improve our understanding of the resolution of neoavian phylogeny and point to a challenge—data type effects—that is likely to be an important factor in phylogenetic analyses of birds (and many other taxonomic groups). Using our results, we provide a summary phylogeny that identifies well-corroborated relationships and highlights specific nodes where future efforts should focus.

Graphical Abstract

1. Introduction

Since the advent of molecular phylogenetics, it has been recognized that birds can be reliably separated into three clades: Paleognathae (ratites and tinamous), Galloanserae (landfowl and waterfowl), and Neoaves (all other birds, representing about 95% of all extant species). The base of Neoaves is one of the most difficult problems in phylogenetics (reviewed by [1]). It has long been clear that Neoaves underwent an extremely rapid radiation [2,3,4], probably close in time to the K-Pg (Cretaceous-Paleogene) mass extinction (reviewed by Field et al. [5]). Many studies using large sequence datasets [6,7,8,9,10,11,12,13,14,15,16] have corroborated many clades within Neoaves, but some relationships among these clades deep in the bird tree remain surprisingly recalcitrant to resolution. Reddy et al. [13] suggested that Neoaves should be viewed as a radiation of ten major clades, seven clades that comprise multiple orders (“the magnificent seven”) and three “orphan orders.” Independently, Suh [17] highlighted a virtually identical set of major clades. Thus, even in the phylogenomic era, relationships among these 10 clades differ among studies, confounding our ability to understand the early evolution of birds.
One explanation for the differences among studies is taxon sampling. Prum et al. [12] suggest that their results, using 200 species, differed from those of Jarvis et al. [11], which only included 48 species, due to denser taxon sampling. However, Reddy et al. [13] analyzed a slightly larger number of species than Prum et al. [12] and they recovered a tree with similarities to the primary Jarvis et al. [11] tree (which they called the “TENT”). This suggests that differences are due to data type effects. The use of large-scale (“phylogenomic”) datasets to examine relationships among organisms has revealed cases where analyses of different data types (e.g., coding versus non-coding data) yield different tree topologies [11,13,18,19,20,21,22,23]. Some data type effects are strong enough that the tree topology based on one data type can be rejected in analyses using the other data type. Examples of data type effects involving distinct sources of genomic information include the different topological signals that emerge in analyses of coding vs. non-coding data [13,19], sites in different protein structural environments [24], or proteins with distinct functions [22]. While some conflicts may be due to analyses of small data matrices (limited sampling of either taxa or loci) that lack the power to confidently resolve relationships, alternative topologies due to different data types can remain even when large data sets are analyzed (systematic data type effects). These systematic data type effects represent a fundamental challenge for phylogenomic studies.
While recovery of the magnificent seven is independent of data type [11,13], the relationships among the magnificent seven and the orphan orders exhibit substantial variation. This does not mean that results of analyses using various datasets of non-coding and coding data have yielded absolutely identical topologies; instead, the non-coding and coding topologies represent parts of tree space that share certain features (Figure 1). The most prominent feature of non-coding trees is that clades VI (doves, mesites, and sandgrouse) and clade VII (flamingos and grebes) are sister to all other Neoaves (called Passerea by Jarvis et al. [11]) with clades VI and VII either united or as successive sister groups of Passerea (Figure 1A). In contrast, trees based on large coding datasets (Figure 1B) have tended to yield trees with “clade P1” [13], which comprises all Neoaves except clade V (nightjars, hummingbirds, swifts, and allies). Coding exon trees may also include an “extended waterbird clade” (Aequorlitornithes sensu Prum et al. [12]. Beyond these features, which are present in many (but not all) trees based on each data type, clustering trees using topological distances separates those trees into coding and non-coding groups (cf. Figure 8 in Reddy et al. [13]).
It is perhaps telling that the two most important unresolved questions regarding the phylogeny of extant birds identified by Pittman et al. [25] appear to reflect issues of data type. Specifically, Pittman et al. [25] asked: (1) “Which clade is the sister taxon to the rest of Neoaves?”; and (2) “Are most aquatic avian lineages part of a monophyletic aquatic radiation?” Although we believe that these are the most important issues for the data type effects hypothesis, they do not represent all potential cases where data type might have an influence on the phylogeny of Neoaves. For example, coding data tend to place at least some raptorial landbird lineages sister to the other core landbirds (clade I) [1]. The Prum et al. [12] tree, largely based on coding data, united clades IV and VI in a clade they called Columbaves (Figure 1B) but this grouping was not perfectly congruent with the relevant Jarvis topology and Kuhl et al. [16] recovered Columbaves in their non-coding tree, prompting us to exclude it from the coding indicator clades. Reddy et al. [13] defined another potential non-coding indicator clade, which they called clade J3N; this clade comprises clades I and III (Figure 1A). We excluded clade J3N from our set of indicator clades because it was not present in the Kuhl et al. [16] non-coding tree. Despite the challenges associated with defining data type indicator clades for Neoaves, it seems clear that Passerea vs. clade P1 and the extended waterbirds are likely to be robust indicators.
Figure 1. Consensus topologies for Neoaves emphasizing the “magnificent seven” and the “indicator clades” that differ in trees resulting from analyses of (A) non-coding vs. (B) coding data. The primary non-coding indicator clades is Passerea. The coding exon indicator clades are clade P1 (all Neoaves except clade V), the extended waterbird clade, and a paraphyletic assemblage of raptors sister to the other landbirds. The thin dashed lines highlight potential indicator clades that we view as uncertain at this time (see text). Magnificent seven clade names: I = “core landbirds” or Telluraves [26]. II = “core waterbirds” or Aequornithes [27]; III = Phaethontimorphae [11]; IV = Otidimorphae [11]; V = Strisores [28]; VI = Columbimorphae; [11]; VII = Mirandornithes [27].
Birds 02 00001 g001
Although Reddy et al. [13] defined and examined the most important data type indicator clades, that study did have some limitations. The taxon sample that Reddy et al. [13] used was similar in size to the Prum et al. [12] taxon sample, but the distribution of taxa across the avian tree of life differed between those two datasets. At least some of the benefits of increased taxon sampling are thought to reflect the subdivision of long branches when taxa are added [29,30] and the Prum et al. [12] and Reddy et al. [13] studies probably broke up different long branches due to the inclusion of different taxa in each study. Additionally, the two studies used different loci throughout the genome. Given that different parts of the genome have different evolutionary histories, there could be localized biases [8,31] that may affect one or both of these datasets—but likely in different ways due to the different sampling across the genome. Finally, Reddy et al. [13] considered the Prum et al. [12] tree to represent a coding tree, yet that data matrix included almost 20% non-coding data (introns, untranslated regions (UTRs), and intergenic regions). Thus, the “Prum tree” is not a coding exon tree in the strict sense. A better approach to testing the data types hypothesis is to use the same species and loci in both the coding and non-coding analyses, but ideally with improved taxon sampling over the 50 species included in Jarvis et al. [11]. Given that the Prum data matrix includes both data types for most loci, subdividing this dataset allows the Reddy et al. [13] data type effects hypothesis to be tested in a direct manner. If that hypothesis is correct, we predict that:
(1)
Analyses of the non-coding subset of the Prum et al. [12] data matrix will yield trees with a “non-coding-type” topology (Figure 1A).
(2)
Analyses of the coding subset of the Prum et al. [12] data matrix will yield trees with a “coding-type” topology (Figure 1B).
The basis for the first prediction is straightforward, but the second may seem trivial. After all, it seems likely that analysis of the Prum coding subset will yield a tree similar to the published Prum tree because the complete matrix is 80% coding data. However, it is possible that excluding the non-coding data could alter the topology in various ways. Thus, it is important to examine both predictions empirically.
There is a third prediction that could also be made. Reddy et al. [13] hypothesized that the non-coding trees were closer to the true evolutionary history of Neoaves based on two observations: (1) the non-coding cluster includes trees based on rare genomic changes (e.g., the transposable element insertion tree from Suh et al. [32]), which are a distinct source of phylogenetic information; and (2) coding data exhibit greater variation in GC-content (guanine-cytosine content) among taxa than non-coding data, violating the assumptions of the time-reversible models used in most maximum-likelihood (ML) and Bayesian analyses of phylogeny. The second point allows us to predict that analytical methods that limit the impact of variation in base composition on phylogenetic estimation will yield coding exon trees that are more congruent with non-coding trees.
Here we perform a direct test of the data type effects hypothesis for the base of Neoaves by conducting phylogenetic analyses of the coding and non-coding subsets of the Prum data matrix. More specifically, we examined the first two predictions by conducting analyses of concatenated nucleotide data. To test the third prediction, we recoded nucleotide sequences for the coding subset as purines (R) and pyrimidines (Y). This approach, called RY coding, is a simple method that limits the impact of base compositional variation [24,33]. To extend these results into the multispecies coalescent framework, we used ASTRAL [34] to estimate the species tree by combining gene trees. However, we used gene trees that were estimated using the original nucleotide alignments and alignments subjected to RY coding of the data. Finally, we discuss the implications of our results for the theory and practice of phylogenomics and for the tree topology at the base of Neoaves.

2. Methods

2.1. Dataset Construction

We identified data types within the Prum dataset by using BLASTX [35] to search avian proteins using all 259 of the Prum loci as queries. Then we assigned codon positions, refined feature boundaries manually, and annotated the non-coding subsets of the loci as introns or UTRs based on examination of gene structure. All introns annotated in this way had the canonical GT-AG (Chambon’s rule) boundaries [36]. We considered the sites upstream of the start codon to be 5′ UTRs and the sites downstream of the stop codon to be 3′ UTRs. This median length of UTR regions was short (175.5 nt; Additional file) so the UTR partition should contain little or no intergenic sequences; obviously, if any intergenic data were included in the UTR partition it would still represent non-coding data and would not affect our results. Finally, the nine completely non-coding loci in the Prum dataset were divided into intronic and intergenic sequences based on BLASTN searches of the chicken genome (assembly version Gallus-gallus-5.0). We exported various subsets of each locus (first, second, and third positions of coding exons, the intronic sequences, and the UTR sequences) using PAUP* 4.0a167 (https://paup.phylosolutions.com). Although most loci included more than one data type (Supplementary File S1), the nine non-coding loci were limited to a single data type (six were intronic and three were intergenic sequences) so they were used without modification. Then all subsets were concatenated into a single nexus file [37] with charsets for each data type within each locus. The complete dataset and alignments of individual loci (also in nexus format with charsets for the data types) are available in Supplementary File S2.
Our annotated and modified version of the Prum dataset comprises 394,462 base pairs (bp) of aligned data. Although most of the alignment corresponds to coding exons, 64,147 bp of aligned non-coding data, most of which were intronic, were also present (Figure 2). Thus, the Prum dataset actually includes more non-coding data than the Hackett et al. [6] dataset (which comprises 19 loci and ~32,000 bp of aligned data). We view this as important because Hackett et al. [6] was the first analysis of deep avian phylogeny where the topology was robust to single gene jackknifing (i.e., conducting analyses after excluding each individual locus). We interpret that result as evidence that the Hackett dataset is large enough to provide meaningful information about challenging branches at the base of Neoaves. The relatively high proportion of informative sites in the various non-coding partitions (Figure 2) provides further reason to believe that we will be able to obtain useful estimates of avian phylogeny from both the coding and the non-coding subsets of the Prum dataset.

2.2. Analysis of Base Composition

We examined base composition for all subsets of the data using the statefreq option in PAUP*. Base composition was examined separately for the invariant sites and the parsimony informative sites (i.e., sites with the potential to unite at least two taxa). To examine variation in base composition, we extracted the proportions of A, C, G, and T from the PAUP* statefreq output for each taxon and calculated the interquartile range for the three axes of variation in nucleotide composition space: (1) the RY axis (i.e., the purine- pyrimidine or AG-CT axis); (2) the SW axis (i.e., the strong-weak or GC-AT axis); and (3) the KM axis (i.e., the keto-amino or GT-AC axis). We calculated base composition for each taxon using the binary-coded informative sites, which we defined as those sites that remain informative after recoding the nucleotide data as binary characters (e.g., RY informative characters are those sites that would be informative after RY coding). We identified generated binary datasets (RY, SW, and KM) using a Perl program available from https://github.com/ebraun68/RYcode.

2.3. Phylogenetic Analyses

We used IQ-TREE v. 2.0.6 [38] for all ML analyses. We used -m TEST to identify the best-fitting model in the unpartitioned analyses and -m TESTMERGE [39] to identify the best partitioning scheme and the best model for each merged partition. We began with 998 initial partitions for the complete dataset: 750 initial partitions for the coding exons (250 loci, with 3 codon positions per locus), and 248 initial partitions for non-coding data (Supplementary File S2). We assessed clade support using the ultrafast bootstrap [40] values (calculated using 1000 replicates).
We used ASTRAL-III [34] for analyses in the multispecies coalescent (gene tree-species tree) framework. We used complete genes for this analysis, without separation into coding and non-coding regions. This maintained each “gene” as a single locus within the genome and resulted in datasets that were of sufficient size to yield reasonable gene tree estimates. Gene trees were estimated by IQ-TREE using -m TEST to identify the best-fitting model and the --polytomy option to collapse very short (i.e., effectively zero length) branches. We used two sets of estimated gene trees: (1) trees generated using standard nucleotide models; and (2) trees for RY data generated using two-state models (i.e., the Cavender-Farris-Neyman model [41,42,43] and its unequal state frequency extension, which are called JC2 and GTR2 in IQ-TREE). We assessed clade support in the ASTRAL tree using local posterior probabilities [44].
We compared tree topologies by calculating matching distances [45,46] using PAUP* and then clustering trees by neighbor joining [47] of those tree-to-tree distances (this allowed us to visualize treespace in the same way as Reddy et al. [13]). We conducted this topological clustering analysis in two ways: (1) using the matching distances among the ML trees; and (2) using the matching distances among ML trees with branches with ≤50% support collapsed. We used AfterPhylo.pl (available from https://github.com/qiyunzhu/AfterPhylo) to collapses the low support branches.

3. Results

3.1. Base Composition and the Impact of RY Coding

The coding exons in the Prum dataset are more GC-rich than the non-coding data (48.3% GC for the coding exons vs. 39.7% GC for the non-coding data). However, the base composition of the various data types is much more complex than implied by this straightforward difference in GC-content (Table 1). The base composition of invariant sites in each data type differed from the composition of informative sites. This was particularly apparent in the 2nd and 3rd codon positions, but very minor for the non-coding data. Differences in the base composition of invariant vs. informative sites are not expected given the assumptions for most models of sequence evolution used for phylogenetic analyses. We also observed substantial differences in base composition among the loci and among the codon positions and non-coding data types within loci (i.e., the introns and UTRs) (Supplementary File S1).
There were also striking differences in the among taxon patterns of base compositional variation (Table 2). The data type with the greatest variation among taxa in base compositional variation was actually the non-coding intergenic regions, though there were very few intergenic loci and so limited number of base pairs (Table 2), making it difficult to interpret this result. If we limit consideration to better sampled data types, it was clear that introns exhibited the least base compositional variation among taxa, and 3rd codon positions exhibited the greatest variation. Overall, base compositional variation along the SW axis was three to eight times greater than variation along the other two axes (Table 2). Within an axis, there was limited variation among most data types along the RY or KM axes (excluding the poorly sampled intergenic partition); however, for the SW axis, there was about four-fold variation among data types (Table 2). The phylogenetic models that are practical for large-scale studies assume that base composition remains constant over time (in expectation) so this variation among taxa may be problematic for phylogenetic estimation. We examined the impact of RY coding because the variation evident in the Prum dataset, particularly along the SW axis, violates the assumptions of models of DNA evolution. RY coding, which converts purines (A and G) to R, and pyrimidines (C and T) to Y, should eliminate any variation along the SW (and the KM) axis, so it is expected to improve estimates of phylogeny in cases where among taxa base composition is highly variable, such as we observed in the coding data. However, RY coding also reduces the number of informative sites (Table 2); thus, RY coding also has the potential to reduce the power of phylogenetic estimation.

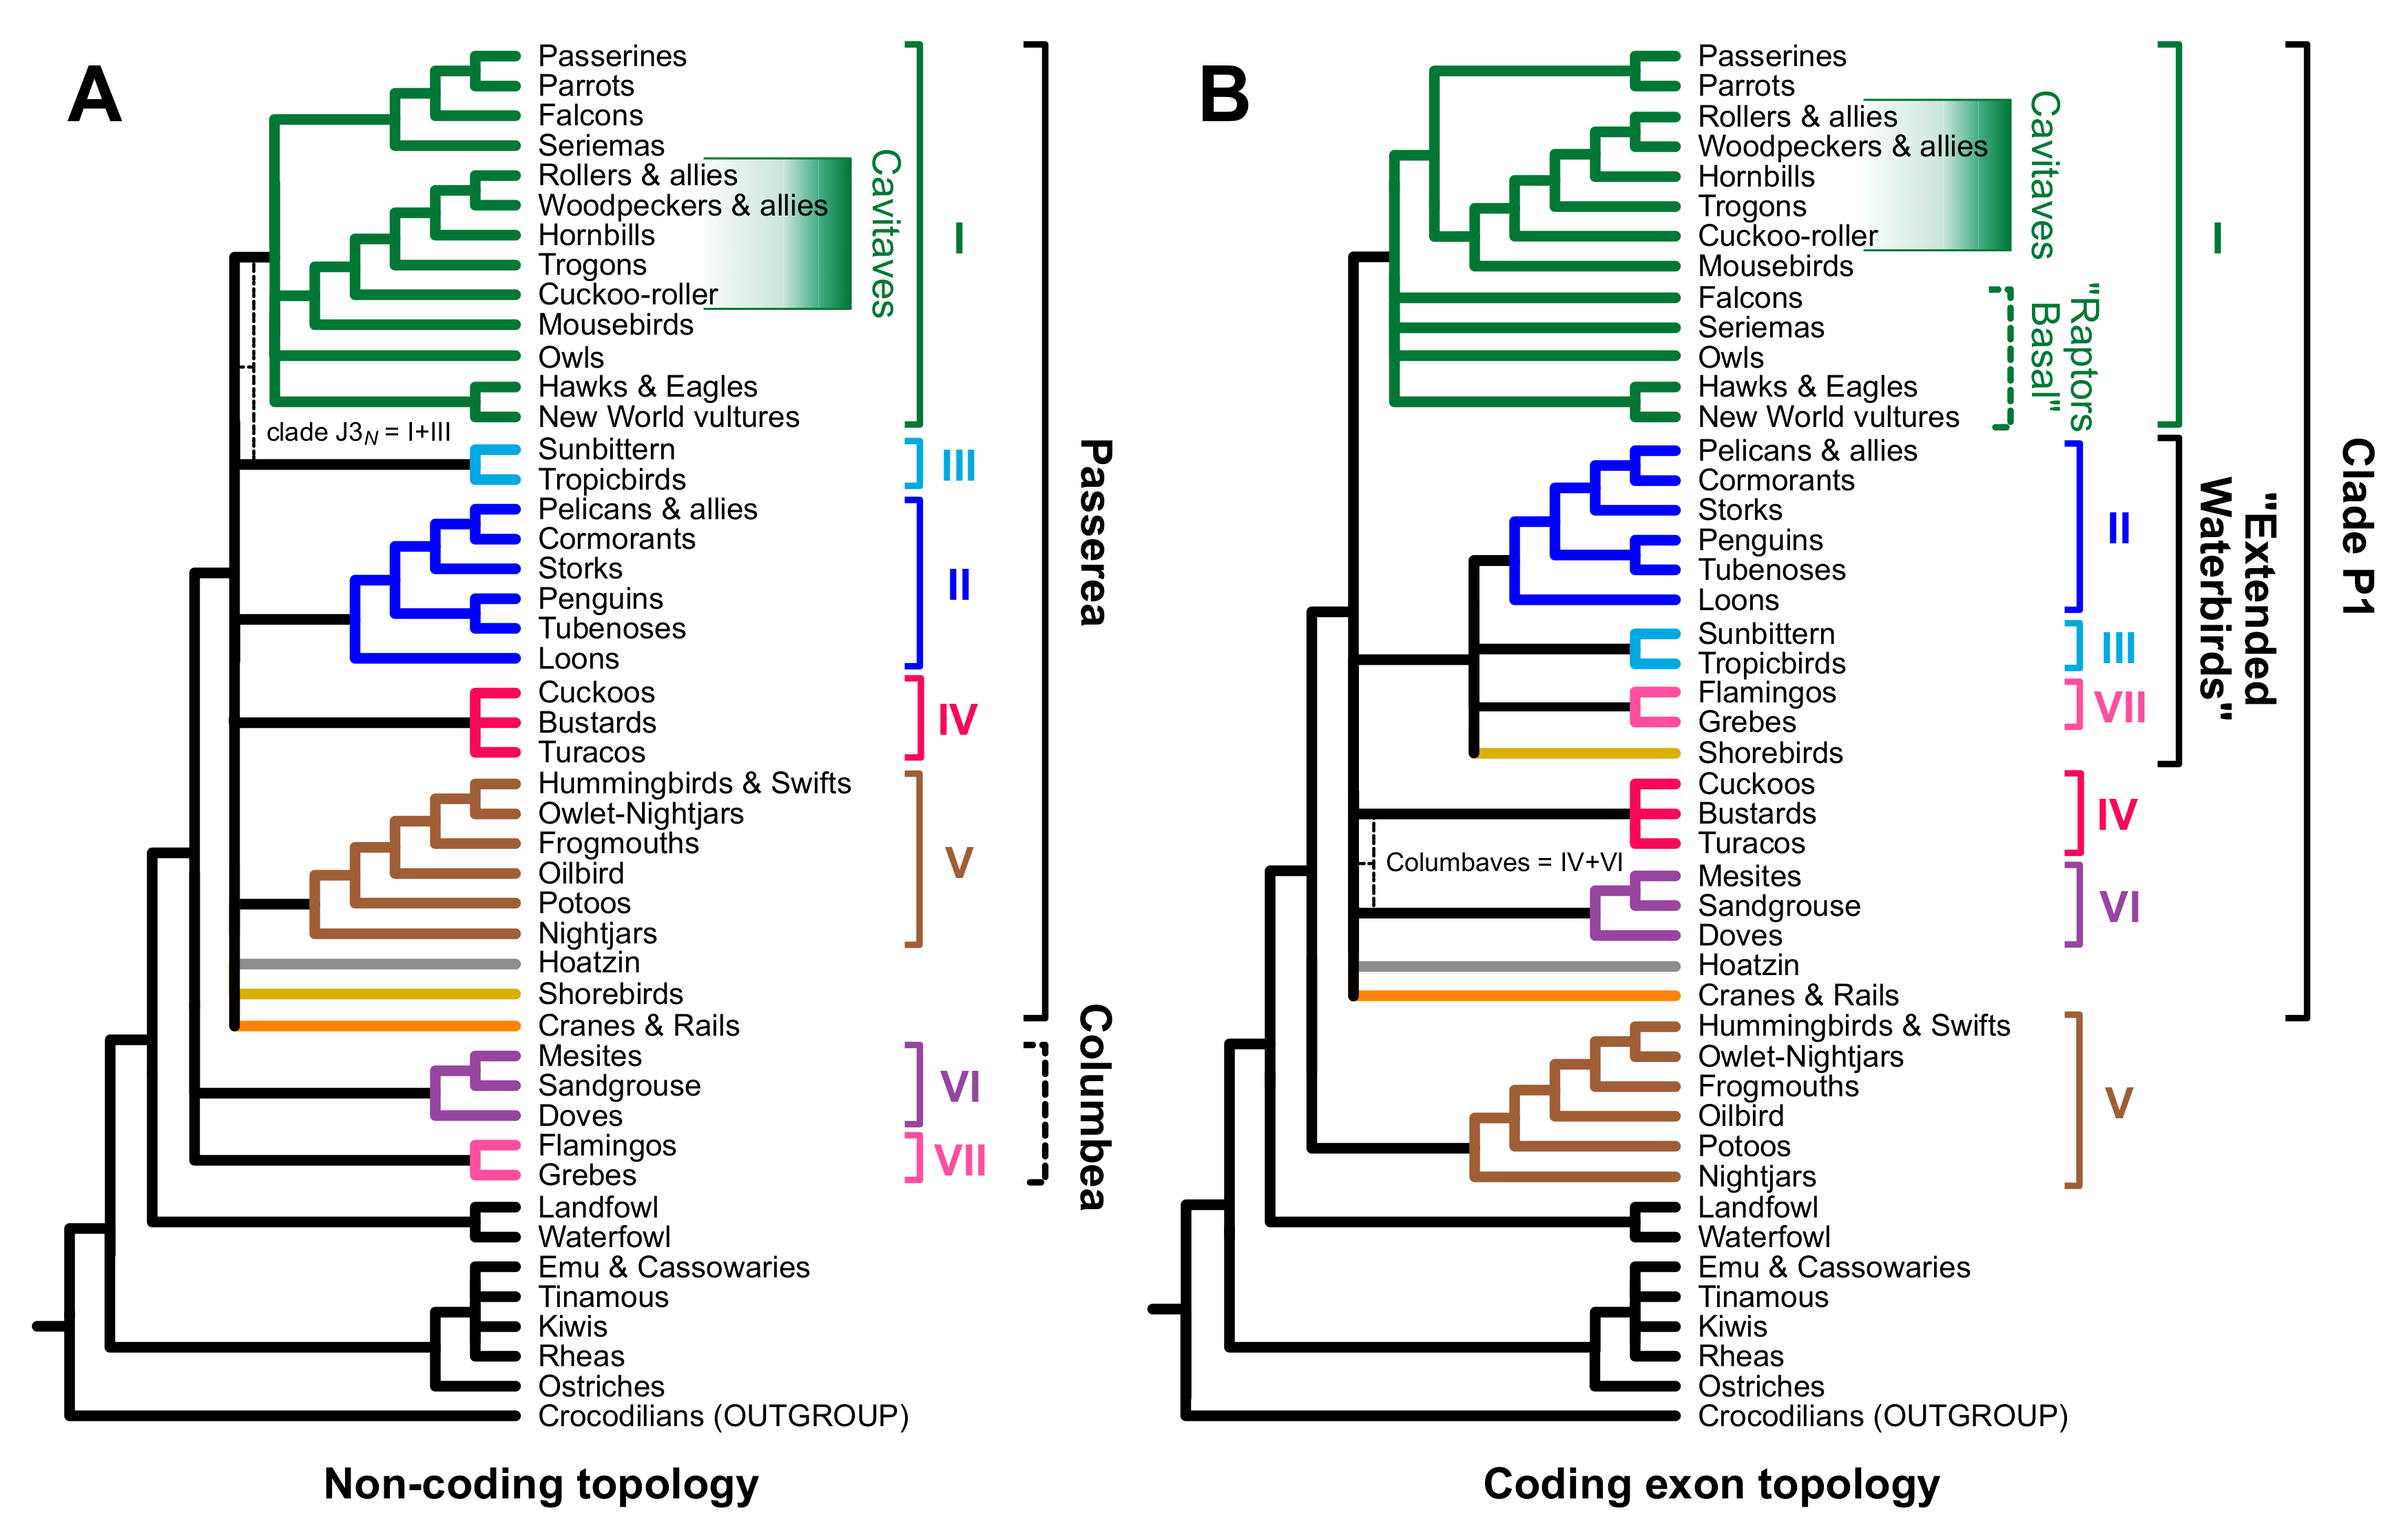
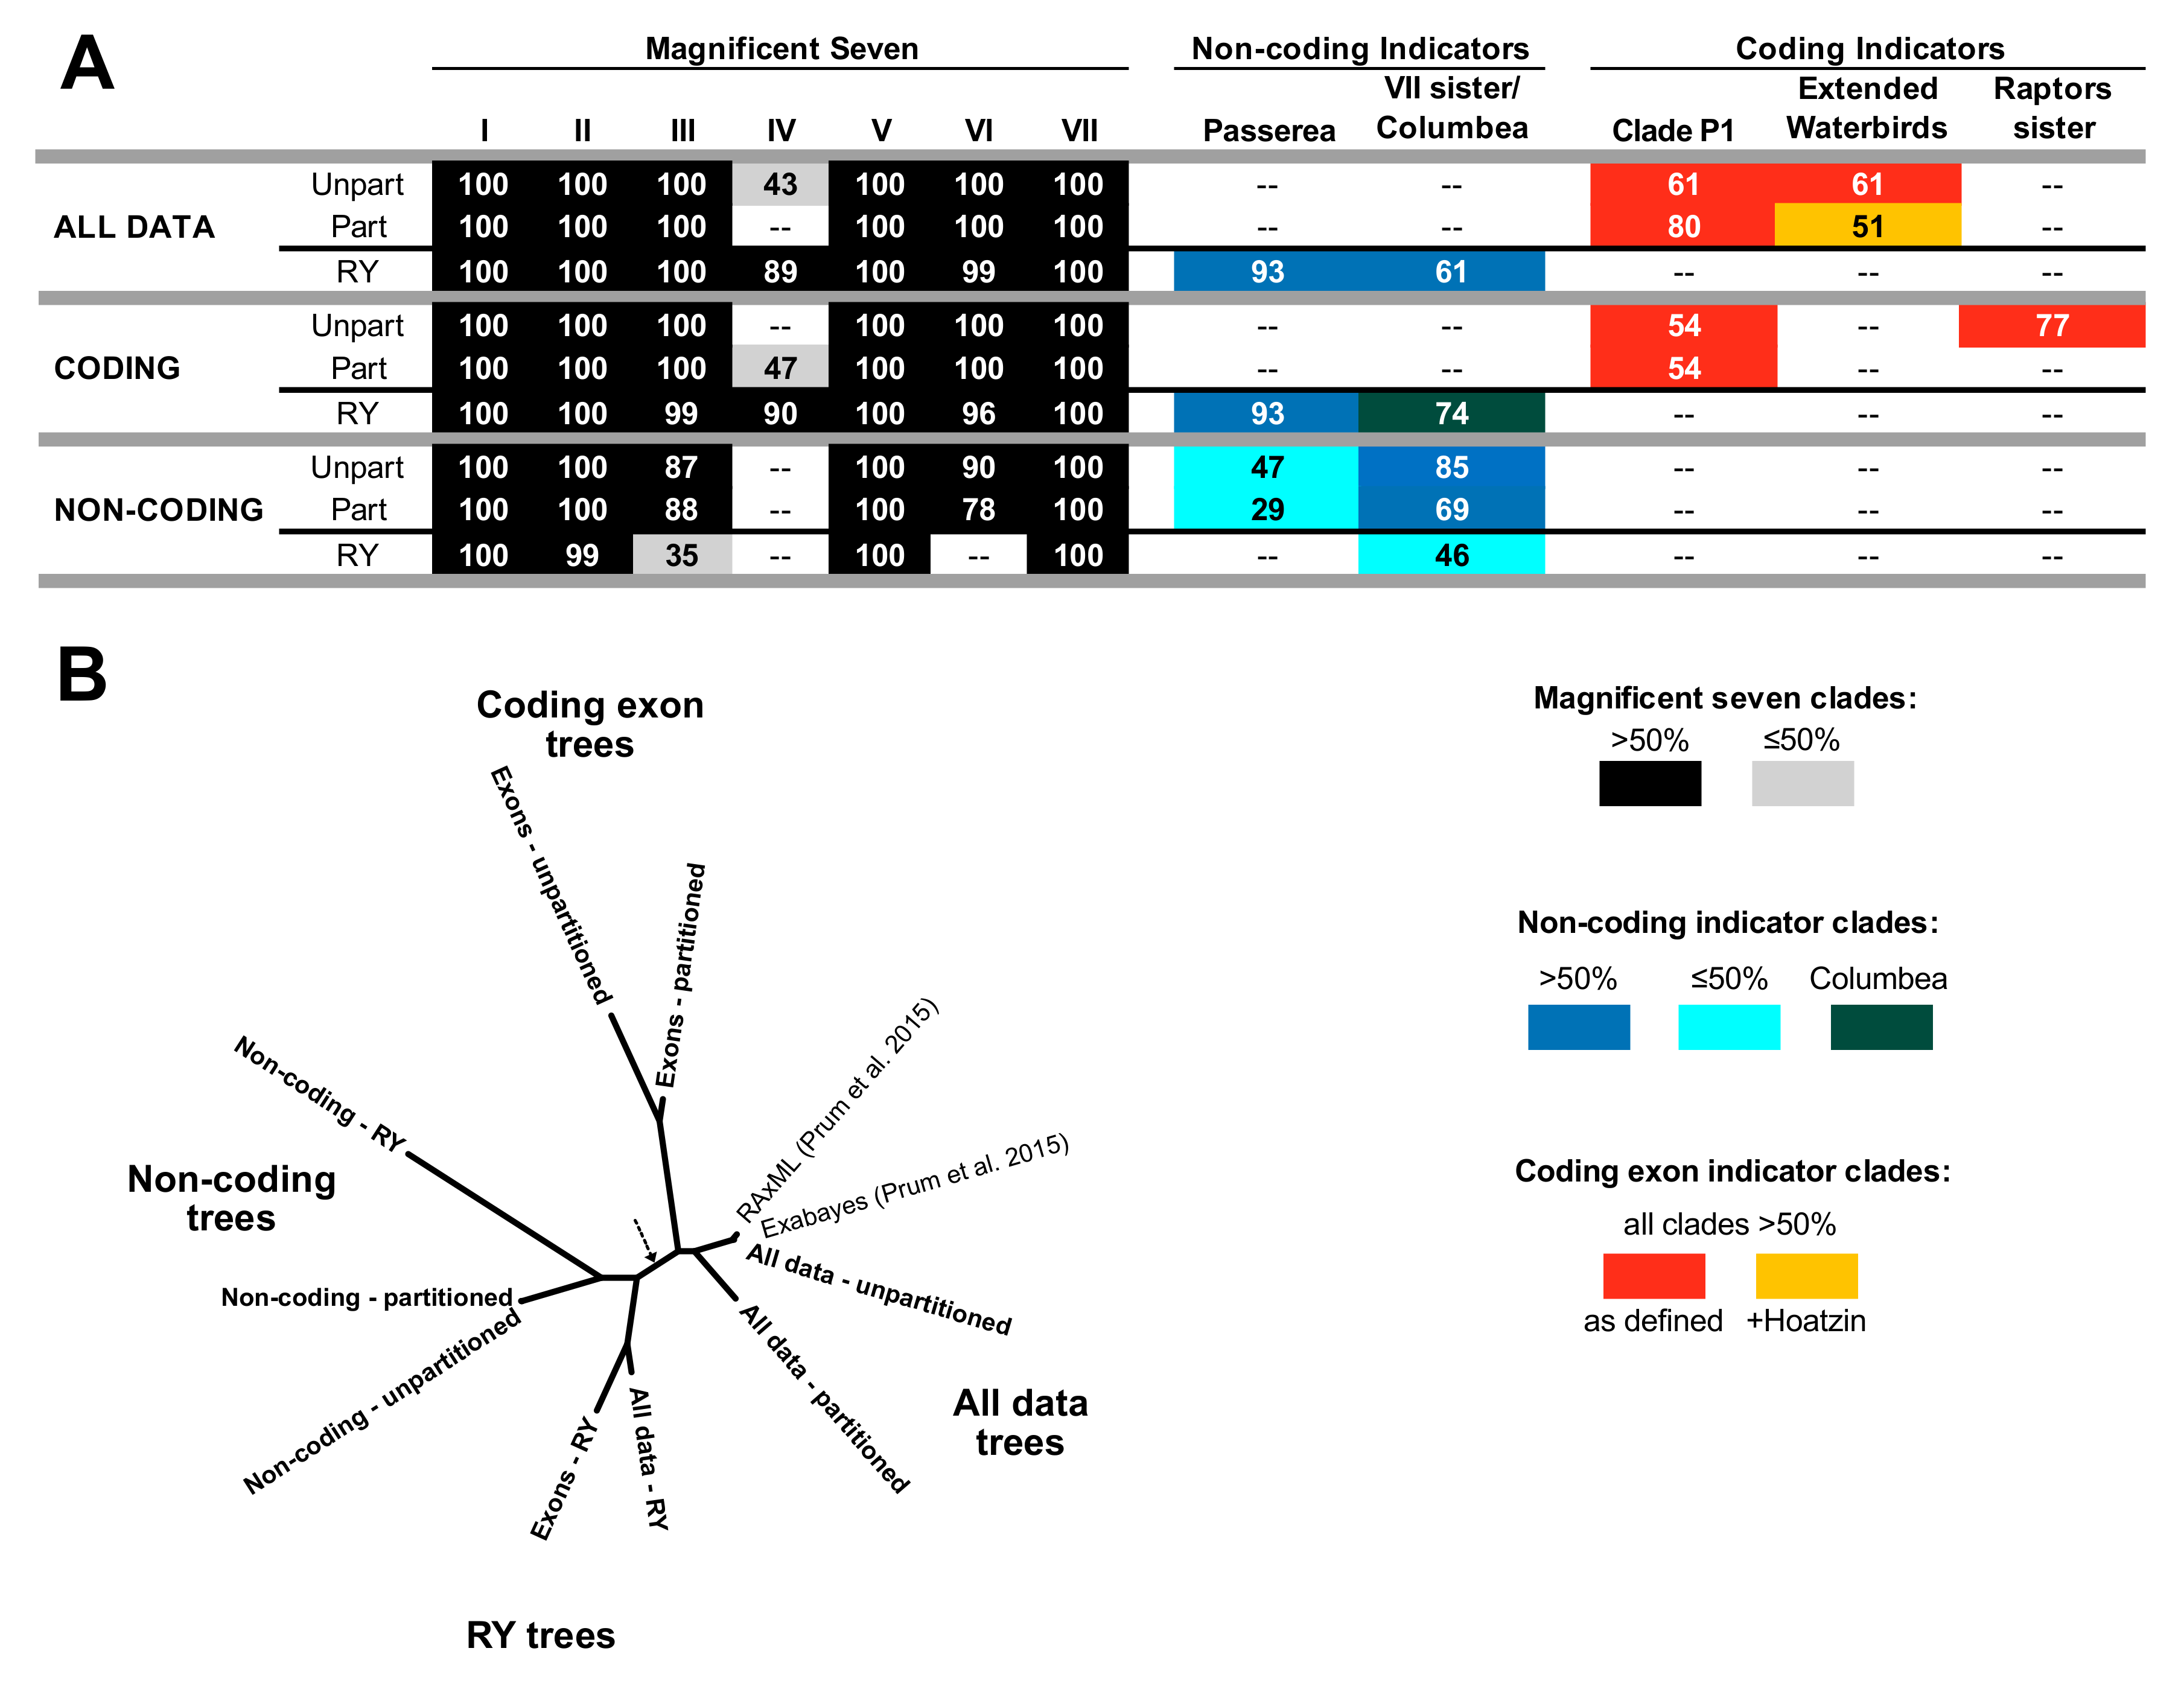
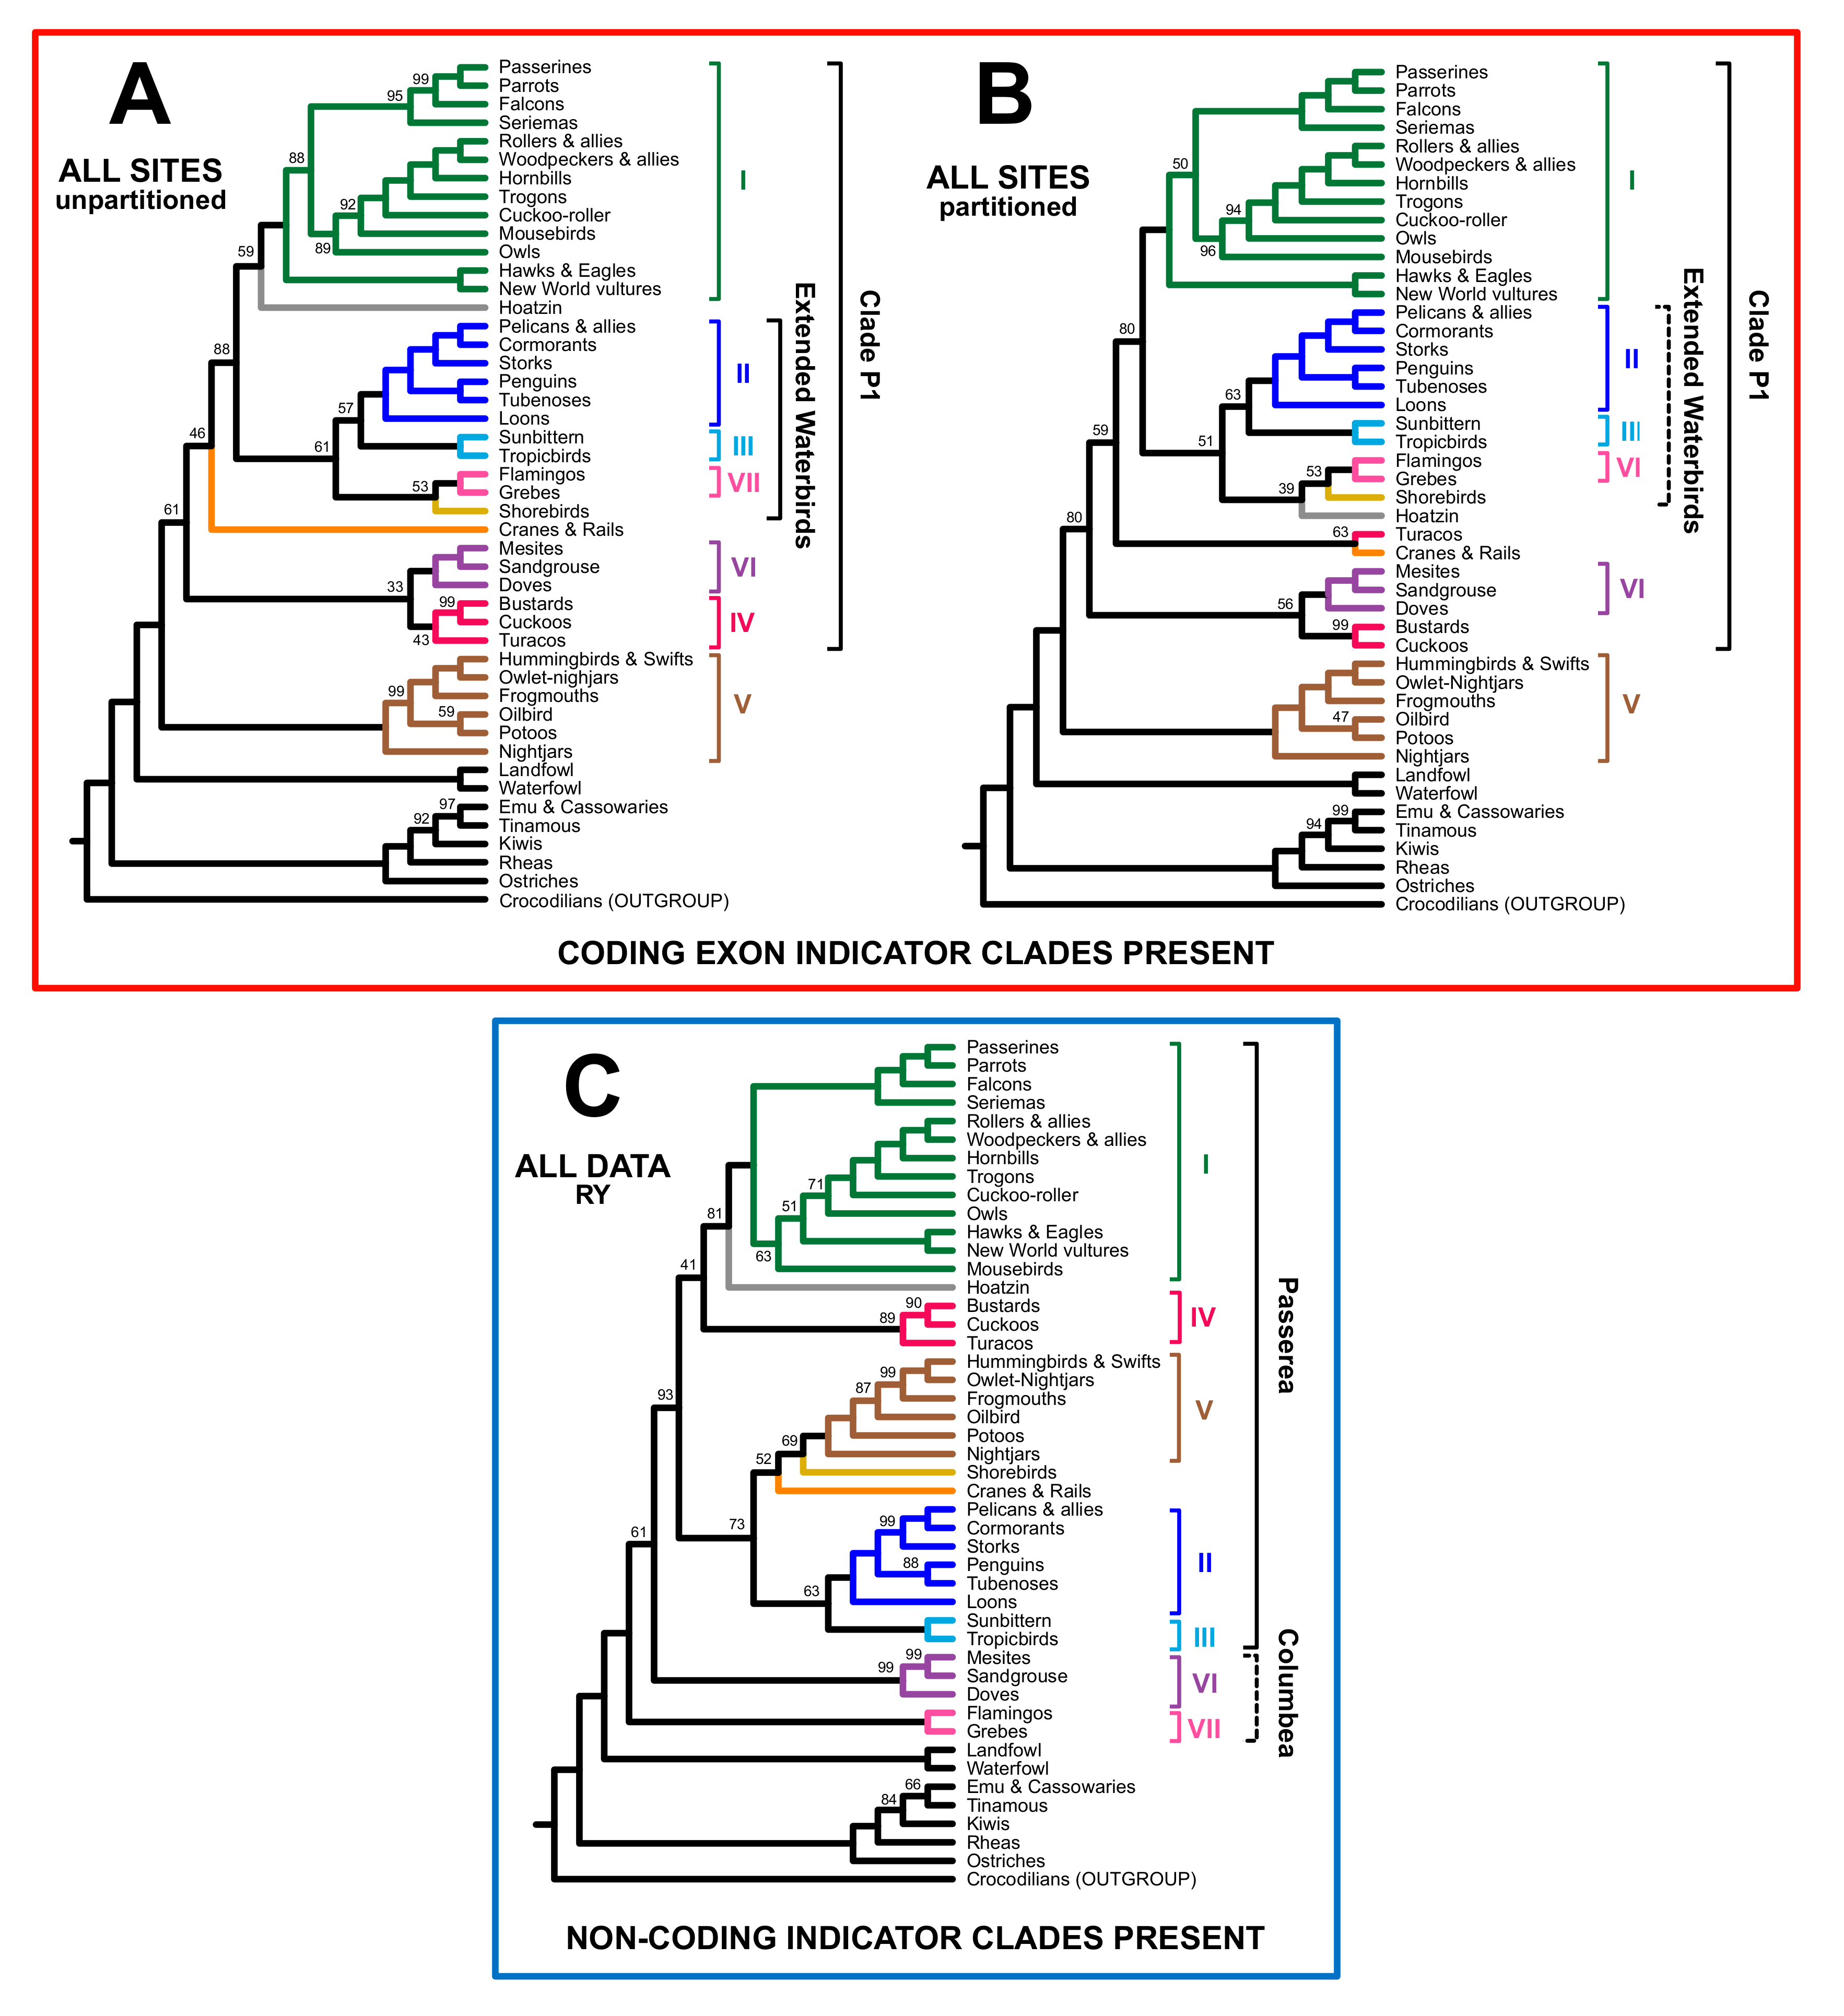
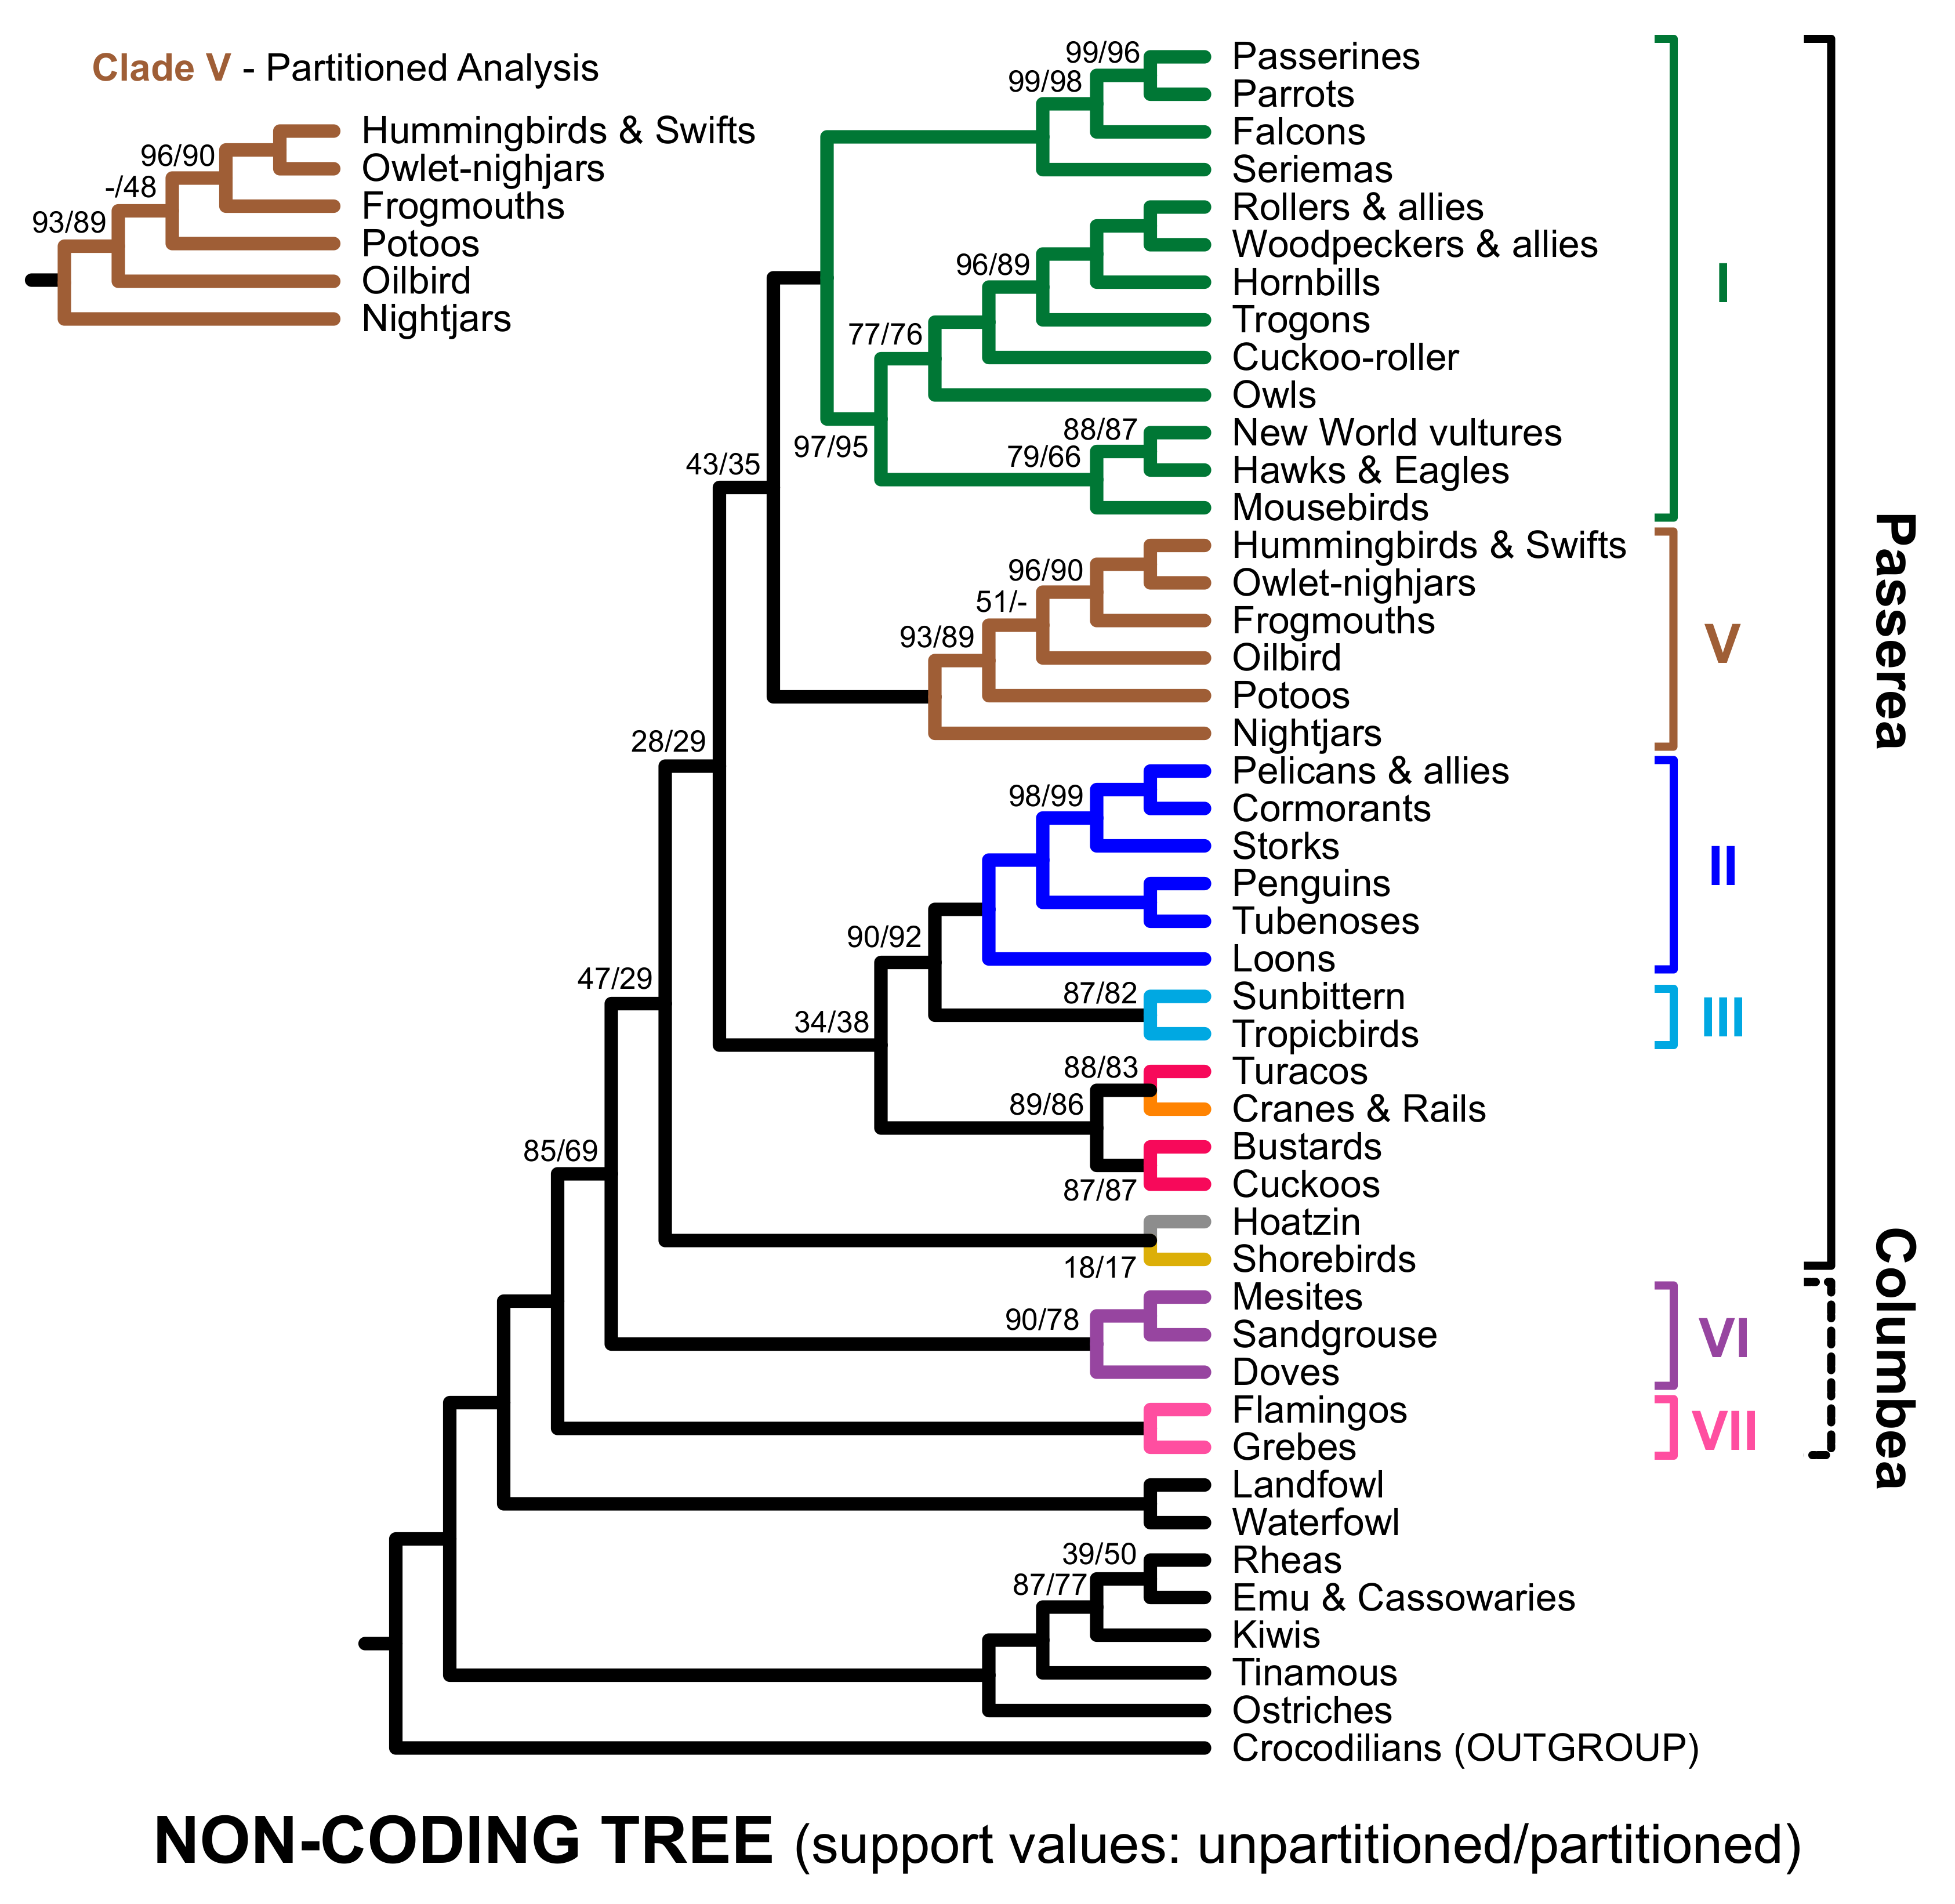
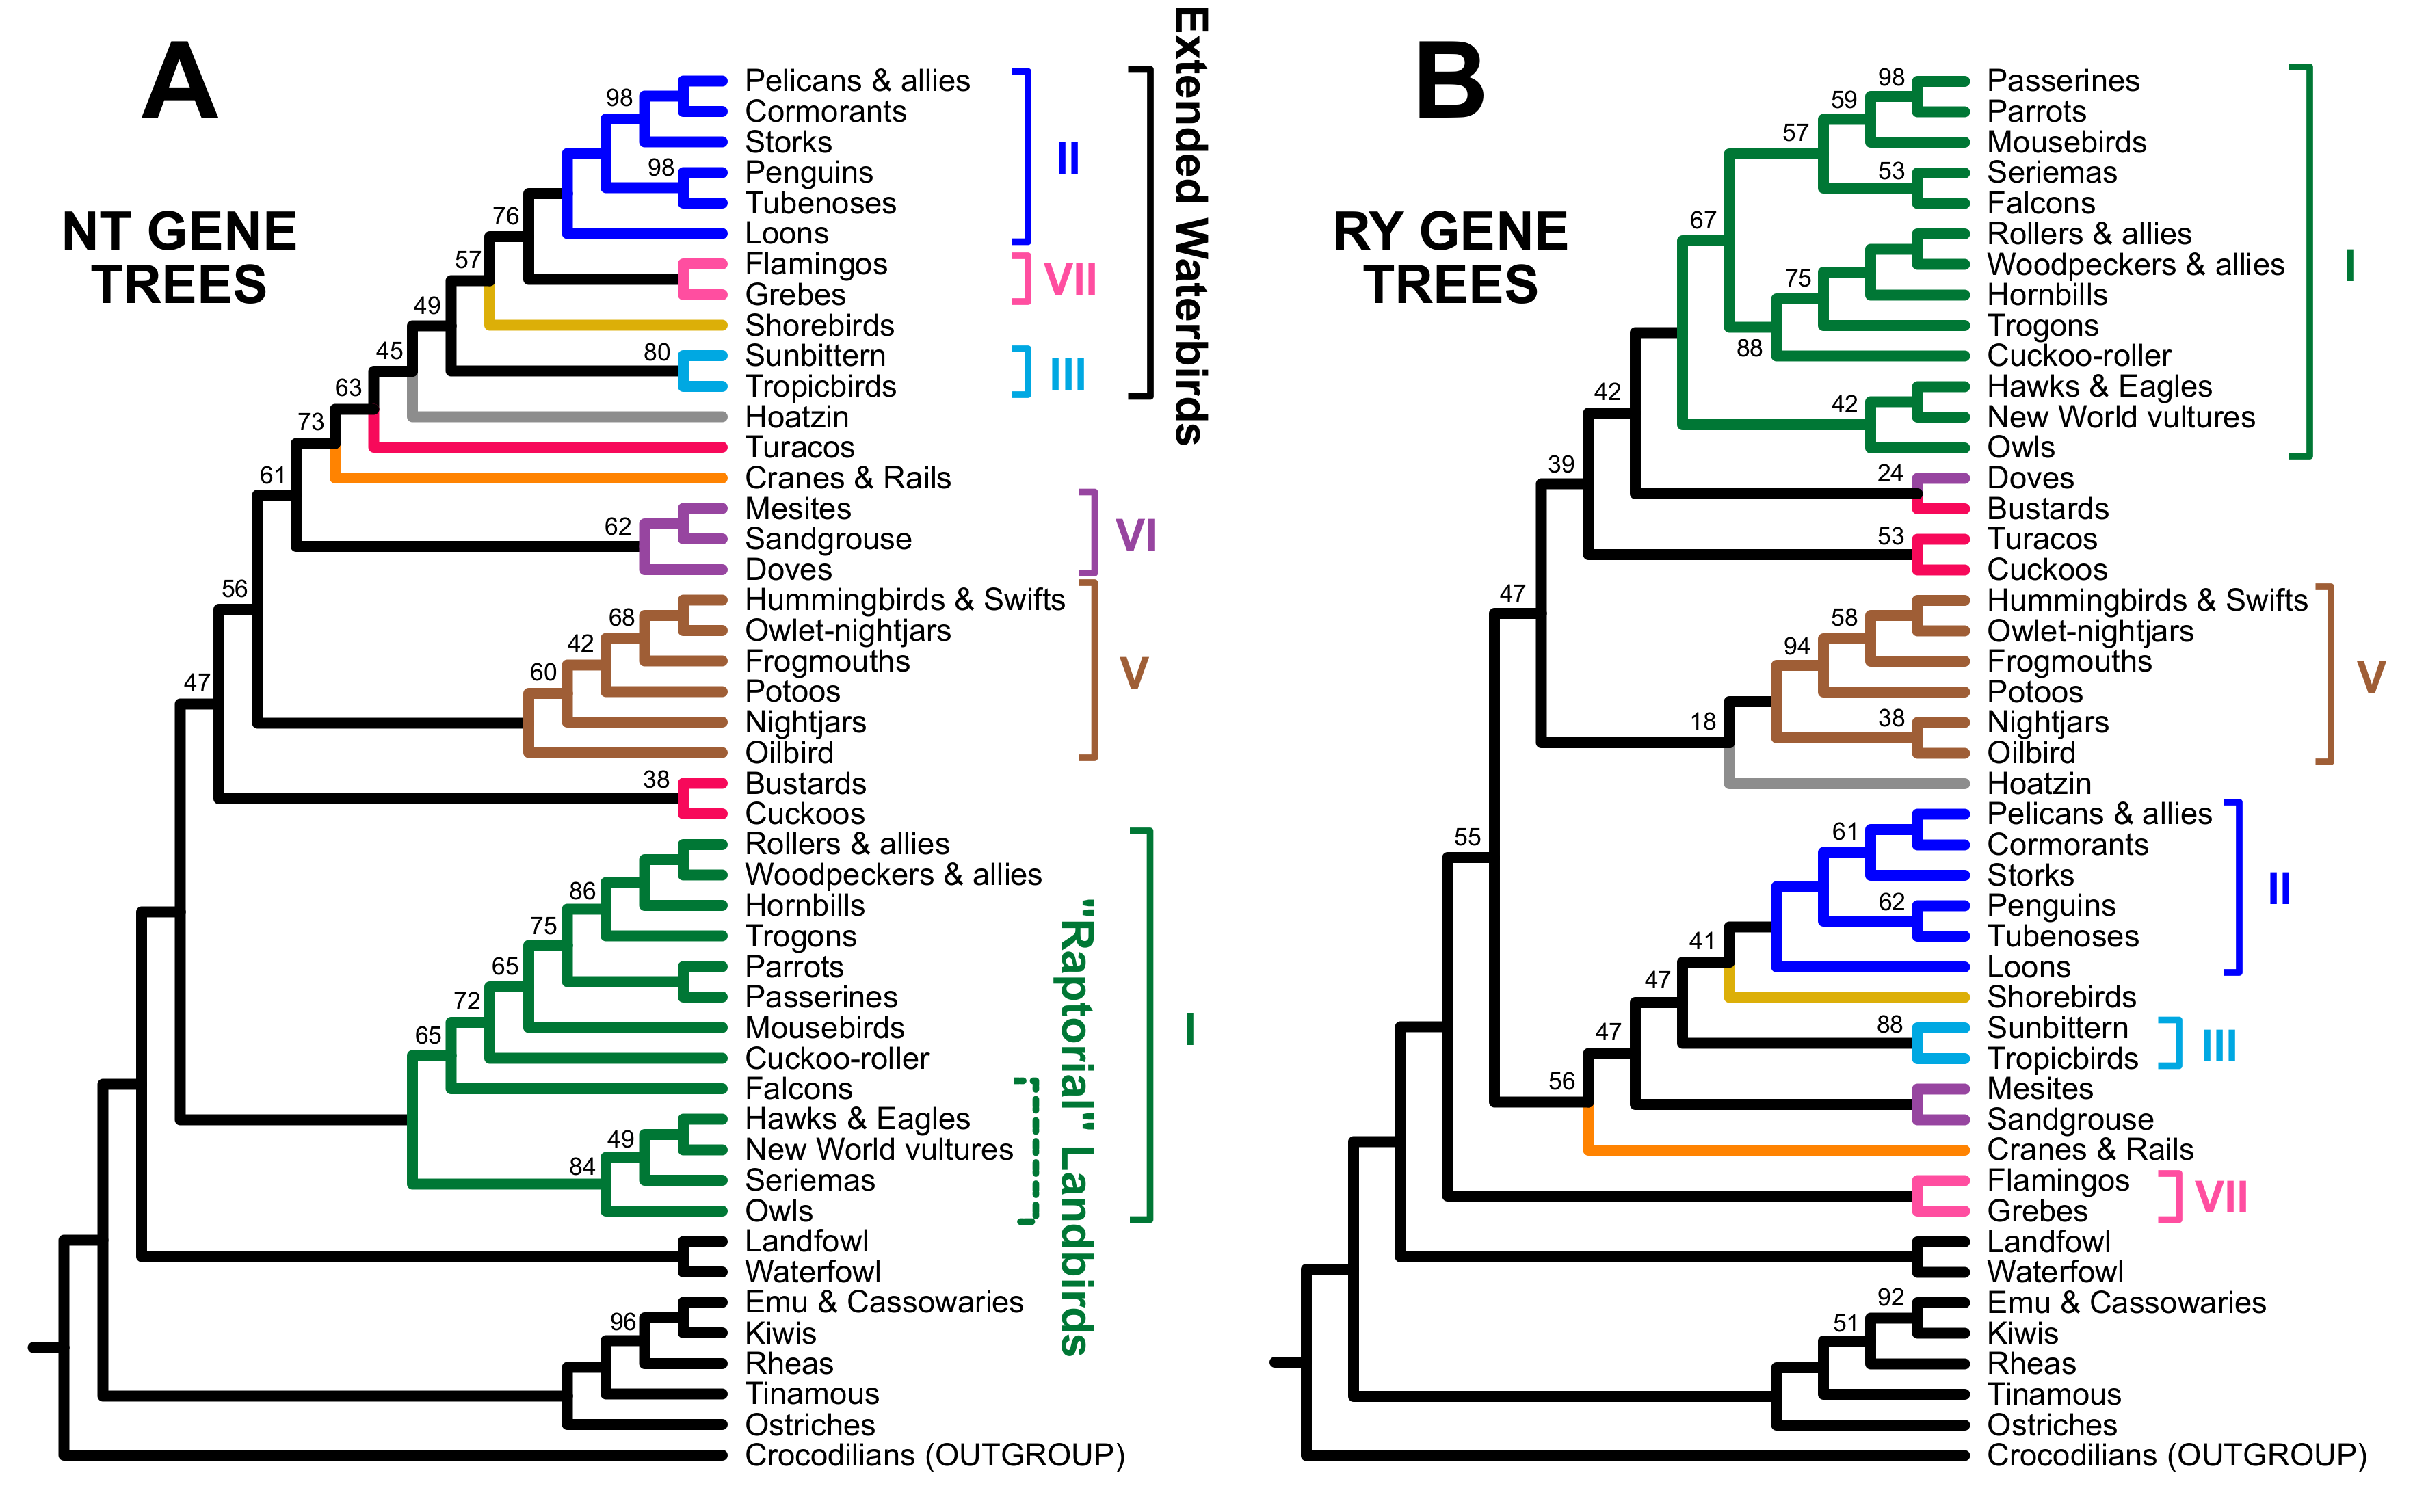
3.2. Different Data Types within the Prum Dataset Yield Distinct Topologies

To determine whether we could find evidence for data type effects within the Prum dataset, we analyzed three different concatenated matrices (all sites, coding exons, and non-coding data) using three analytical approaches (unpartitioned ML, partitioned ML, and ML analysis after RY coding). Five members of the magnificent seven were present in all trees, often with complete (100%) support (Figure 3A; see Figure 4 and Figure 5 and the complete trees showing all species in Supplementary File S3). Although the levels of support varied, the results for the coding and non-coding indicator clades were clear (Figure 3A). First, all trees based on the non-coding data included at least one, and usually both, non-coding indicator clades (Figure 3A). Second, trees based on nucleotide analyses of the complete dataset and the coding exon data always included one or more coding indicator clades (Figure 3A). Finally, RY analyses of the complete dataset and the coding exons yielded trees with non-coding indicator clades (Figure 3A). Clustering trees using topological distances (Figure 3B) revealed that the trees based on analyses of non-coding nucleotide sequence data clustered within the trees based on analyses conducted after RY coding. The all data and coding exon tree were placed on other side the midpoint root from the non-coding and RY trees. The basic structure of this “tree-of-trees” remained when the most poorly supported branches (those with ≤50% support) were collapsed to form polytomies, although the all data and coding exon RY trees were closer to the partitioned and unpartitioned non-coding trees (Supplementary Figure S1). This clustering analysis complements the examination of indicator clades since the tree-to-tree distances reflect all branches. Both of these analyses (presence/absence of indicator clades and tree clustering) yielded data consistent with our three predictions, corroborating the data type hypothesis for the base of Neoaves.
Although the overall pattern was clear, there was additional complexity in the tree topologies (Figure 4 and Figure 5). We expected coding exon indicator clades to be present in trees based on analyses of nucleotide sequences for all sites and for the coding exons alone; instead, only one indicator clade (clade P1, which comprises all Neoaves except clade V) was present in all four trees of the trees expected to exhibit a “coding-type” topology. The extended waterbird clade was only present in the unpartitioned analysis of all data (Figure 4A), although the partitioned analysis of all data placed Hoatzin in a larger clade that included all “extended waterbirds” (Figure 4B). We recovered the “raptors sister” topology (i.e., a clade of all non-raptorial landbirds nested within a paraphyletic assemblage of raptors) in the unpartitioned analysis of coding exons (Figure 4D). In contrast, all other analyses of nucleotide data for the complete dataset and the coding exons placed Accipitrimorphae (hawks, eagles, and vultures) sister to all other landbirds, placing owls and falcons elsewhere.
RY coding had a major impact on the analyses of all data and coding exons; after RY coding, both supported Passerea (Figure 3 and Figure 4C,F). However, these two trees differed in the sister group(s) of Passerea. RY analysis of all data placed clade VII sister to clade VI plus Passerea (Figure 4C) whereas RY analysis of coding exons yielded Columbea (the larger clade comprising both clades VI and VII; Figure 4F) as sister to Passerea.
All non-coding nucleotide trees placed clade VII (flamingos and grebes) sister to Clade VI plus Passerea (Figure 3 and Figure 5), like the RY analyses with the complete dataset (Figure 4C). None of the non-coding trees (Figure 5 and Additional file) recovered clade J3N, corroborating our decision to exclude that clade from the data type indicators. The RY non-coding tree differed from the other analyses of non-coding data in that it did not include Passerea (Figure 3). Instead, clade VII and doves were successive sister groups to the remaining Neoaves and a mesite + sandgrouse clade shifted to an alternative position sister to shorebirds (Additional file). We attribute this to the reduction in the number of informative sites associated with RY coding. Since the more limited variation in base composition for non-coding sites (Table 2) removes the compelling reason to conduct RY analyses of the non-coding data, we do not view that tree as particularly informative. Despite some complexities these results show that data type effects can be detected within the Prum dataset (i.e., the evidence for data type effects in the Reddy et al. [13] is not specific to the loci and taxa in that study).
Moving away from the indicator clades, all members of the magnificent seven except clade IV were recovered in our analyses (with the exception of the non-coding RY tree, which, as noted above, has a limited number of informative sites). Since the magnificent seven reflect a comparison of trees from Jarvis, Prum, and Reddy, their recovery is unsurprising for the analyses of all sites. The recovery of six members of the magnificent seven in analyses of both the coding and non-coding subsets of the Prum data emphasizes that those lineages are data type independent. Failure to recover clade IV almost always reflected shifts in the position of turacos; a bustard + cuckoo clade was present and strongly supported in almost all trees (the only exception is the RY non-coding tree; Additional file). Turacos were sister to gruiforms (cranes and rails) with relatively high (>80%) support in both analyses of non-coding nucleotide data (Figure 5); Reddy et al. [13] using a mostly non-coding dataset also placed turacos sister to gruiforms. On the other hand, clade IV actually did receive appreciable support in RY analyses of the all sites and coding exon datasets (Figure 4C,F). Taken as a whole, these results further corroborated six of the magnificent seven clades and raised questions about clade IV and its sensitivity to data type.
One question might be whether those clades that are sensitive to data types exhibit some similar characteristics, such as elevated (long branches) or slowed (short branches) rates of evolution that might help identify factors driving the differences. All analyses revealed substantial branch length heterogeneity (Figure 6 and Supplementary File S3). The aspect of the branch lengths most relevant to this discussion is the distance from the root of Neoaves to the tip for each taxon. All taxa had similar root-to-tip branch lengths regardless of data type for all data types. There were no clear patterns for the branch length heterogeneity of groups involved in the topological differences between coding and non-coding data (Figure 1). The possible exception to that statement might be the raptorial landbirds which are all characterized by shorter branches than the remaining landbirds. However, overall, the absence of patterns for other clades suggests rates of evolution cannot underlie the differences among data types.

3.3. RY Coding also Affects Species Tree Analyses

Prum et al. [12] also estimated avian phylogeny using several multispecies coalescent (“species tree”) methods, such as ASTRAL. Given the increased congruence between the non-coding trees and the trees estimated with RY coding, we compared the performance of ASTRAL with and without RY-coding before estimating gene trees. Both ASTRAL trees had limited support, but RY coding had a substantial impact on the ASTRAL tree topology (Figure 7). The ASTRAL tree based on gene trees estimated using nucleotide sequences (the “ASTRAL NT” tree) was especially unusual in that it placed core landbirds sister to all other Neoaves (Figure 7A), in contrast to all other analyses (including species tree analyses in prior studies [8,11,15,34]). The ASTRAL NT tree also included the extended waterbird clade and exhibited the “raptors sister” landbird topology. In contrast, the ASTRAL RY tree (Figure 7B) was more congruent with our non-coding analyses. In particular, it placed clade VII sister to all other Neoaves (which, beyond being a non-coding indicator clade, also renders the extended waterbird clade non-monophyletic). RY coding also had an impact on raptor topology, with falcons and seriemas shifting to a position closer to the parrots and passerines (as found in other studies that use large datasets [6,7,11,48]). However, the limited support evident in both ASTRAL trees in this study suggests that the number of loci in the Prum dataset is not sufficient to recover an accurate estimate of deep avian phylogeny. Thus, we did not subdivide each locus into coding and non-coding subsets (which would reduce the size of each locus as well as the number of loci). Nevertheless, this provides evidence that RY coding has an impact on species tree analyses similar to its impact on analyses of concatenated data.

4. Discussion

These analyses corroborated all three of the predictions that we made based on the data type hypothesis for neoavian phylogeny [13]. First, we predicted that analyses of the non-coding subset of the Prum dataset would yield trees with non-coding indicator clades. Second, we predicted that analyses of the coding subset of the Prum dataset would yield a tree with coding indicator clades. We believed it was likely that we would support this prediction given that the original Prum data matrix was mostly coding exons; as expected, the coding sequence indicator clade P1 was present in the coding exon trees estimated using nucleotide data. However, our prediction was further corroborated by the fact that unpartitioned analyses of coding data yielded a tree that was more congruent with the Jarvis et al. [11] exon trees (due to the placement of raptorial taxa) than in analyses of the complete dataset. On the other hand, neither analysis of the coding exon data recovered the extended waterbird clade, emphasizing the complexity of efforts to identify indicator clades. Finally, we predicted that analyzing coding data after re-coding nucleotides as purines (R) and pyrimidines (Y) would yield trees closer to the non-coding trees. Although we did not make an explicit prediction regarding the performance of multispecies coalescent methods, we also observed that the estimate of the avian species tree obtained by combining ASTRAL with RY-coding was more congruent with trees based on non-coding data. These results have important implications for the theory and practice of phylogenomics as well as for our understanding of deep avian phylogeny.

4.1. The Role of Data Types in Phylogenomic Analyses

For this study, we defined data type effects in a simple and empirical manner: data type effects are those cases where phylogenetic analyses of distinct subsets of the genome defined using non-phylogenetic criteria (e.g., structural or functional criteria) yield different results [1,13,24,49]. It is necessary to restrict consideration to data types dispersed across the genome so discordant histories for individual genes [50,51] do not obscure the data type dependence (if it exists). As long as the sample of loci is large enough and they are sampled from many genomic locations the expected set of discordant gene histories should be fairly similar for all data types. There might be some differences in the expected gene tree spectra due to Hill-Robertson effects [52] if the average strength of selection on each data type differs. However, those effects are unlikely to have an impact on this study because we analyzed tightly linked coding and non-coding regions. Almost all sequenced regions contained both coding and non-coding sequences (204 loci included both data types) and the median length of each sequenced region was 1634 bp (Supplementary File S1) and therefore likely have the same histories (or very similar histories if there is intralocus recombination). The tight linkage between coding and non-coding in the Prum dataset makes this study an excellent complement to Reddy et al. [13], which compared trees estimated using unlinked coding and non-coding data. When the evidence for data type effects in this study is combined with the results of Reddy et al. [13] and Jarvis et al. [11], they provide strong evidence that the important variable is the data types and not any idiosyncratic features of specific genomic regions in each study or different gene histories.
Data type effects have been described in a number of studies, though the nature of the effects range from those that are quite subtle [49,53] to much stronger effects [11,13,18,19,20,21,22,23]. Some reported examples of data type effects reflect analyses of the same coding regions as nucleotides and after translation to amino acids [18,54,55,56]. Although those studied can be viewed as data type effects we believe that data type effects involving analysis of sequences that represent distinct sources of genomic information, such as coding vs. non-coding data [13,19], or sites in different protein structural environments [24] represent a more compelling case. One thing that makes the case for birds being unusual is the evidence for relatively consistent data type effects across multiple studies that use datasets with little or no overlap in the exact dataset (in addition to this study, data type effects are evident Jarvis et al. [11] and Reddy et al. [13]). Understanding whether a putative data type effect is truly genome-wide (as with birds) or simply an idiosyncratic feature of a specific dataset and taxon sample will be very important in future studies.
The central role of models should be obvious from our results; analyses of the coding exons in the Prum dataset after RY coding resulted in trees that were much more congruent with analyses of the non-coding subset of the Prum data using “standard” models of nucleotide evolution (by standard models we mean the GTR+I+Γ model and its sub-models). Other empirical analyses have shown that RY coding can improve the behavior of phylogenetic analyses judged by congruence with other lines of evidence [18,57,58,59], and the improved behavior of analyses conducted after RY coding is thought to reflect the amelioration of biases due to variation in base composition [33]. Given the observed variation along the SW axis for the coding data, it is likely that RY coding ameliorated base composition differences that violated the evolutionary models used in our analyses as well. However, the use of RY coding also has costs: it reduces the number of character states from four to two and makes many informative sites invariant—collectively this leads to datasets that have greatly reduced power for phylogenetic estimation. Recoding data can lead to positively misleading signals under some circumstances [60] and some unique characteristics of our RY trees might reflect that positively misleading signal. However, the observation that the non-coding trees and the RY trees for all data and coding exons are more congruent than the non-coding trees and the nucleotide trees for all data and coding exons (Figure 3B and Supplementary Figure S1) is not consistent with the hypothesis that analyses of RY data are biased. Models of evolution that can accommodate variation in base composition have been developed [61,62], but they are not practical for analyses of large datasets. Practical methods to analyze large datasets using models of nucleotide evolution that accommodate variation in base composition will be critical to establish the nature of the data type effects we observed and to further resolve the avian tree of life. Regardless, the analyses reported herein documented the existence of data type effects, and further suggested that those may be driven, at least in part, by variation among taxa in the base composition of coding exons.
Partitioning, which is known to improve model fit by assigning distinct models for different subsets of the data [63,64], also affected our results. For analyses of the coding data, the partitioned topology only had one coding indicator clade. The impact of partitioning is especially clear in Figure 3B, where the distance between the partitioned and unpartitioned trees estimated using either coding data or all data is relatively large but the distance between the partitioned and unpartitioned trees for non-coding data is very small. It is unclear whether this is primarily due to better modeling of the compositional heterogeneity of the coding data (Table 1) or other aspects of the coding data. However, we also found that, in general, support values in the partitioned analyses of non-coding data were lower than for the unpartitioned topology. It seems reasonable to postulate that partitioning may be especially important for highly heterogeneous datasets (like coding data) but it is not especially advantageous for more homogeneous datasets (like non-coding data).
Efforts to improve models should also incorporate the multispecies coalescent. In this study we found that RY coding had a major impact on ASTRAL analyses. However, we felt that it was impractical to subdivide loci before generating gene trees to conduct a direct test because the reduced number of nucleotides after loci were split would inflate gene tree estimation error [65,66,67]. Likewise, the reduced number of informative sites per locus after RY coding could also inflate gene tree estimation error. In that sense it is perhaps surprising that any effect of RY coding was evident in our ASTRAL analyses. The increased congruence between the ASTRAL RY tree and the coding RY trees (Figure 4C,F) and the non-coding trees (Figure 5) probably reflects the amelioration of bias; gene tree estimation error combined with the use of only 259 loci probably explains the limited support in the ASTRAL trees. Further exploration of this question will probably require the use of methods to ameliorate bias that do not eliminate as much phylogenetic information as RY coding combined with the use of a larger number of loci.

4.2. Implications for Avian Phylogeny

The magnificent seven clades were defined based on comparisons of the Jarvis, Prum, and Reddy trees, so it is unsurprising that reanalyses of the complete Prum dataset also recovered most of these clades, and that they were robust to data type and model selection (e.g., unpartitioned, partitioned, or RY coding). We view the observation that support for Passerea, a non-coding indicator clade, emerged in analyses of the complete Prum dataset and in analyses of the Prum coding data after RY coding as further evidence that Passerea is likely present in the true avian species tree. However, the inconsistent relationships for clades VI and VII in this study and prior studies raise questions about monophyly of Columbea. Columbea emerged in the Jarvis “TENT” topology (the primary tree in Jarvis et al. [11]) and the Jarvis intron trees as well as the Reddy et al. [13] and Houde et al. [15] trees. However, the Jarvis UCE tree and the Kuhl et al. [16] tree both placed clade VII sister to all other Neoaves; indeed, the Jarvis UCE tree placed clades VI and VII as successive sister groups of Passerea just like the all sites RY tree (Figure 4C) and the non-coding trees (Figure 5) in this study. Thus, we view six of the magnificent seven to be strongly corroborated. When combined with the evidence for Passerea, a relatively resolved topology for Neoaves is apparent (Figure 8A), even if the relationship between clades VI and VII remains to be resolved.
The absence of clade IV in some analyses may reflect the underlying evolutionary history. Although clade IV is present in some trees generated by analyses of large datasets [11,12,15], other large-scale studies [13,16,32] have failed to recover clade IV. There are two explanations for the conflict regarding the recovery of clade IV. First, the size of the datasets used to examine the early evolution of Neoaves might be insufficient support or refute monophyly for the putative members of clade IV. This may seem surprising given the use of whole genome datasets to resolve avian phylogeny [11], but asserting that the monophyly of clade IV is undecidable using the available data (and methods) is actually no different from asserting that relationships among the magnificent seven and the orphan orders cannot be decided. Second, conflicts among studies could reflect bias, such as long-branch attraction or some other positively misleading signal. The strongest support for clade IV emerges in Jarvis et al. [11] and Houde et al. [15], which used a small taxon sample and might therefore be more susceptible to bias. Indeed, the clade comprising turacos + Gruiformes found in analyses of the Prum non-coding data (Figure 5) is congruent with the Reddy et al. [13] tree; since the datasets used to estimate those trees are largely (or completely) non-coding and they both have extensive taxon sampling, it is tempting to assert that clade IV could reflect bias (perhaps even a data type bias). Overall, we feel that the results of this study have weakened the case for clade IV (though cuckoos and bustards consistently formed a clade) and we therefore collapse it to form a “soft” polytomy (i.e., a statement of uncertainty) in our summary tree (Figure 8A).
Abandoning the assumption of a strictly bifurcating topology provides a third explanation for the conflicts regarding the recovery of clade IV: ancient gene flow involving the early stem lineages of one or more putative members of clade IV and other lineages. Perhaps the turacos + Gruiformes clade recovered in analyses of the Prum non-coding data (Figure 5) and in Reddy et al. [13] simply reflects gene flow between those lineages. Likewise, the fact that a doves + cuckoos clade recovered in analyses of coding data [11], UTRs [16], and transposable element insertions [32] could reflect gene flow involving those lineages. The hypothesis that ancient gene flow among neoavian stem lineages has an impact phylogenetic estimation could also explain the observation that clades IV and VI exhibit higher indel discordance than expected given the length of the branches uniting those clades [69]. Houde et al. [69] interpreted the apparent elevation of indel discordance reflected incomplete lineage sorting and hypothesized that a transient increase in the effective population size led to a period of increased incomplete lineage sorting. However, introgression would also lead to elevated indel discordance. Gene flow among the early stem lineages of turacos, gruiforms, doves, and cuckoos is plausible given the very short branches at the base of Neoaves in timetrees [11,12,70,71,72]. Perhaps the conflicts evident for clade IV in this and other large-scale studies of avian phylogeny (and the conflicts evident for clade VI in other studies) represent the recovery of signals due to different histories that cannot be explained using the multispecies coalescent alone.
The other part of the bird tree where these analyses provide insights is the base of the core landbirds. The hypothesis that most raptorial landbirds form a paraphyletic assemblage at the base of core landbirds (e.g., the 1st and 2nd codon position exon tree from Jarvis et al. [11] and Figure 3B from this study) can probably be rejected. Instead, the majority of recent analyses [6,8,11,13,16] favor a topology that divides raptors (and core landbirds overall) into two major clades (Australaves and Afroaves [26,68]), each of which has two raptorial lineages at their base (Figure 8B). However, two alternatives to the Australaves/Afroaves topology have also emerged in analyses of large datasets. One splits raptors into four independent lineages, placing hawks, eagles, and New World vultures sister to the remaining core landbirds (Figure 8C); this topology was found in our analyses of the complete Prum dataset and in the partitioned analysis of coding data (as well as the multispecies coalescent tree in Kimball et al. [8] and the original Prum et al. [12] analyses). The third possibility divides raptors into three major clades, a “core” raptorial clade at the base of landbirds and separate lineages for seriemas and falcons within Australaves (Figure 8D). The third topology only emerged in our ASTRAL RY tree (Figure 7B), albeit with limited support. It is also evident (and strongly supported) in species tree analyses of non-coding data and combined coding and non-coding data in other studies [11,15,34]. However, there is still much to learn regarding the impact of the multispecies coalescent on phylogenetic analyses (reviewed by [73]), so it seems inappropriate to reject any of these three hypotheses at this time. Additionally, the position of mousebirds is also unclear [7,9,17,74]. Thus, at this point, the topology of some of the deepest branches within core landbirds is one of the major uncertainties remaining in deep avian phylogeny, although we stress that it is clear that the community has made major strides toward resolving many relationships within Neoaves.

5. Conclusions

We believe that these new analyses of the Prum dataset provide answers to the two fundamental questions posed by Pittman et al. [25]. First, the sister group of the remaining Neoaves is likely to be either clade VII (flamingos and grebes) or clades VI and VII (flamingos, grebes, doves, mesites, and sandgrouse). Regardless of the exact position of the root of Neoaves, our results corroborate monophyly of Passerea [11], the clade comprising all Neoaves except the members of clades VI and VII. Second, a clade comprising the majority of aquatic orders is unlikely to exist. Moving beyond those two specific questions, we corroborated six of the “magnificent seven” superordinal lineages proposed by Reddy et al. [13] but raised questions about the seventh (clade IV). The fact that clade IV is recovered in some large-scale phylogenetic studies but not in others could reflect currently unappreciated analytical biases or it might reflect ancient gene flow. Future studies should explore these areas of uncertainties, as well as relationships among major groupings within the core landbirds (clade I). More broadly, the possibility that introgression has had an impact on the early evolution of major groups, like Neoaves, should receive more attention. Regardless of whether one considers bifurcating trees or networks, we believe that understanding the behavior of analyses when they are applied to different data types will be critical for efforts to examine rapid radiations deep in evolutionary time. In that context, we expect expanded data collection, especially whole genome sequencing [75,76], to play a central role in efforts to resolve the tree of life by providing more data and by expanding the types of data that can be analyzed (e.g., by providing more intergenic data and possibly by providing additional ways to subdivide the data). However, improved models of sequence evolution are likely to be the most critical ingredient for efforts to improve phylogenomic analyses; the simple approach of RY coding would ideally be replaced by much more “biologically realistic” models, assuming those analyses can be implemented in a computationally efficient manner. Only then will a truly convincing phylogeny of birds (and other groups in the tree of life) emerge.

Supplementary Materials

The following are available online at https://www.mdpi.com/2673-6004/2/1/1/s1, File S1: Locus length and Base Composition, File S2: Sequence alignments, File S3: Nexus treefile, Figure S1: “Tree-of-trees” based on clustering distances among phylogenies with poorly supported branches collapsed.

Author Contributions

Conceptualization, E.L.B. and R.T.K.; methodology, E.L.B. and R.T.K.; software, E.L.B.; formal analysis, E.L.B. and R.T.K.; investigation, E.L.B. and R.T.K.; data curation, E.L.B.; writing—original draft preparation, E.L.B.; writing—review and editing, E.L.B. and R.T.K.; visualization, E.L.B.; project administration, R.T.K.; funding acquisition, E.L.B. and R.T.K. All authors have read and agreed to the published version of the manuscript.

Funding

This research was funded by the US National Science Foundation, grant number DEB-1655683 to R.T.K. and E.L.B.

Institutional Review Board Statement

Not applicable.

Informed Consent Statement

Not applicable.

Acknowledgments

We thank the Kimball-Braun lab and anonymous reviewers for helpful suggestions on earlier versions of this manuscript. Marisa Guido and Eliot Gunn assisted in the annotation of loci.

Conflicts of Interest

The authors declare no conflict of interest. The funders had no role in the design of the study; in the collection, analyses, or interpretation of data; in the writing of the manuscript, and in the decision to publish the results.

References

  1. Braun, E.L.; Cracraft, J.; Houde, P. Resolving the avian tree of life from top to bottom: The promise and potential boundaries of the phylogenomic era. In Avian Genomics in Ecology and Evolution: From the Lab into the Wild; Kraus, R.H.S., Ed.; Springer International Publishing: Cham, Switzerland, 2019; pp. 151–210. ISBN 978-3-030-16476-8. [Google Scholar]
  2. Groth, J.G.; Barrowclough, G.F. Basal divergences in birds and the phylogenetic utility of the nuclear RAG-1 gene. Mol. Phylogenet. Evol. 1999, 12, 115–123. [Google Scholar] [CrossRef] [PubMed]
  3. Cracraft, J.; Barker, F.K.; Braun, M.; Harshman, J.; Dyke, G.J.; Feinstein, J.; Stanley, S.; Cibois, A.; Schikler, P.; Beresford, P.; et al. Phylogenetic relationships among modern birds (Neornithes): Toward an avian tree of life. In Assembling the Tree of Life; Cracraft, J., Dononghue, M.J., Eds.; Oxford University Press: Oxford, UK, 2004; pp. 468–489. [Google Scholar]
  4. Ericson, P.G.P.; Anderson, C.L.; Britton, T.; Elzanowski, A.; Johansson, U.S.; Källersjö, M.; Ohlson, J.I.; Parsons, T.J.; Zuccon, D.; Mayr, G. Diversification of Neoaves: Integration of molecular sequence data and fossils. Biol. Lett. 2006, 2, 543–547. [Google Scholar] [CrossRef] [PubMed]
  5. Field, D.J.; Berv, J.S.; Hsiang, A.Y.; Lanfear, R.; Landis, M.J.; Dornburg, A. Timing the extant avian radiation: The rise of modern birds, and the importance of modeling molecular rate variation. In Pennaraptoran Theropod Dinosaurs: Past Progress and New Frontiers; Pittman, M., Xu, X., Eds.; Bulletin of the American Museum of Natural History 440: New York, NY, USA, 2020; pp. 159–181. [Google Scholar]
  6. Hackett, S.J.; Kimball, R.T.; Reddy, S.; Bowie, R.C.K.; Braun, E.L.; Braun, M.J.; Chojnowski, J.L.; Cox, W.A.; Han, K.-L.; Harshman, J.; et al. A phylogenomic study of birds reveals their evolutionary history. Science 2008, 320, 1763–1768. [Google Scholar] [CrossRef]
  7. Wang, N.; Braun, E.L.; Kimball, R.T. Testing hypotheses about the sister group of the Passeriformes using an independent 30-locus data set. Mol. Biol. Evol. 2012, 29, 737–750. [Google Scholar] [CrossRef] [PubMed] [Green Version]
  8. Kimball, R.T.; Wang, N.; Heimer-McGinn, V.; Ferguson, C.; Braun, E.L. Identifying localized biases in large datasets: A case study using the avian tree of life. Mol. Phylogenet. Evol. 2013, 69, 1021–1032. [Google Scholar] [CrossRef]
  9. McCormack, J.E.; Harvey, M.G.; Faircloth, B.C.; Crawford, N.G.; Glenn, T.C.; Brumfield, R.T. A phylogeny of birds based on over 1,500 loci collected by target enrichment and high-throughput sequencing. PLoS ONE 2013, 8, e54848. [Google Scholar] [CrossRef] [Green Version]
  10. Smith, J.V.; Braun, E.L.; Kimball, R.T. Ratite nonmonophyly: Independent evidence from 40 novel loci. Syst. Biol. 2013, 62, 35–49. [Google Scholar] [CrossRef] [Green Version]
  11. Jarvis, E.D.; Mirarab, S.; Aberer, A.J.; Li, B.; Houde, P.; Li, C.; Ho, S.Y.W.; Faircloth, B.C.; Nabholz, B.; Howard, J.T.; et al. Whole-genome analyses resolve early branches in the tree of life of modern birds. Science 2014, 346, 1320–1331. [Google Scholar] [CrossRef] [Green Version]
  12. Prum, R.O.; Berv, J.S.; Dornburg, A.; Field, D.J.; Townsend, J.P.; Lemmon, E.M.; Lemmon, A.R. A comprehensive phylogeny of birds (Aves) using targeted next-generation DNA sequencing. Nature 2015, 526, 569–573. [Google Scholar] [CrossRef]
  13. Reddy, S.; Kimball, R.T.; Pandey, A.; Hosner, P.A.; Braun, M.J.; Hackett, S.J.; Han, K.-L.; Harshman, J.; Huddleston, C.J.; Kingston, S.; et al. Why do phylogenomic data sets yield conflicting trees? Data type influences the avian tree of life more than taxon sampling. Syst. Biol. 2017, 66, 857–879. [Google Scholar] [CrossRef]
  14. Liu, Y.; Liu, S.; Yeh, C.-F.; Zhang, N.; Chen, G.; Que, P.; Dong, L.; Li, S.-H. The first set of universal nuclear protein-coding loci markers for avian phylogenetic and population genetic studies. Sci. Rep. 2018, 8, 15723. [Google Scholar] [CrossRef] [Green Version]
  15. Houde, P.; Braun, E.L.; Narula, N.; Minjares, U.; Mirarab, S. Phylogenetic signal of indels and the neoavian radiation. Diversity 2019, 11, 108. [Google Scholar] [CrossRef] [Green Version]
  16. Kuhl, H.; Frankl-Vilches, C.; Bakker, A.; Mayr, G.; Nikolaus, G.; Boerno, S.T.; Klages, S.; Timmermann, B.; Gahr, M. An unbiased molecular approach using 3’UTRs resolves the avian family-level tree of life. Mol. Biol. Evol. 2020. [Google Scholar] [CrossRef] [PubMed]
  17. Suh, A. The phylogenomic forest of bird trees contains a hard polytomy at the root of Neoaves. Zool. Scr. 2016, 45, 50–62. [Google Scholar] [CrossRef]
  18. Jeffroy, O.; Brinkmann, H.; Delsuc, F.; Philippe, H. Phylogenomics: The beginning of incongruence? Trends Genet. 2006, 22, 225–231. [Google Scholar] [CrossRef] [PubMed] [Green Version]
  19. Chen, M.-Y.; Liang, D.; Zhang, P. Phylogenomic resolution of the phylogeny of laurasiatherian mammals: Exploring phylogenetic signals within coding and noncoding sequences. Genome Biol. Evol. 2017, 9, 1998–2012. [Google Scholar] [CrossRef] [PubMed] [Green Version]
  20. Chan, K.O.; Hutter, C.R.; Wood, P.L.; Grismer, L.L.; Brown, R.M. Larger, unfiltered datasets are more effective at resolving phylogenetic conflict: Introns, exons, and UCEs resolve ambiguities in golden-backed frogs (Anura: Ranidae; genus Hylarana). Mol. Phylogenet. Evol. 2020, 151, 106899. [Google Scholar] [CrossRef]
  21. Xiao, T.-W.; Xu, Y.; Jin, L.; Liu, T.-J.; Yan, H.-F.; Ge, X.-J. Conflicting phylogenetic signals in plastomes of the tribe Laureae (Lauraceae). PeerJ 2020, 8, e10155. [Google Scholar] [CrossRef]
  22. Zhang, J.; Lindsey, A.R.I.; Peters, R.S.; Heraty, J.M.; Hopper, K.R.; Werren, J.H.; Martinson, E.O.; Woolley, J.B.; Yoder, M.J.; Krogmann, L. Conflicting signal in transcriptomic markers leads to a poorly resolved backbone phylogeny of chalcidoid wasps. Syst. Entomol. 2020, 45, 783–802. [Google Scholar] [CrossRef]
  23. Zhang, R.; Wang, Y.-H.; Jin, J.-J.; Stull, G.W.; Bruneau, A.; Cardoso, D.; De Queiroz, L.P.; Moore, M.J.; Zhang, S.-D.; Chen, S.-Y.; et al. Exploration of plastid phylogenomic conflict yields new insights into the deep relationships of Leguminosae. Syst. Biol. 2020, 69, 613–622. [Google Scholar] [CrossRef]
  24. Pandey, A.; Braun, E.L. Phylogenetic analyses of sites in different protein structural environments result in distinct placements of the metazoan root. Biology 2020, 9, 64. [Google Scholar] [CrossRef] [PubMed] [Green Version]
  25. Yuri, T.; Kimball, R.T.; Harshman, J.; Bowie, R.C.K.; Braun, M.J.; Chojnowski, J.L.; Han, K.-L.; Hackett, S.J.; Huddleston, C.J.; Moore, W.S.; et al. Parsimony and model-based analyses of indels in avian nuclear genes reveal congruent and incongruent phylogenetic signals. Biology 2013, 2, 419–444. [Google Scholar] [CrossRef] [PubMed]
  26. Mayr, G. Metaves, Mirandornithes, Strisores and other novelties—A critical review of the higher-level phylogeny of neornithine birds. J. Zool. System. 2011, 49, 58–76. [Google Scholar] [CrossRef]
  27. Chen, A.; Field, D.J. Phylogenetic definitions for Caprimulgimorphae (Aves) and major constituent clades under the International Code of Phylogenetic Nomenclature. Senckenberg Gesellschaft für Naturforschung 2020, 70, 571–585. [Google Scholar] [CrossRef]
  28. Pittman, M.; O’Connor, J.; Field, D.; Turner, A.; Ma, W.; Makovicky, P.; Xu, X. Pennaraptoran Systematics. In Pennaraptoran Theropod Dinosaurs: Past Progress and New Frontiers; Pittman, M., Xu, X., Eds.; Bulletin of the American Museum of Natural History 440: New York, NY, USA, 2020; pp. 7–36. [Google Scholar]
  29. Pollock, D.D.; Zwickl, D.J.; McGuire, J.A.; Hillis, D.M. Increased taxon sampling is advantageous for phylogenetic inference. Syst. Biol. 2002, 51, 664–671. [Google Scholar] [CrossRef] [Green Version]
  30. Slack, K.E.; Delsuc, F.; McLenachan, P.A.; Arnason, U.; Penny, D. Resolving the root of the avian mitogenomic tree by breaking up long branches. Mol. Phylogenet. Evol. 2007, 42, 1–13. [Google Scholar] [CrossRef] [Green Version]
  31. Shen, X.-X.; Hittinger, C.T.; Rokas, A. Contentious relationships in phylogenomic studies can be driven by a handful of genes. Nat. Ecol. Evol. 2017, 1, 126. [Google Scholar] [CrossRef] [Green Version]
  32. Suh, A.; Smeds, L.; Ellegren, H. The Dynamics of incomplete lineage sorting across the ancient adaptive radiation of neoavian birds. PLoS Biol. 2015, 13, e1002224. [Google Scholar] [CrossRef] [Green Version]
  33. Ishikawa, S.A.; Inagaki, Y.; Hashimoto, T. RY-coding and non-homogeneous models can ameliorate the maximum-likelihood inferences from nucleotide sequence data with parallel compositional heterogeneity. Evol. Bioinform. 2012, 8, 357–371. [Google Scholar] [CrossRef]
  34. Zhang, C.; Sayyari, E.; Mirarab, S. ASTRAL-III: Increased scalability and impacts of contracting low support branches. In Comparative Genomics; Meidanis, J., Nakhleh, L., Eds.; Lecture Notes in Computer Science; Springer International Publishing: Cham, Switzerland, 2017; Volume 10562, pp. 53–75. ISBN 978-3-319-67978-5. [Google Scholar]
  35. Camacho, C.; Coulouris, G.; Avagyan, V.; Ma, N.; Papadopoulos, J.; Bealer, K.; Madden, T.L. BLAST+: Architecture and applications. BMC Bioinform. 2009, 10, 421. [Google Scholar] [CrossRef] [Green Version]
  36. Breathnach, R.; Benoist, C.; O’Hare, K.; Gannon, F.; Chambon, P. Ovalbumin gene: Evidence for a leader sequence in mRNA and DNA sequences at the exon-intron boundaries. Proc. Natl. Acad. Sci. USA 1978, 75, 4853–4857. [Google Scholar] [CrossRef] [PubMed] [Green Version]
  37. Maddison, D.R.; Swofford, D.L.; Maddison, W.P. NEXUS: An extensible file format for systematic information. Syst. Biol. 1997, 46, 590–621. [Google Scholar] [CrossRef] [PubMed]
  38. Minh, B.Q.; Schmidt, H.A.; Chernomor, O.; Schrempf, D.; Woodhams, M.D.; von Haeseler, A.; Lanfear, R. IQ-TREE 2: New models and efficient methods for phylogenetic inference in the genomic era. Mol. Biol. Evol. 2020, 37, 1530–1534. [Google Scholar] [CrossRef] [PubMed] [Green Version]
  39. Chernomor, O.; von Haeseler, A.; Minh, B.Q. Terrace Aware data structure for phylogenomic inference from supermatrices. Syst. Biol. 2016, 65, 997–1008. [Google Scholar] [CrossRef] [Green Version]
  40. Hoang, D.T.; Chernomor, O.; von Haeseler, A.; Minh, B.Q.; Vinh, L.S. Ufboot2: Improving the ultrafast bootstrap approximation. Mol. Biol. Evol. 2018, 35, 518–522. [Google Scholar] [CrossRef]
  41. Neyman, J. Molecular studies of evolution: A source of novel statistical problems. In Molecular Studies of Evolution: A Source of Novel Statistical Problems; Gupta, S.S., Yackel, J., Eds.; New York Academic Press: New York, NY, USA, 1971; pp. 1–27. [Google Scholar]
  42. Farris, J.S. A probability model for inferring evolutionary trees. Syst. Biol. 1973, 22, 250–256. [Google Scholar] [CrossRef]
  43. Cavender, J.A. Taxonomy with confidence. Math. Biosci. 1978, 40, 271–280. [Google Scholar] [CrossRef]
  44. Sayyari, E.; Mirarab, S. Fast coalescent-based computation of local branch support from quartet frequencies. Mol. Biol. Evol. 2016, 33, 1654–1668. [Google Scholar] [CrossRef] [Green Version]
  45. Bogdanowicz, D.; Giaro, K. Matching split distance for unrooted binary phylogenetic trees. IEEE/ACM Trans. Comput. Biol. Bioinform. 2011, 9, 150–160. [Google Scholar] [CrossRef]
  46. Lin, Y.; Rajan, V.; Moret, B.M.E. A metric for phylogenetic trees based on matching. IEEE/ACM Trans. Comput. Biol. Bioinform. 2012, 9, 1014–1022. [Google Scholar] [CrossRef]
  47. Saitou, N.; Nei, M. The neighbor-joining method: A new method for reconstructing phylogenetic trees. Mol. Biol. Evol. 1987, 4, 406–425. [Google Scholar] [CrossRef] [PubMed]
  48. Suh, A.; Paus, M.; Kiefmann, M.; Churakov, G.; Franke, F.A.; Brosius, J.; Kriegs, J.O.; Schmitz, J. Mesozoic retroposons reveal parrots as the closest living relatives of passerine birds. Nat. Commun. 2011, 2, 443. [Google Scholar] [CrossRef] [PubMed]
  49. Tiley, G.P.; Pandey, A.; Kimball, R.T.; Braun, E.L.; Burleigh, J.G. Whole genome phylogeny of Gallus: Introgression and data-type effects. Avian Res. 2020, 11, 7. [Google Scholar] [CrossRef] [Green Version]
  50. Pamilo, P.; Nei, M. Relationships between gene trees and species trees. Mol. Biol. Evol. 1988, 5, 568–583. [Google Scholar] [CrossRef]
  51. Maddison, W.P. Gene trees in species trees. Syst. Biol. 1997, 46, 523–536. [Google Scholar] [CrossRef]
  52. Hill, W.G.; Robertson, A. The effect of linkage on limits to artificial selection. Genet. Res. 1966, 8, 269. [Google Scholar] [CrossRef]
  53. Nikolaev, S.; Montoya-Burgos, J.I.; Margulies, E.H.; NISC Comparative Sequencing Program; Rougemont, J.; Nyffeler, B.; Antonarakis, S.E. Early history of mammals is elucidated with the ENCODE multiple species sequencing data. PLoS Genet. 2007, 3, e2. [Google Scholar] [CrossRef] [Green Version]
  54. Gillung, J.P.; Winterton, S.L.; Bayless, K.M.; Khouri, Z.; Borowiec, M.L.; Yeates, D.; Kimsey, L.S.; Misof, B.; Shin, S.; Zhou, X.; et al. Anchored phylogenomics unravels the evolution of spider flies (Diptera, Acroceridae) and reveals discordance between nucleotides and amino acids. Mol. Phylogenet. Evol. 2018, 128, 233–245. [Google Scholar] [CrossRef]
  55. Vasilikopoulos, A.; Balke, M.; Beutel, R.G.; Donath, A.; Podsiadlowski, L.; Pflug, J.M.; Waterhouse, R.M.; Meusemann, K.; Peters, R.S.; Escalona, H.E.; et al. Phylogenomics of the superfamily Dytiscoidea (Coleoptera: Adephaga) with an evaluation of phylogenetic conflict and systematic error. Mol. Phylogenet. Evol. 2019, 135, 270–285. [Google Scholar] [CrossRef] [Green Version]
  56. Vasilikopoulos, A.; Gustafson, G.T.; Balke, M.; Niehuis, O.; Beutel, R.G.; Misof, B. Resolving the phylogenetic position of Hygrobiidae (Coleoptera: Adephaga) requires objective statistical tests and exhaustive phylogenetic methodology: A response to Cai et al. (2020). Mol. Phylogenet. Evol. 2020, in press, corrected proof. [Google Scholar] [CrossRef]
  57. Braun, E.L.; Kimball, R.T. Examining Basal avian divergences with mitochondrial sequences: Model complexity, taxon sampling, and sequence length. Syst. Biol. 2002, 51, 614–625. [Google Scholar] [CrossRef] [PubMed] [Green Version]
  58. Delsuc, F.; Phillips, M.J.; Penny, D. Comment on “Hexapod origins: Monophyletic or paraphyletic?”. Science 2003, 301, 1482. [Google Scholar] [CrossRef] [PubMed] [Green Version]
  59. Phillips, M.J.; Penny, D. The root of the mammalian tree inferred from whole mitochondrial genomes. Mol. Phylogenet. Evol. 2003, 28, 171–185. [Google Scholar] [CrossRef]
  60. Vera-Ruiz, V.A.; Lau, K.W.; Robinson, J.; Jermiin, L.S. Statistical tests to identify appropriate types of nucleotide sequence recoding in molecular phylogenetics. BMC Bioinform. 2014, 15 (Suppl. S2), S8. [Google Scholar] [CrossRef] [Green Version]
  61. Galtier, N.; Gouy, M. Inferring pattern and process: Maximum-likelihood implementation of a nonhomogeneous model of DNA sequence evolution for phylogenetic analysis. Mol. Biol. Evol. 1998, 15, 871–879. [Google Scholar] [CrossRef] [Green Version]
  62. Hannaford, N.E.; Heaps, S.E.; Nye, T.M.; Williams, T.A.; Embley, T.M. Incorporating compositional heterogeneity into Lie Markov models for phylogenetic inference. arXiv 2020, arXiv:2007.08511. [Google Scholar]
  63. Blair, C.; Murphy, R.W. Recent trends in molecular phylogenetic analysis: Where to next? J. Hered. 2011, 102, 130–138. [Google Scholar] [CrossRef] [Green Version]
  64. Kainer, D.; Lanfear, R. The effects of partitioning on phylogenetic inference. Mol. Biol. Evol. 2015, 32, 1611–1627. [Google Scholar] [CrossRef] [Green Version]
  65. Patel, S.; Kimball, R.T.; Braun, E.L. Error in phylogenetic estimation for bushes in the tree of life. J. Phylogenet. Evol. Biol. 2013, 1, 110. [Google Scholar] [CrossRef] [Green Version]
  66. Roch, S.; Warnow, T. On the robustness to gene tree estimation error (or lack thereof) of coalescent-based species tree methods. Syst. Biol. 2015, 64, 663–676. [Google Scholar] [CrossRef] [Green Version]
  67. Springer, M.S.; Gatesy, J. The gene tree delusion. Mol. Phylogenet. Evol. 2016, 94, 1–33. [Google Scholar] [CrossRef] [PubMed]
  68. Ericson, P.G.P. Evolution of terrestrial birds in three continents: Biogeography and parallel radiations. J. Biogeogr. 2012, 39, 813–824. [Google Scholar] [CrossRef]
  69. Houde, P.; Braun, E.L.; Zhou, L. Deep-time demographic inference suggests ecological release as driver of neoavian adaptive radiation. Diversity 2020, 12, 164. [Google Scholar] [CrossRef]
  70. Claramunt, S.; Cracraft, J. A new time tree reveals Earth history’s imprint on the evolution of modern birds. Sci. Adv. 2015, 1, e1501005. [Google Scholar] [CrossRef] [PubMed] [Green Version]
  71. Cracraft, J.; Houde, P.; Ho, S.Y.W.; Mindell, D.P.; Fjeldså, J.; Lindow, B.; Edwards, S.V.; Rahbek, C.; Mirarab, S.; Warnow, T.; et al. Response to Comment on “Whole-genome analyses resolve early branches in the tree of life of modern birds”. Science 2015, 349, 1460. [Google Scholar] [CrossRef] [PubMed] [Green Version]
  72. Kimball, R.T.; Oliveros, C.H.; Wang, N.; White, N.D.; Barker, F.K.; Field, D.J.; Ksepka, D.T.; Chesser, R.T.; Moyle, R.G.; Braun, M.J.; et al. A phylogenomic supertree of birds. Diversity 2019, 11, 109. [Google Scholar] [CrossRef] [Green Version]
  73. Xu, B.; Yang, Z. Challenges in species tree estimation under the multispecies coalescent model. Genetics 2016, 204, 1353–1368. [Google Scholar] [CrossRef] [Green Version]
  74. Zhang, G.; Li, C.; Li, Q.; Li, B.; Larkin, D.M.; Lee, C.; Storz, J.F.; Antunes, A.; Greenwold, M.J.; Meredith, R.W.; et al. Comparative genomics reveals insights into avian genome evolution and adaptation. Science 2014, 346, 1311–1320. [Google Scholar] [CrossRef] [Green Version]
  75. Stiller, J.; Zhang, G. Comparative phylogenomics, a stepping stone for bird biodiversity studies. Diversity 2019, 11, 115. [Google Scholar] [CrossRef] [Green Version]
  76. Feng, S.; Stiller, J.; Deng, Y.; Armstrong, J.; Fang, Q.; Reeve, A.H.; Xie, D.; Chen, G.; Guo, C.; Faircloth, B.C.; et al. Dense sampling of bird diversity increases power of comparative genomics. Nature 2020, 587, 252–257. [Google Scholar] [CrossRef]
Figure 2. Nucleotide sequence variation in the Prum data matrix. These graphs emphasize the much larger number of aligned coding sites but also the larger proportion of informative sites in the non-coding data. Note the different y-axis scales for the two graphs. Detailed information about the number of sites in each data partition are available in Supplementary File S1.
Birds 02 00001 g002
Figure 3. Analyses of coding and non-coding data result in different conclusions. (A) Recovery of the magnificent seven clades and indicator clades, with ultrafast bootstrap support values for each clade presented in cells (colored as shown in the key). The positions of clades VI and VII have varied in previous analyses of non-coding data so we viewed both alternatives as potential non-coding indicators and indicated them using two shades of blue (for successive divergences) and dark cyan (VI and VII united as the clade Columbea). Note: “raptors sister” indicates the clade comprising all core landbirds except raptors. The different colors (red and orange) for the extended waterbird clade reflect the composition of that clade (orange reflects inclusion of Hoatzin). (B) Clustering of trees based on matching distances. The position of the midpoint is indicated using a dashed arrow. Trees from this study are presented in bold to distinguish them from the two concatenated trees from the original Prum et al. [12] study. This “tree-of-trees” is based on fully resolved trees; a cluster analysis for trees with very poorly supported branches collapsed is available as Supplementary Figure S1.
Birds 02 00001 g003
Figure 4. Estimates of phylogeny for all sites in the Prum dataset and for the coding exon data, with terminals labels using the common names of orders. The first three cladograms reflect analyses of the complete data matrix (A) without partitioning, (B) with partitioning, and (C) after RY coding. The last three reflect analyses restricted to the coding exons (D) without partitioning, (E) with partitioning, and (F) after RY coding. The magnificent seven are emphasized using the same color scheme as Figure 1 and brackets to the right of the tree. Paraphyletic groups (e.g., Columbea in part (C) of this figure) are indicated using dashed brackets. The trees based on nucleotide data are in a red box to indicate that one or more coding indicator clades are present whereas the RY trees are in a blue box to emphasize that they include non-coding indicator clades. Ultrafast bootstrap support values are presented adjacent to branches. Unlabeled branches received 100% support. Complete trees, showing all species, with branch lengths and support values are in Supplementary File S3.
Birds 02 00001 g004aBirds 02 00001 g004b
Figure 5. Estimates of phylogeny for the non-coding data. Ultrafast bootstrap support values are shown adjacent to relevant branches; the first value reflects the unpartitioned analysis and the second reflects the partitioned analysis. Branches with full (100%) support are blank. The unpartitioned and partitioned trees differed within clade V, although the rearranged branch had limited supported in both analyses. Complete trees, showing all species, including the non-coding RY tree, with branch lengths and support values are in Supplementary File S3.
Birds 02 00001 g005
Figure 6. Patterns of branch length heterogeneity across taxa are similar for the coding exons and non-coding data. These phylograms reflect partitioned maximum-likelihood (ML) analyses of (A) non-coding data and (B) coding exons. Scale bars represent substitutions per site. The magnificent seven and the orphan orders are indicated using the same color scheme and, wherever feasible, with brackets to the right of the tree. When there was not sufficient space for brackets, we used arrows. We simply presented the number or name of the taxon. We removed the crocodilian outgroup to better emphasize heterogeneity within birds. Raptors I = falcons and seriemas; Raptors II = hawks, eagles, New World vultures, and owls. The complete set of trees is available in Supplementary File S3.
Birds 02 00001 g006
Figure 7. Species trees estimated using ASTRAL. The trees were generated using input gene trees estimated using (A) nucleotide data or (B) RY data. Support values are local posterior probabilities multiplied by 100 (to increase readability). These trees are available in Supplementary File S3.
Birds 02 00001 g007
Figure 8. Consensus hypotheses for avian phylogeny and alternative topologies for core landbirds. (A) Cladogram based on a summary of the analyses presented herein. Clade IV was collapsed to emphasize the uncertainty and lineage with the potential for gene flow are indicated using ovals with double-headed arrows (see text for additional details). Formal clade names for the magnificent seven are provided in the legend to Figure 1. (B) Landbird topology that divides core landbirds into Australaves [26] and Afroaves [68]. (C) Landbird topology placing Accipitrimorphae (hawks, eagles, and New World vultures) sister to other core landbirds. (D) Landbird topology based on multispecies coalescent analyses (e.g., Figure 7 in this study and the species tree analyses in Jarvis et al. [11] and Houde et al. [15]). Although the position of mousebirds is unstable in this and some other studies [7,9], we have placed them in a manner consistent with analyses of the complete Prum dataset (and other studies [11,13,15,16]) to simplify this illustration.
Birds 02 00001 g008
Table 1. Base composition for invariant and parsimony informative sites in the Prum data matrix. UTR—untranslated region.
Data TypeSites%A%C%G%T%GC
Coding data
Exon c1Invariant29.621.131.417.952.5
Informative31.026.424.717.951.1
Exon c2Invariant33.323.715.927.039.6
Informative31.029.122.417.551.5
Exon c3Invariant17.021.643.417.965.0
Informative23.826.022.427.848.4
Non-coding data
IntronInvariant29.014.621.734.736.3
Informative26.419.920.533.240.4
UTRInvariant26.616.420.336.636.7
Informative29.119.422.029.541.4
IntergenicInvariant31.318.822.027.840.8
Informative30.220.821.327.642.1
Table 2. Variation in base composition for the Prum data matrix.
RY (AG-CT)SW (GC-AT)KM (GT-AC)
Data TypeInf Sites 1Variation 2Inf Sites 1Variation 2Inf Sites 1Variation 2
Coding exons
  Exon c111,3740.39%23,3251.29%21,1700.37%
  Exon c269580.32%13,7741.17%14,5310.35%
  Exon c337,6730.56%87,2992.56%87,7550.32%
Non-coding data
  Introns22,5100.25%31,0140.73%30,7800.29%
  UTRs76540.40%12,5221.23%12,3830.32%
  Intergenic3101.90%6483.24%6381.28%
1 Number of sites that remain parsimony informative after nucleotides are coded as R (purine) and Y (pyrimidine), S (strongly pairing), and W (weakly pairing), or K (keto) and M (amino). 2 Interquartile range for the composition of all taxa (see Supplementary File S1 for details).
Publisher’s Note: MDPI stays neutral with regard to jurisdictional claims in published maps and institutional affiliations.

