Abstract
The coronavirus pandemic caused a crisis in industrial economies, enforcing public concern. The first case of the infection in Europe occurred in Italy. Nowadays, in the field of European gas infrastructure, Italy stands as one of the leading countries transporting gaseous fuel to end users. This article provides an overview of the distribution of natural gas flows in the Italian gas infrastructure in the face of the coronavirus outspread in the country and GAZPROM’s natural gas supply restrictions for European countries. This article presents, using the ARIMA method, a forecast of natural gas consumption of Italian consumers measured up to 2024.
1. Introduction
Snam S. p. A. is one of the world’s leading energy infrastructure operators and is placed on the list of the largest Italian companies in terms of market capital. The company operates in Albania, Austria, France, Greece, Italy and the United Arab Emirates, has recently begun to take action in Chinese and Indian infrastructures and has become one of the major representatives in terms of the invested capital for regulatory purposes. With over 6000 people, Snam is active in the fields of transport, regasification, storage and distribution of natural gas through four operating companies: Snam Rete Gas (transmission and dispatching), Gnl Italia (regasification), Stogit (storage) and Italgas (distribution). Snam’s presence in the whole chain of gas regulated activities allows the company to leverage the value set out by the integration of the businesses. Such an approach ensures maximum flexibility and security of the Italian system through operational synergies, gained in over 70 years of experience, and a unique expertise in the sector. The company, which has been listed on the Milan Stock Exchange since December 2001, is part of Italy’s FTSE MIB and Europe’s STOXX 600 Utilities indexes. Snam’s activities are subject to the regulations set out by the Authority for Electricity and Gas: a clear, transparent and stable regulatory framework, which allows the company to pursue a challenging strategy aimed at value creation by maintaining a low risk profile [1]. As a result of the emergence of the first case of COVID-19, Italy has become the European symbol of the crisis of this pandemic in Europe [2]. The company faced a new external factor. The article presents an overview of delivered and received volumes of gaseous fuel to industrial customers, distribution, underground gas storage and the LNG Terminal, as well as cross-border transmission with neighboring countries over the course of 2022. The article aims to develop a forecast of natural gas deliveries to Italian end users until the end of 2024. In the future, the created forecast will allow for verification of the impact of the potentially introduced restrictions on economies caused by the coronavirus and will help establish whether this had an impact on the consumption of gaseous fuel. The second piece of news (aim/goal of the analysis) will be the verification of the forecast in terms of the still-limited supply of natural gas from the Russian federation and the impact on the interest in natural gas among consumers due to the rising price of the fuel. Gas prices in Europe have reached unprecedented levels in recent months [3]. In this respect, the article will introduce a novelty (a new insight) into the area of forecasting in terms of the natural gas supply for Italy. The method used for forecasting is ARIMA, one of the most well-known and used methods in energy forecasting [4]. There are currently no forecasts in the known literature using this method for Italian end users, with consideration of the external factors of the COVID-19 pandemic and the suspension of supplies to Europe by GAZPROM. This article presents the current state of knowledge of the available published natural gas consumption forecasts in the literature for the coming years for the Italian operator. The article goes on to present a methodology for using one of the most widely used forecasting methods in the energy industry, ARIMA. The research was based on this method. The article presents the characteristics of the Italian infrastructure areas, with the aim of introducing the reader to the profile of natural gas spreading in Italy and an introduction to the general issue (taking into account the emergence of the COVID-19 pandemic and the situation related to the restrictions imposed by GAZPROM). The main part of the article was the generation of forecasts for industrial customers, municipal customers and LNG supply using ARIMA. The results show the directions of interest in the different areas of the Italian natural gas market and demonstrate that LNG will be of increasing interest. In addition, the results show that the COVID-19 pandemic and the restrictions imposed by GAZPROM have an impact on the Italian natural gas market.
2. The State of Knowledge (The Current State of Information)
In 2020, Italy’s natural gas consumption accounted for the largest share of total primary energy consumption, reaching 41.6%. Its consumption was ranked second place among all EU countries (Statista Research Department, 2021). This is a typical situation for a country that relies heavily on natural gas. Therefore, Italy will stand as a perfect example in the following chapter. The specific calculation process is presented below. The authors present a forecast of Italy’s domestic natural gas consumption without exposing the details of the rest of the gas network.
A notable fact is that, in 2021 energy consumption was 14,157 TJ (+16.5% compared with 2020). The energy mix almost entirely consists of natural gas (96.5%), which is used to operate transport, storage and regasification facilities, heating systems in the buildings and general transportation. One of the other sources used is electricity (2.8%), which is mainly needed for the operation of industrial plants, as well as for lighting and heating/air conditioning in offices and servers. Other fuels (diesel, petrol, LPG) and heat, which together account for 0.7% of total energy consumption, are used for plant operations, heating and company fleets [5]. The company does not provide a forecast for specific areas of the gas network.
The Oxford Institute for Energy studies published an interesting paper The Italian Gas Market: Challenges and Opportunities, unfortunately published in 2003. At the time, the authors correctly stated that the Italian gas market was the third largest in Europe, with significant growth in demand, especially in the power sector until the mid-2000s. Unfortunately, the demand growth forecasts from this period were not realized. The impact of the pandemic caused distortions in the predictions. Therefore, the current forecasts need to be updated [6].
3. The Methodology
The first step of the study was collecting the data that served throughout the survey process. This stage generated a large time investment (it turned out to be significantly time consuming) due to the data quality check and aggregation. The criterion used to classify the data was the information on the supply of natural gas using high-pressure pipelines to Italian end users and to the rest of the gas network. The data were downloaded from the website of the European Association of Natural Gas Transmission System Operators and EUROSTAT. It was compiled for the 2016–2020 and 2020–2022 periods. Due to the outbreak of coronavirus and the reduction in supply from the Russian federation caused by the war in Ukraine, forecasts were based on data collected from 2020 onwards. The coronavirus pandemic and the decisions taken by GAZPROM to supply European countries caused an economic shock. Therefore, the article presents the data broken down into two time periods.
ARIMA is one of the most popular models for the time series forecasting analysis. It originated from the combination of the autoregressive model (AR) and the moving average model (MA). The ARIMA model is used for stationary time series data, i.e., in cases when there are no missing values. An identified underlying process based on observations is generated in ARIMA analysis in order to produce a precise process generating mechanism, resulting in a good model [7]. ARIMA is a frequently used technique for forecasting, using the time series data specified by three order parameters, p, d and q, where p stands for the order of the auto regressive model, d is the order of differencing and q represents the order of the moving average. The procedure of fitting an ARIMA model is also referred to as the Box–Jenkins method, where p, d and q are the orders of the AR part, the difference and the MA part, respectively. AR is a class of linear model where the variable of interest is regressed on its own lagged values. If yt is modeled through the AR process, it can be written as:
where σ is intercept, yt − i are regressors and φi and ε are error terms. MA is another class of a linear model. In MA, the output or the variable of interest is modeled through its own imperfectly predicted values of the current and previous times. It can be written as follows, in terms of error terms (in terms of the risk of error):
The short mathematical form of ARMA (p, q) is as follows:
ARIMA, short for Auto-Regressive Integrated Moving Average, is a group of models used in the R programming language to describe a given time series based on the previously predicted values and focused on the future values. The time series analysis is used to detect the trends and changes in the data over a time period. This model is the most popular approach to forecasting the time series. The ARIMA function is used to process the model [8].
4. The Database
4.1. Final Consumers
On 14 February 2020, the Italian government published a decree aimed at slowing the spread of COVID-19 [9] (Figure 1). The associated restrictions caused a slowdown in the economy, which indirectly resulted in a reduction of energy consumption, mainly by the industry, including natural gas. Similarly, in December 2020, the government issued a new legislative decree that established further restrictions before Christmas, which again affected the economy and reduced the natural gas consumption of the industry. The company reported that the demand for natural gas in Italy in the first quarter decreased by 6.7%, reaching 23.94 billion cubic meters (year-on-year) [10]. For 2020, the Italian transmission operator has not identified any signs of recovery of the economy. As a result, the consumption of industrial gas fuel will increase to a level comparable to 2019 [11]. Table 1 presents the statistics showing how the supply of natural gas to end users has formed over the period 2016–2022.
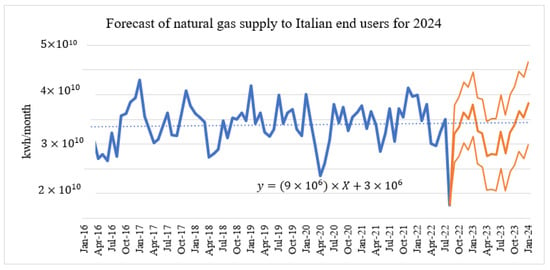
Figure 1.
Forecast of natural gas supply to Italian end users for 2024. These data can be found here: https://www.ec.europa.eu/ (accessed on 20 March 2022).

Table 1.
Final Consumers.
4.2. Distribution
In 2020, a stable intake of natural gas volumes in the distribution area was observed between March and October. Moreover, during this period no dramatic peaks in the outdoor temperatures were observed and the number of COVID-19 incidents remained at a stable level [12]. It is clear that the demand for natural gas by municipal customers increased as the autumn season began (Table 2). In addition, people staying indoors for long periods of time may have contributed to the increase in electricity, water and natural gas consumption [13]. Comparing 2020 with the previous two years, there were no significant deviations in the volumes of gas fuel supplied. The year 2022 shows that, for the distribution area, the trend in natural gas consumption is decreasing and this is also a forecast for the following months. The downward vector will depend on the price of gas fuel and its availability on the natural gas market.

Table 2.
Distribution.
4.3. The Underground Storage of Natural Gas
An important element in the gas sector is the role of the natural gas storage [14]. There are currently 10 natural gas storage fields in Italy, with a total capacity of 16 billion cubic meters. In Italy, storage fields are sourced exclusively from almost fully depleted gas fields [15]. Taking into consideration the local atmospheric conditions, it can be assumed that from April to October the underground storage facilities are filled with gas fuel; however, during the other months natural gas is withdrawn from the storage and injected into the transmission system. In the summer season of 2020, approximately 111 million MWh of natural gas energy units were developed in PMG (Table 3). Compared with 2019, this represents a decrease of around 9%. In the five years analyzed, this is the lowest value. In terms of natural gas volumes received during the heating season in 2020, approximately 121 million MWh were injected into the transmission network (Table 4), which is 12% more compared with 2019. Between 2016 and 2020, the volumes withdrawn from PMG ranged between 107 and 121 million MWh. From the second half of 2022, a faster increase (year-on-year) in natural gas injection into the underground gas storage is evident and this is due to the gas system being prepared for the severe winter period caused by the economic crisis.

Table 3.
Injection to Underground Gas Storages.

Table 4.
Withdrawal to Underground Gas Storages.
4.4. Liquefied Natural Gas LNG
Another important area is LNG. Liquefied natural gas (LNG) is commonly used in the power industry as a fuel for gas engines. It is used for generating electricity or as a fuel for natural gas vehicle (NGV) engines [16]. Snam is the owner of the LNG terminal in Panigaglia. The regasification plant is located in the town of Fezzano di Porto Venere (Table 5). In 2020, all LNG importing countries noted a decrease in LNG imports compared with 2019. The exceptions were Turkey, Poland, Sweden and Greece [17]. 2019 was a year that marked a record for LNG imports in recent years (147 million MWh). In 2020 a decline to 133 million MWh was noted. The pandemic brought a halt to this trend. The 2016–2019 period shows an increasing tendency for LNG demand. However, a recovery of the growing trend is to be expected. LNG is expected to be the fastest growing source of natural gas in Europe to meet the supply–demand gap. Table 4. Terminal LNG Panigaglia. The statistics from the year 2022 indicate that LNG will be an important part of the natural gas supply, not only for the Italian operator but for other European transmission operators as well.

Table 5.
Flow from Terminal LNG.
4.5. Interconnectors
Snam Rete Gas has prepared a long-term capacity availability plan that estimates the capacity of each entry point connected to foreign pipelines and the LNG terminal. It takes into account the capacity of the exit points connected to foreign pipelines, in the amount up to 24 million m3/day in 2017 and increasing to 46.3 × 10⁶ m3/day by 2023 [18]. Considering the data from the company from 2017 to 2021, the total pipeline capacity (imports) is 348.2 × 10⁶ m3/day. It is planned to increase to 372.2 × 10⁶ m3/day by 2024. The expansion will mainly concern the southern part of the transmission infrastructure. Between 2016 and 2018 (Table 6), the transmission trend continued to increase on the cross-border connection with Switzerland. At this interconnector, a 23% increase in gas transmission (year-on-year) was recorded in 2020, rising approximately from 116 × 106 MWh to 90 × 106 MWh. This interconnector is a bidirectional point (Table 7). In 2020, a reduction of approximately 22% in the transmission of gaseous fuel from Switzerland towards Italy was observed. At another interconnector in 2020, 5% less gaseous fuel was transported to Austria (year-on-year), i.e., about 30 × 106 MWh (Table 8). It is worth mentioning that, in 2022, interconnector flows between countries have definitely increased, despite limited supplies from GAZPROM.

Table 6.
Italy/Switzerland. Exit point.

Table 7.
Italy/Switzerland. Entry point.

Table 8.
Italy/Austria. Entry point.
5. Results of the Forecasting Study
Using the ARIMA method, the following forecasts were elaborated. Figure 1 shows the trend for end users with the historical data increasing. This is the positive scenario. However, what the final consumption of the Italian economy would be will depend on gas prices and availability in the natural gas market. It should also be noted that there may be restrictions placed on gas for consumers, that may be due to low gas availability. Another factor could be that consumers themselves will stop using gas fuel due to high market prices. Forecasts for end consumers include a certain seasonality. There is more demand for gaseous fuel in the autumn and winter months. Conversely, as temperatures rise, consumption will be lower. The forecast perfectly indicates the behavior of seasonality for end consumers. If the price of natural gas is high in winter, a lower demand for gas fuel can be expected. However, regardless of the price, it can be forecast that the natural gas consumption for municipal customers will mainly depend on the outside temperature. Municipal consumers, unfortunately, in the event of a harsh winter, must be prepared to save electricity and take into account increased energy efficiency or must be aware of the high bills awaiting them in the event of high energy prices.
The projection of interest in acquiring LNG is straightforward. Due to the problems associated with the limitations of Nord Stream 1, there is a growing interest in sourcing natural gas from other potentially available locations. In this case, the forecast shows an increasing trend for LNG (Figure 2). For the LNG market, forecasts indicate growth. The LNG market is highly flexible, increasing diversification of supply and responding to shortages more rapidly. LNG is expected to continue to expand in a positive and neutral scenario. It is very improbable that the LNG market will decline in Italy. The trend line from 2016 confirms the direction of further growth.
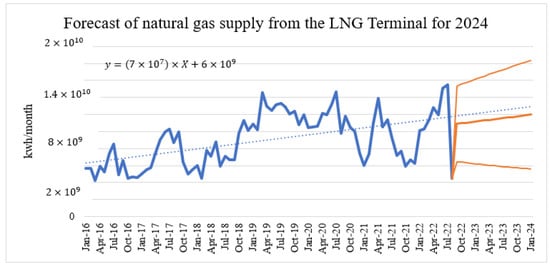
Figure 2.
Forecast of natural gas supply from LNG Terminal for 2024. These data can be found here: https://www.ec.europa.eu/ (accessed on 20 March 2022).
The forecast for underground gas storage may indicate that there will be an interest in storing gas for more difficult times. The amount of volumes injected will also be linked to its availability in the natural gas market (Figure 3). For each winter, the Italian operator must engage in business operations to fill up the storage facilities. In particular, the Italians try to fill up gas storage facilities before the approaching winter.
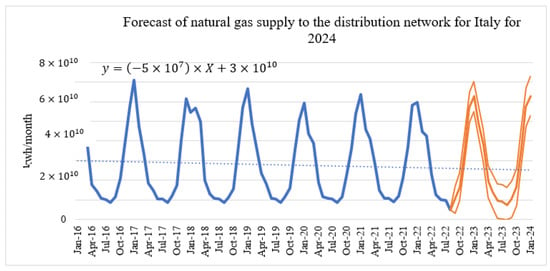
Figure 3.
Forecast of natural gas supply to distribution network for Italy for 2024. These data can be found here: https://www.ec.europa.eu/ (accessed on 20 March 2022).
Figure 4 and Figure 5 show the price of natural gas and the volumes of natural gas supplied from Russia to European countries. It can be concluded that there is a correlation between these two factors. The price of natural gas on European and global trading platforms has followed an upward trend since the curtailment of the GAZPROM gas transmission towards Europe. This was most notably the case with the temporary suspension of transmission on the Nord Stream 1 gas pipeline. The two peaks in Figure 4 demonstrate the fact that transmission on the aforementioned pipeline was suspended. Figure 5 shows a continuous decrease in gas transport from Russia to the European Union. The decisions taken by GAZPROM can lead to this increasingly lower volume in the future.
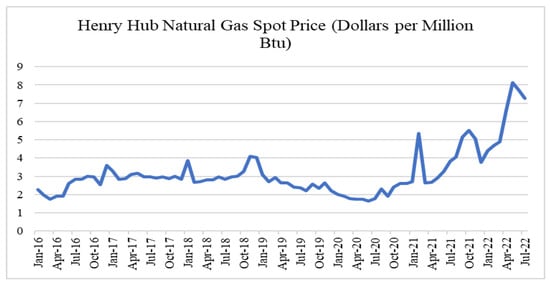
Figure 4.
Henry Hub Natural Gas Spot Price. These data can be found here: https://www.eia.com/ (accessed on 20 March 2022).
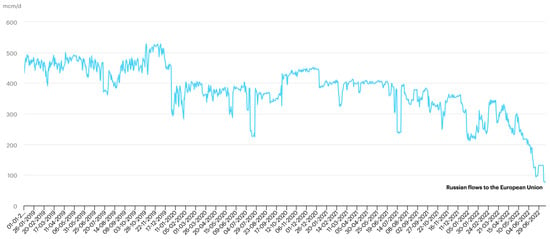
Figure 5.
Russian gas flow to the European Union. These data can be found here: https://euobserver.com (accessed on 20 March 2022).

Figure 6.
Neutral forecast of natural gas supply to Italian end users for 2024. Forecast exercised for the period September 2022 to December 2023. These data can be found here: https://www.ec.europa.eu/ (accessed on 20 March 2022).
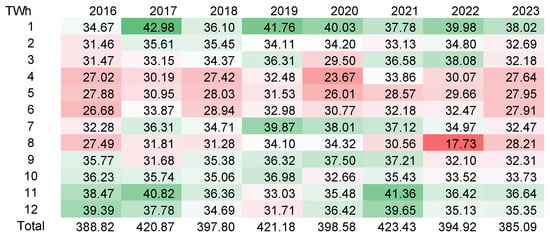
Figure 7.
Negative forecast of natural gas supply to Italian end users for 2024. Forecast exercised for the period September 2022 to December 2023. These data can be found here: https://www.ec.europa.eu/ (accessed on 20 March 2022).
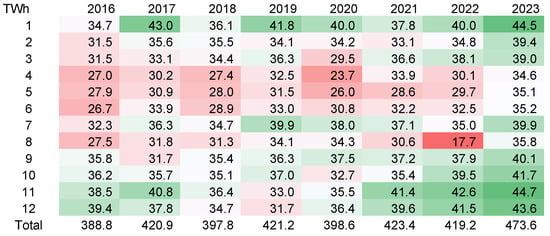
Figure 8.
Positive forecast of natural gas supply to Italian end users for 2024. Forecast exercised for the period September 2022 to December 2023. These data can be found here: https://www.ec.europa.eu/ (accessed on 20 March 2022).

Figure 9.
Neutral forecast of LNG for 2024. Forecast exercised for the period September 2022 to December 2023. These data can be found here: https://www.ec.europa.eu/ (accessed on 20 March 2022).
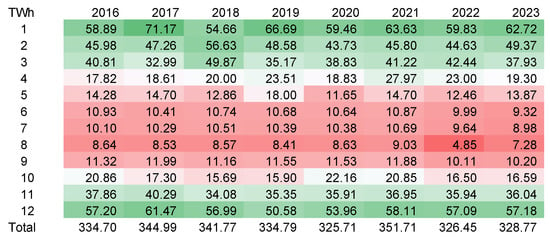
Figure 10.
Neutral forecast of natural gas supply to distribution area for 2024. Forecast exercised for the period September 2022 to December 2023. These data can be found here: https://www.ec.europa.eu/ (accessed on 20 March 2022).
6. Conclusions
In 2020, no recovery of the economy was observed for the Italian demand for natural gas and its increase to a level comparable to the one from 2019. In the analyzed period of 2016-2019, data from the Italian transmission operator show a growing trend of interest in gaseous fuel mainly in the form of LNG. During the winter period of 2020, an increase in natural gas offtake is noticeable in the distribution area. It may be caused by the large numbers of people staying at home, on whom mobility restrictions have been imposed. The actual volumes of gaseous fuel delivered in 2020 show that the impact of the pandemic on stunting economies indirectly affects the reduction of natural gas consumption by the industry. After two years of the coronavirus pandemic, data on the interest in natural gas indicated an increase. This could be related to the rebound of the economy after the difficult time. However, at the beginning of 2022, the invasion of Russian troops in Ukraine caused another economic shock to global economies. Another factor concerning the reduction of gas fuel supplies from Russia to European countries caused turbulence in the natural gas market. This situation may cause the European market to move away from Russian supplies and to provide an opportunity for new rules to be formed for the European natural gas market. The projections developed for the Italian industry are divided into three scenarios. The first neutral scenario (Figure 6) shows a 3% decrease in consumption in 2023 compared with 2022. Figure 7 shows a negative scenario with a projected decrease of up to 20% in 2023 compared with 2022. Figure 8 presents a strongly positive scenario with an increase of 12% in 2023 compared with 2022. The developed neutral projections for LNG consumption in 2023 indicate a 2% increase compared with 2022 (Figure 9. The distribution area, on the contrary, is forecast to expand by around 1,2% 2023/2022. The distribution area is not difficult to predict, as household gas consumption is rather stable year-on-year (Figure 10).
Funding
This research received no external funding.
Data Availability Statement
The data can be downloaded from https://transparency.entsog.eu (accessed on March 2022).
Conflicts of Interest
The author declares no conflict of interest.
References
- Snam Overview. Available online: https://craft.co/snamhtml (accessed on 20 March 2022).
- Italy Surpasses the 1 Million COVID Mark, Joins Top 10 Worst-Hit Countries: Reuters Tally. Available online: https://www.reuters.com/article/us-health-coronavirus-italy-tally-idUSKBN27R2C1 (accessed on 20 March 2022).
- Pastore, L.; Basso, G.; de Santoli, L. Towards a dramatic reduction in the European Natural Gas consumption: Italy as a case study. J. Clean. Prod. 2022, 369, 133377. [Google Scholar] [CrossRef]
- Zhang, R.; Song, H.; Chen, Q.; Wang, Y.; Wang, S.; Li, Y. Comparison of ARIMA and LSTM for prediction of hemorrhagic fever at different time scales in China. PLoS ONE 2022, 17, e0262009. [Google Scholar] [CrossRef]
- Energy Consumption. Available online: https://www.snam.it/en/Sustainability/acting_for_the_environment/energy_consumption.html (accessed on 15 March 2022).
- The Italian Gas Marker: Challenges and Opportunities. Available online: https://www.oxfordenergy.org/publications/the-italian-gas-market-challenges-and-opportunities/ (accessed on 20 March 2022).
- Prediction of Daily COVID-19 Cases in European Countries Using Automatic ARIMA Model. Available online: https://www.ncbi.nlm.nih.gov/pmc/articles/PMC7445441 (accessed on 20 March 2022).
- ARIMA Model in R. Available online: https://www.educba.com/arima-model-in-r/ (accessed on 20 March 2022).
- Italy—COVID-19: New Decree Law Provisions Confirm Existing Measures and Policies. Available online: https://home.kpmg/xx/en/home/insights/2020/07/flash-alert-2020-320.html (accessed on 20 March 2022).
- Reuters Staff: Italy’s Snam Sees Limited Impact from Coronavirus on Targets. Available online: https://www.reuters.com/article/snam-results-idAFL8N2CP3WD (accessed on 20 March 2022).
- COVID-19 and Its Implications on The Italian Natural Gas Market. Available online: https://www.gecf.org/_resources/files/events/gecf-expert-commentary---covid-19-and-its-implications-on-the-italian-natural-gas-market/covid-19-and-its-implication-in-the-italian-gas-market.pdf (accessed on 20 March 2022).
- COVID-19: Snam’s initiatives. Available online: https://www.snam.it/en/Media/covid-19 (accessed on 20 March 2022).
- Dinoi, A.; Gulli, D.; Ammoscato, I.; Calidonna, C.R.; Contini, D. Impact of the Coronavirus Pandemic Lockdown on Atmospheric Nanoparticle Concentrations in Two Sites of Southern Italy. Atmosphere 2021, 12, 352. [Google Scholar] [CrossRef]
- Podziemne Magazyny Gazu Jako Element Krajowego Systemu Gazowego. Available online: http://www.archiwum.inig.pl/INST/nafta-gaz/nafta-gaz/Nafta-Gaz-2010-05-01.pdf (accessed on 20 March 2022).
- Eni School Energy & environment: Natural Gas Storage. Available online: http://st-eni.eniscuola.net/en/argomento/natural-gas1/extraction-and-distribution1/natural-gas-storage (accessed on 20 March 2022).
- Kuczyński, S.; Łaciak, M.; Szurlej, A.; Włodek, T. Impact of Liquefied Natural Gas Composition Changes on Methane Number as a Fuel Quality Requirement. Energies 2020, 13, 5060. [Google Scholar] [CrossRef]
- Howell, N.; Quigley, A. LNG In Europe 2021: Current Trends, The European LNG Landscape and Country Focus. Natl. Law 2021, XII, 282. [Google Scholar]
- Snam Rete Gas Ten-Year Network Development Plan of The Natural Gas Transmission network 2017-2026. Available online: https://www.snam.it/en/transportation/Online_Processes/Allacciamenti/information/ten-year-plan/ (accessed on 20 March 2022).
Publisher’s Note: MDPI stays neutral with regard to jurisdictional claims in published maps and institutional affiliations. |
© 2022 by the author. Licensee MDPI, Basel, Switzerland. This article is an open access article distributed under the terms and conditions of the Creative Commons Attribution (CC BY) license (https://creativecommons.org/licenses/by/4.0/).