Abstract
Immune checkpoint blockade (ICB) therapies, such as immune checkpoint inhibitors against programmed death ligand-1 (PD-L1), have not been successful in treating patients with pancreatic ductal adenocarcinoma (PDAC). Despite the critical role of PD-L1 in various types of cancers, the regulatory mechanism of PD-L1 expression on the cell surface of PDAC is poorly understood. Therefore, uncovering potential modulators of cell surface localisation of PD-L1 may provide a new strategy to improve ICB therapy in patients with PDAC. Here, we examined the role of ezrin/radixin/moesin (ERM) family scaffold proteins that crosslink transmembrane proteins with the actin cytoskeleton in the surface localisation of PD-L1 in KP-2 cells, a human PDAC cell line. Our results demonstrated the abundant protein expression of PD-L1, ezrin, and radixin, but not moesin, as well as their colocalisation in the plasma membrane. Interestingly, immunoprecipitation analysis detected the molecular interaction of PD-L1 with ezrin and radixin. Moreover, gene silencing of ezrin moderately decreased the mRNA and cell surface expression of PD-L1, while that of radixin greatly decreased the surface expression of PD-L1 without altering the mRNA levels. Thus, radixin and ezrin differentially modulate the cell surface localisation of PD-L1 in KP-2 cells, highlighting a potential therapeutic target to improve the current ICB therapy in PDAC.
1. Introduction
Globally, pancreatic cancer (PC), including pancreatic ductal adenocarcinoma (PDAC), is the seventh leading cause of cancer death in both sexes [1]. Despite the recent development of PDAC therapeutics, PDAC still has an unfavourable prognosis and an overall five-year survival rate of less than 10% due to the late diagnosis at an advanced or even metastatic state, and inadequate response to standard chemotherapy [2,3,4,5,6,7]. Therefore, new effective treatment options must be developed.
Cancer cells evade immunosurveillance by utilising programmed death ligand-1 (PD-L1), an immune checkpoint molecule frequently expressed on cancer cells that binds to programmed death-1 (PD-1) on T-cells [8]. Through overexpression or induction of PD-L1 on the cancer cell surface or on immune cells, cancer cells shut down the anti-tumour immune response by inhibiting T-cell functions [9,10]. Immune checkpoint blockade (ICB) therapy using antibodies against immune checkpoint molecules, such as PD-1/PD-L1, prevents the interaction between PD-1 and PD-L1, leading to the reactivation and enhancement of T-cell immunity [11]. Despite the huge success of ICB therapy during the past decade in a small subset of many solid tumours [12], limited benefits have emerged in patients with PDAC [13,14,15]. Thus, the development of a novel therapeutic approach for inhibiting the PD-1/PD-L1 axis represents an unmet medical need for PDAC.
Emerging evidence has demonstrated that PD-L1 expression is regulated at different levels, such as transcription, post-transcriptional, and post-translational modification [16,17,18]. Given that PD-L1 is a transmembrane protein, the process of post-translational modification, including phosphorylation, glycosylation, and ubiquitination, has a large impact on the cell surface membrane localisation of PD-L1 [16,17,18,19,20].
The family members of ezrin/radixin/moesin (ERM) proteins function as cross-linkers between the actin cytoskeleton and several transmembrane proteins involved in cancer development, progression, and resistance. In fact, a growing body of evidence suggests that ERM proteins post-translationally regulate the plasma membrane localisation and functional activity of cancer-related proteins, including several transmembrane receptor kinases, cluster of differentiation (CD) 20, and P-glycoprotein (P-gp) through direct molecular interaction [21,22,23,24,25,26,27,28]. Interestingly, we have recently found that in some types of human cancer cell lines, the ERM family crosslinks PD-L1 with the actin cytoskeleton in a different fashion, contributing to the plasma membrane localisation of PD-L1, possibly via post-translational modification rendering them as scaffold proteins [29,30,31]. However, it remains to be elucidated whether the ERM family also regulates the plasma membrane localisation of PD-L1 as a scaffold protein in PDAC cells.
In this study, we aimed to identify the expression profile and subcellular localisation of PD-L1 and ERM, and to investigate whether ERM serves as a scaffold protein for PD-L1 in the cell surface plasma membrane in KP-2 cells, a commercially available human PDAC cell line.
2. Materials and Methods
2.1. Cell Culture
The human pancreatic tubular adenocarcinoma cell line, KP-2, and human uterine cervix cell line, HeLa, were purchased from the Japanese Collection of Research Bioresources (JCRB) Cell Bank (JCRB0181; Osaka, Japan), and the European Collection of Authenticated Cell Cultures (ECACC) (EC93021013-F0; KAC, Hyogo, Japan), respectively. KP-2 and HeLa cells were cultured in Roswell Park Memorial Institute (RPMI) 1640 or Dulbecco’s Modified Eagle’s Medium (DMEM) containing 1500 mg/L glucose (FUJIFILM Wako Pure Chemical, Osaka, Japan), respectively, supplemented with heat-inactivated 10% foetal bovine serum (BioWest, Nuaillé, France) until 70–80% confluence in the culture flasks and were maintained at 37 °C in a humidified atmosphere with 5% CO2.
2.2. Transfection of Cells with siRNAs
KP-2 cells were seeded at a density of 2.0 × 10⁴ cells/well in 24-well cell culture plates (Corning, Glendale, AZ, USA) for total RNA isolation and flow cytometry analysis or 1.0 × 10⁵ cells/well in 6-well cell culture plates (Corning) for total protein isolation, and were incubated overnight at 37 °C in a humidified atmosphere with 5% CO2 to allow for attachment. Silencer Select siRNAs for each target gene (Thermo Fisher Scientific, Tokyo, Japan) were diluted with Opti-MEM (Thermo Fisher Scientific). Then, siRNAs targeting human ezrin, radixin, moesin, PD-L1, or non-targeting control (NC) at a concentration of 5 nM were transfected into the cells using the Lipofectamine RNAiMAX Transfection Reagent (Thermo Fisher Scientific). The transfection reagent volume was 0.25 µL/1.0 × 104 cells. After treatment with siRNAs, cells were continuously cultured for 4 days without exchanging the medium. The treatment period adopted in this study was determined according to the manufacturer’s protocol.
2.3. RNA Isolation and Real-Time Reverse Transcription (RT)-Polymerase Chain Reaction (PCR)
Total RNA was isolated from KP-2 cells using ISOSPIN Cell & Tissue RNA (NIPPON GENE, Tokyo, Japan) according to the manufacturer’s protocol. Total RNA purity and quantity were measured using a NanoDrop ND-1000 spectrophotometer (Thermo Fisher Scientific). Real-time RT-PCR was performed using a One Step TB Green Prime Script PLUS PT-PCR Kit (Takara Bio, Shiga, Japan), 10 ng of total RNA preparations and gene-specific primers (Takara Bio) at a final concentration of 0.4 µM in a 12 μL reaction. The thermal cycle conditions were set at 42 °C for 5 min and 95 °C for 10 s as the reverse transcription step, followed by 40 cycles of amplification step at 95 °C for 5 s and 60 °C for 30 s, with a subsequent melting curve stage at 60 °C for 5 s and heating at 0.5 °C/s to 95 °C in the CFX Connect Real-Time PCR Detection System (Bio-Rad Laboratories, Tokyo, Japan). The relative mRNA expression levels of the target genes were normalised to those of β-actin, an internal reference, amplified from the same sample, and computed according to the comparative quantification cycle (Cq) method (2-ΔΔCq) using the Bio-Rad CFX Manager software version 3.1 (Bio-Rad Laboratories). The sequences of the gene-specific RT-qPCR primers are listed in Table 1.

Table 1.
Primer sequences used for real-time reverse transcription-polymerase chain reaction analysis.
2.4. Confocal Laser Scanning Microscopy (CLSM) Analysis
KP-2 cells were seeded at a density of 1.0 × 10⁵ cells on a polylysine-coated 35 mm glass-bottom dish with an inner diameter of 14 mm (Matsunami Glass, Osaka, Japan) and incubated overnight at 37 °C in a humidified atmosphere with 5% CO2 to allow for attachment. Cells were then washed with Dulbecco’s phosphate-buffered saline (D-PBS) (FUJIFILM Wako Pure Chemical) and fixed with 4% paraformaldehyde (PFA) (FUJIFILM Wako Pure Chemical) at room temperature for 15 min, followed by rinsing thrice with D-PBS. Subsequently, cells were permeabilised with 0.5% Triton-X100 (Thermo Fisher Scientific) at room temperature for 15 min and incubated in a blocking buffer consisting of 10% normal goat serum (Thermo Fisher Scientific), 1% bovine serum albumin (BSA) (FUJIFILM Wako Pure Chemical), and 0.1% Tween-20 (Nacalai Tesque, Kyoto, Japan) in D-PBS, at room temperature for 60 min. To observe the intracellular localisation of PD-L1 and ERM, cells were incubated overnight at 4 °C in the dark under humidified conditions with an Alexa Fluor 488-conjugated rabbit anti-PD-L1 antibody (25048s; Cell Signaling Technology, Danvers, MA, USA) at a dilution of 1:50 in blocking buffer or with a rabbit anti-ezrin antibody (3145s; Cell Signaling Technology), a rabbit anti-radixin antibody (GTX105408; Gene Tex, Alton Pkwy Irvine, CA, USA), or a rabbit anti-moesin antibody (3150s; Cell Signaling Technology) at a dilution of 1:50 in blocking buffer. After rinsing thrice with D-PBS supplemented with 0.1% Tween-20 (PBS-T), the cells were incubated for 60 min at room temperature with an Alexa Fluor 488-conjugated goat anti-rabbit IgG (H + L) antibody ReadyProbes (R37116; Thermo Fisher Scientific) at a dilution of approximately 1:12.5 in blocking buffer for ezrin, radixin, and moesin. After rinsing three times with PBS-T, the plasma membranes were counterstained with ActinRed 555 ReadyProbes Reagent (R37112; Thermo Fisher Scientific), a commercially available phalloidin conjugated to tetramethylrhodamine (TRITC) which binds F-actin with high selectivity and affinity, at a dilution of approximately 1:25 in blocking buffer for 30 min at room temperature. Cells were then rinsed three times with PBS-T and mounted in an antifade mounting medium (12745-74; Nacalai Tesque). For negative control staining, cells were incubated with an Alexa Fluor 488-conjugated goat anti-rabbit IgG (H + L) antibody ReadyProbes (R37116; Thermo Fisher Scientific) at a dilution of approximately 1:12.5 in blocking buffer without incubation with primary antibodies against PD-L1 and each ERM.
Immunofluorescence images were captured at 1.0–1.5 µm intervals on the z-axis at an original magnification of 20× with a Nikon A1 confocal laser microscope system (Nikon Instrument, Tokyo, Japan). Two- or three-dimensional images were reconstructed from the images obtained using the NIS-Elements Ar Analysis software (Nikon Instruments). To quantify the colocalisation of F-actin with PD-L1, ezrin, radixin, or moesin, Pearson’s correlation coefficients were calculated from the reconstructed images using NIS-Elements Ar Analysis software (Nikon Instruments).
To determine the intracellular colocalisation of PD-L1 with ezrin, radixin, and moesin, cells were processed before a procedure for the antibody incubation, as described above. The cells were incubated overnight at 4 °C in the dark under humidified conditions with a rabbit anti-ezrin antibody (3145s; Cell Signaling Technology), a rabbit anti-radixin antibody (GTX105408; Gene Tex), or a rabbit anti-moesin antibody (3150s; Cell Signaling Technology) at a dilution of 1:50 in blocking buffer. After rinsing three times with PBS-T, the cells were incubated for 60 min at room temperature with an Alexa Fluor 594-conjugated goat anti-rabbit IgG (H + L) antibody ReadyProbes (R37117; Thermo Fisher Scientific) at a dilution of approximately 1:12.5 in blocking buffer. After rinsing thrice with PBS-T, cells were incubated overnight at 4 °C in the dark under humidified conditions with an Alexa Fluor 488-conjugated rabbit anti-PD-L1 antibody (25048s; Cell Signaling Technology) at a dilution of 1:50 in blocking buffer. Thereafter, cells were rinsed three times with PBS-T, and mounted in an antifade mounting medium (12745-74; Nacalai Tesque). For negative control staining, cells were incubated with an Alexa Fluor 488-conjugated goat anti-rabbit IgG (H + L) antibody ReadyProbes (R37116; Thermo Fisher Scientific) or an Alexa Fluor 594-conjugated goat anti-rabbit IgG (H + L) antibody ReadyProbes (R37117; Thermo Fisher Scientific) both at a dilution of approximately 1:12.5 in blocking buffer without incubation with primary antibodies against PD-L1 and each ERM. The immunofluorescence images were captured and processed as described above.
2.5. Flow Cytometry Analysis
After treatment of KP-2 cells with siRNAs for 4 days, the cells were detached using Accutase (Nacalai Tesque) and mixed with a labelling buffer consisting of D-PBS supplemented with 5% normal horse serum (Biowest) and 1% sodium azide (FUJIFILM Wako Pure Chemical) followed by centrifugation (260× g for 5 min at 4 °C). Subsequently, the cells were reacted with an allophycocyanin (APC)-conjugated mouse anti-human CD274 (B7-H1, PD-L1) antibody (329708; BioLegend, San Diego, CA, USA) at a dose of 2.8 μg/tube in a labelling buffer for 60 min at 4 °C. After rinsing in the labelling buffer and centrifugation (260× g for 5 min at 4 °C), the cell pellet was resuspended in D-PBS containing propidium iodide (PI) (Dojindo Laboratories, Kumamoto, Japan) to exclude PI-positive dead cells. Thereafter, the cells were analysed using a cell analyser EC800 (Sony Imaging Products and Solutions, Tokyo, Japan). Data were processed using the EC800 Analysis software (Sony Imaging Products and Solutions) to determine the mean fluorescence intensity of APC-PD-L1 on the cell surface of KP-2 cells.
2.6. Protein Isolation
After treatment of cells with siRNAs for 4 days without medium exchange, cells were rinsed twice with ice-cold D-PBS and subsequently lysed in radio-immunoprecipitation assay (RIPA) buffer containing a protease inhibitor cocktail for 40 min on ice. The cell debris was removed by centrifugation (15,000× g, 4 °C for 10 min), and the supernatant of the resulting suspension was collected as the total whole-cell lysates. Protein concentration was quantified using the TaKaRa BCA Protein Assay Kit (Takara Bio).
2.7. Western Blotting
Total whole-cell lysates of KP-2 cells were diluted with equal volumes of 2× Laemmli buffer and boiled at 97 °C for 5 min. Equal amounts of protein (3.0 µg/lane) were separated via sodium dodecyl sulfate (SDS)-polyacrylamide gel electrophoresis (PAGE) followed by electrotransfer onto a nitrocellulose membrane (Bio-Rad Laboratories). The membrane was incubated in blocking buffer containing 5% non-fat dry milk (FUJIFILM Wako Pure Chemical) in PBS-T for 60 min at room temperature. Subsequently, the membrane was probed with rabbit antibodies against ezrin (3145s; Cell Signaling Technology), radixin (GTX105408; Gene Tex), or moesin (3150s; Cell Signaling Technology) at a dilution of 1:2000, or a horse radish peroxidase (HRP)-conjugated rabbit antibody against PD-L1 (51296s; Cell Signaling Technology) at a dilution of 1:1000, or a mouse antibody against glyceraldehyde-3-phosphate dehydrogenase (GAPDH) (MAB374; Merck, Darmstadt, Germany) at a dilution of 1:20,000 used as an internal control, in blocking buffer at 4 °C overnight. Then, blots were washed five times with PBS-T and incubated with HRP-conjugated secondary antibody against an anti-rabbit IgG (5220-0336; SeraCare Life Sciences, Milford, MA, USA) at a dilution of 1:10,000 for ezrin, radixin, and moesin, or that against an anti-mouse IgG (5220-0341; SeraCare Life Sciences) at a dilution of 1:10,000 for GAPDH in blocking buffer for 60 min at room temperature. After washing five times with PBS-T, the immune-reactive bands were visualised using ECL Prime Western Blotting Detection Reagent (Cytiva, Tokyo, Japan) followed by the detection and data analysis using the Light Capture instrument (ATTO, Tokyo, Japan) with the Image Analysis Software CS Analyzer (ATTO). All the original western blot images are shown in Figure S1.
2.8. Immunoprecipitation Assay
Total whole-cell lysate processed as described above was incubated with nProtein A Sepharose 4 Fast flow (Cytiva) for 60 min at 4 °C on a rotating wheel to remove non-specific binding proteins to nProtein A Sepharose. After nProtein A Sepharose was pelleted via centrifugation (3000× g, 4 °C for 1 min), the pre-cleaned supernatants of the whole-cell lysates were reacted overnight at 4 °C on a rotating wheel with a rabbit antibody against PD-L1 (13684s; Cell Signaling Technology) or its isotype control antibody (3900s; Cell Signaling Technology), both at a dilution of 1:30. Then, nProtein A Sepharose was added to the lysate followed by incubation at 4 °C for 3 h on a rotating wheel. The immunoprecipitated pellets were rinsed three times with RIPA buffer containing protease inhibitor cocktails followed by centrifugation (3000× g, 4 °C for 1 min), and subsequently re-suspended in 2× Laemmli buffer (Nacalai Tesque) and boiled at 97 °C for 5 min. The supernatant fractions were obtained by centrifugation (15,000× g, 4 °C for 1 min). The total cell lysates (input) were adjusted to protein amounts ranging from 1.5 to 6.0 µg/lane, depending on the target protein, and separated via SDS-PAGE. The following procedures for western blotting and analysis of chemiluminescence signals were performed as described in Section 2.7. The primary antibody only used for this section was a mouse antibody against β-actin (A1978; Merck) at a dilution of 1:10,000.
2.9. Statistical Analysis
Data are shown as the mean ± standard error of the mean (SEM). Statistical analysis was performed using Prism version 3 software (GraphPad Software, La Jolla, CA, USA). Statistical significance was evaluated by one-way analysis of variance (ANOVA) followed by Dunnett’s test for multiple comparisons. Differences were considered significant at p values of <0.05.
3. Results
3.1. Gene and Protein Expression Pattern of PD-L1 and ERM in KP-2 Cells
First, we examined the gene expression profiles of PD-L1 and ERM in a variety of human pancreatic cell lines registered in the public database of the Cancer Cell Line Encyclopedia (CCLE) [32] and the Cancer Dependency Map (DepMap) portal data explorer [33,34]. The database analysis showed that the relative mRNA expression levels of PD-L1, ezrin, and radixin in KP-2 cells were moderate to higher than those in other cells. By contrast, KP-2 cells had considerably lower levels of moesin (Figure 1a). Next, the relative mRNA and protein expression levels of PD-L1, ezrin, radixin, and moesin in KP-2 cells were measured using real-time RT-PCR or western blotting analysis, respectively. The mRNA expression levels of all genes were sufficient for gene expression analysis (Figure 1b). In addition to ezrin and radixin, the protein expression levels of PD-L1 were detected in whole cell lysates of KP-2 cells (Figure 1c). By contrast, moesin was undetectable at the protein level in whole cell lysates of KP-2 cells, but was strongly detected in HeLa cells, a human uterine cervical adenocarcinoma cell line used as a positive control in which moesin is present at high abundance [35,36], which is in accordance with the present results (Figure 1c). Note that the expression pattern of ERM in KP-2 cells is quite similar to that in human clinical PDAC tissues [37,38,39,40].
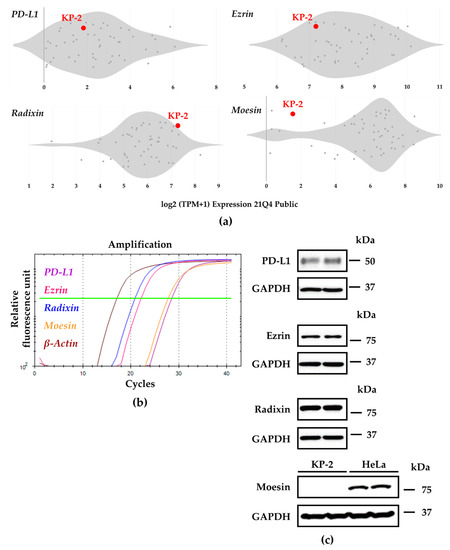
Figure 1.
Gene and protein expression profiles of programmed death ligand-1 (PD-L1), ezrin, radixin, and moesin (ERM) in KP-2 cell. (a) Relative gene expression patterns of PD-L1 and each ERM in various types of human pancreas cell lines evaluated by utilizing the Cancer Dependency Map (DepMap), Broad (2021): DepMap 21Q4 Public. Scatter plots show the expression levels (log2 (TPM + 1)) of four genes of interest in each human pancreas cell line. (b) Representative amplification curves of relative PD-L1 (purple line), ezrin (pink line), radixin (blue line), and moesin (orange line) as well as β-Actin (brown line) mRNA expressions in KP-2 cells as determined by real-time reverse transcription-polymerase chain reaction. (c) Representative images of western blots for detection of PD-L1, ezrin, radixin, moesin, and glyceraldehyde-3-phosphate dehydrogenase (GAPDH) proteins in whole-cell lysates of KP-2 cells. HeLa cells were included as positive control in which moesin protein is abundantly expressed. Molecular weights are indicated in kDa. The data are representative of three independent experiments using at least three independent samples of total RNA and protein extracts.
3.2. Plasma Membrane Localization of PD-L1 and ERM in KP-2 Cells
Subcellular localisation of PD-L1 and ERM proteins in KP-2 cells was evaluated by immunofluorescence CLSM analysis. None of fluorescence signals were observed in cells incubated with goat anti-rabbit IgG (H + L) secondary antibodies conjugated with an Alexa Fluor 488 or an Alexa Fluor 594 without primary antibodies against PD-L1 or each ERM (Figure S2). In this condition, the fluorescence signals of PD-L1, ezrin, and radixin were colocalised with F-actin, a representative cellular plasma membrane marker, in a highly correlated manner (Figure 2a–c), implying highly specific plasma membrane localisation of these proteins in KP-2 cells. By contrast, the fluorescence signal of moesin was hardly detectable in KP-2 cells (Figure 2d), whereas it was highly detected in HeLa cells (Figure S3). Interestingly, the results of double immunofluorescence staining analysis demonstrated that PD-L1 was highly colocalised with ezrin and radixin proteins, especially in the plasma membrane of KP-2 cells (Figure 3a,b).
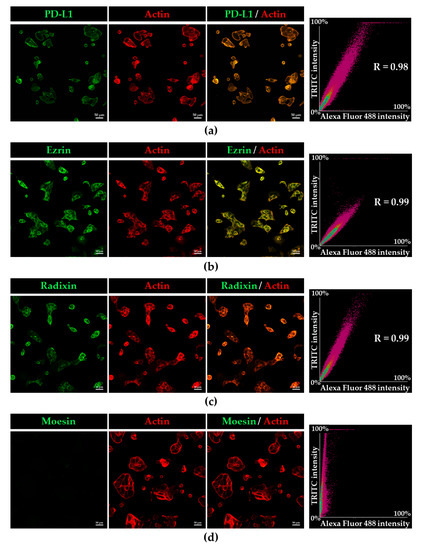
Figure 2.
Confocal laser scanning microscopy analysis for intracellular distribution of programmed death ligand-1 (PD-L1), ezrin, radixin, and moesin (ERM) in KP-2 cells. In a three-dimensional reconstruction of optically sectioned KP-2 cells, (a) PD-L1, (b) ezrin, and (c) radixin (green) labelled with Alexa Fluor 488, were highly colocalized with F-actin (red) labelled with phalloidin-conjugated to tetramethylrhodamine (TRITC). (d) Moesin (green) was hardly detectable in KP-2 cells. Scale bars: 50 μm. Right panels represent the correlation plot between Alexa Fluor 488-labelled PD-L1 or each ERM and TRITC-labelled F-actin. Each value in the plots was Pearson’s correlation coefficient. All data are representative of at least three independent experiments.
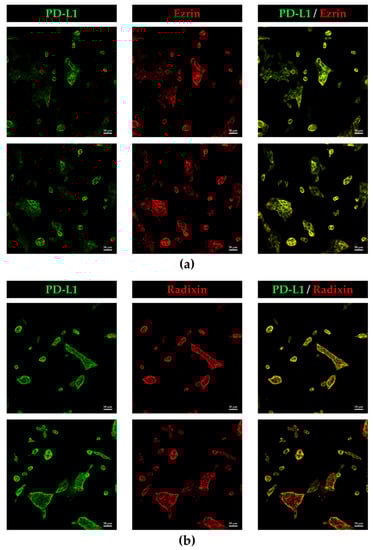
Figure 3.
Colocalization of programmed death ligand-1 (PD-L1) with ezrin and radixin in the plasma membrane of KP-2cells. In a three-dimensional reconstruction of optically sectioned KP-2 cells obtained by confocal laser scanning microscopy analysis, PD-L1 (green) labelled with Alexa Fluor 488 was highly colocalized with (a) ezrin and (b) radixin (red) labelled with Alexa Fluor 594, especially on the plasma membrane. Scale bars: 50 μm. All images are representative of at least three independent experiments.
3.3. Molecular Inteaction between PD-L1 and Ezrin and Radixin in KP-2 Cells
We next explored whether PD-L1 interacts with ezrin and radixin in KP-2 cells by co-immunoprecipitation assay. The protein expressions of ezrin, radixin, actin, and PD-L1 were all observed in the immunoprecipitates of KP-2 cells pulled down with an anti-PD-L1 antibody but not with a control IgG (Figure 4). These results indicate that PD-L1 intrinsically interacts with ezrin and radixin proteins in KP-2 cells.
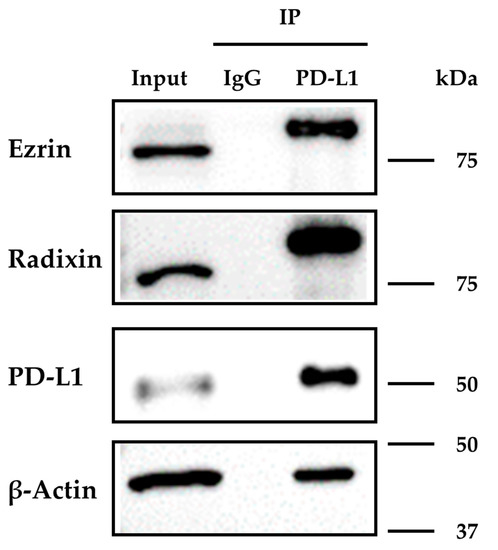
Figure 4.
Immunoprecipitation analysis to detect the molecular interactions of programmed death ligand-1 (PD-L1) with ezrin and radixin in KP-2 cells. The whole-cell lysates of KP-2 cells were immunoprecipitated with an anti-PD-L1 antibody or its isotype control antibody. Images of representative western blots for ezrin, radixin, β-Actin, and PD-L1 in the whole-cell lysates (input) and the immune precipitates (IP) pulled down with a control IgG or an anti-PD-L1 antibody. Molecular weights are indicated in kDa. The images are representative of three independent immunoprecipitation experiments using at least three independent replicates of protein extracts.
3.4. Effects of siRNAs for Ezrin and Radixin on the mRNA and Cell Surface Expression Levels of PD-L1 in KP-2 Cells
We investigated the effects of siRNAs targeting ezrin and radixin on the mRNA and cell surface expression levels of PD-L1 in KP-2 cells. Treatment with siRNAs against ezrin and radixin both greatly suppressed the mRNA and protein expression level of each target gene without any cytotoxicity (Figure S4). Under this condition, gene silencing of ezrin and PD-L1 both significantly reduced the relative mRNA expression levels of PD-L1 by approximately 35% or 75%, respectively. In contrast, treatment with siRNA against radixin had little impact on the mRNA expression levels of PD-L1 (Figure 5a). Next, we determined whether gene silencing of ezrin and radixin influences the cell surface expression of PD-L1 in KP-2 cells. The results of the flow cytometry analysis showed that siRNA against radixin significantly decreased the cell surface expressions of PD-L1 by approximately 35%, to a greater extent than ezrin siRNA did and to the same extent as PD-L1 siRNA (Figure 5b,c). Notably, the mRNA expression levels of interferon (IFN)-γ, tumour necrosis factor (TNF), and interleukin (IL)-6, all of which contribute to an inducible PD-L1 expression in the tumour, were decreased in the ezrin knockdown KP-2 cells (Figure 5d). Taken together, these observations suggest radixin may contribute to the plasma membrane localization of PD-L1, possibly via post-translational modification, whereas ezrin may modulate the transcriptional and/or post-translational process of PD-L1.
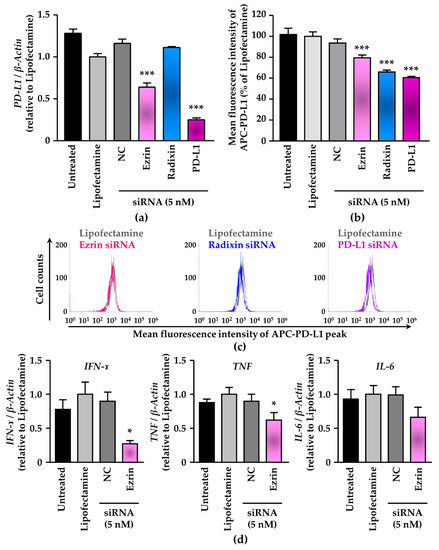
Figure 5.
Effect of siRNAs targeting ezrin and radixin, or the programmed death ligand-1 (PD-L1) on the mRNA and cell surface expression of PD-L1 in KP-2 cells. (a–c) Cells were incubated with the transfection medium (Untreated), transfection reagent (Lipofectamine), non-targeting control (NC) siRNA, and specific siRNAs for ezrin, radixin, or PD-L1 and then cultured for 4 days to measure the mRNA and the cell surface expressions of PD-L1 protein. (a) The mRNA expression level of PD-L1 normalized with β-Actin in cells from all treatment group relative to that from Lipofectamine alone was determined by real-time reverse transcription (RT)-polymerase chain reaction (PCR); n = 3, *** p < 0.001 vs. Lipofectamine. All data were expressed as the mean ± SEM and analysed by one-way ANOVA followed by Dunnett’s test. (b) The calculated mean fluorescence intensities of allophycocyanin (APC)-PD-L1 relative to Lipofectamine alone on the surface plasma membrane as quantified by flow cytometry are shown for all the treatments; n = 3, *** p < 0.001 vs. Lipofectamine. All data were expressed as the mean ± SEM and analysed by one-way ANOVA followed by Dunnett’s test. (c) An overlay of the representative histograms for the mean fluorescence intensity of APC-labelled PD-L1 on the surface plasma membrane of KP-2 cells treated with Lipofectamine (grey line), ezrin siRNA (pink line), radixin siRNA (blue line), and PD-L1 siRNA (purple line) as measured by flow cytometry. (d) Cells were treated with the transfection medium (Untreated), transfection reagent (Lipofectamine), nontargeting control (NC) siRNA, and specific siRNA for ezrin at the concentration of 5 nM, and then cultured for 4 days. The mRNA expression levels of interferon (IFN)-ɤ, tumour necrosis factor (TNF), and interleukin (IL)-6 mRNA normalized with β-Actin in cells treated with each siRNA relative to that in cells treated with the transfection reagent alone as determined by real-time RT-PCR. n = 3, * p < 0.05 vs. Lipofectamine. All data were expressed as the mean ± SEM and analysed by one-way ANOVA followed by Dunnett’s test.
3.5. Gene Correlation Analysis of PD-L1 with Ezrin and Radixin in Human Pancreatic Ductal Adenocarcinoma Tissue
To further clarify the relationship between PD-L1 and ezrin/radixin in human PDAC tissue, we performed a gene correlation analysis of PD-L1 with ezrin and radixin in PDAC samples from The Cancer Genome Atlas (TGCA) database [41] using UALCAN, a comprehensive and interactive web resource for in-depth analysis of cancer OMICS data [42]. Gene correlation analysis revealed a significant positive correlation between PD-L1 and radixin (Pearson’s correlation coefficient: 0.54) (Figure 6), but there was no correlation between PD-L1 and ezrin.
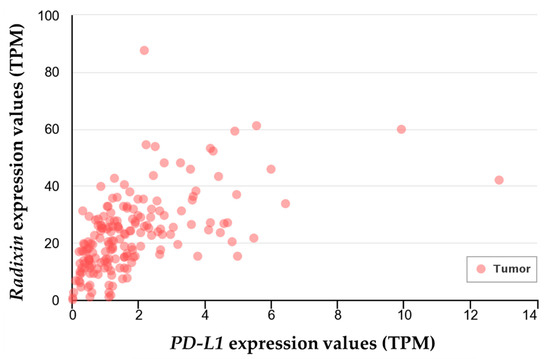
Figure 6.
Gene-correlation analysis between programmed death ligand-1 (PD-L1) and radixin in human pancreatic ductal adenocarcinoma tissues. Correlation analysis for the gene expression of PD-L1 and radixin was performed in the clinical pancreatic ductal adenocarcinoma samples (n = 178) from The Cancer Genome Atlas (TGCA) database using the publicly available online tool UALCAN. The estimated gene expression values based on RNA-seq data are presented as transcripts per million (TPM).
4. Discussion
In this study, we observed that in KP-2 cells, detectable mRNA and protein expression levels of PD-L1, ezrin, and radixin, but undetectable of moesin at the protein level. Several recent reports showed weak to moderate expression levels of PD-L1 in 14 human pancreatic cancer cell lines, including KP-2 cells [43] and in the clinical PDAC tissues [44,45]. Similarly, characterisation studies of ERM expression profiles using several human PDAC cell lines revealed that all three ERMs were strongly expressed at the mRNA and protein levels. Meanwhile, the clinical human PDAC tissues showed highly positive staining for ezrin and radixin but not for moesin [37,38,39,40], as had the KP-2 cells. More importantly, Abiatari et al. found that the mRNA and protein expression of moesin was observed in eight human pancreatic cancer cell lines, including Aspc1, BxPc3, Capan1, Colo375, MiaPaca2, Panc-1, SU8686, and T3M4, but were absent in the freshly isolated primary human PDAC, the results of which are in line with those observed in the clinical PDAC tissues, and therefore concluded that PDAC cell lines might gain moesin expression under long-term culture conditions [39]. Furthermore, our CLSM analysis data clearly implied that the fluorescence signals of PD-L1, ezrin, and radixin were specifically distributed in the plasma membrane, resulting in the colocalisation of PD-L1 with ezrin and radixin, but those of moesin were hardly detectable in KP-2 cells. Taken together, KP-2 cells carry a characteristic profile of PD-L1 and ERM expression similar to that of primary human PDAC and human clinical PDAC tissues, providing an ideal model to study the role of ERM proteins in the regulatory mechanism of PD-L1 expression in human PDAC cells.
A growing body of evidence has demonstrated that PD-L1 expression is intricately regulated by various processes such as gene transcription, post-transcriptional and post-translational modifications, and exosomal trafficking [16,46]. In particular, post-translational modification of PD-L1 has attracted attention because of its ability to affect the plasma membrane localisation and functionality of PD-L1 [17,18,46]. ERM proteins play a pivotal role in the cell surface localisation and functional activity of several cancer-related transmembrane proteins by anchoring them to the plasma membrane via post-translational modification [21,23,25,28]. We recently reported that ezrin functions as a scaffold protein for PD-L1, which leads to the cell surface localisation of PD-L1 in human uterine cervical adenocarcinoma HeLa cells and human choriocarcinoma JEG-3 cells, both of which have the highest expression level of ezrin among ERM protein based on the database analysis utilizing DepMap and/or our experimental data [29,30]. Furthermore, we have found that in human colon adenocarcinoma LS180 cells, ezrin and radixin contributed equally to the cell surface localisation of PD-L1 via physiological interaction and colocalisation with PD-L1, despite extremely low expression level of radixin in LS180 cells [31]. By contrast, another group has shown that moesin interacts with and stabilises PD-L1 in the cell surface membrane by preventing the proteasomal degradation of PD-L1 in human breast cancer adenocarcinoma, MDA-MB-231, though the influence of ezrin and radixin gene suppression remains to be determined [47]. Similarly, the present immunoprecipitation assay indicated, for the first time, that PD-L1 intrinsically interacts with ezrin and radixin in KP-2 cells. Furthermore, gene silencing of radixin greatly decreased the cell surface expression level of PD-L1 with no impact on its mRNA level in KP-2 cells. These results were further supported by the fact that clinical human PDAC samples from the TGCA database showed a significant positive correlation between PD-L1 and radixin in tumour tissue. The differences in the ERM proteins responsible for the cell surface localisation of PD-L1 may be attributed, at least in part, to the characteristic feature of ERM expression profile depending on the cancer cell type. Accumulating evidence suggests that radixin principally regulates the surface plasma membrane localisation of numerous drug transporters including multidrug resistance protein 2, presumably because radixin is dominantly expressed in the hepatic tissues and cells among ERM proteins [48,49,50,51,52,53]. Therefore, radixin may primarily contribute to the cell surface localisation of PD-L1 in KP-2 cells as a predominant ERM protein, as is the case with ezrin in HeLa, JEG-3, and LS180 cells we have recently reported [29,30,31]. This issue has yet to be unravelled and should be addressed in future studies.
Contrary to our expectation, ezrin knockdown moderately decreased PD-L1 expression not only at the cell surface level but also at the mRNA level. The pro-inflammatory cytokines such as IFN-γ, TNF-α, and IL-6 contribute to an inducible PD-L1 expression in the tumour [8,16,54,55]. Ghaffari et al. found that ezrin depletion diminished IL-6 expression levels and that overexpression of ezrin increased IL-6 production in human breast cancer cells, implying a role of ezrin in regulating IL-6 expression [56]. In fact, gene silencing of ezrin decreased the mRNA expression levels of IFN-γ, TNF, and IL-6 in KP-2 cells. Together, these observations raise the possibility that knockdown of the ezrin gene may downregulate the mRNA expression levels of pro-inflammatory cytokines, which in turn decreases the mRNA expression level of PD-L1, resulting in a decrease in the cell surface expression of PD-L1 in KP-2 cells.
In summary, we found colocalisation and protein-protein interaction of PD-L1 with ezrin and radixin in the cell surface membrane of KP-2 cells. Additionally, ezrin might modulate the cell surface localisation of PD-L1, possibly mediated by transcriptional and/or post-translational processes, whereas radixin may serve as an essential scaffold protein primarily responsible for the cell surface localisation of PD-L1 in KP-2 cells exclusively via the post-translational modification process (Figure 7).
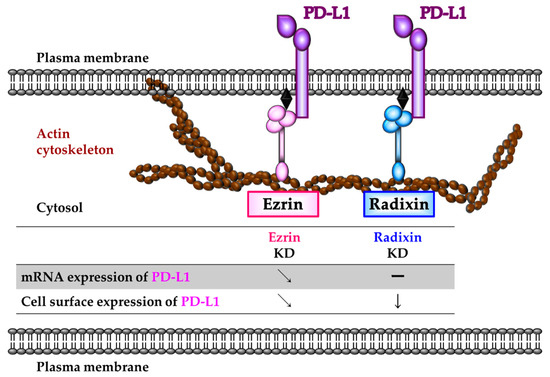
Figure 7.
Schematic representation illustrating the role of ezrin and radixin protein in the regulatory mechanism of programmed death ligand-1 (PD-L1) expression in KP-2 cells. Ezrin may modulate the transcriptional and/or post-translational process of PD-L1. Radixin may contribute to the plasma membrane localization of PD-L1 to a greater extent than did ezrin, possibly through the protein–protein interaction, with little influences on the mRNA levels of PD-L1 in KP-2 cells. Therefore, radixin may function as essential scaffold protein primarily responsible for the cell surface localization of PD-L1 in KP-2 cells.
5. Conclusions
The present study demonstrates that in KP-2 cells ezrin and radixin, but not moesin, are expressed at both mRNA and protein levels, and are preferentially localised in the plasma membrane, where both ezrin and radixin are highly colocalised and interact with PD-L1. Gene silencing experiments indicate that ezrin modulates the cell surface expression of PD-L1 due to changes in PD-L1 transcription and that radixin serves as an essential scaffold protein crosslinking between PD-L1 and the actin cytoskeleton, contributing to the cell surface localisation of PD-L1, exclusively by a post-translational modification process without changes in the transcriptional process. Thus, modulating the cell surface localisation of PD-L1 by specific inhibition targeting ezrin and/or radixin may provide a novel treatment option to improve the efficacy of current ICB therapies in PDAC.
Supplementary Materials
The following are available online at https://www.mdpi.com/article/10.3390/immuno2010006/s1, Figure S1: Original western blotting images of target proteins in KP-2 cells, Figure S2: Negative fluorescence staining for KP-2 cells in confocal laser scanning microscopy analysis, Figure S3: Counterstaining of moesin with actin in HeLa cells, Figure S4: RNA interference of ezrin and radixin effectively reduced each target gene and protein without cytotoxicity in KP-2 cells.
Author Contributions
Conceptualisation, T.K. and T.O.; methodology, T.K., C.T. and M.T.; validation, T.K., R.D., H.I., Y.I., R.O., C.T. and M.T.; formal analysis, T.K.; investigation, T.K., R.D., H.I., Y.I., R.O., C.T. and M.T.; resources, T.I. and Y.U.; data curation, T.K., R.D., H.I., Y.I., R.O., C.T. and M.T.; writing—original draft preparation, T.K.; writing—review and editing, T.K., R.D., H.I., Y.I., R.O., C.T., M.T., Y.U., T.I. and T.O.; visualisation, T.K. and R.D.; supervision, T.O.; project administration, T.K. and T.O.; funding acquisition, T.K. and T.I. All authors have read and agreed to the published version of the manuscript.
Funding
This research was funded by the Osaka Ohtani University Research Foundation (to T.K.), the Sugiura Memorial Foundation (to T.K.), JSPS KAKENHI Grant Number JP20K07118 (to T.I.), and a grant from the Kobayashi Foundation (to T.I.).
Institutional Review Board Statement
Not applicable.
Informed Consent Statement
Not applicable.
Data Availability Statement
The datasets used and analysed during this study are available from DepMap, Broad (2021): DepMap 21Q4 Public. figshare. Dataset (https://doi.org/10.6084/m9.figshare.16924132.v1), The Cancer Genome Atlas (https://www.cancer.gov/about-nci/organization/ccg/research/structural-genomics/tcga, accessed on 28 December 2021) and UALCAN (http://ualcan.path.uab.edu/analysis.html, accessed on 1 December 2021). Other data are contained within the article and supplementary material.
Acknowledgments
The authors acknowledge the efforts of all researchers who have contributed the data to the public databases of CCLE, DepMap, TGCA, and UALCAN. The interpretation and reporting of these data are the sole responsibility of the authors.
Conflicts of Interest
The authors declare no conflict of interest.
References
- Sung, H.; Ferlay, J.; Siegel, R.L.; Laversanne, M.; Soerjomataram, I.; Jemal, A.; Bray, F. Global Cancer Statistics 2020: GLOBOCAN Estimates of Incidence and Mortality Worldwide for 36 Cancers in 185 Countries. CA Cancer J. Clin. 2021, 71, 209–249. [Google Scholar] [CrossRef] [PubMed]
- Park, S.K.; Oh, C.M.; Kim, M.H.; Ha, E.; Choi, Y.S.; Ryoo, J.H. Metabolic syndrome, metabolic components, and their relation to the risk of pancreatic cancer. Cancer 2020, 126, 1979–1986. [Google Scholar] [CrossRef] [PubMed]
- Nattress, C.B.; Hallden, G. Advances in oncolytic adenovirus therapy for pancreatic cancer. Cancer Lett. 2018, 434, 56–69. [Google Scholar] [CrossRef]
- McGuigan, A.; Kelly, P.; Turkington, R.C.; Jones, C.; Coleman, H.G.; McCain, R.S. Pancreatic cancer: A review of clinical diagnosis, epidemiology, treatment and outcomes. World J. Gastroenterol. 2018, 24, 4846–4861. [Google Scholar] [CrossRef]
- Ettrich, T.J.; Seufferlein, T. Systemic Therapy for Metastatic Pancreatic Cancer. Curr. Treat. Options Oncol. 2021, 22, 106. [Google Scholar] [CrossRef]
- Kibe, S.; Ohuchida, K.; Ando, Y.; Takesue, S.; Nakayama, H.; Abe, T.; Endo, S.; Koikawa, K.; Okumura, T.; Iwamoto, C.; et al. Cancer-associated acinar-to-ductal metaplasia within the invasive front of pancreatic cancer contributes to local invasion. Cancer Lett. 2019, 444, 70–81. [Google Scholar] [CrossRef] [PubMed]
- Wang, J.; Zhu, Y.; Chen, J.; Yang, Y.; Zhu, L.; Zhao, J.; Yang, Y.; Cai, X.; Hu, C.; Rosell, R.; et al. Identification of a novel PAK1 inhibitor to treat pancreatic cancer. Acta Pharm. Sin. B 2020, 10, 603–614. [Google Scholar] [CrossRef]
- Yi, M.; Niu, M.; Xu, L.; Luo, S.; Wu, K. Regulation of PD-L1 expression in the tumor microenvironment. J. Hematol. Oncol. 2021, 14, 10. [Google Scholar] [CrossRef]
- Tu, X.; Qin, B.; Zhang, Y.; Zhang, C.; Kahila, M.; Nowsheen, S.; Yin, P.; Yuan, J.; Pei, H.; Li, H.; et al. PD-L1 (B7-H1) Competes with the RNA Exosome to Regulate the DNA Damage Response and Can Be Targeted to Sensitize to Radiation or Chemotherapy. Mol. Cell 2019, 74, 1215–1226. [Google Scholar] [CrossRef]
- Rossi, J.F.; Ceballos, P.; Lu, Z.Y. Immune precision medicine for cancer: A novel insight based on the efficiency of immune effector cells. Cancer Commun. 2019, 39, 34. [Google Scholar] [CrossRef]
- Qin, W.; Hu, L.; Zhang, X.; Jiang, S.; Li, J.; Zhang, Z.; Wang, X. The Diverse Function of PD-1/PD-L Pathway Beyond Cancer. Front. Immunol. 2019, 10, 2298. [Google Scholar] [CrossRef]
- Robert, C. A decade of immune-checkpoint inhibitors in cancer therapy. Nat. Commun. 2020, 11, 3801. [Google Scholar] [CrossRef]
- Feng, M.; Xiong, G.; Cao, Z.; Yang, G.; Zheng, S.; Song, X.; You, L.; Zheng, L.; Zhang, T.; Zhao, Y. PD-1/PD-L1 and immunotherapy for pancreatic cancer. Cancer Lett. 2017, 407, 57–65. [Google Scholar] [CrossRef] [PubMed]
- Foley, K.; Kim, V.; Jaffee, E.; Zheng, L. Current progress in immunotherapy for pancreatic cancer. Cancer Lett. 2016, 381, 244–251. [Google Scholar] [CrossRef]
- Jain, T.; Dudeja, V. The war against pancreatic cancer in 2020—Advances on all fronts. Nat. Rev. Gastroenterol. Hepatol. 2021, 18, 99–100. [Google Scholar] [CrossRef] [PubMed]
- Cha, J.H.; Chan, L.C.; Li, C.W.; Hsu, J.L.; Hung, M.C. Mechanisms Controlling PD-L1 Expression in Cancer. Mol. Cell 2019, 76, 359–370. [Google Scholar] [CrossRef]
- Wang, Y.N.; Lee, H.H.; Hsu, J.L.; Yu, D.; Hung, M.C. The impact of PD-L1 N-linked glycosylation on cancer therapy and clinical diagnosis. J. Biomed. Sci. 2020, 27, 77. [Google Scholar] [CrossRef] [PubMed]
- Li, S.M.; Zhou, J.; Wang, Y.; Nie, R.C.; Chen, J.W.; Xie, D. Recent Findings in the Posttranslational Modifications of PD-L1. J. Oncol. 2020, 2020, 5497015. [Google Scholar] [CrossRef]
- Mezzadra, R.; Sun, C.; Jae, L.T.; Gomez-Eerland, R.; de Vries, E.; Wu, W.; Logtenberg, M.E.W.; Slagter, M.; Rozeman, E.A.; Hofland, I.; et al. Identification of CMTM6 and CMTM4 as PD-L1 protein regulators. Nature 2017, 549, 106–110. [Google Scholar] [CrossRef]
- Burr, M.L.; Sparbier, C.E.; Chan, Y.C.; Williamson, J.C.; Woods, K.; Beavis, P.A.; Lam, E.Y.N.; Henderson, M.A.; Bell, C.C.; Stolzenburg, S.; et al. CMTM6 maintains the expression of PD-L1 and regulates anti-tumour immunity. Nature 2017, 549, 101–105. [Google Scholar] [CrossRef] [PubMed]
- Ogihara, T.; Mizoi, K.; Kamioka, H.; Yano, K. Physiological Roles of ERM Proteins and Transcriptional Regulators in Supporting Membrane Expression of Efflux Transporters as Factors of Drug Resistance in Cancer. Cancers 2020, 12, 3352. [Google Scholar] [CrossRef]
- Kobori, T.; Harada, S.; Nakamoto, K.; Tokuyama, S. Mechanisms of P-glycoprotein alteration during anticancer treatment: Role in the pharmacokinetic and pharmacological effects of various substrate drugs. J. Pharmacol. Sci. 2014, 125, 242–254. [Google Scholar] [CrossRef] [PubMed]
- Luciani, F.; Molinari, A.; Lozupone, F.; Calcabrini, A.; Lugini, L.; Stringaro, A.; Puddu, P.; Arancia, G.; Cianfriglia, M.; Fais, S. P-glycoprotein-actin association through ERM family proteins: A role in P-glycoprotein function in human cells of lymphoid origin. Blood 2002, 99, 641–648. [Google Scholar] [CrossRef] [PubMed]
- Kawaguchi, K.; Yoshida, S.; Hatano, R.; Asano, S. Pathophysiological Roles of Ezrin/Radixin/Moesin Proteins. Biol. Pharm. Bull. 2017, 40, 381–390. [Google Scholar] [CrossRef] [PubMed]
- Asp, N.; Kvalvaag, A.; Sandvig, K.; Pust, S. Regulation of ErbB2 localization and function in breast cancer cells by ERM proteins. Oncotarget 2016, 7, 25443–25460. [Google Scholar] [CrossRef] [PubMed]
- Rudnicka, D.; Oszmiana, A.; Finch, D.K.; Strickland, I.; Schofield, D.J.; Lowe, D.C.; Sleeman, M.A.; Davis, D.M. Rituximab causes a polarization of B cells that augments its therapeutic function in NK-cell-mediated antibody-dependent cellular cytotoxicity. Blood 2013, 121, 4694–4702. [Google Scholar] [CrossRef] [PubMed]
- Clucas, J.; Valderrama, F. ERM proteins in cancer progression. J. Cell Sci. 2014, 127, 267–275. [Google Scholar] [CrossRef]
- Faure, C.; Djerbi-Bouillie, R.; Domingot, A.; Bouzinba-Segard, H.; Taouji, S.; Saidi, Y.; Bernard, S.; Carallis, F.; Rothe-Walther, R.; Lenormand, J.L.; et al. Allosteric Inhibition of HER2 by Moesin-Mimicking Compounds Targets HER2-Positive Cancers and Brain Metastases. Cancer Res. 2021, 81, 5464–5476. [Google Scholar] [CrossRef]
- Tameishi, M.; Kobori, T.; Tanaka, C.; Urashima, Y.; Ito, T.; Obata, T. Contribution of Ezrin on the Cell Surface Plasma Membrane Localization of Programmed Cell Death Ligand-1 in Human Choriocarcinoma JEG-3 Cells. Pharmaceuticals 2021, 14, 963. [Google Scholar] [CrossRef]
- Tanaka, C.; Kobori, T.; Tameishi, M.; Urashima, Y.; Ito, T.; Obata, T. Ezrin Modulates the Cell Surface Expression of Programmed Cell Death Ligand-1 in Human Cervical Adenocarcinoma Cells. Molecules 2021, 26, 5648. [Google Scholar] [CrossRef]
- Kobori, T.; Tanaka, C.; Tameishi, M.; Urashima, Y.; Ito, T.; Obata, T. Role of Ezrin/Radixin/Moesin in the Surface Localization of Programmed Cell Death Ligand-1 in Human Colon Adenocarcinoma LS180 Cells. Pharmaceuticals 2021, 14, 864. [Google Scholar] [CrossRef]
- Barretina, J.; Caponigro, G.; Stransky, N.; Venkatesan, K.; Margolin, A.A.; Kim, S.; Wilson, C.J.; Lehar, J.; Kryukov, G.V.; Sonkin, D.; et al. The Cancer Cell Line Encyclopedia enables predictive modelling of anticancer drug sensitivity. Nature 2012, 483, 603–607. [Google Scholar] [CrossRef]
- Meyers, R.M.; Bryan, J.G.; McFarland, J.M.; Weir, B.A.; Sizemore, A.E.; Xu, H.; Dharia, N.V.; Montgomery, P.G.; Cowley, G.S.; Pantel, S.; et al. Computational correction of copy number effect improves specificity of CRISPR-Cas9 essentiality screens in cancer cells. Nat. Genet. 2017, 49, 1779–1784. [Google Scholar] [CrossRef]
- Tsherniak, A.; Vazquez, F.; Montgomery, P.G.; Weir, B.A.; Kryukov, G.; Cowley, G.S.; Gill, S.; Harrington, W.F.; Pantel, S.; Krill-Burger, J.M.; et al. Defining a Cancer Dependency Map. Cell 2017, 170, 564–576.e516. [Google Scholar] [CrossRef] [PubMed]
- Ferreira, E.R.; Bonfim-Melo, A.; Cordero, E.M.; Mortara, R.A. ERM Proteins Play Distinct Roles in Cell Invasion by Extracellular Amastigotes of Trypanosoma cruzi. Front. Microbiol. 2017, 8, 2230. [Google Scholar] [CrossRef] [PubMed]
- Zaman, R.; Lombardo, A.; Sauvanet, C.; Viswanatha, R.; Awad, V.; Bonomo, L.E.; McDermitt, D.; Bretscher, A. Effector-mediated ERM activation locally inhibits RhoA activity to shape the apical cell domain. J. Cell Biol. 2021, 220, e202007146. [Google Scholar] [CrossRef]
- Piao, J.; Liu, S.; Xu, Y.; Wang, C.; Lin, Z.; Qin, Y.; Liu, S. Ezrin protein overexpression predicts the poor prognosis of pancreatic ductal adenocarcinomas. Exp. Mol. Pathol. 2015, 98, 1–6. [Google Scholar] [CrossRef]
- Xu, J.; Zhang, W. EZR promotes pancreatic cancer proliferation and metastasis by activating FAK/AKT signaling pathway. Cancer Cell Int. 2021, 21, 521. [Google Scholar] [CrossRef]
- Abiatari, I.; Esposito, I.; Oliveira, T.D.; Felix, K.; Xin, H.; Penzel, R.; Giese, T.; Friess, H.; Kleeff, J. Moesin-dependent cytoskeleton remodelling is associated with an anaplastic phenotype of pancreatic cancer. J. Cell. Mol. Med. 2010, 14, 1166–1179. [Google Scholar] [CrossRef] [PubMed]
- Chen, S.D.; Song, M.M.; Zhong, Z.Q.; Li, N.; Wang, P.L.; Cheng, S.; Bai, R.X.; Yuan, H.S. Knockdown of radixin by RNA interference suppresses the growth of human pancreatic cancer cells in vitro and in vivo. Asian Pac. J. Cancer Prev. 2012, 13, 753–759. [Google Scholar] [CrossRef]
- Cancer Genome Atlas Network. Comprehensive molecular characterization of human colon and rectal cancer. Nature 2012, 487, 330–337. [Google Scholar] [CrossRef] [PubMed]
- Chandrashekar, D.S.; Bashel, B.; Balasubramanya, S.A.H.; Creighton, C.J.; Ponce-Rodriguez, I.; Chakravarthi, B.; Varambally, S. UALCAN: A Portal for Facilitating Tumor Subgroup Gene Expression and Survival Analyses. Neoplasia 2017, 19, 649–658. [Google Scholar] [CrossRef] [PubMed]
- Ashizawa, T.; Iizuka, A.; Maeda, C.; Tanaka, E.; Kondou, R.; Miyata, H.; Sugino, T.; Kawata, T.; Deguchi, S.; Mitsuya, K.; et al. Impact of combination therapy with anti-PD-1 blockade and a STAT3 inhibitor on the tumor-infiltrating lymphocyte status. Immunol. Lett. 2019, 216, 43–50. [Google Scholar] [CrossRef]
- Wang, C.; Li, X.; Zhang, L.; Chen, Y.; Dong, R.; Zhang, J.; Zhao, J.; Guo, X.; Yang, G.; Li, Y.; et al. miR-194-5p down-regulates tumor cell PD-L1 expression and promotes anti-tumor immunity in pancreatic cancer. Int. Immunopharmacol. 2021, 97, 107822. [Google Scholar] [CrossRef]
- Yin, H.; Pu, N.; Chen, Q.; Zhang, J.; Zhao, G.; Xu, X.; Wang, D.; Kuang, T.; Jin, D.; Lou, W.; et al. Gut-derived lipopolysaccharide remodels tumoral microenvironment and synergizes with PD-L1 checkpoint blockade via TLR4/MyD88/AKT/NF-kappaB pathway in pancreatic cancer. Cell Death Dis. 2021, 12, 1033. [Google Scholar] [CrossRef] [PubMed]
- Hu, X.; Lin, Z.; Wang, Z.; Zhou, Q. Emerging role of PD-L1 modification in cancer immunotherapy. Am. J. Cancer Res. 2021, 11, 3832–3840. [Google Scholar]
- Meng, F.; Su, Y.; Xu, B. Rho-associated protein kinase-dependent moesin phosphorylation is required for PD-L1 stabilization in breast cancer. Mol. Oncol. 2020, 14, 2701–2712. [Google Scholar] [CrossRef] [PubMed]
- Kawase, A.; Inoue, Y.; Nakazaki, S.; Koizumi, E.; Iwaki, M. Radixin knockdown improves the accumulation and efficiency of methotrexate in tumor cells. Oncol. Rep. 2019, 42, 283–290. [Google Scholar] [CrossRef]
- Kawase, A.; Sakata, M.; Yada, N.; Nakasaka, M.; Shimizu, T.; Kato, Y.; Iwaki, M. Decreased radixin function for ATP-binding cassette transporters in liver in adjuvant-induced arthritis rats. J. Pharm. Sci. 2014, 103, 4058–4065. [Google Scholar] [CrossRef]
- Kojima, H.; Sakurai, S.; Uemura, M.; Kitamura, K.; Kanno, H.; Nakai, Y.; Fukui, H. Disturbed colocalization of multidrug resistance protein 2 and radixin in human cholestatic liver diseases. J. Gastroenterol. Hepatol. 2008, 23, e120–e128. [Google Scholar] [CrossRef]
- Kojima, H.; Nies, A.T.; Konig, J.; Hagmann, W.; Spring, H.; Uemura, M.; Fukui, H.; Keppler, D. Changes in the expression and localization of hepatocellular transporters and radixin in primary biliary cirrhosis. J. Hepatol. 2003, 39, 693–702. [Google Scholar] [CrossRef]
- Kikuchi, S.; Hata, M.; Fukumoto, K.; Yamane, Y.; Matsui, T.; Tamura, A.; Yonemura, S.; Yamagishi, H.; Keppler, D.; Tsukita, S. Radixin deficiency causes conjugated hyperbilirubinemia with loss of Mrp2 from bile canalicular membranes. Nat. Genet. 2002, 31, 320–325. [Google Scholar] [CrossRef] [PubMed]
- Kano, T.; Wada, S.; Morimoto, K.; Kato, Y.; Ogihara, T. Effect of knockdown of ezrin, radixin, and moesin on P-glycoprotein function in HepG2 cells. J. Pharm. Sci. 2011, 100, 5308–5314. [Google Scholar] [CrossRef] [PubMed]
- Chan, L.C.; Li, C.W.; Xia, W.; Hsu, J.M.; Lee, H.H.; Cha, J.H.; Wang, H.L.; Yang, W.H.; Yen, E.Y.; Chang, W.C.; et al. IL-6/JAK1 pathway drives PD-L1 Y112 phosphorylation to promote cancer immune evasion. J. Clin. Investig. 2019, 129, 3324–3338. [Google Scholar] [CrossRef]
- Xu, L.; Chen, X.; Shen, M.; Yang, D.R.; Fang, L.; Weng, G.; Tsai, Y.; Keng, P.C.; Chen, Y.; Lee, S.O. Inhibition of IL-6-JAK/Stat3 signaling in castration-resistant prostate cancer cells enhances the NK cell-mediated cytotoxicity via alteration of PD-L1/NKG2D ligand levels. Mol. Oncol. 2018, 12, 269–286. [Google Scholar] [CrossRef] [PubMed]
- Ghaffari, A.; Hoskin, V.; Szeto, A.; Hum, M.; Liaghati, N.; Nakatsu, K.; LeBrun, D.; Madarnas, Y.; Sengupta, S.; Elliott, B.E. A novel role for ezrin in breast cancer angio/lymphangiogenesis. Breast Cancer Res. 2014, 16, 438. [Google Scholar] [CrossRef] [PubMed]
Publisher’s Note: MDPI stays neutral with regard to jurisdictional claims in published maps and institutional affiliations. |
© 2022 by the authors. Licensee MDPI, Basel, Switzerland. This article is an open access article distributed under the terms and conditions of the Creative Commons Attribution (CC BY) license (https://creativecommons.org/licenses/by/4.0/).