Article

Overlapping Gene Expression and Molecular Features in High-Grade B-Cell Lymphoma

by
Katharina D. Faißt
1,†,
Cora C. Husemann
1,2,3,†,
Karsten Kleo
1,
Monika Twardziok
1 and
Michael Hummel
1,2,3,*
1
Institute of Pathology, Charité—Universitätsmedizin Berlin, Corporate Member of Freie Universität Berlin, Humboldt-Universität zu Berlin, 10117 Berlin, Germany
2
German Cancer Consortium (DKTK), Partner Site Berlin, 10117 Berlin, Germany
3
German Cancer Research Center (DKFZ), 69120 Heidelberg, Germany
*
Author to whom correspondence should be addressed.
These authors contributed equally to this work.
J. Mol. Pathol. 2024, 5(4), 415-436; https://doi.org/10.3390/jmp5040028
Submission received: 21 August 2024 / Revised: 18 September 2024 / Accepted: 29 September 2024 / Published: 30 September 2024

Abstract

:
Aggressive B-cell lymphoma encompasses Burkitt lymphoma (BL), diffuse large B-cell lymphoma (DLBCL), and, as per the 2016 WHO classification, high-grade B-cell lymphoma (HGBL) not otherwise specified (NOS) and HGBL double/triple hit (DH/TH). However, the diagnostic distinction of HGBL from BL and DLBCL is difficult by means of histology/immunostaining in a substantial number of patients. This study aimed to improve subtyping by the identification of molecular features of aggressive B-cell lymphomas, with a specific focus on HGBL. To this end, we performed a comprehensive gene expression and mutational pattern analysis as well as the detection of B-cell clonality of 34 cases diagnosed with BL (n = 4), DLBCL (n = 16), HGBL DH (n = 8), and HGBL NOS (n = 6). Three distinct molecular subgroups were identified based on gene expression, primarily influenced by MYC expression/translocation and cell proliferation. In HGBL, compared to BL, there was an upregulation of PRKAR2B and TERT. HGBL DH exhibited elevated expression of GAMT and SMIM14, while HGBL NOS showed increased expression of MIR155HG and LZTS1. Our gene mutation analysis revealed MYC, ARID1A, BCL2, KMT2D, and PIM1 as the most affected genes in B-cell lymphoma, with BCL2 and CREBBP predominant in HGBL DH, and MYC and PIM1 in HGBL NOS. Clonality analysis of immunoglobulin heavy and light chain rearrangements did not show distinguishable V- or J-usage between the diagnostic subgroups.

1. Introduction

Lymphomas, including Hodgkin lymphoma and non-Hodgkin lymphoma (NHL), represent a very heterogeneous group of lymphoproliferative malignancies. NHL is mainly classified according to cell type, immunophenotype, location, and tumor grade, as well as clinical features [1,2]. Aggressive mature B-cell lymphomas (BCL) comprise Burkitt lymphoma (BL), diffuse large B-cell lymphoma (DLBCL), and high-grade B-cell lymphoma (HGBL). Formerly, the WHO also included the category of B-cell lymphoma, unclassifiable, with features intermediate between DLBCL and Burkitt lymphoma (BCLU), but in the revision of 2016, this entity was replaced by two subtypes of HGBL: HGBL associated with MYC- and BCL2- and/or BCL6-rearrangements (“HGBL double-hit (DH)/triple-hit (TH)”), and HGBL without any MYC- and BCL2- and/or BCL6-rearrangement (“HGBL not otherwise specified (NOS)”) [3,4]. The fifth edition of the WHO classification has introduced several updates for mature B-cell neoplasms, particularly in the molecular subtyping of aggressive B-cell lymphomas. The definition of HGBL NOS remains mostly the same, with a greater focus on differentiating it from other aggressive lymphomas, especially those involving MYC rearrangements [5].
BL is an aggressive BCL known for its extremely high proliferation rate [6,7] and a consistent translocation of affecting the MYC gene on chromosome 8 in conjunction with immunoglobulin (IG) chain genes, mainly the IG heavy chain gene [8,9]. Gene expression profiles of BL and DLBCL are distinct, although MYC translocations can occur in DLBCL [6,7].
The distinction between BL, DLBCL, HGBL DH, and HGBL NOS and their distinction from other types of lymphoma (Plasmablastic lymphoma, Follicular lymphoma (FL) 3B, and others) based on morphological and immunophenotypical characteristics is challenging in a number of cases. HGBL DH has already been described, but a sufficient representation of HGBL NOS concerning pathology as well as clinical and morphological features is still missing [10,11,12,13]. An accurate method to precisely categorize the subtypes of HGBL is lacking. Molecular subgroups independent of histopathological diagnosis and immunophenotypical characteristics may help to bridge this gap. The need for ongoing research to address critical questions regarding the molecular mechanisms underlying these lymphomas, as well as a refinement of the definitions of HGBL to improve diagnostic accuracy and prognostic stratification, has also been described in the fifth edition of the WHO classification [5].
We recently reported a molecular classification of MYC-driven aggressive mature B-cell lymphoma based on the mutational status of nine cell cycle genes (BTG1, BTG2, CCND3, CDKN2A, ID3, MAX, MYC, TCF3, and TP53) and identified four molecular categories that highly correlated with the Ki-67 index being mostly independent of histopathological diagnosis [14].
In this study, we limited our approach for a better distinction of BL, DLBCL, and HGBL and, therefore, expanded our previous data by examining the gene expression profiles of 298 lymphoma-specific genes paired with the mutational status of 25 lymphoma-associated genes and IG gene rearrangements of 34 MYC-driven aggressive BCL cases already employed in our previous study [14]. We aimed to improve molecular subgrouping based on gene expression and mutational analysis and to confirm BCL subgroup-specific mutations and gene expression characteristics. Affordable diagnostic procedures beyond existing assays might be developed based on the data presented.

2. Materials and Methods

2.1. Case Selection

A total of 34 cases of aggressive BCL were identified and diagnosed as BL (n = 4), DLBCL (n = 16), HGBL DH (n = 8), and HGBL NOS (n = 6). This sample cohort has been previously characterized based on histological features [14]. The research adhered to the principles of the Declaration of Helsinki and approval from the Ethics Commission of Charité—Universitätsmedizin Berlin (EA4/129/15) was obtained.

2.2. DNA/RNA Preparation

DNA and RNA were extracted from formalin-fixed and paraffin-embedded (FFPE) tissue sections using the Maxwell 16 FFPE plus LEV DNA purification kit (AS1720; Promega, Madison, WI, USA) and the HTG EdgeSeq Sample Prep, respectively, according to the manufacturer’s protocols, followed by fluorescence-based quantification using the Qubit dsDNA HS assay kit (Thermo Fisher Scientific, Waltham, MA, USA).

2.3. Gene Expression Analysis

Gene expression analysis using the HTG EdgeSeq Pan B-Cell Lymphoma Panel (298 genes) (HTG Molecular Diagnostics, Inc., Tucson, AZ, USA) and subsequent next-generation sequencing (NGS) using the Ion S5XL system (Thermo Fisher Scientific, Waltham, MA, USA) according to the manufacturer’s protocols was performed. Briefly, a PCR for the ligation of the adapter and molecular barcodes followed the HTG EdgeSeq run. Samples were purified using Agencourt AMPure XP beads and quantitated using the KAPA Library Quantification Kit (Ion/ABI, KK4838, Hoffmann-La Roche, Basel, Switzerland) and StepOnePlus™ Real-Time PCR Systems. The library was pooled to a value of 100 pM and sequenced using Ion Torrent™ Ion S5 XL Systems. Data analysis was performed using HTG EdgeSeq Parser and Reveal Software V3.1.0.

2.4. Mutation Analysis

Mutation analysis by NGS was performed on 50 ng genomic DNA using the Thermo Fisher Oncomine Lymphoma Panel according to the manufacturer’s protocol (Thermo Fisher Scientific, Waltham, MA, USA). Libraries were quantified using an Ion Library TaqMan Quantitation Kit (Thermo Fisher Scientific), multiplexed to 35 pM, and sequenced using Ion 530 Chips on an Ion S5XL system (Thermo Fisher Scientific). BAM files were analyzed using JSI Sequence Pilot, SeqNext V5.4.0 (JSI Medical Systems GmbH, Kippenheim, Germany) with hg19 as a human reference genome and a cut-off value of allele frequency for mutation detection of 5%. Mutations were checked for pathogenicity and knowledge status in publicly available databases (dbSNP, cBioPortal, ClinVar, and gnomAD) [15,16,17,18,19]. Known benign and likely benign variants (e.g., CDKN2A A148T or TP53 R283C, both also identified by Yamashita et al., 2020 [14]) were excluded for further interpretation focusing on pathogenic, likely pathogenic, or variants of unknown significance.

2.5. Analysis of IG Gene Rearrangements

IG gene rearrangements were examined using the EuroClonality NGS assay, including primer sets for complete IGH rearrangements IGHV(FR3)-IGHD-IGHJ, the partial IGH rearrangements IGHD-IGHJ, and the IGK rearrangements [20,21]. The library preparation was performed as previously described by Scheijen et al., 2019 [21] with the change to 2.0 mM MgCl2 for all primer sets. The barcoded libraries were quantified using Ion Library TaqMan Quantitation Kit (Thermo Fisher Scientific, Waltham, MA, USA), pooled to 40 pM, amplified on Ion Sphere Particles with an Ion 510&520&530 Kit-Chef, and sequenced using Ion 530 Chips on an Ion S5XL system (Thermo Fisher Scientific). The standard operating procedure of the EuroClonality protocol can be found at https://euroclonality.org/ngs/protocols (accessed on 20 August 2024). The FASTq files of each sample were analyzed using the ARResT/Interrogate platform [22].

3. Results

3.1. Gene Expression Analysis by HTG EdgeSeq

Gene expression was determined by employing the HTG EdgeSeq Pan B-Cell Lymphoma Panel (298 genes) for 34 DLBCL (16), BL (4), HGBL DH (8), and HGBL NOS (6) cases. The resulting gene expression profiles have been grouped unbiased by hierarchical cluster analysis using web-based HTG EdgeSeq Reveal Software V3.1.0. BCL cases have been separated into three groups (Figure 1). Furthermore, case number, diagnosis, the Hans algorithm [23], proliferative activity (Ki-67 index), MYC expression, as well as MYC, BCL2, and BCL6 translocation are presented [14].
The gene expression groups correlate with proliferative activity, MYC translocation, and expression, and partially with the histopathological diagnosis. Significant gene expression differences can also be observed in cases with BCL2 and BCL6 rearrangements.
Groups I and II share a common characteristic of high MYC expression and exhibit highly proliferative features. Group III, on the other hand, is characterized by a lower Ki-67 index. Furthermore, nearly all cases in Group I exhibit MYC rearrangements and Group II is similarly marked by numerous MYC rearrangements. In contrast, Group III shows no MYC translocation and lower MYC expression. Regarding the BCL2 and BCL6 translocation status, both Groups II and III include four cases characterized by a BCL6 translocation, while Group I exhibits no BCL6 translocations. BCL2 translocations are nearly evenly distributed between Groups I and II. In Group III, specifically, there is only one case (Case 15) displaying a BCL2 translocation and a few cases with BCL6 translocations.
Regarding the histological BCL subtypes, all BL cases are present in Group I. Moreover, Group I comprises only one DLBCL but several HGBL DH and HGBL NOS. Group II shows one HGBL NOS and several DLBCL and HGBL DH. Most of the cases in Group III are DLBCL, only two cases are HGBL NOS. Consequently, almost all of the Germinal Center B-cell-like (GCB) DLBCL can be found in Group III.
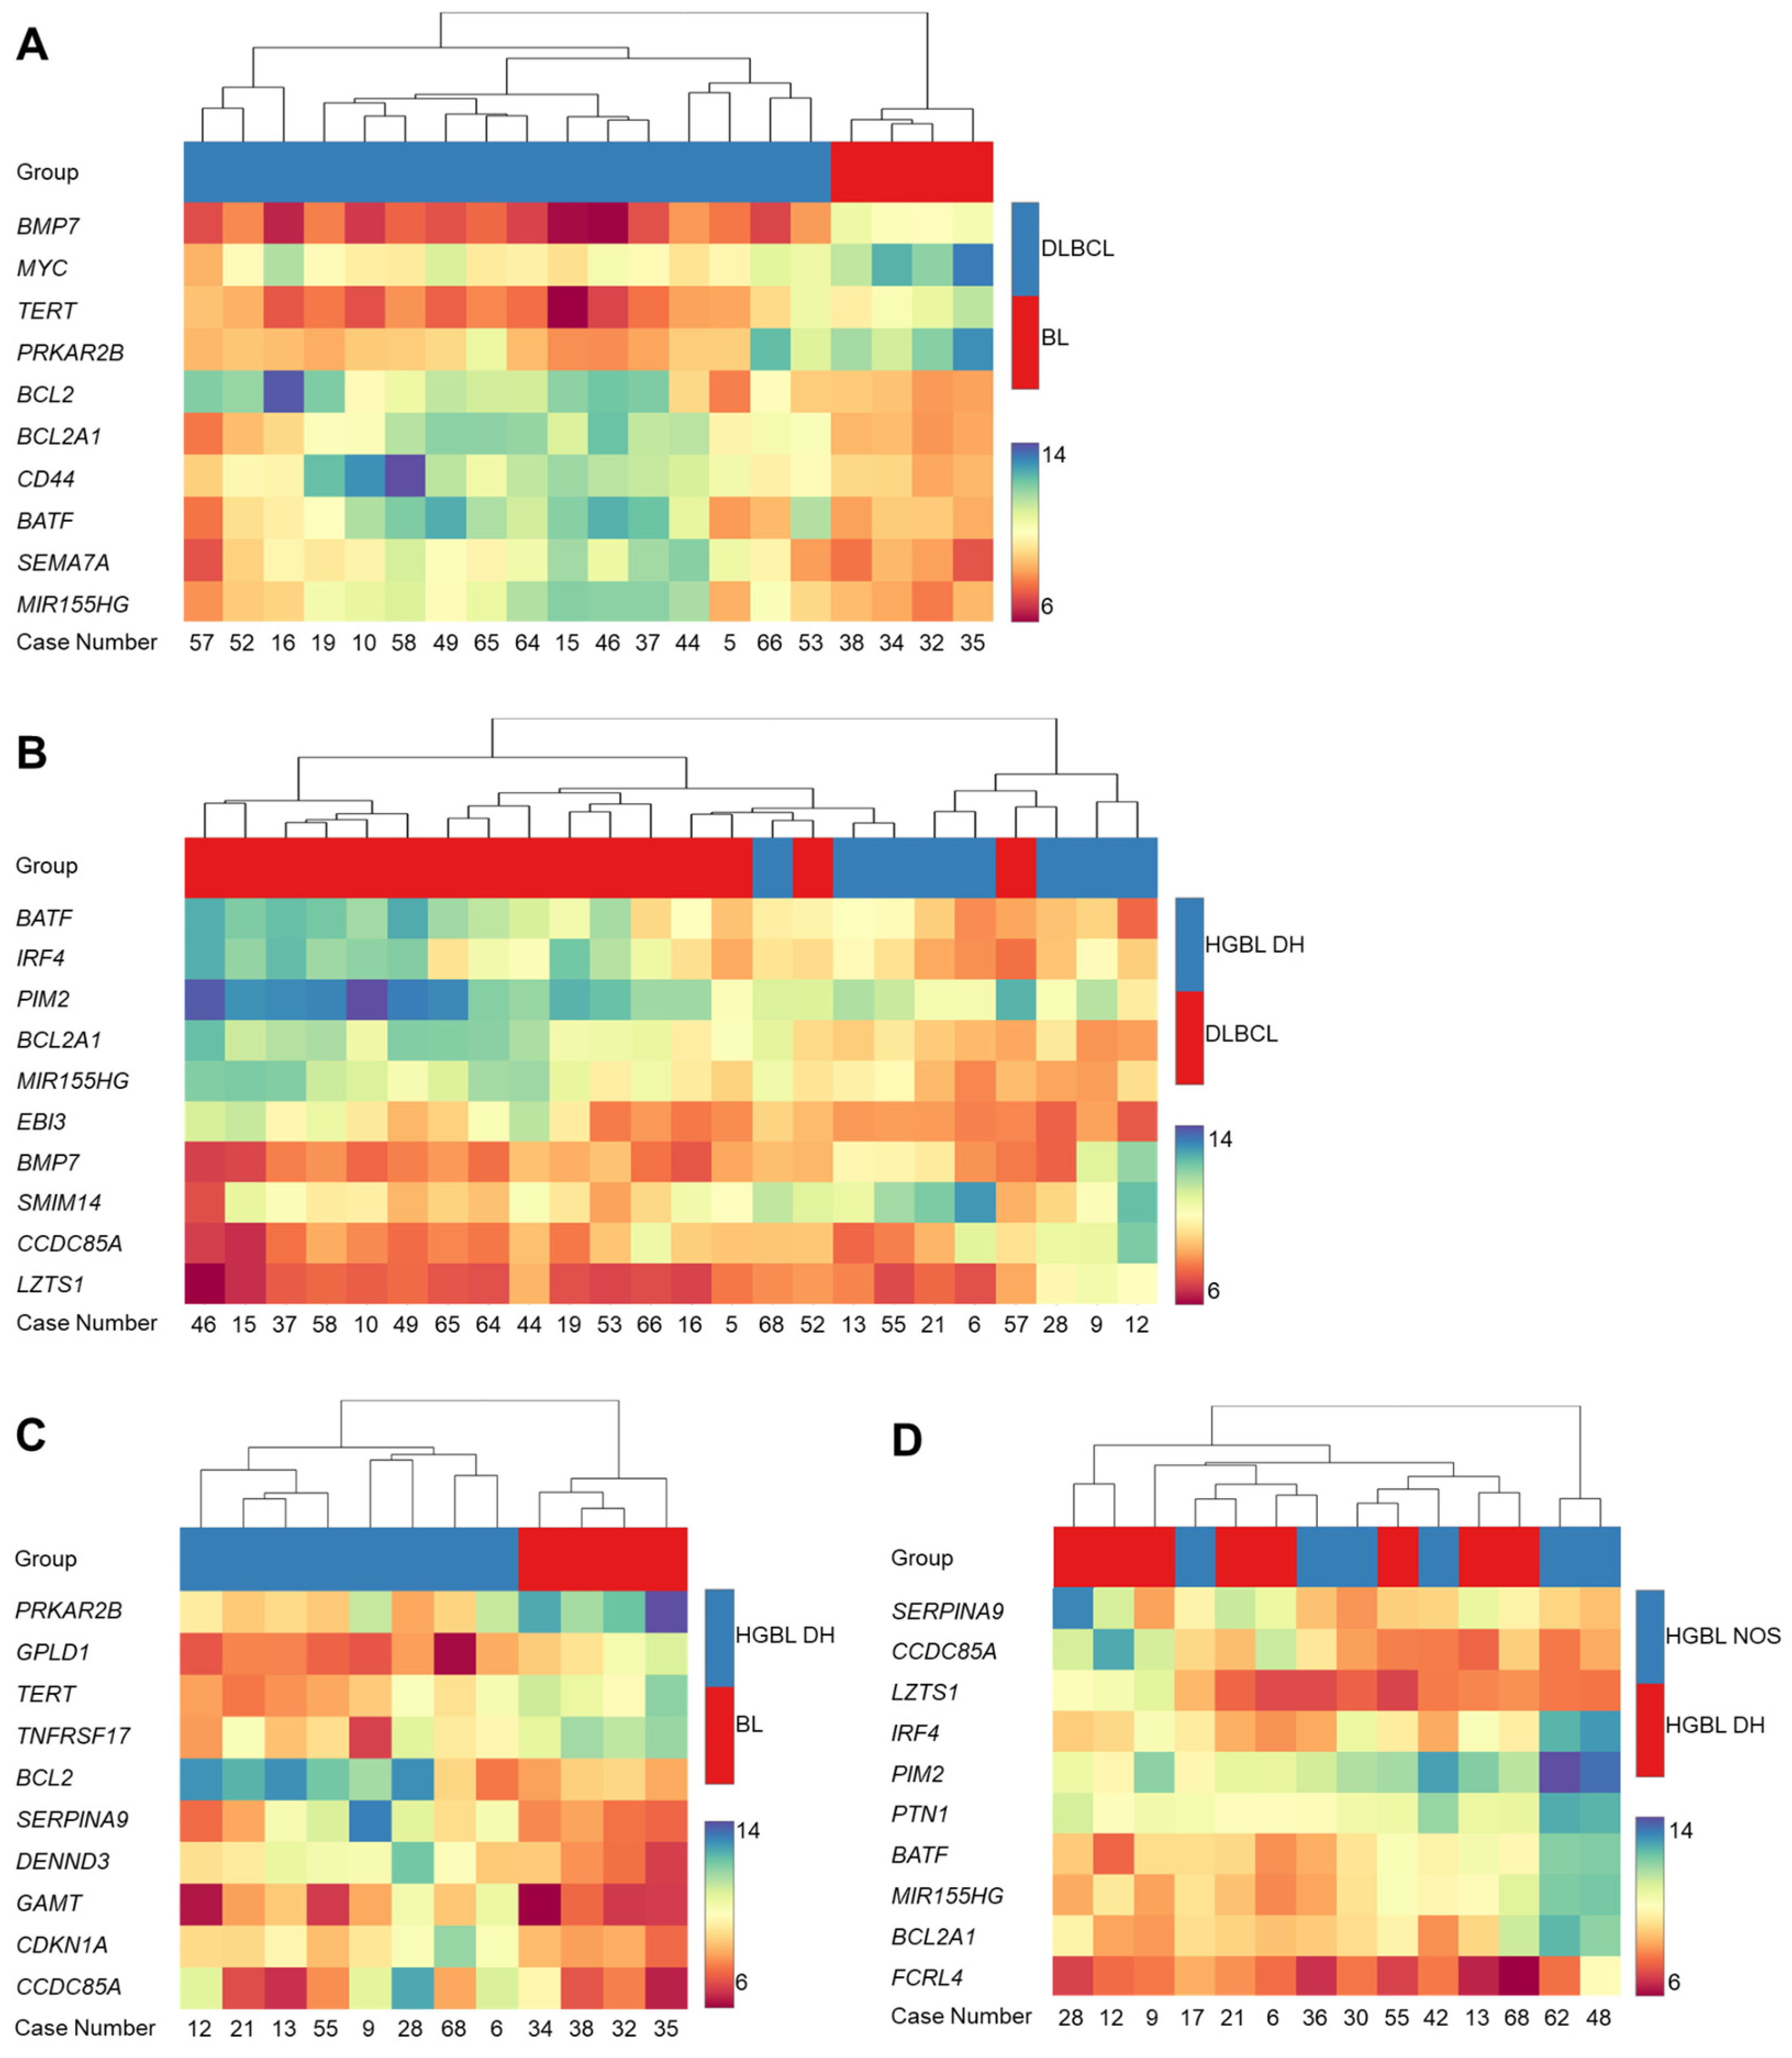
To further investigate the gene expression characteristics of the different BCL subtypes, hierarchical cluster analysis has been conducted as well, comparing two different subtypes at a time. Figure 2 presents the comparison of DLBCL vs. BL (Figure 2A), HGBL DH vs. DLBCL (Figure 2B), HGBL DH vs. BL (Figure 2C), and HGBL NOS vs. HGBL DH (Figure 2D) based on the differential expression of ten genes each.
The heatmap in Figure 2A displays the differential expression comparing BL and DLBCL. Based on the color-coded expression intensity of the genes and the hierarchical cluster analysis, a clear separation of the two subtypes is evident. In BL, BMP7, MYC, TERT, and PRKAR2B are significantly more strongly expressed, while BCL2, BCL2A1, CD44, BATF, SEMA7A, and MIR155HG are expressed weaker in BL. Figure 2B presents the heatmap comparing DLBCL and HGBL DH. Three major clusters can be identified. In the left part of the heatmap, exclusively DLBCL samples are located, while in the right part, mostly HGBL DH samples are positioned. The left cluster, consisting of DLBCL samples, is most distinct from the right cluster, which, except for one case, comprises only HGBL DH samples. The middle cluster can again be subdivided into two smaller clusters. One contains exclusively DLBCL samples, while the other includes three DLBCL and three HGBL DH samples. On the right side, there are five HGBL DH cases, along with one DLBCL case (Case 57). The cluster analysis in Figure 2C reveals a distinct differentiation between BL and HGBL DH. Once again, an elevated expression of TERT and PRKAR2B in BL is evident. Furthermore, GPLD1 and TNFRSF17 are strongly expressed in BL compared to HGBL DH. Conversely, BCL2, SERPINA9, DENND3, GAMT, CDKN1A, and CCDC85A exhibit enhanced expression in HGBL DH compared to BL. The heatmap in Figure 2D shows no significant differentiation when comparing HGBL DH and HGBL NOS. Interestingly, a clear differentiation of two HGBL NOS cases (Cases 48 and 62) from the other cases is evident.

3.2. Mutation Analysis

We performed a mutation analysis using the Oncomine Lymphoma Panel (Thermo Fisher Scientific; 25 lymphoma-related genes) for 34 cases of aggressive BCL. According to dbSNP, cBioPortal, ClinVar, and gnomAD [15,16,17,18,19], we included only identified likely pathogenic, pathogenic, and variants of unknown significance (VUS).
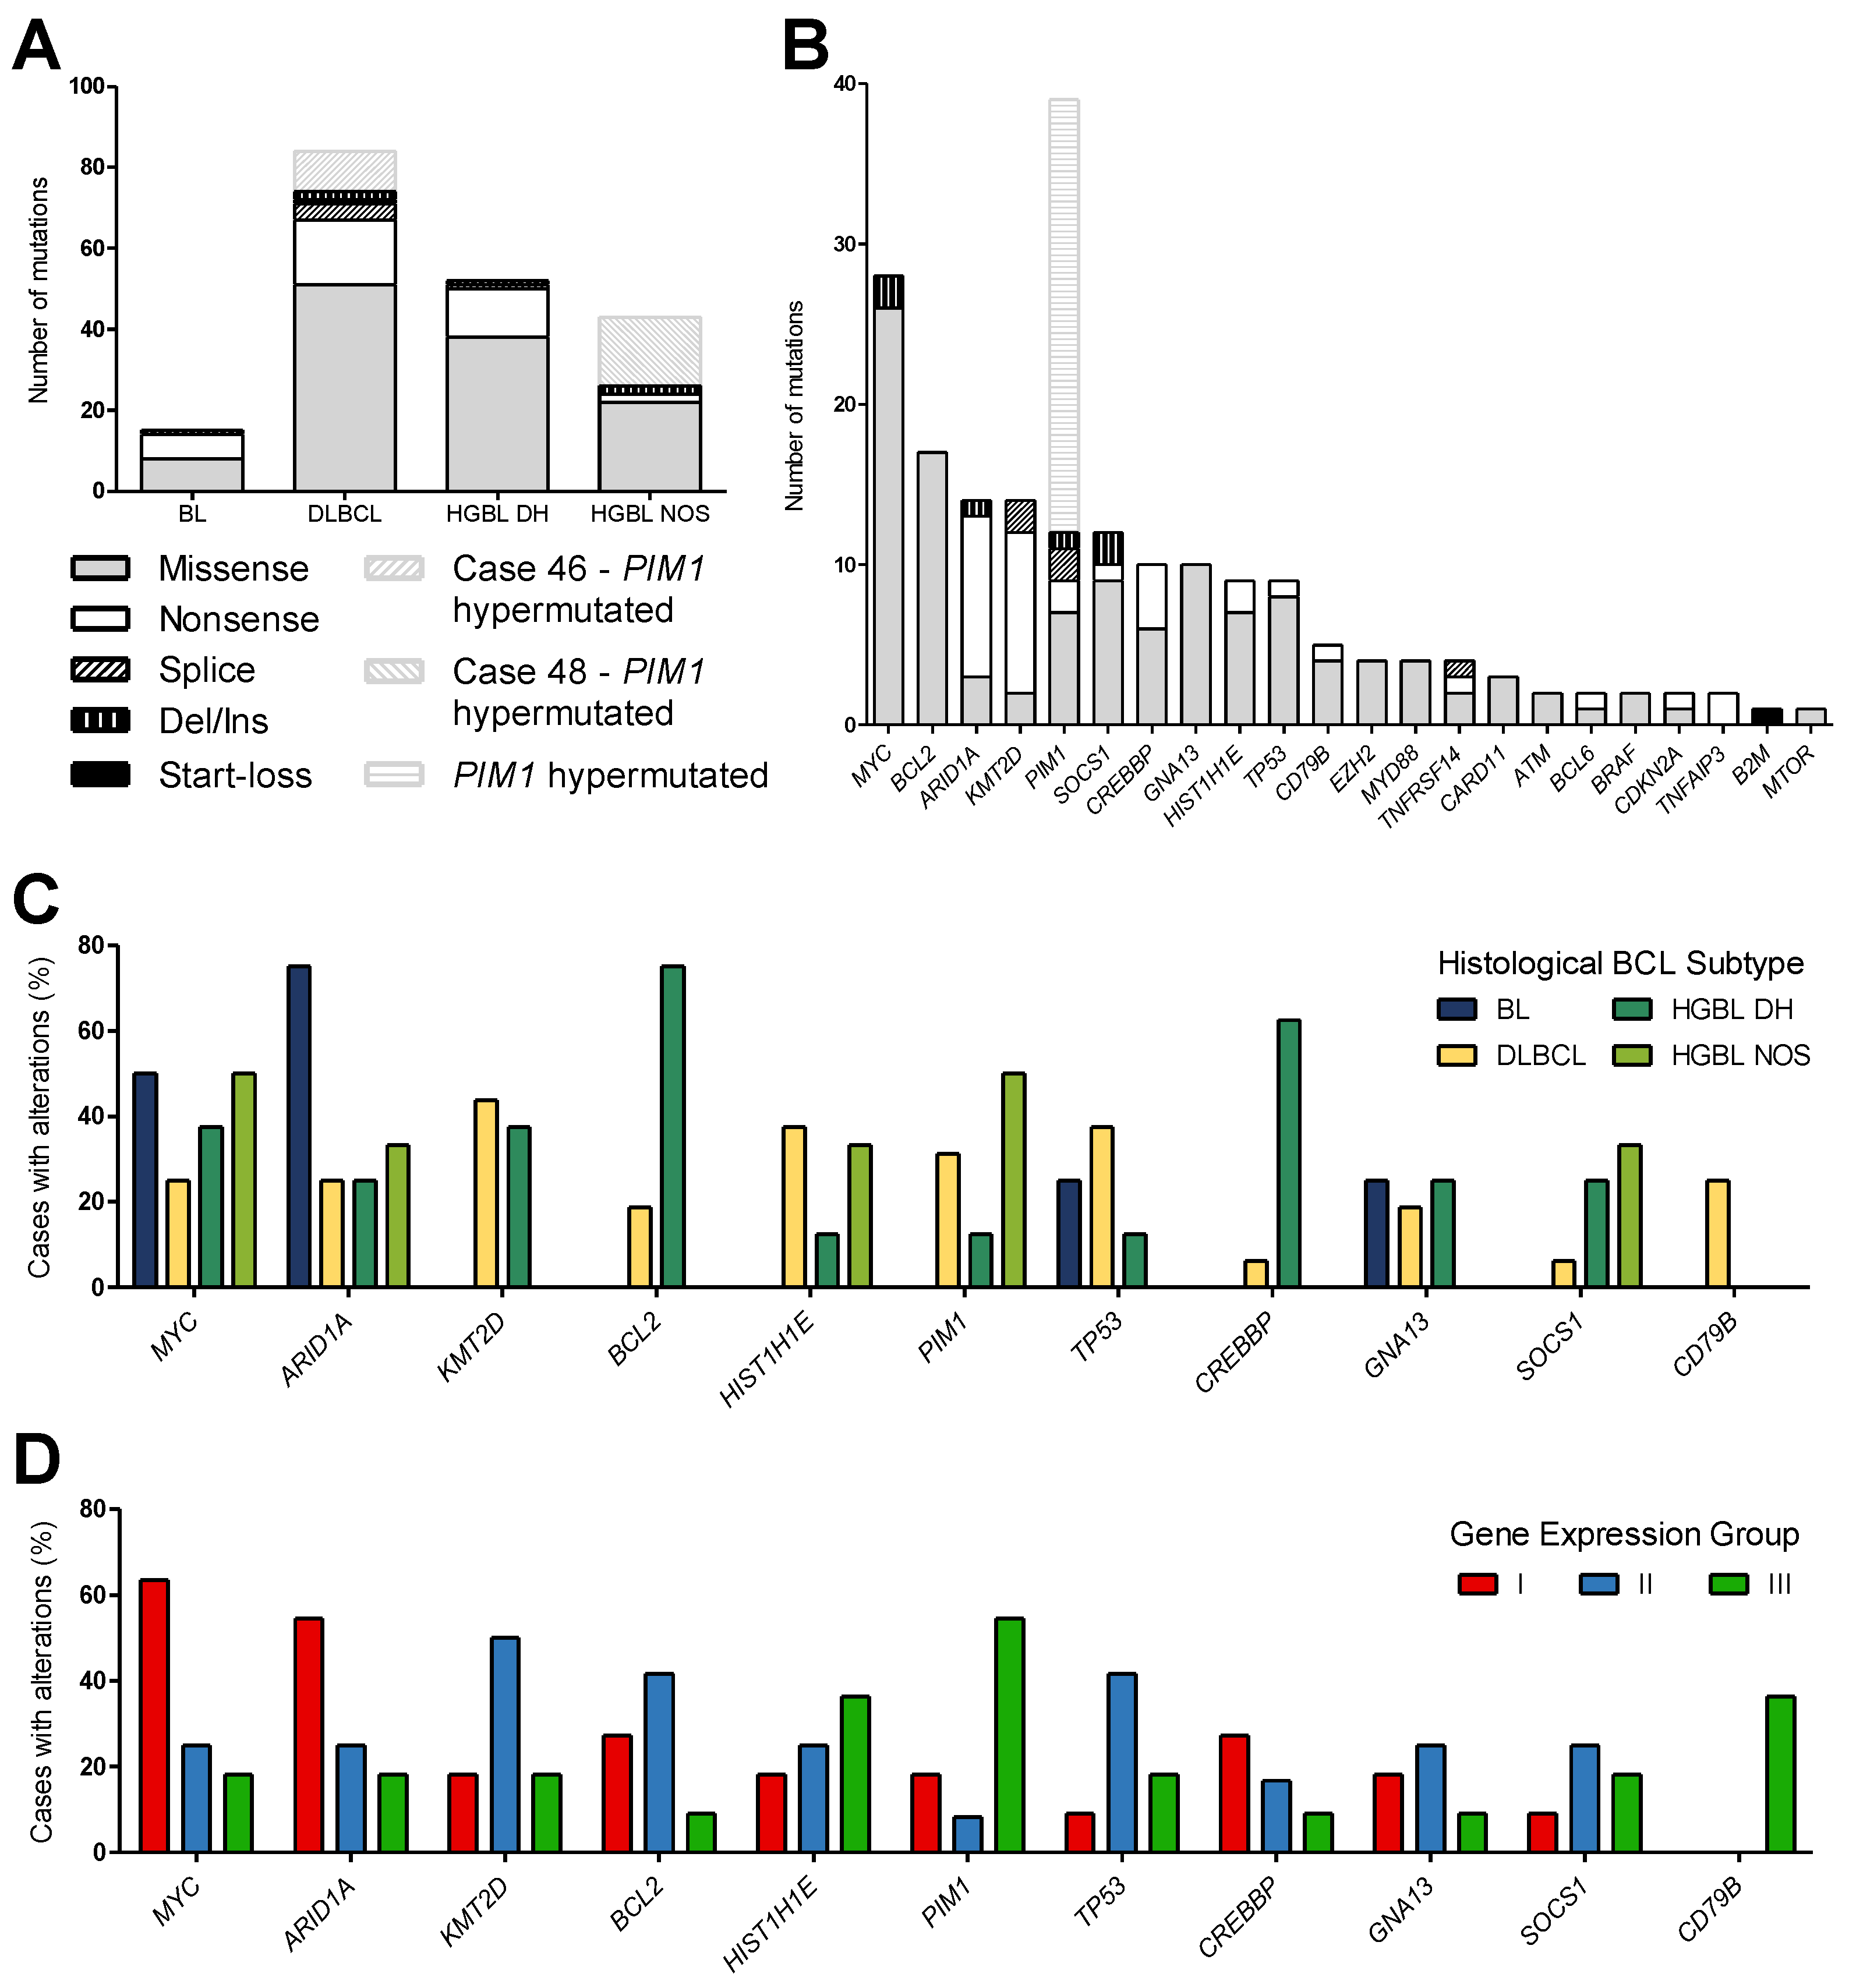
In the 34 cases studied, 180 unique variants and, in total, 194 mutations were detected in 22 genes, including 2 cases with PIM1 hypermutations (Cases 46 and 48) and 2 cases (Cases 62 and 68) with no mutations. Including all detected variants, missense mutations were the most frequent alterations (71.6%), followed by nonsense mutations (20.1%), deletions/insertions (4.1%), and splice variants (3.6%). Additionally, one start-loss mutation was found (Figure 3A,B). A distribution sorted by the mutation frequency of affected genes of all analyzed cases is shown in Figure 3B. Excluding the PIM1 hypermutation, the most frequently mutated gene in all entities was the oncogene MYC, followed by BCL2, ARID1A, KMT2D, PIM1, and SOCS1. MYC, BCL2, and SOCS1 were primarily missense variants, whereas ARID1A and KMT2D mainly harbored nonsense mutations.
In general, no discriminating single mutation could be found. The four BL cases showed, on average, 3.8 mutations per case, which corresponds in total to 15 variants in four genes. The alterations found in BL cases were restricted to MYC, ARID1A, GNA13, and TP53. For the 16 DLBCL cases, 5.3 mutations per case were detected, accounting for 84 variants in 22 genes, in various genes including ARID1A, ATM, B2M, BCL2, BCL6, BRAF, CARD11, CD79B, CDKN2A, CREBBP, EZH2, GNA13, HIST1H1E, KMT2D, MTOR, MYC, MYD88, PIM1, SOCS1, TNFAIP3, TNFRSF14, and TP53. HGBL DH had a mutation rate of 6.5 mutations/case (52 variants in 14 genes) in ARID1A, BCL2, BCL6, CDKN2A, CREBBP, EZH2, GNA13, HIST1H1E, MYC, PIM1, SOCS1, TNFRSF14, and TP53. Similarly, for the six HGBL NOS cases, 7.5 mutations per case (43 variants in nine genes) were identified in ARID1A, ATM, BRAF, CARD11, HIST1H1E, MYC, MYD88, PIM1, and SOCS1. Interestingly, only DLBCL cases showed CD79B mutations; however, only in 25% of all DLBCL cases. Pathogenic CREBBP mutations mostly occurred in HGBL DH. PIM1 was mainly altered in DLBCL and HGBL NOS cases by 31.5% and 50%, respectively, whereas ARID1A and MYC mutations were detected in each subtype (Figure 3C and Table 1). The genes BTK, SF3B1, and XPO1 were not affected in any entity.
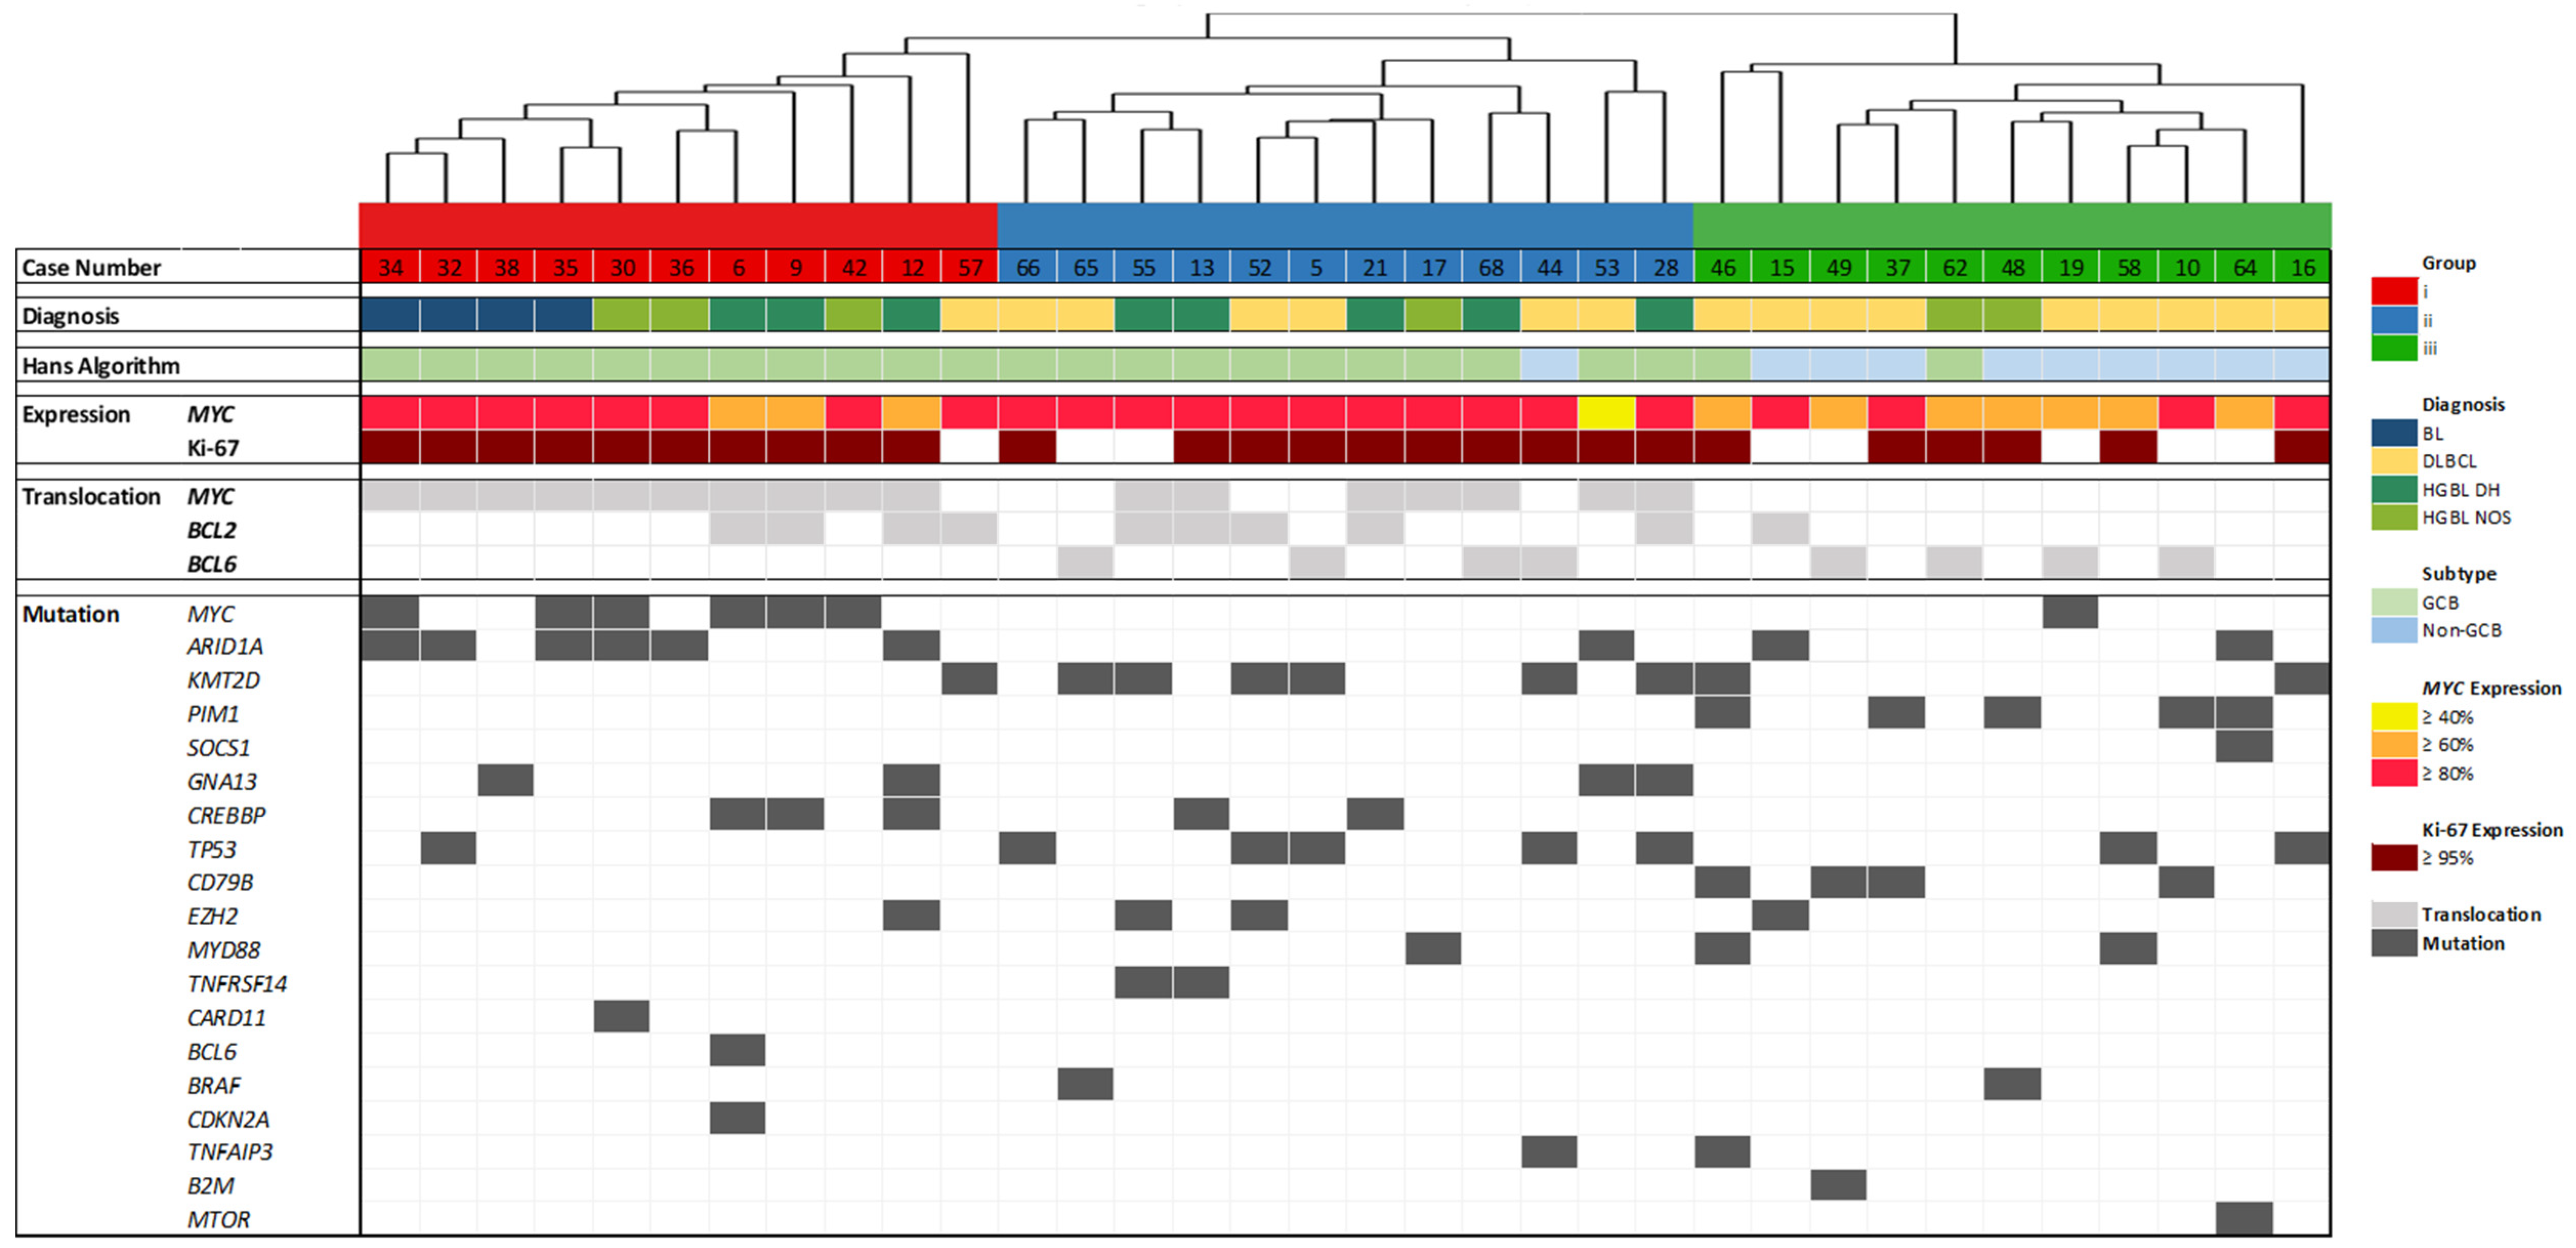
For the gene expression groups identified in this study, Group I is mainly characterized by alterations in MYC and ARID1A, whereas Group II harbored the most KMT2D and TP53 mutations. Group III was the most diverse, differing from the others only in CD79B mutations of DLBCL cases and PIM1 mutations (Figure 3D and Table 1). This finding is reinforced by restriction to pathogenic and likely pathogenic mutations without consideration of VUS (Figure 4).

3.3. Analysis of IG Gene Rearrangements

To investigate the B-cell repertoires in the different BCL subtypes, we employed the EuroClonality NGS assay for the detection of IG heavy and light chain gene rearrangements [21]. A total of 33 out of 36 samples (92%) showed clonal rearrangement with a wide range of frequencies of the most dominant clonotype (16.5–96.3%). Only two samples (Cases 10 and 68) exhibited no or negligible clonality—a pattern most likely originating from reactive non-tumor B-cells (most dominant clonotypes of 1% and 7.7%, respectively). One sample (Case 13) was excluded due to sequencing errors (Supplementary Table S1).
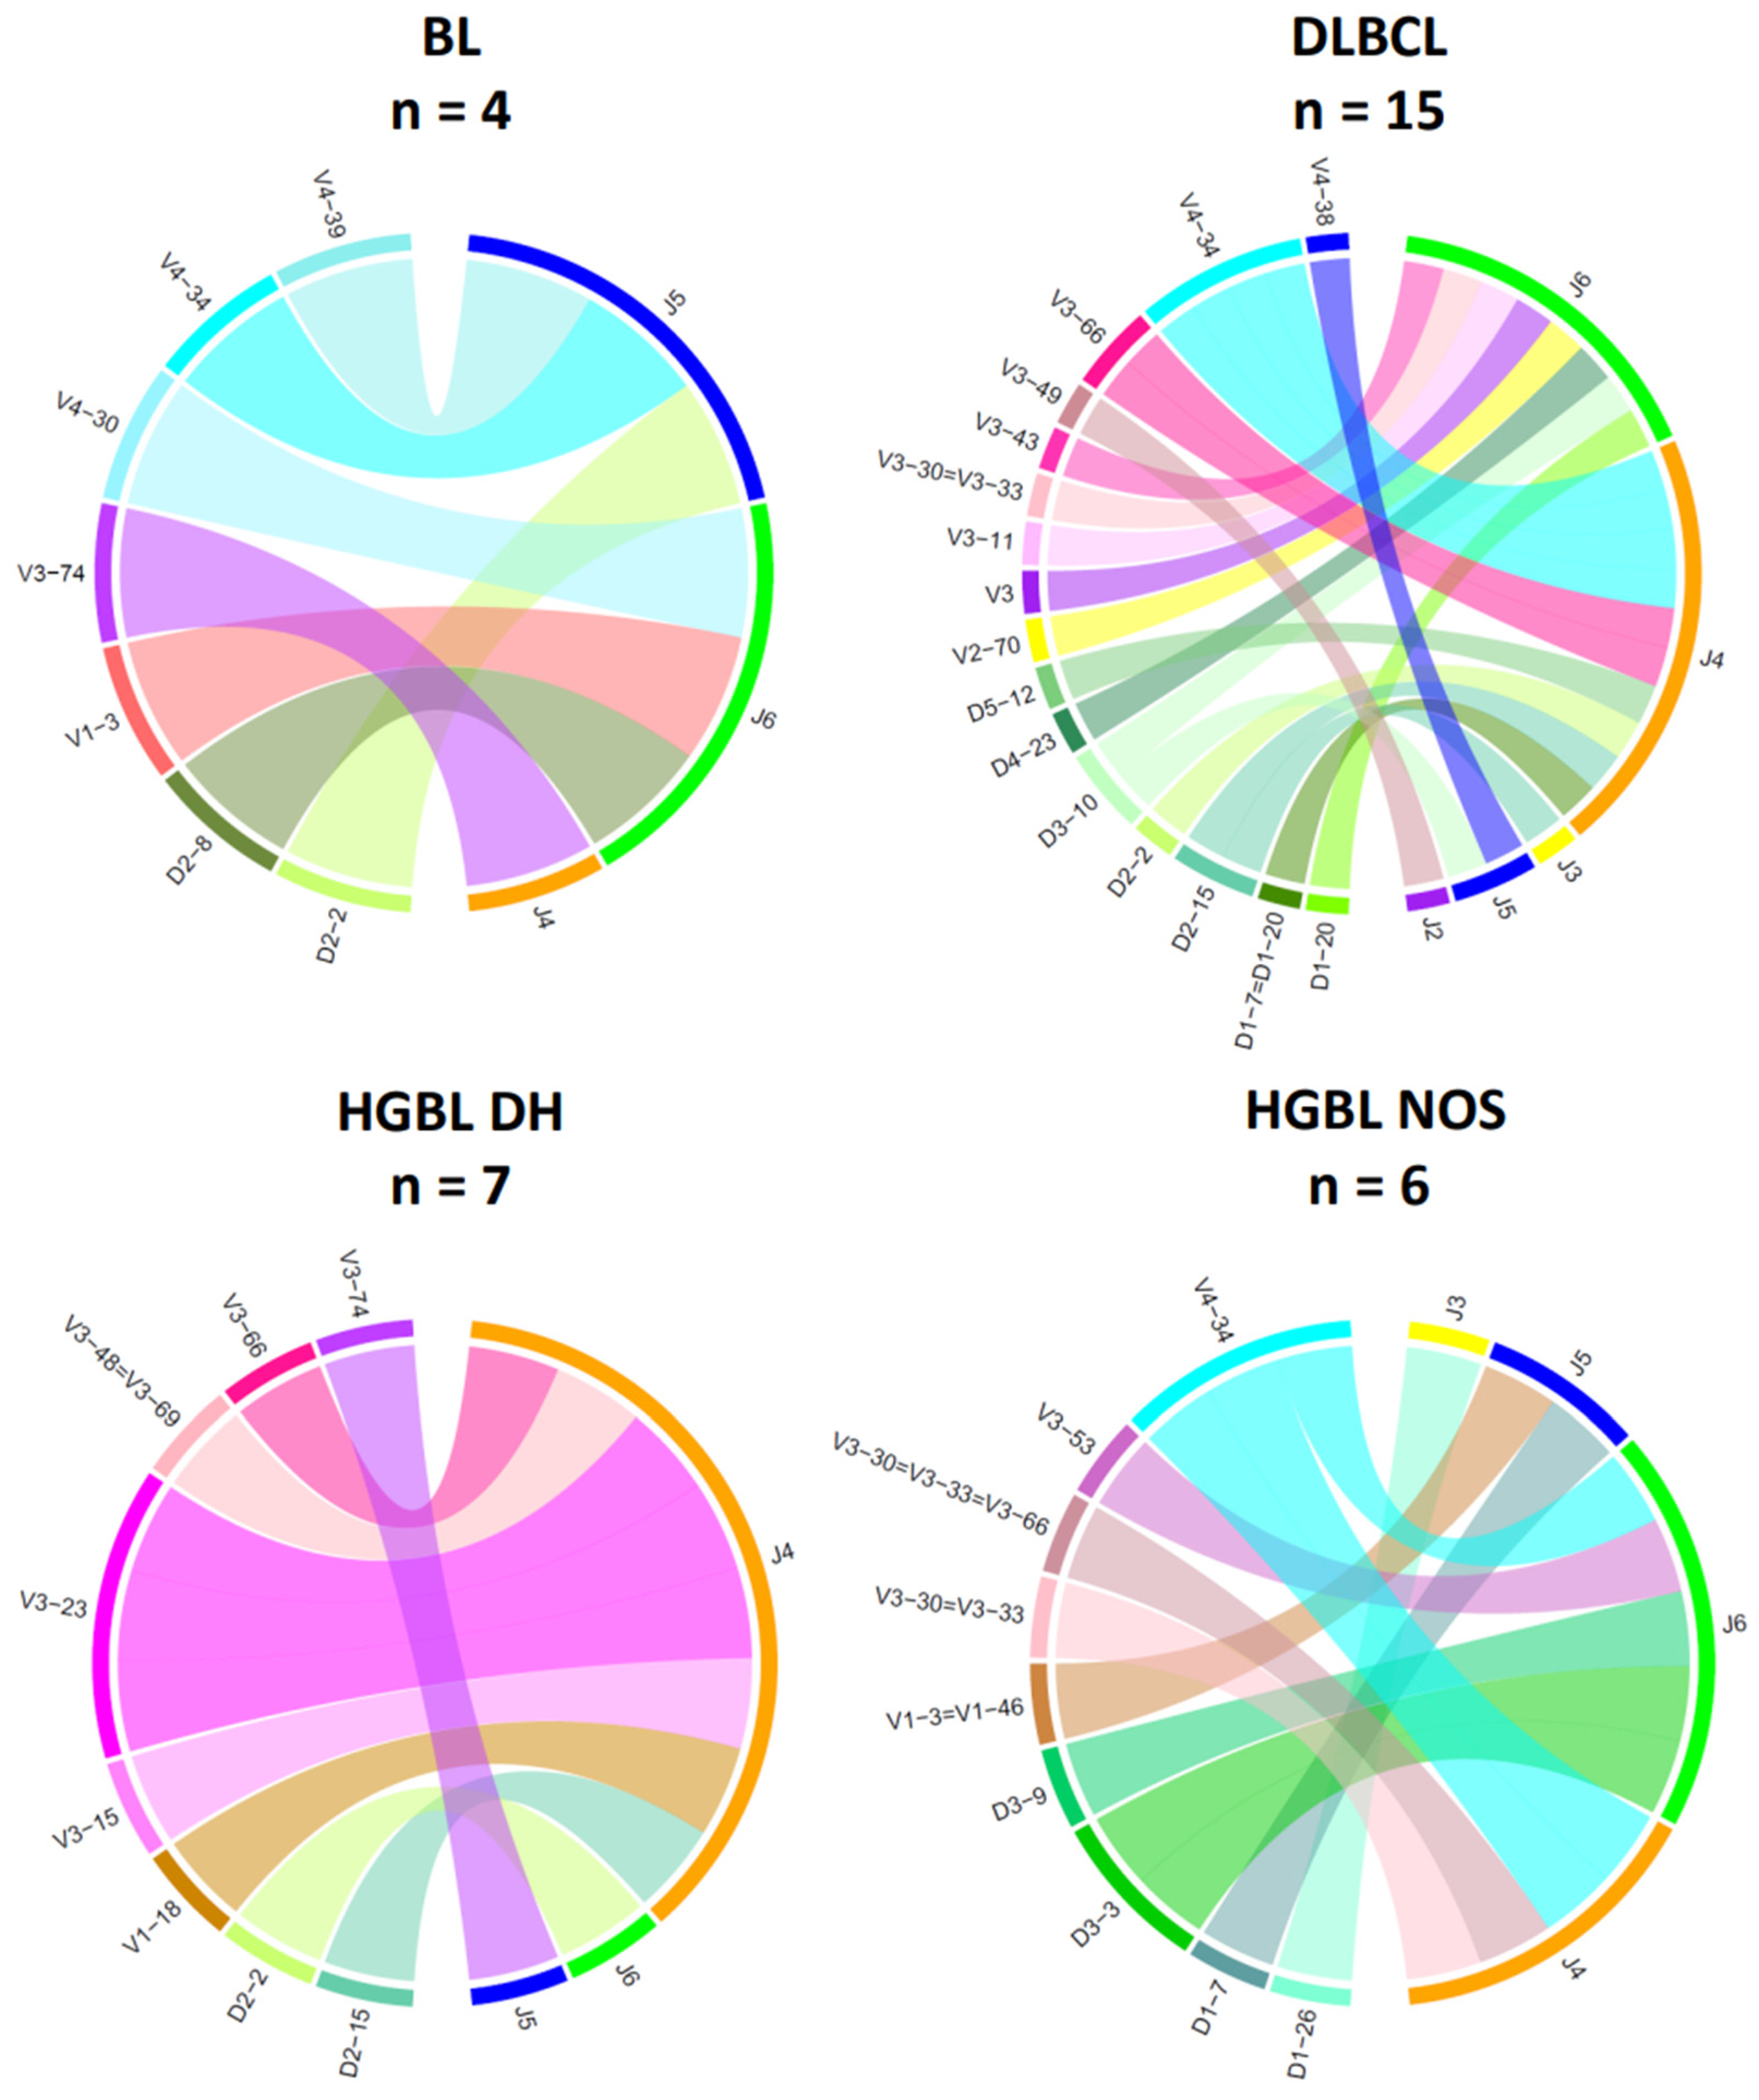
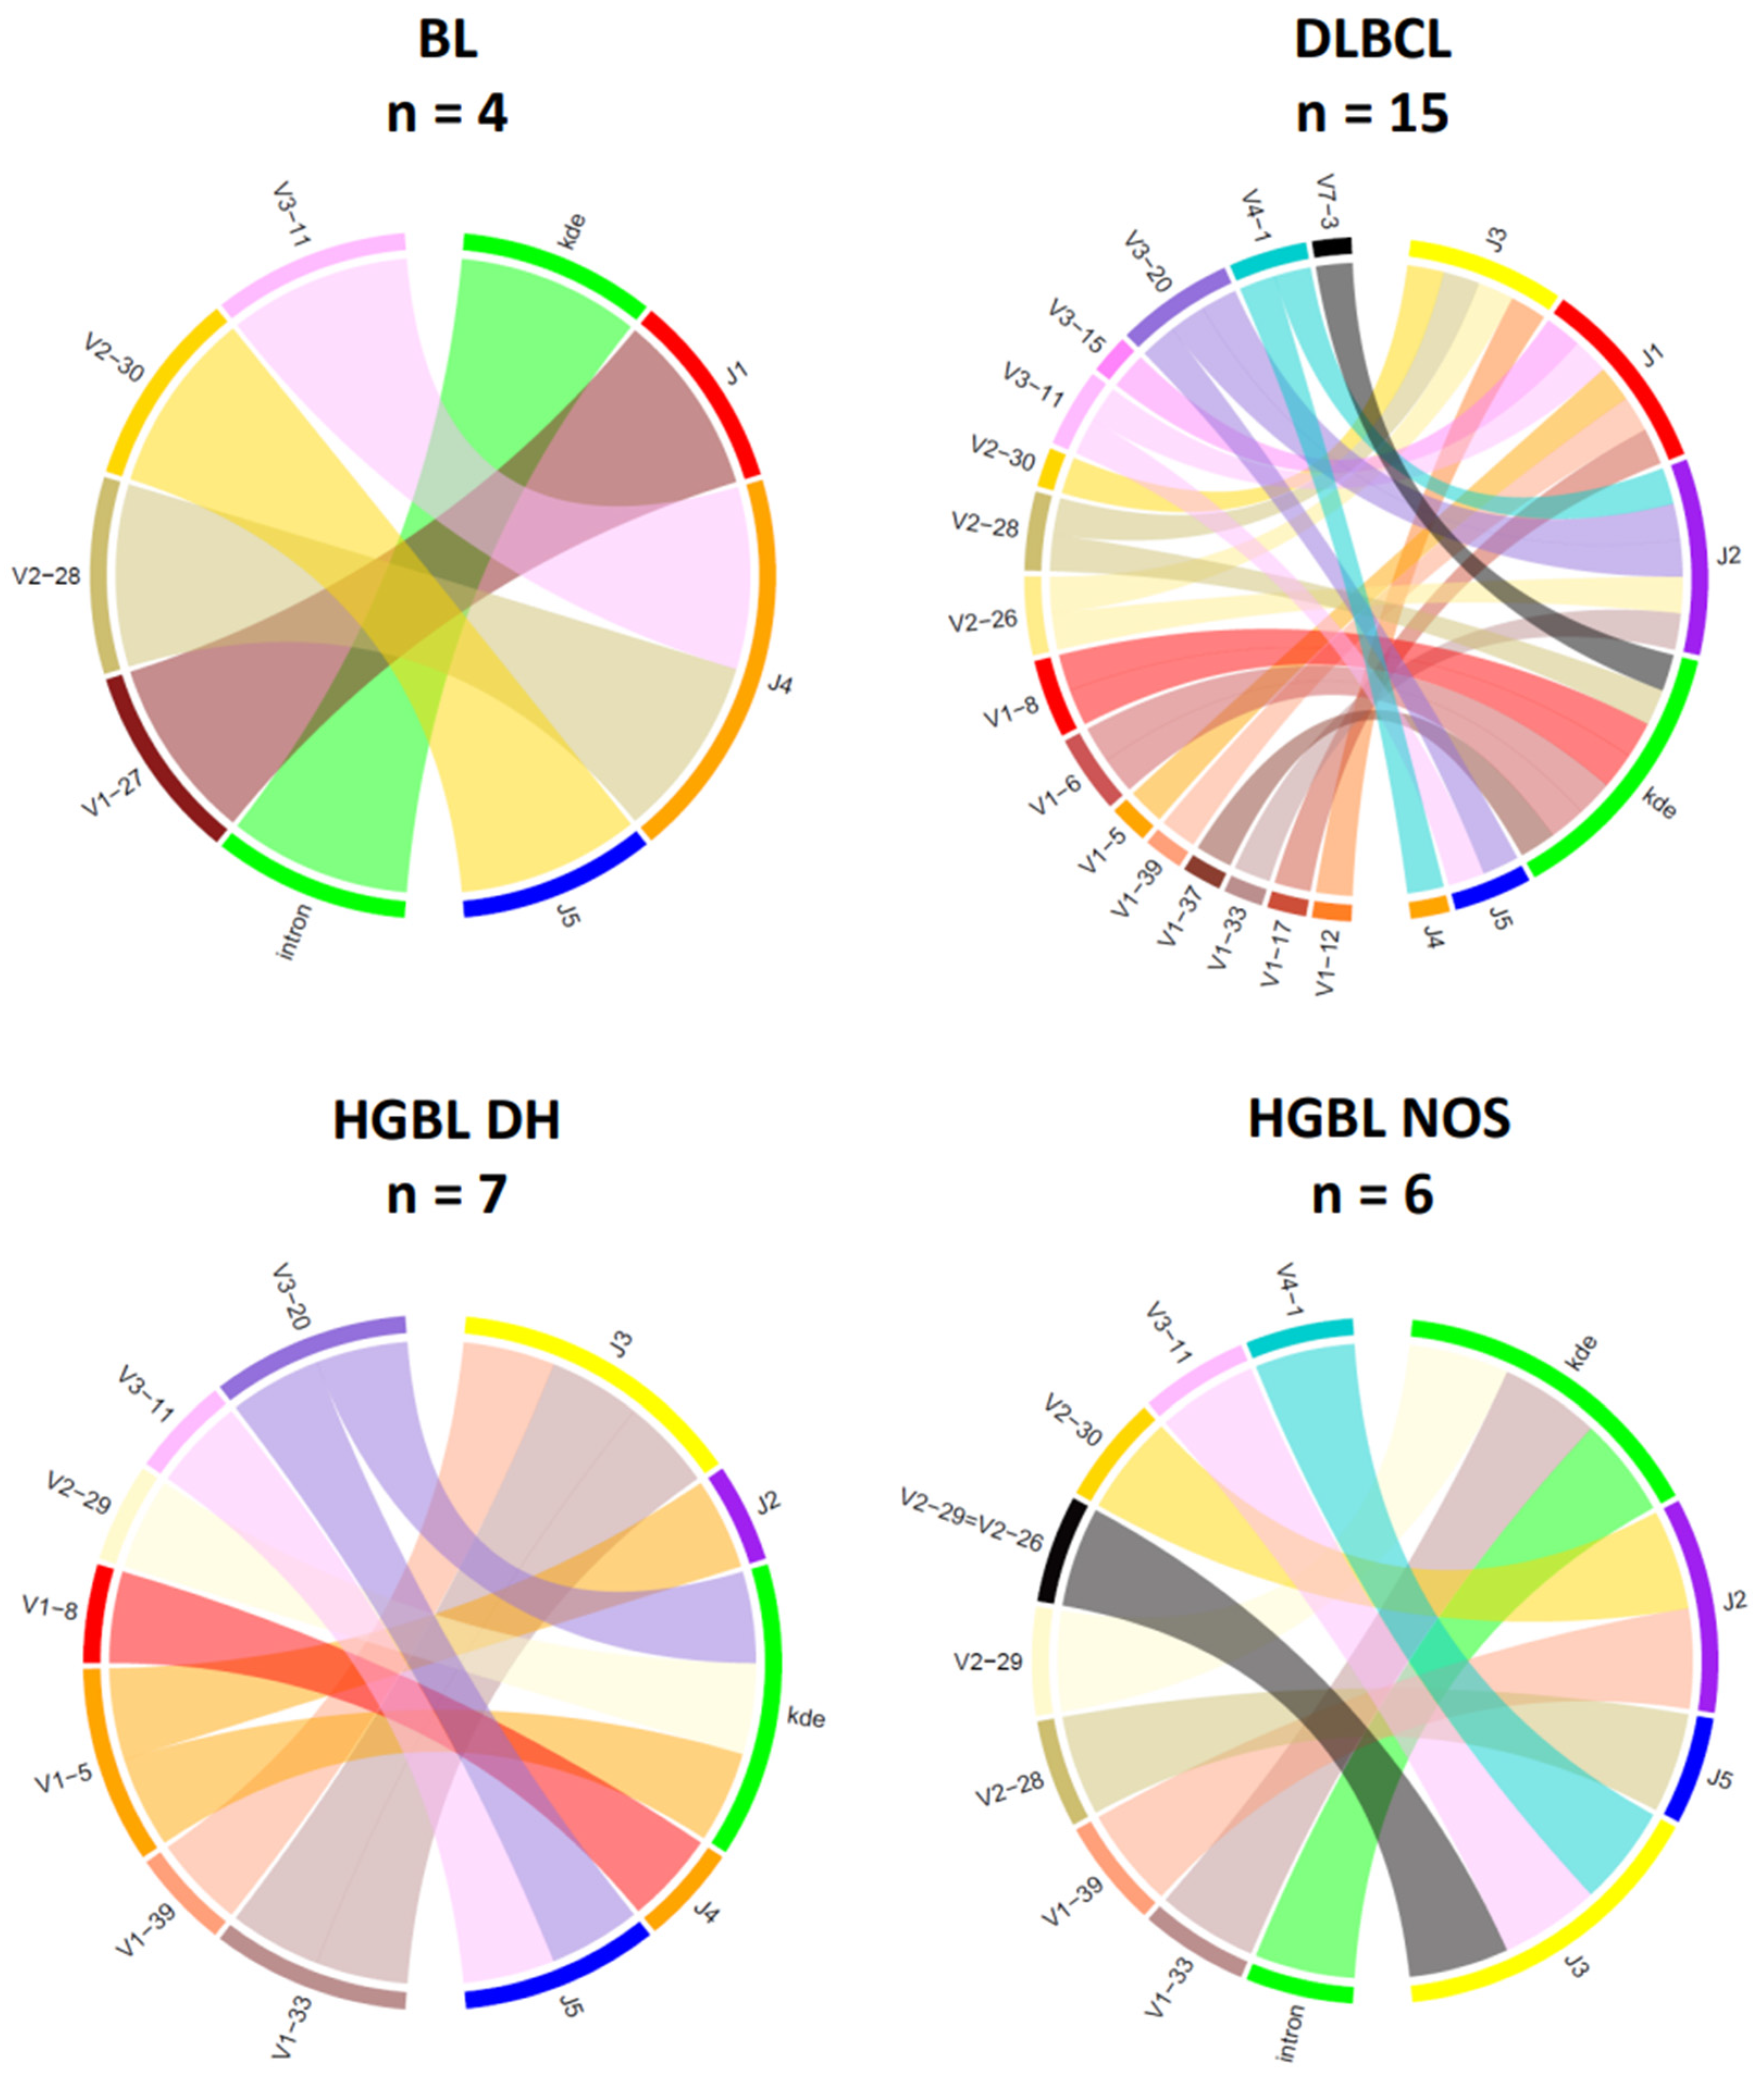
The chord diagrams demonstrate the relationship between the V-/D- and J-segment usage. For IG heavy chain rearrangements (Figure 5), the most frequently used V-segment of all BCL subtypes is V4–34, found in the most prevalent clonotype in 8 out of 36 samples (22%). In the histological subtypes of this study, the J-segments J2–J6 could be detected as part of the clonal rearrangements, with J4–J6 being the most frequent across all subtypes (94%). Interestingly, there are slight differences between the groups for the J segments used. In HGBL DH, the J4 segment was particularly frequently affected (86%). In the other BCL subtypes, there is no clustering of certain J-segments. However, no distinct distribution of the heavy chain J-segment can be demonstrated for the IG light chain genes. The V-J segment usage appears heterogeneous within a subtype and across the four groups (Figure 6).
In summary, our study reveals that existing histological, immunophenotypical, and molecular features lack the certainty to distinguish the specified HGBL subgroups. Even by combining various features, no definitive distinction was feasible emerged. Nonetheless, molecular characteristics enable the identification of patient subgroups with shared alterations, offering potential insights for stratified future treatment approaches.

4. Discussion

Aggressive BCL encompasses various subtypes such as BL, DLBCL, HGBL NOS, and HGBL DH/TH. However, establishing a clear diagnostic distinction of HGBL from other aggressive BCL proves challenging through histology and immunostaining [5,10,11,12]. This study aimed to identify molecular features to support and sharpen the subtyping of aggressive BCL. To achieve this, we conducted a comprehensive gene expression analysis of 298 genes, a mutational analysis of 25 lymphoma-related genes, and an analysis of IG rearrangements across 34 cases of aggressive BCL. We identified three molecular subgroups based on the results of gene expression. The clustering is highly correlated with proliferative activity, MYC translocation and expression, and, partially, with histopathological diagnosis. Significant differences based on BCL2 and BCL6 translocations can additionally be recognized. Moreover, the suggested gene expression groups revealed MYC, ARID1A, KMT2D, and TP53 as genes displaying potential subgroup-specific characteristics.
Concerning the three gene expression groups, a clear separation of BL and DLBCL as well as a less distinct subgrouping of HGBL DH and NOS detectable with the HTG EdgeSeq pan B-cell panel (Figure 1 and Figure 2D) was found, demonstrating that current algorithms for classifying lymphomas, involving morphology, immunophenotype, and molecular testing for BCL2, BCL6, and MYC rearrangements, are performing effectively [5,12]. This corresponds to published data [6,7] as HGBL DH and NOS were originally characterized by features intermediate between DLBCL and Burkitt lymphoma (BCLU) [4]. To this end, shared and overlapping gene expression patterns are highly likely and prevent the detection of features that are exclusively linked to a certain subgroup. In Group I, several cases of HGBL DH and HGBL NOS are present in addition to all cases of BL. Thus, it is reasonable to conclude that these HGBL cases share gene expression similarities with BL cases. BL is characterized by a MYC translocation and a characteristic immunophenotype of CD10+/BCL2BCL6+ with a very high Ki-67 proliferation index. In a landmark publication of 2006 [7], we reported a molecular definition of BL using transcriptional and genomic profiling. Comparing the BL characteristic genes from that paper and those from this study, we observed a match of five genes. BMP7, TERT, and PRKAR2B show a higher expression, and CD44 and BCL2A1 show a lower expression in BL (Figure 2A) [7]. BMP7 encodes a member of the TGF-β superfamily. The ligand is capable of binding to TGF-β receptors, which activates transcription factors of the SMAD family that are involved in regulating the expression of numerous genes [24]. In 2011, Huse et al. observed that BMP7 is primarily involved in the induction of apoptosis [25].
PRKAR2B is a regulatory subunit of cyclic adenosine monophosphate (cAMP)-dependent protein kinase A (PKA). cAMP is a signaling molecule that acts as a second messenger to activate various enzymes, including cAMP-dependent PKAs. PKAs play a central role in signal transduction. The PKA holoenzyme is a heterotetramer, divided into two domains. One domain, consisting of two regulatory subunits, has a high binding affinity for cAMP; the other domain, composed of two catalytic subunits, can bind coenzymes and substrates. In humans, four isomers of the regulatory subunits and three isomers of the catalytic subunits have been identified. PRKAR2B is one of the regulatory isomers and can be phosphorylated by the catalytic domain [26].
Along the same line, six of the genes published by Dave and colleagues [6], for the distinction of DLBCL and BL, were also found in the results for Group I of this study with an increased expression level for BMP7, MYC, and TERT in BL and a downregulated expression for BCL2A1, CD44, and BATF (Figure 2A). BCL2A1 encodes a member of the BCL2 protein family and can reduce the release of cytochrome c from mitochondria as well as block caspase activation. The transcription of BCL2A1 is regulated by NF-κB [27].
Comparison of BL to the other subgroups revealed an increased expression of TERT in BL. Wu et al. reported a large number of MYC binding sites in the TERT promoter [28]. Therefore, a higher MYC expression would result in an increased TERT expression, which was also detectable in our data. TERT, the catalytic subunit of telomerase, is capable of maintaining telomere ends by catalyzing the addition of the nucleotide sequence TTAGGG [29,30]. In 2019, López et al. described an increased amount of TERT transcripts in BL compared to normal GCB cells [31]. GCB subtypes are generally associated with better prognosis [5,32].
Upon closer examination of the molecular subgroups, the substantial impact of MYC translocation/expression status on the transcriptome becomes evident. As a pleiotropic transcription factor, MYC plays a central role in crucial cellular functions, impacting over 10% of the human genome’s genes. Dysregulation of MYC, with its significant oncogenic potential, disrupts numerous genes, making it a key prognostic marker. [33,34,35] Recent discoveries have shown that not all MYC translocations result in the same clinical outcomes. The specific translocation partner is crucial in determining the pathogenic potential of DLBCL [5,32]. Blomme et al. demonstrated that samples with concurrent MYC and BCL2 rearrangements exhibited significantly worse survival rates compared to those without these alterations. Conversely, samples with MYC and BCL6 rearrangements without BCL2 involvement had better survival outcomes [36].
Figure 1 visually underscores the differentiation of lymphoma subtypes based on their gene expression, highlighting the significant influence of MYC status [37]. Notably, Group III distinguishes itself from Groups I and II by displaying both high MYC expression and frequent MYC translocations. These characteristics align with a substantial number of differentially expressed genes, as illustrated in the comparison between Group I and Group III, revealing 167 differentially expressed genes—representing more than half of the genes covered by the HTG EdgeSeq Pan B-Cell Lymphoma Panel.
Furthermore, the analysis extends beyond MYC, considering the translocation status of BCL2 and BCL6, the Ki-67 index, and the Hans algorithm [23]. These factors, in conjunction with MYC, collectively exert a considerable impact on gene expression.
Group III significantly differs from Groups I and II regarding the Hans algorithm. Almost all GCB-like lymphomas are found in Group III. Most lymphomas in Group III are DLBCL, with only two cases being HGBL NOS. Non-GCB DLBCL is associated with significantly worse outcomes when treated with standard therapy, characterized by constitutive NF-κB activation [38]. NF-κB activation, along with other key signaling pathways such as JAK-STAT, is a significant feature of DLBCL, significantly contributing to its pathogenesis [39]. The transcription factor NF-κB has a high impact on cell proliferation and cell death, binding to a DNA motif known as the κB-motif, located in promoters or enhancers of various genes. This often leads to increased transcription of corresponding genes [40]. More than 500 target genes of NF-κB are known [41], including BCL2A1, CCND2, CD44, and MIR155HG, which are frequently identified as differentially expressed across histological entities (Figure 2A–D) [42,43,44,45]. MIR155HG is involved in various physiological and pathological processes and can function as an oncogene [46].
A more detailed consideration of gene expression differences revealed a higher expression of CCND2 and CD44 in Group III compared to Groups I and II. CD44, a receptor of the extracellular matrix, is involved in lymphocyte activation and tumor development [47,48]. Group I shows increased expression of BMP7, as well as decreased expression of MIR155HG, SEMA7A, and BCL2A1. These results highly correlate with the gene expression profiles and characteristics of BL and DLBCL. DLBCL harbors translocations in a proportion of cases involving the genes for MYC, BCL2, and BCL6 and expresses the pan B-cell markers CD20, CD22, and CD79a [23]. BATF encodes a leucine zipper protein that belongs to the AP-1/ATF superfamily of transcription factors. It facilitates dimerization with members of the Jun protein family. The protein is believed to act as a negative regulator of AP-1/ATF transcriptional events [49]. An increased expression of BATF, BCL2A1, and CD44 in DLBCL compared to BL reported by Dave et al. and Hummel et al. could also be found with our gene expression analysis (Figure 2A) [6,7]. This observation extends to the expression of MIR155HG in DLBCL when compared to HGBL DH (Figure 2B) [46].
Interestingly, the comparison of DLBCL and HGBL DH disclosed an increased expression of EBI3 and PIM2 in DLBCL (Figure 2B). An increased expression of EBI3 in DLBCL has already been reported by Dave et al. [6]. EBI3 is an EBV-induced cytokine; in a study by Niedobitek et al., no EBI3 expression was observed in BL [50]. Analyzing EBI3 expression could be useful in distinguishing between BL and DLBCL [51]. PIM2 encodes a proto-oncogene with serine/threonine kinase activity, which is involved in cell survival and proliferation and one isoform of PIM serine/threonine kinases. In 2011, Gómez-Abad et al. showed an overexpression of PIM serine/threonine kinases in general in DLBCL [52]. Panea et al. and Dave et al. reported an increased expression of PIM1, another isoform, in DLBCL [6,53]. An overexpression of PIM serine/threonine kinases (mainly PIM1) has already been described for DLBCL [6,52,53] and is now completed for PIM2 by the results of our study. Inhibition of PIM2 could be a potential therapeutic approach for patients with DLBCL [52].
Additionally, SMIM14 was found to be expressed at lower levels in DLBCL. SMIM14, also known as C4orf34 (chromosome 4 open reading frame 34), has not yet been fully functionally characterized. However, Jun et al. suggest that SMIM14 is an endoplasmic reticulum (ER)-resident type I transmembrane protein and may be involved in ER functions [54]. Given that SMIM14 is more highly expressed in HGBL DH and NOS compared to DLBCL, this could be an interesting approach to better distinguish between HGBL DH, NOS, and DLBCL.
Li et al. recently found that HGBL NOS patients frequently carry MYC translocations, which could be confirmed by our findings described in this study (Figure 1) [55]. Li et al. also reported that HGBL NOS has clinicopathologic features and a gene expression profile more similar to DLBCL/HGBL DH than to DLBCL [55]. This supports our findings depicted in Figure 2D, where HGBL DH and NOS could not be separated properly based on gene expression. As it is a relatively small collection, it is difficult to say whether HGBL DH or NOS can be better distinguished from BL or DLBCL. However, three cases of HGBL DH and NOS exhibit a similar expression pattern to BL and, like all BL cases, belong to gene expression group I (Figure 1).
Further, we conducted a mutation analysis using NGS with the Oncomine Lymphoma Panel, targeting 25 genes. We used the assay to detect pathogenic and likely pathogenic mutations as well as VUS in our cohort of aggressive BCL. We showed that most mutations were located in the genes MYC, BCL2, ARID1A, KMT2D, PIM1, and SOCS1 (Figure 3B), which is consistent with previously reported findings and reflects the reliability of our results [53,56,57,58]. Despite the low number of BL cases, they predominantly exhibited MYC and ARID1A mutations, which is in line with the current literature [53,59,60]. Also, the analyzed DLBCL cases were consistent with previous datasets, where KMT2D, TP53, PIM1, BCL2, or HIST1H1E were detected for this entity [56,61,62]. Additionally, in four DLBCL cases, we identified the DLBCL diagnosis assisting mutations CD79B Y197 and/or MYD88 L265P [63], with the CD79B Y197 being restricted to DLBCL, but for MYD88, we found a L265P in a case of HGBL NOS (Table 1). The heterogeneous subtype of HGBL DH was mainly characterized by BCL2, CREBBP, and KMT2D mutations in agreement with the results of Cucco et al., 2020 [58]. The mutational landscape specific to HGBL NOS is poorly understood. Li and colleagues showed a heterogeneous mutational pattern with TP53 and KMT2D, with MYC and TNFRSF14 being the most affected genes [55], which is largely consistent with the data found for HGBL DH. In our data, MYC and PIM1 were the most altered genes in HGBL NOS cases. In the six analyzed cases, neither TP53 nor KMT2D were affected (Table 1).
Notably, we also detected mutations in TNFAIP3 and CD79B directly affecting NF-κB signaling only in DLBCL cases, while (pathogenic) CREBBP mutations influencing histone modification mostly occurred in HGBL DH. This result indicates a completely different pathogenic mechanism in DLBCL in contrast to BL, HGBL DH, and HGBL NOS. Davis et al. reported already in 2001 that activated B-cell-like DLBCL shows high expression of target genes of the NF-κB transcription factors [64]. Compagno et al. reported that mutations of multiple genes cause deregulation of NF-κB in DLBCL, among them predominantly A20 mutations [65]. At least for BL, Dave et al. suggested that, unlike most B-cell lymphomas, the formation of BL may not depend on the NF-κB signaling pathway but has a unique pathogenic mechanism [6,7,66].
For the proposed gene expression groups, MYC, ARID1A, KMT2D, and TP53 were identified as genes that appear group-specific. MYC and ARID1A are most frequently altered in Group I (Figure 3D). This is even more pronounced when only pathogenic and likely pathogenic variants are considered (Figure 4). Gene Expression Group II represents 60% of cases with KMT2D and/or TP53 alterations, highlighting the genetic similarities of this group. KMT2D (also known as MLL2) and TP53 alterations have also been described by Bouska et al. and are critical genomic features in adult HGBL, particularly in HGBL with a BL-like profile, providing insights into the underlying mechanisms of tumorigenesis [67]. KMT2D mutations are frequently found in adult HGBL with a BL-like profile pointing to a distinct tumorigenesis pathway, separate from FL or GCB-like DLBCL [67]. Furthermore, Bouska et al. reported that most TP53 mutations occurred in the DNA binding domain, particularly at hotspot residues like R248 and R273, impairing p53-mediated apoptosis, a key mechanism in aggressive lymphomas [67]. Consistent with the current WHO classification, most HGBL DH cases are among GCB-like DLBCL cases in Group II, whereas non-GCB DLBCL cases are present in Group III [5].
Pathogenic mutations in PIM1 were identified in 45% of cases belonging to Group III, while no such mutations were detected in either Group I or Group II. Also, all CD79B-mutated DLBCL are present in Group III. CD79B mutations, as described by Schmitz et al., play a crucial role in B-cell receptor signaling and suggest a reliance on this pathway for tumor survival. These mutations open the door for targeted therapies and influence treatment outcomes, underscoring the importance of genetic profiling in guiding personalized therapy for DLBCL patients [68]. It is also interesting to note that in our cohort, two cases (Cases 46 and 48) stand out due to a somatic hypermutation of PIM1. These two cases belong diagnostically to different BCL subtypes (DLBCL and HGBL NOS). However, when grouped according to the distribution of expression patterns, these two hypermutated PIM1 cases are assigned to Group III. In DLBCL and also in HGBL DH, somatic hypermutation events have been observed in PIM1 [56,69], but this event has not been described for HGBL NOS so far. HGBL NOS cases are distributed across all gene expression groups, highlighting the complexity and the current status of lymphoma classification. Understanding the HGBL NOS subtype is essential for optimizing patient care and improving prognostic outcomes. Currently, this designation is used when the lymphoma exhibits aggressive features but lacks the defining genetic alterations that characterize other subtypes [5,12].
In conclusion of the mutational analysis, our data underline the need for molecular profiling for aggressive BCL to improve our understanding of the different subtypes and to identify mutational patterns that might be able to support diagnostics.
Additionally, IG gene rearrangement analysis was conducted to detect the V-, D-, and J-composition of the tumor B-cell clones. EuroClonality-NGS analysis initially confirmed clonality in 92% of all cases. However, in two cases, no clear clonality was detectable of either light or heavy chain genes of the B-cell receptor. Most likely, extensive somatic hypermutation prevents primer binding in these cases but also increases DNA fragmentation due to the formalin fixation method, which might contribute to the absence of detectable B-cell clonality. Examining V-/J-segments among dominant clonotypes revealed heterogeneity, making pure clonality observation insufficient for distinct subtype discrimination. Notably, HGBL DH showed frequent use of J4 in the heavy chain, but no pattern was observed for the light chain. Further investigation requires a substantial increase in sample size for each group to provide a representative statement.

5. Conclusions

Our results show that aggressive BCL is a heterogeneous group of lymphomas with distinct and overlapping histological, clinical, and molecular characteristics. Despite some discriminating features that support their biological differences, precise sub-grouping is not possible in all individual cases. It remains to be elucidated whether more comprehensive molecular analysis might be able to identify biomarkers with more discriminatory power.

Supplementary Materials

The following supporting information can be downloaded at https://www.mdpi.com/article/10.3390/jmp5040028/s1, Table S1: Overview of identified clonal/most dominant rearrangements of the heavy and light chain.

Author Contributions

Conceptualization, K.D.F., C.C.H., K.K. and M.H.; methodology, K.D.F., C.C.H. and K.K.; validation, K.D.F., C.C.H., K.K., M.T. and M.H.; formal analysis, K.D.F., C.C.H. and K.K.; data curation, K.D.F., C.C.H., K.K. and M.T.; writing—original draft preparation, K.D.F., C.C.H., K.K. and M.T.; writing—review and editing, K.D.F., C.C.H., K.K. and M.H.; visualization, K.D.F., C.C.H. and K.K.; supervision, M.H.; project administration, M.H.; funding acquisition, M.H. All authors have read and agreed to the published version of the manuscript.

Funding

This work was supported via intramural funding from Charité Medical University, Berlin.

Institutional Review Board Statement

This study was conducted in accordance with the Declaration of Helsinki and approved by the Charité Ethics Commission, Berlin (EA4/129/15).

Data Availability Statement

The datasets used and/or analyzed during the current study are available from the corresponding author upon reasonable request.

Acknowledgments

The authors wish to acknowledge Selina Gaertner, Maryam Rastegar, and Douglas Hurd, as employees of HTG Molecular Diagnostics, for guidance and assistance during RNA preparation and gene expression analysis. Furthermore, we would like to acknowledge Ines Koch for technical assistance.

Conflicts of Interest

The authors declare no conflicts of interest.

References

  1. Fend, F.; Quintanilla-Martinez, L.; Kumar, S.; Beaty, M.W.; Blum, L.; Sorbara, L.; Jaffe, E.S.; Raffeld, M. Composite Low Grade B-Cell Lymphomas with Two Immunophenotypically Distinct Cell Populations Are True Biclonal Lymphomas. Am. J. Pathol. 1999, 154, 1857–1866. [Google Scholar] [CrossRef] [PubMed]
  2. Mugnaini, E.N.; Ghosh, N. Lymphoma. Prim. Care Clin. Off. Pract. 2016, 43, 661–675. [Google Scholar] [CrossRef] [PubMed]
  3. Swerdlow, S.H.; Campo, E.; Pileri, S.A.; Harris, N.L.; Stein, H.; Siebert, R.; Advani, R.; Ghielmini, M.; Salles, G.A.; Zelenetz, A.D.; et al. The 2016 Revision of the World Health Organization Classification of Lymphoid Neoplasms. Blood 2016, 127, 2375–2390. [Google Scholar] [CrossRef] [PubMed]
  4. Swerdlow, S.; Campo, E.; Harris, N.; Jaffe, E.; Pileri, S.; Stein, H.; Thiele, J.; Vardiman, J. WHO Classification: Tumours of the Haematopoietic and Lymphoid Tissues. IARC Press: Lyon, France, 2008; ISBN 9789283224310. [Google Scholar]
  5. Coupland, S.E.; Du, M.; Ferry, J.A.; de Jong, D.; Khoury, J.D.; Leoncini, L.; Naresh, K.N.; Ott, G.; Siebert, R.; Xerri, L. The Fifth Edition of the WHO Classification of Mature B-cell Neoplasms: Open Questions for Research. J. Pathol. 2024, 262, 255–270. [Google Scholar] [CrossRef]
  6. Dave, S.S.; Fu, K.; Wright, G.W.; Lam, L.T.; Kluin, P.; Boerma, E.-J.; Greiner, T.C.; Weisenburger, D.D.; Rosenwald, A.; Ott, G.; et al. Molecular Diagnosis of Burkitt’s Lymphoma. N. Engl. J. Med. 2006, 354, 2431–2442. [Google Scholar] [CrossRef]
  7. Hummel, M.; Bentink, S.; Berger, H.; Klapper, W.; Wessendorf, S.; Barth, T.F.E.; Bernd, H.-W.; Cogliatti, S.B.; Dierlamm, J.; Feller, A.C.; et al. A Biologic Definition of Burkitt’s Lymphoma from Transcriptional and Genomic Profiling. N. Engl. J. Med. 2006, 354, 2419–2430. [Google Scholar] [CrossRef]
  8. Dalla-Favera, R.; Bregni, M.; Erikson, J.; Patterson, D.; Gallo, R.C.; Croce, C.M. Human C-Myc Onc Gene Is Located on the Region of Chromosome 8 That Is Translocated in Burkitt Lymphoma Cells. Proc. Natl. Acad. Sci. USA 1982, 79, 7824–7827. [Google Scholar] [CrossRef]
  9. Taub, R.; Kirsch, I.; Morton, C.; Lenoir, G.; Swan, D.; Tronick, S.; Aaronson, S.; Leder, P. Translocation of the C-Myc Gene into the Immunoglobulin Heavy Chain Locus in Human Burkitt Lymphoma and Murine Plasmacytoma Cells. Proc. Natl. Acad. Sci. USA 1982, 79, 7837–7841. [Google Scholar] [CrossRef]
  10. Karunakaran, P.; Selvarajan, G.; PK, J.; Mehra, N.; Sundersingh, S.; Dhanushkodi, M.; Rajan, A.K.; Kesana, S.; Sagar, T.G.; Kannan, K.; et al. High-Grade B-Cell Lymphoma,NOS: Does Prognosis End with the Diagnosis?—A Retrospective Analysis. Blood 2020, 136, 28–29. [Google Scholar] [CrossRef]
  11. Li, J.; Liu, X.; Yao, Z.; Zhang, M. High-Grade B-Cell Lymphomas, Not Otherwise Specified: A Study of 41 Cases. Cancer Manag. Res. 2020, 12, 1903–1912. [Google Scholar] [CrossRef]
  12. Arber, D.A.; Orazi, A.; Hasserjian, R.P.; Borowitz, M.J.; Calvo, K.R.; Kvasnicka, H.-M.; Wang, S.A.; Bagg, A.; Barbui, T.; Branford, S.; et al. International Consensus Classification of Myeloid Neoplasms and Acute Leukemias: Integrating Morphologic, Clinical, and Genomic Data. Blood 2022, 140, 1200–1228. [Google Scholar] [CrossRef] [PubMed]
  13. Hilton, L.K.; Collinge, B.; Ben-Neriah, S.; Alduaij, W.; Shaalan, H.; Weng, A.P.; Cruz, M.; Slack, G.W.; Farinha, P.; Miyata-Takata, T.; et al. Motive and Opportunity: MYC Rearrangements in High-Grade B-Cell Lymphoma with MYC and BCL2 Rearrangements (an LLMPP Study). Blood 2024, 144, 525–540. [Google Scholar] [CrossRef]
  14. Yamashita, T.; Vollbrecht, C.; Hirsch, B.; Kleo, K.; Anagnostopoulos, I.; Hummel, M. Integrative Genomic Analysis Focused on Cell Cycle Genes for MYC-Driven Aggressive Mature B-Cell Lymphoma. J. Clin. Exp. Hematop. 2020, 60, 87–96. [Google Scholar] [CrossRef]
  15. Sherry, S.T.; Ward, M.H.; Kholodov, M.; Baker, J.; Phan, L.; Smigielski, E.M.; Sirotkin, K. DbSNP: The NCBI Database of Genetic Variation. Nucleic Acids Res. 2001, 29, 308–311. [Google Scholar] [CrossRef] [PubMed]
  16. Cerami, E.; Gao, J.; Dogrusoz, U.; Gross, B.E.; Sumer, S.O.; Aksoy, B.A.; Jacobsen, A.; Byrne, C.J.; Heuer, M.L.; Larsson, E.; et al. The CBio Cancer Genomics Portal: An Open Platform for Exploring Multidimensional Cancer Genomics Data. Cancer Discov. 2012, 2, 401–404. [Google Scholar] [CrossRef] [PubMed]
  17. Gao, J.; Aksoy, B.A.; Dogrusoz, U.; Dresdner, G.; Gross, B.; Sumer, S.O.; Sun, Y.; Jacobsen, A.; Sinha, R.; Larsson, E.; et al. Integrative Analysis of Complex Cancer Genomics and Clinical Profiles Using the CBioPortal. Sci. Signal. 2013, 6, pl1. [Google Scholar] [CrossRef]
  18. Henrie, A.; Hemphill, S.E.; Ruiz-Schultz, N.; Cushman, B.; DiStefano, M.T.; Azzariti, D.; Harrison, S.M.; Rehm, H.L.; Eilbeck, K. ClinVar Miner: Demonstrating Utility of a Web-Based Tool for Viewing and Filtering ClinVar Data. Hum. Mutat. 2018, 39, 1051–1060. [Google Scholar] [CrossRef]
  19. Karczewski, K.J.; Francioli, L.C.; Tiao, G.; Cummings, B.B.; Alföldi, J.; Wang, Q.; Collins, R.L.; Laricchia, K.M.; Ganna, A.; Birnbaum, D.P.; et al. The Mutational Constraint Spectrum Quantified from Variation in 141,456 Humans. Nature 2020, 581, 434–443. [Google Scholar] [CrossRef]
  20. van den Brand, M.; Rijntjes, J.; Möbs, M.; Steinhilber, J.; van der Klift, M.Y.; Heezen, K.C.; Kroeze, L.I.; Reigl, T.; Porc, J.; Darzentas, N.; et al. Next-Generation Sequencing-Based Clonality Assessment of Ig Gene Rearrangements: A Multicenter Validation Study by EuroClonality-NGS. J. Mol. Diagn. 2021, 23, 1105–1115. [Google Scholar] [CrossRef]
  21. Scheijen, B.; Meijers, R.W.J.; Rijntjes, J.; van der Klift, M.Y.; Möbs, M.; Steinhilber, J.; Reigl, T.; van den Brand, M.; Kotrová, M.; Ritter, J.-M.; et al. Next-Generation Sequencing of Immunoglobulin Gene Rearrangements for Clonality Assessment: A Technical Feasibility Study by EuroClonality-NGS. Leukemia 2019, 33, 2227–2240. [Google Scholar] [CrossRef]
  22. Bystry, V.; Reigl, T.; Krejci, A.; Demko, M.; Hanakova, B.; Grioni, A.; Knecht, H.; Schlitt, M.; Dreger, P.; Sellner, L.; et al. ARResT/Interrogate: An Interactive Immunoprofiler for IG/TR NGS Data. Bioinformatics 2017, 33, 435–437. [Google Scholar] [CrossRef] [PubMed]
  23. Hans, C.P. Confirmation of the Molecular Classification of Diffuse Large B-Cell Lymphoma by Immunohistochemistry Using a Tissue Microarray. Blood 2004, 103, 275–282. [Google Scholar] [CrossRef] [PubMed]
  24. Zeisberg, M.; Hanai, J.; Sugimoto, H.; Mammoto, T.; Charytan, D.; Strutz, F.; Kalluri, R. BMP-7 Counteracts TGF-Β1–Induced Epithelial-to-Mesenchymal Transition and Reverses Chronic Renal Injury. Nat. Med. 2003, 9, 964–968. [Google Scholar] [CrossRef] [PubMed]
  25. Huse, K.; Bakkebø, M.; Oksvold, M.P.; Forfang, L.; Hilden, V.I.; Stokke, T.; Smeland, E.B.; Myklebust, J.H. Bone Morphogenetic Proteins Inhibit CD40L/IL-21-Induced Ig Production in Human Bcells: Differential Effects of BMP-6 and BMP-7. Eur. J. Immunol. 2011, 41, 3135–3145. [Google Scholar] [CrossRef] [PubMed]
  26. Taylor, S.S.; Kim, C.; Cheng, C.Y.; Brown, S.H.J.; Wu, J.; Kannan, N. Signaling through CAMP and CAMP-Dependent Protein Kinase: Diverse Strategies for Drug Design. Biochim. Biophys. Acta 2008, 1784, 16–26. [Google Scholar] [CrossRef]
  27. Vogler, M. BCL2A1: The Underdog in the BCL2 Family. Cell Death Differ. 2012, 19, 67–74. [Google Scholar] [CrossRef]
  28. Wu, K.-J.; Grandori, C.; Amacker, M.; Simon-Vermot, N.; Polack, A.; Lingner, J.; Dalla-Favera, R. Direct Activation of TERT Transcription by C-MYC. Nat. Genet. 1999, 21, 220–224. [Google Scholar] [CrossRef]
  29. Blackburn, E.H.; Gall, J.G. A Tandemly Repeated Sequence at the Termini of the Extrachromosomal Ribosomal RNA Genes in Tetrahymena. J. Mol. Biol. 1978, 120, 33–53. [Google Scholar] [CrossRef]
  30. Moyzis, R.K.; Buckingham, J.M.; Cram, L.S.; Dani, M.; Deaven, L.L.; Jones, M.D.; Meyne, J.; Ratliff, R.L.; Wu, J.R. A Highly Conserved Repetitive DNA Sequence, (TTAGGG)n, Present at the Telomeres of Human Chromosomes. Proc. Natl. Acad. Sci. USA 1988, 85, 6622–6626. [Google Scholar] [CrossRef]
  31. López, C.; Kleinheinz, K.; Aukema, S.M.; Rohde, M.; Bernhart, S.H.; Hübschmann, D.; Wagener, R.; Toprak, U.H.; Raimondi, F.; Kreuz, M.; et al. Genomic and Transcriptomic Changes Complement Each Other in the Pathogenesis of Sporadic Burkitt Lymphoma. Nat. Commun. 2019, 10, 1459. [Google Scholar] [CrossRef]
  32. Alaggio, R.; Amador, C.; Anagnostopoulos, I.; Attygalle, A.D.; Araujo, I.B.D.O.; Berti, E.; Bhagat, G.; Borges, A.M.; Boyer, D.; Calaminici, M.; et al. The 5th Edition of the World Health Organization Classification of Haematolymphoid Tumours: Lymphoid Neoplasms. Leukemia 2022, 36, 1720–1748. [Google Scholar] [CrossRef] [PubMed]
  33. Dang, C.V.; O’Donnell, K.A.; Zeller, K.I.; Nguyen, T.; Osthus, R.C.; Li, F. The C-Myc Target Gene Network. Semin. Cancer Biol. 2006, 16, 253–264. [Google Scholar] [CrossRef] [PubMed]
  34. Cowling, V.H.; Cole, M.D. Mechanism of Transcriptional Activation by the Myc Oncoproteins. Semin. Cancer Biol. 2006, 16, 242–252. [Google Scholar] [CrossRef] [PubMed]
  35. Nie, Z.; Hu, G.; Wei, G.; Cui, K.; Yamane, A.; Resch, W.; Wang, R.; Green, D.R.; Tessarollo, L.; Casellas, R.; et al. C-Myc Is a Universal Amplifier of Expressed Genes in Lymphocytes and Embryonic Stem Cells. Cell 2012, 151, 68–79. [Google Scholar] [CrossRef] [PubMed]
  36. Blomme, S.; De Paepe, P.; Devos, H.; Emmerechts, J.; Snauwaert, S.; Cauwelier, B. Alternative Genetic Alterations of MYC, BCL2, and/or BCL6 in High-grade B-cell Lymphoma (HGBL) and Diffuse Large B-cell Lymphoma (DLBCL): Can We Identify Different Prognostic Subgroups? Genes Chromosomes Cancer 2024, 63, e23211. [Google Scholar] [CrossRef]
  37. Menssen, A.; Hermeking, H. Characterization of the C-MYC-Regulated Transcriptome by SAGE: Identification and Analysis of c-MYC Target Genes. Proc. Natl. Acad. Sci. USA 2002, 99, 6274–6279. [Google Scholar] [CrossRef]
  38. Feuerhake, F. NF B Activity, Function, and Target-Gene Signatures in Primary Mediastinal Large B-Cell Lymphoma and Diffuse Large B-Cell Lymphoma Subtypes. Blood 2005, 106, 1392–1399. [Google Scholar] [CrossRef]
  39. Chapuy, B.; Stewart, C.; Dunford, A.J.; Kim, J.; Kamburov, A.; Redd, R.A.; Lawrence, M.S.; Roemer, M.G.M.; Li, A.J.; Ziepert, M.; et al. Author Correction: Molecular Subtypes of Diffuse Large B Cell Lymphoma Are Associated with Distinct Pathogenic Mechanisms and Outcomes. Nat. Med. 2018, 24, 1290–1291. [Google Scholar] [CrossRef]
  40. Oeckinghaus, A.; Ghosh, S. The NF-KappaB Family of Transcription Factors and Its Regulation. Cold Spring Harb. Perspect. Biol. 2009, 1, a000034. [Google Scholar] [CrossRef]
  41. Gupta, S.C.; Sundaram, C.; Reuter, S.; Aggarwal, B.B. Inhibiting NF-ΚB Activation by Small Molecules as a Therapeutic Strategy. Biochim. Biophys. Acta (BBA)-Gene Regul. Mech. 2010, 1799, 775–787. [Google Scholar] [CrossRef]
  42. Grumont, R.J.; Rourke, I.J.; Gerondakis, S. Rel-Dependent Induction of A1 Transcription Is Required to Protect B Cells from Antigen Receptor Ligation-Induced Apoptosis. Genes Dev. 1999, 13, 400–411. [Google Scholar] [CrossRef] [PubMed]
  43. Hinz, M.; Lemke, P.; Anagnostopoulos, I.; Hacker, C.; Krappmann, D.; Mathas, S.; Doerken, B.; Zenke, M.; Stein, H.; Scheidereit, C. Nuclear Factor ΚB–Dependent Gene Expression Profiling of Hodgkin’s Disease Tumor Cells, Pathogenetic Significance, and Link to Constitutive Signal Transducer and Activator of Transcription 5a Activity. J. Exp. Med. 2002, 196, 605–617. [Google Scholar] [CrossRef] [PubMed]
  44. Huang, Y.; Ohtani, K.; Iwanaga, R.; Matsumura, Y.; Nakamura, M. Direct Trans-Activation of the Human Cyclin D2 Gene by the Oncogene Product Tax of Human T-Cell Leukemia Virus Type I. Oncogene 2001, 20, 1094–1102. [Google Scholar] [CrossRef] [PubMed]
  45. Tili, E.; Michaille, J.-J.; Cimino, A.; Costinean, S.; Dumitru, C.D.; Adair, B.; Fabbri, M.; Alder, H.; Liu, C.G.; Calin, G.A.; et al. Modulation of MiR-155 and MiR-125b Levels Following Lipopolysaccharide/TNF-α Stimulation and Their Possible Roles in Regulating the Response to Endotoxin Shock. J. Immunol. 2007, 179, 5082–5089. [Google Scholar] [CrossRef]
  46. Kluiver, J.; Poppema, S.; de Jong, D.; Blokzijl, T.; Harms, G.; Jacobs, S.; Kroesen, B.-J.; van den Berg, A. BIC and MiR-155 Are Highly Expressed in Hodgkin, Primary Mediastinal and Diffuse Large B Cell Lymphomas. J. Pathol. 2005, 207, 243–249. [Google Scholar] [CrossRef]
  47. Chen, J.; Wang, J. Risk of Regorafenib-Induced Cardiovascular Events in Patients with Solid Tumors. Medicine 2018, 97, e12705. [Google Scholar] [CrossRef]
  48. Senbanjo, L.T.; Chellaiah, M.A. CD44: A Multifunctional Cell Surface Adhesion Receptor Is a Regulator of Progression and Metastasis of Cancer Cells. Front. Cell Dev. Biol. 2017, 5, 18. [Google Scholar] [CrossRef]
  49. Echlin, D.R.; Tae, H.-J.; Mitin, N.; Taparowsky, E.J. B-ATF Functions as a Negative Regulator of AP-1 Mediated Transcription and Blocks Cellular Transformation by Ras and Fos. Oncogene 2000, 19, 1752–1763. [Google Scholar] [CrossRef]
  50. Niedobitek, G.; Päzolt, D.; Teichmann, M.; Devergne, O. Frequent Expression of the Epstein-Barr Virus (EBV)-Induced Gene, EBI3, an IL-12 P40-Related Cytokine, in Hodgkin and Reed-Sternberg Cells. J. Pathol. 2002, 198, 310–316. [Google Scholar] [CrossRef]
  51. Gonin, J.; Larousserie, F.; Bastard, C.; Picquenot, J.-M.; Couturier, J.; Radford-Weiss, I.; Dietrich, C.; Brousse, N.; Vacher-Lavenu, M.-C.; Devergne, O. Epstein-Barr Virus-Induced Gene 3 (EBI3): A Novel Diagnosis Marker in Burkitt Lymphoma and Diffuse Large B-Cell Lymphoma. PLoS ONE 2011, 6, e24617. [Google Scholar] [CrossRef]
  52. Gómez-Abad, C.; Pisonero, H.; Blanco-Aparicio, C.; Roncador, G.; González-Menchén, A.; Martinez-Climent, J.A.; Mata, E.; Rodríguez, M.E.; Muñoz-González, G.; Sánchez-Beato, M.; et al. PIM2 Inhibition as a Rational Therapeutic Approach in B-Cell Lymphoma. Blood 2011, 118, 5517–5527. [Google Scholar] [CrossRef] [PubMed]
  53. Panea, R.I.; Love, C.L.; Shingleton, J.R.; Reddy, A.; Bailey, J.A.; Moormann, A.M.; Otieno, J.A.; Ong’echa, J.M.; Oduor, C.I.; Schroeder, K.M.S.; et al. The Whole-Genome Landscape of Burkitt Lymphoma Subtypes. Blood 2019, 134, 1598–1607. [Google Scholar] [CrossRef] [PubMed]
  54. Jun, M.-H.; Jun, Y.-W.; Kim, K.-H.; Lee, J.-A.; Jang, D.-J. Characterization of the Cellular Localization of C4orf34 as a Novel Endoplasmic Reticulum Resident Protein. BMB Rep. 2014, 47, 563–568. [Google Scholar] [CrossRef] [PubMed]
  55. Li, S.; Qiu, L.; Xu, J.; Lin, P.; Ok, C.Y.; Tang, G.; McDonnell, T.J.; James You, M.; Khanlari, M.; Miranda, R.N.; et al. High-Grade B-Cell Lymphoma (HGBL)-NOS Is Clinicopathologically and Genetically More Similar to DLBCL/HGBL-DH than DLBCL. Leukemia 2023, 37, 422–432. [Google Scholar] [CrossRef] [PubMed]
  56. Pasqualucci, L.; Dalla-Favera, R. Genetics of Diffuse Large B-Cell Lymphoma. Blood 2018, 131, 2307–2319. [Google Scholar] [CrossRef]
  57. Haberl, S.; Haferlach, T.; Stengel, A.; Jeromin, S.; Kern, W.; Haferlach, C. MYC Rearranged B-Cell Neoplasms: Impact of Genetics on Classification. Cancer Genet. 2016, 209, 431–439. [Google Scholar] [CrossRef]
  58. Cucco, F.; Barrans, S.; Sha, C.; Clipson, A.; Crouch, S.; Dobson, R.; Chen, Z.; Thompson, J.S.; Care, M.A.; Cummin, T.; et al. Distinct Genetic Changes Reveal Evolutionary History and Heterogeneous Molecular Grade of DLBCL with MYC/BCL2 Double-Hit. Leukemia 2020, 34, 1329–1341. [Google Scholar] [CrossRef]
  59. Grande, B.M.; Gerhard, D.S.; Jiang, A.; Griner, N.B.; Abramson, J.S.; Alexander, T.B.; Allen, H.; Ayers, L.W.; Bethony, J.M.; Bhatia, K.; et al. Genome-Wide Discovery of Somatic Coding and Noncoding Mutations in Pediatric Endemic and Sporadic Burkitt Lymphoma. Blood 2019, 133, 1313–1324. [Google Scholar] [CrossRef]
  60. Love, C.; Sun, Z.; Jima, D.; Li, G.; Zhang, J.; Miles, R.; Richards, K.L.; Dunphy, C.H.; Choi, W.W.L.; Srivastava, G.; et al. The Genetic Landscape of Mutations in Burkitt Lymphoma. Nat. Genet. 2012, 44, 1321–1325. [Google Scholar] [CrossRef]
  61. Reddy, A.; Zhang, J.; Davis, N.S.; Moffitt, A.B.; Love, C.L.; Waldrop, A.; Leppa, S.; Pasanen, A.; Meriranta, L.; Karjalainen-Lindsberg, M.-L.; et al. Genetic and Functional Drivers of Diffuse Large B Cell Lymphoma. Cell 2017, 171, 481–494.e15. [Google Scholar] [CrossRef]
  62. Fan, Z.; Pei, R.; Sha, K.; Chen, L.; Wang, T.; Lu, Y. Comprehensive Characterization of Driver Genes in Diffuse Large B Cell Lymphoma. Oncol. Lett. 2020, 20, 382–390. [Google Scholar] [CrossRef] [PubMed]
  63. Chakravarty, D.; Gao, J.; Phillips, S.; Kundra, R.; Zhang, H.; Wang, J.; Rudolph, J.E.; Yaeger, R.; Soumerai, T.; Nissan, M.H.; et al. OncoKB: A Precision Oncology Knowledge Base. JCO Precis. Oncol. 2017, 1, 1–16. [Google Scholar] [CrossRef] [PubMed]
  64. Davis, R.E.; Brown, K.D.; Siebenlist, U.; Staudt, L.M. Constitutive Nuclear Factor ΚB Activity Is Required for Survival of Activated B Cell–like Diffuse Large B Cell Lymphoma Cells. J. Exp. Med. 2001, 194, 1861–1874. [Google Scholar] [CrossRef] [PubMed]
  65. Compagno, M.; Lim, W.K.; Grunn, A.; Nandula, S.V.; Brahmachary, M.; Shen, Q.; Bertoni, F.; Ponzoni, M.; Scandurra, M.; Califano, A.; et al. Mutations of Multiple Genes Cause Deregulation of NF-ΚB in Diffuse Large B-Cell Lymphoma. Nature 2009, 459, 717–721. [Google Scholar] [CrossRef] [PubMed]
  66. Schmitz, R.; Young, R.M.; Ceribelli, M.; Jhavar, S.; Xiao, W.; Zhang, M.; Wright, G.; Shaffer, A.L.; Hodson, D.J.; Buras, E.; et al. Burkitt Lymphoma Pathogenesis and Therapeutic Targets from Structural and Functional Genomics. Nature 2012, 490, 116–120. [Google Scholar] [CrossRef]
  67. Bouska, A.; Bi, C.; Lone, W.; Zhang, W.; Kedwaii, A.; Heavican, T.; Lachel, C.M.; Yu, J.; Ferro, R.; Eldorghamy, N.; et al. Adult High-Grade B-Cell Lymphoma with Burkitt Lymphoma Signature: Genomic Features and Potential Therapeutic Targets. Blood 2017, 130, 1819–1831. [Google Scholar] [CrossRef]
  68. Schmitz, R.; Wright, G.W.; Huang, D.W.; Johnson, C.A.; Phelan, J.D.; Wang, J.Q.; Roulland, S.; Kasbekar, M.; Young, R.M.; Shaffer, A.L.; et al. Genetics and Pathogenesis of Diffuse Large B-Cell Lymphoma. N. Engl. J. Med. 2018, 378, 1396–1407. [Google Scholar] [CrossRef]
  69. Künstner, A.; Witte, H.M.; Riedl, J.; Bernard, V.; Stölting, S.; Merz, H.; Olschewski, V.; Peter, W.; Ketzer, J.; Busch, Y.; et al. Mutational Landscape of High-Grade B-Cell Lymphoma with MYC-, BCL2 and/or BCL6 Rearrangements Characterized by Whole-Exome Sequencing. Haematologica 2022, 107, 1850–1863. [Google Scholar] [CrossRef]
Figure 1. Hierarchical cluster analysis based on the expression of 298 genes with correlation to other features. The case numbers and the four histopathological entities Burkitt lymphoma (BL), diffuse large B-cell lymphoma (DLBCL), high-grade B-cell lymphoma (HGBL) double-hit (DH), and HGBL not otherwise specified (NOS) are displayed in the upper part. Fluorescence in situ hybridization (FISH) results (germinal center B-cell like (GCB) or non-GCB), MYC expression, proliferative activity (Ki-67 index), MYC, BCL2, and BCL6 translocation are presented [14] as well.
Jmp 05 00028 g001
Figure 2. Pairwise hierarchical cluster analysis based on the gene expression of the 298 genes. The comparison of diffuse large B-cell lymphoma (DLBCL) vs. Burkitt lymphoma (BL) (A), high-grade B-cell lymphoma (HGBL) double-hit (DH) vs. DLBCL (B), HGBL DH vs. BL (C) and HGBL not otherwise specified (NOS) vs. HGBL DH (D) is shown. The heatmaps represent hierarchical cluster analysis as well as expression strengths, which are associated with the hue or color intensity. A blue hue indicates strong expression, while a red hue indicates weak expression. The case numbers are plotted on the horizontal axis, and the ten differentially expressed genes are plotted on the vertical axis.
Jmp 05 00028 g002
Figure 3. Mutational analysis of aggressive B-cell lymphoma. (A,B) The type of detected variants is shown for each histological subtype (A) and as a distribution of the detected mutations sorted by gene (B). In two cases (Cases 46 and 48), PIM1 was hypermutated and is highlighted in shaded gray. (C,D) Bar charts show the percentage of cases with alterations in MYC, ARID1A, KMT2D, BCL2, HIST1H1E, PIM1, TP53, CREBBP, GNA13, SOCS1, and CD79B according to the diagnostic subtypes (C) compared to the gene expression groups (D). (BL, n = 4; DLBCL, n = 16; HGBL DH, n = 8; HGBL NOS, n = 6).
Jmp 05 00028 g003
Figure 4. Hierarchical cluster analysis, molecular characteristics [14] and results from the mutation analysis. The case numbers and the four histopathological entities Burkitt lymphoma (BL), diffuse large B-cell lymphoma (DLBCL), high-grade B-cell lymphoma (HGBL) double-hit (DH), and HGBL not otherwise specified (HGBL NOS) are displayed in the upper part. Fluorescence in situ hybridization (FISH) results (germinal center B-cell like (GCB) or non-GCB), MYC expression, proliferative activity (Ki-67 index), MYC, BCL2, and BCL6 translocation are presented as well and partially depicted from our publication Yamashita et al., 2020 [14]. Identified mutations that are classified as pathogenic or likely pathogenic are highlighted in dark gray.
Jmp 05 00028 g004
Figure 5. V-/D-/J-IG segment usage of the clonal or most dominant IG heavy chain rearrangements. Presented are all clonal or dominant rearrangement patterns with different functionalities, including productive (VJ), unproductive (VJ), or incomplete (DJ) rearrangements. Cases with no or minor dominant B-cell clones were excluded in this diagram (Case 10 and Case 68) (BL, n = 4; DLBCL, n = 15; HGBL DH, n = 7; HGBL NOS, n = 6).
Jmp 05 00028 g005
Figure 6. V-/J-IG segment usage of the clonal or most dominant IG light chain rearrangements. Presented are all clonal or dominant rearrangements with different functionalities, including productive, potentially productive, and unproductive rearrangements. Cases with no or minor dominant B-cell clones were excluded in this diagram (Case 10 and Case 68). (BL, n = 4; DLBCL, n = 15; HGBL DH, n = 7; HGBL NOS, n = 6).
Jmp 05 00028 g006
Table 1. Overview of detected variants in each B-cell lymphoma subtype. Variants classified as likely pathogenic and pathogenic are highlighted in black and variants of uncertain significance in gray. For splice variants, the c.HGVS nomenclature was used.
GeneTranscript IDBLDLBCLHGBL DHHGBL NOS
ARID1ANM_006015Q487*; R693*; Q1145Rfs*16; P1898Hfs*25 2A345_A349del; Q564*; P887L; Y1233H; P1898Hfs*25R1528*; R2116TQ74*; Q1145Rfs*16
ATMNM_000051-K2810Q-C1811Y
B2MNM_004048-M1V--
BCL2NM_000657-H3L; H58R; A67G; P78L; V92A; H120E; F124CG5A; N11T; R12W; D31G; G47D; Q52L; A60D; P90S; N182D; G197S-
BCL6NM_001706-R526CQ397*-
BRAFNM_004333-G469E-G466E
CARD11NM_032415-R235P; G757V-R235P
CD79BNM_001039933-M191L; Y197C; Y197H; Y197S; Y208*--
CDKN2ANM_000077-V82MR80*-
CREBBPNM_004380-Y1503FQ1073Vfs*13; R1173*; V1371D; S1436R; R1446H; P1494R; R1498Q; D1543V-
EZH2NM_004456-Y646F; Y646NY646F 2-
GNA13NM_006572Q27*; H345RV221L; N263K; L342_F346delins*Q28*; N91D; L184P; R260*; V362M-
HIST1H1ENM_005321-P118S 2; A123T 2; T142S; A167G; P201AG103AG103R; A165V
KMT2DNM_003482-c.15784+1G>A; c.4693+6T>A; L1199Hfs*7; Q1893*;
R2771*; I3421Mfs*12;
P3466Tfs*2; Q3609*;
R5048C
Q2416*; R2801*;
R2847H; Q4732*;
Q5003*
-
MTORNM_004958-W1456R--
MYCNM_002467Q50H; E54D; T73S; F153C; L191F; S217_S218delinsIN; S264RP72S; T73A; P75T; Q194HQ10H; Q51_E54delinsHQID; S53I; P72S; T73I; V92I; K158N; N451KS21N; N26T; E54D 2; T73I; S107R; E137D; G152A; S187C
MYD88NM_002468-S219C; L265P 2-L265P
PIM1NM_001243186-c.513+1G>A; c.880+1G>A;
Q30L; G73D; Y129*; Q130*; V217M; L273F;
[c.880+5G>A; Q128H; P172S; P178S; L184V;
S188R; Q218K; I224Gfs*74; L265F; L323V]Case 46
N251II147_S150del; E161Q;
S188T; [c.514-1_521 delinsACCTAATGA; V90F; G91E; G119_P124delins DKKKEA; P124A; G139D; M179I; S188N; L197F; V217_D219delinsLQH; Q218*; E226K; Q231*; V242I; L275F; R312K; C361Y]Case 48
SOCS1NM_003745-A16S; Y64Afs*48;
S116_V117delinsRL
E24D; Y64N; C111WA3T; A3V; R59H; D138H; Y154_R170del; M161I
TNFAIP3NM_001270508-C103*; F152Lfs*64--
TNFRSF14NM_003820-V239Ic.50_69+1delinsGAACCGACGT; Y61*; N110S-
TP53NM_000546D281EA138V; R181P; R196*; Y234C; R273H; R273GK139N; Y234D-
*—nonsense stop codon mutation; fs*—frameshift stop codon mutation; n—corresponds to the number of times the variant was identified within its diagnostic group.
Disclaimer/Publisher’s Note: The statements, opinions and data contained in all publications are solely those of the individual author(s) and contributor(s) and not of MDPI and/or the editor(s). MDPI and/or the editor(s) disclaim responsibility for any injury to people or property resulting from any ideas, methods, instructions or products referred to in the content.