Article

ROC Analysis Identifies Baseline and Dynamic NLR and dNLR Cut-Offs to Predict ICI Outcome in 402 Advanced NSCLC Patients

by
Simona Carnio
1,
Annapaola Mariniello
1,*,
Pamela Pizzutilo
2,
Gianmauro Numico
3,
Gloria Borra
4,
Alice Lunghi
5,
Hector Soto Parra
6,
Roberta Buosi
7,
Tiziana Vavalà
8,
Ilaria Stura
9,
Silvia Genestroni
4,
Alessandra Alemanni
10,
Francesca Arizio
10,
Annamaria Catino
2,
Michele Montrone
2,
Fabrizio Tabbò
1,
Domenico Galetta
2,
Giuseppe Migliaretti
9 and
Silvia Novello
1
1
Department of Oncology, San Luigi Gonzaga Hospital, University of Turin, 10043 Orbassano, Italy
2
Clinical Cancer Center “Giovanni Paolo II”, 70124 Bari, Italy
3
Oncology Unit, Alessandria Hospital, 15121 Alessandria, Italy
4
Company Hospital-University Major of Charity of Novara, 28100 Novara, Italy
5
Department of Oncology, Division of Oncology, S. Luca Hospital, 55100 Lucca, Italy
6
Medical Oncology Unit, AOU Policlinico-Vittorio Emanuele, 95123 Catania, Italy
7
Department of Medical Oncology, Santo Spirito Hospital, 15033 Casale Monferrato, Italy
8
SC of Oncology Ospedale Civile di Saluzzo, ASL CN1, 12037 Saluzzo, Italy
9
Department of Public Health and Pediatric Sciences, School of Medicine, University of Turin, 10126 Torino, Italy
10
Clinical Trials Unit of Department of Oncology, San Luigi Gonzaga Hospital, University of Turin, 10043 Orbassano, Italy
*
Author to whom correspondence should be addressed.
J. Mol. Pathol. 2020, 1(1), 19-31; https://doi.org/10.3390/jmp1010004
Submission received: 4 August 2020 / Revised: 26 August 2020 / Accepted: 10 September 2020 / Published: 15 September 2020
(This article belongs to the Special Issue Molecular Pathology in Solid Tumors)

Abstract

:
Background: Neutrophil-to-Lymphocyte Ratio (NLR) and derived Neutrophils-to-(Leukocytes minus neutrophils) Ratio (dNLR) have been proposed as possible biomarkers of response to immune checkpoint inhibitors (ICI). However, in non-small cell lung cancer (NSCLC) studies, various NLR and/or dNLR cut-offs have been used, manly based on previous reports on melanoma. Methods: In this Italian multicenter retrospective study, NLR, dNLR, platelet-to-lymphocyte ratio, albumin, and lactate dehydrogenase (LDH) were longitudinally assessed in patients with stage IV non-small cell lung cancer (NSCLC) treated with ICI. The primary objective was to evaluate if baseline parameters predicted response to ICI, using Receiver Operating Characteristic (ROC) curves. Secondary endpoint was to evaluate if dynamic changing of NLR and dNLR also predicted response. Results: Data of 402 patients were collected and analyzed. Among the baseline parameters considered, NLR and dNLR were the most appropriate biomarkers according to the ROC analyses, which also identified meaningful cut-offs (NLR = 2.46; dNLR = 1.61). Patients with low ratios reported a significantly improved outcome, in terms of overall survival (p = 0.0003 for NLR; p = 0.0002 for dNLR) and progression free survival (p = 0.0004 for NLR; p = 0.005 for dNLR). The role of NLR and dNLR as independent biomarkers of response was confirmed in the Cox regression model. When assessing NLR and dNLR dynamics from baseline to cycle 3, a decrease ≥1.04 for NLR and ≥0.41 for dNLR also predicted response. Conclusions in our cohort, we confirmed that NLR and dNLR, easily assessable on peripheral blood, can predict response at baseline and early after ICI initiation. For both baseline and dynamic assessment, we identified clinically meaningful cut-offs, using ROC curves.

1. Introduction

Over the past decade, we have contributed to an exponential increase of therapeutic indications for cancer immunotherapy with immune checkpoint inhibitors (ICI) in several settings and tumor types, including non-small cell lung cancer (NSCLC).
In stage IV NSCLC, monoclonal antibodies directed against programmed death-1 (PD-1), nivolumab and pembrolizumab, or against its ligand (PDL-1), atezolizumab, have received accelerated approval, alone or in combination with chemotherapy, for both first and further lines of therapy [1].
Despite exciting outcomes in a large percentage of patients treated with ICIs, some of them do not experience real clinical benefit, showing response rates ranging from 30–45%, both in second and in first-line with anti-programmed death-ligand1 (PD-L1)/PD-1 monotherapy. [2] Poor patient selection is likely to be mainly responsible for this incomplete success.
Up to now, the expression of PD-L1, assessed with immunohistochemistry on tumor biopsy specimens, is the only approved predictive biomarker of response. Tumor mutational burden (TMB) has been recommended by ESMO as a biomarker for nivolumab and ipilimumab indication; however, the European Medicine Agency has not granted approval [1]. TMB or other alternative biomarkers, like genomic signatures, are not part of daily practice [3,4], due to their cost and technical challenges. Therefore, blood-based biomarkers, easily available and reproducible, could be able to further enrich the probability of ICI success [5,6].
In this context, great attention has been dedicated to host-related biomarkers, including peripheral neutrophil-to-lymphocyte ratio (NLR).
NLR is a well acknowledged marker of immune response to stressful stimuli, including cancer development, and high NLR values have been related to worse prognosis in a variety of tumor types. [7,8] Moreover, tumor shrinkage induced by anticancer treatment is usually paralleled by a reduction of systemic inflammation, reflected in a progressive normalization of the NLR [9,10].
Most of the evidence on NLR prognostic and predictive value in cancer patients receiving ICI is drawn from retrospective studies. [11,12,13,14] Other potential ICI biomarkers, calculated from cell blood count, like Platelet-to-Lymphocyte ratio (PLR) and Derived Neutrophil-to Lymphocyte ratio (dNLR) were also assessed in retrospective studies. [15,16].
It has also been shown that, besides baseline values, lymphocyte variation during treatment could also predict ICI activity and patients’ outcome [17,18,19,20,21,22].
However, different methods have been used to assess NLR and dNLR in NSCLC, with cut-offs based on previous reports in other settings. The resulting lack of standardization in NLR and dNLR assessment represents a limitation for interpretation and prospective validation.
This retrospective study aimed to investigate the role of NLR, dNLR, PRL, albumin and LDH as predictive markers of response to treatment with ICI in advanced NSCLC patients, identifying clinically meaningful cut-off by ROC curves. Moreover, we also aimed to assessed if a decrease in NLR and dNLR could also predict outcome to ICI.

2. Methods and Materials

2.1. Patient Selection

Medical records of patients with stage IV/recurrent NSCLC treated with ICI at eight Italian Institutions from January 2014 to April 2018 were retrospectively retrieved, after approval by the lo cal Ethics Committee (Comitato Etico Interaziendale AOU San Luigi Gonzaga di Orbassano), ethical code number (protocol): 6585; date of approval: 24 April 2018.
Data from patients who received anti-PD-1 or PD-L1 as first or further line of therapy were analyzed.
Due to the time frame of the study, none of the patients included underwent a combination of chemo-immunotherapy approved thereafter [1].
Baseline patient characteristics, including clinical history, clinic-pathological data and PD-L1 status, were recorded. Blood cell count and blood chemistry values, such as albumin and lactate dehydrogenase (LDH) levels, were retrieved.
To monitor tumors, patients underwent a contrast-enhanced total body CT scan every eight–twelve weeks and treatment response was assessed according to RECIST 1.1 criteria in stable disease (SD), partial response (PR), complete response (CR) and disease progression (PD).
Radiological PD did not necessarily imply discontinuation of ICI therapy, which was instead consistent with clinical deterioration.
Toxicity and acute events potentially related to ICI treatment were graded according to CTCAE criteria. Interfering concomitant medication with steroidal drugs was also considered in the present analysis.
The following formulas were used: NLR = neutrophils absolute number/lymphocytes absolute number at baseline; derived NLR = neutrophils absolute number/(leucocytes absolute number − neutrophil absolute number); PRL= platelets − lymphocytes absolute number. The calculations were performed with the following timing: cycle 1, day 1 and subsequently after two courses (fourth–sixth week), 4 courses (eighth–twelfth week) and every six months thereafter or at the time of PD or treatment discontinuation.

2.2. Statistical Analysis

The primary objective was to assess the relationship between baseline ratios NLR, dNLR, PRL, LDH and albumin and response to ICI, identifying appropriate cut-offs. Secondary endpoint was to evaluate changing NLR, dLNR and PRL values were associated to response to ICI.
The data of the study are presented using the classic descriptive statistics indicators.
In order to define cut-off values of NLR, dNLR, PRL, LDH and albumin at baseline predicting survival at one year, Receiver Operating Characteristics (ROC) curves were performed, and the results are showed as Area Under Curve (AUC) and relative 95% confidence interval. Youden Index method was used in order to set the best cut offs [23].
Response categories assessed according to RECIST were dichotomized as Disease Control Rate (DCR) (SD + PR + CR) and disease progression (PD), at the first radiological evaluation.
Progression Free Survival (PFS) and Overall Survival (OS) were analysed performing Kaplan Meier Curves separately, dividing the study population into groups according to the cut off defined by the ROC curves. Differences in PFS and OS between groups were analysed with the Log-Rank test. In order to evaluate the association of NLR and dNLR with response and survival at one-year, considering the effects of confounding factors such as age, sex, smoke, Eastern Cooperative Oncology Group performance status (ECOG) and PD-L1%, Cox model was performed and results were expressed in terms of adjusted Hazard Ratio (HR) and relative 95% Confidence Interval (95% CI).
All the statistics were performed with SAS/STAT® Statistics Software Version 9.4 and IBM SPSS® Statistics for Windows, Version 25.0.

3. Results

3.1. Baseline Patients’ Characteristics

A total of 402 patients were included in the analysis (Table 1). Median age was 65.8 years (range 39–86) and 71% were male.
Performance status at the time of ICI start was 0 or 1 in 384 cases (95%). One hundred and eighteen (29%) patients were smokers, 231 (57%) former smokers and 111 (30%) used low dose prednisone alongside treatment, at a permitted dose below 10 mg/day.
The most represented histology was adenocarcinoma, in 251 patients (62%). PD-L1 status was known in 224 (56%) patients. Disease burden was assessed according to the number and location of metastases. In particular, 256 (64%) had between 0–2 metastases and the most commonly represented metastatic sites were lung (70%) and lymph nodes (63%). Thirty-four patients (8%) had brain metastases. Most patients (97%) had no target disease lesions.
PD-1 blocking agents were administered in 367 patients (92%), and agents blocking PD-L1 in 30 (7%). Five patients (1%) received a combination of anti-PD-1 plus anti-CTLA-4 agents. Immunotherapy was administered as first-line treatment in 84 (21%) patients, while 307 (79%) had received prior chemotherapy. Grade ≥ 3 ICI toxicity was observed in 58 (14%) patients.

3.2. Disease Control and Survival in the Overall Study Population

The evaluable patients for objective response were 389 (97%). PD was observed in 162 (40%) patients, CR in 2 (0.5%), PR in 93 (25.5%) and SD in 132 (34%) patients. DCR was observed in 227 patients (58%), with 95 subjects (24%) reporting an objective response. The median PFS was 5.3 months (4.6–6.1 95% CI) and the median OS 9.6 months (8.7–10.5 95% CI), with an average follow-up of 9.6 months (range 0–57).

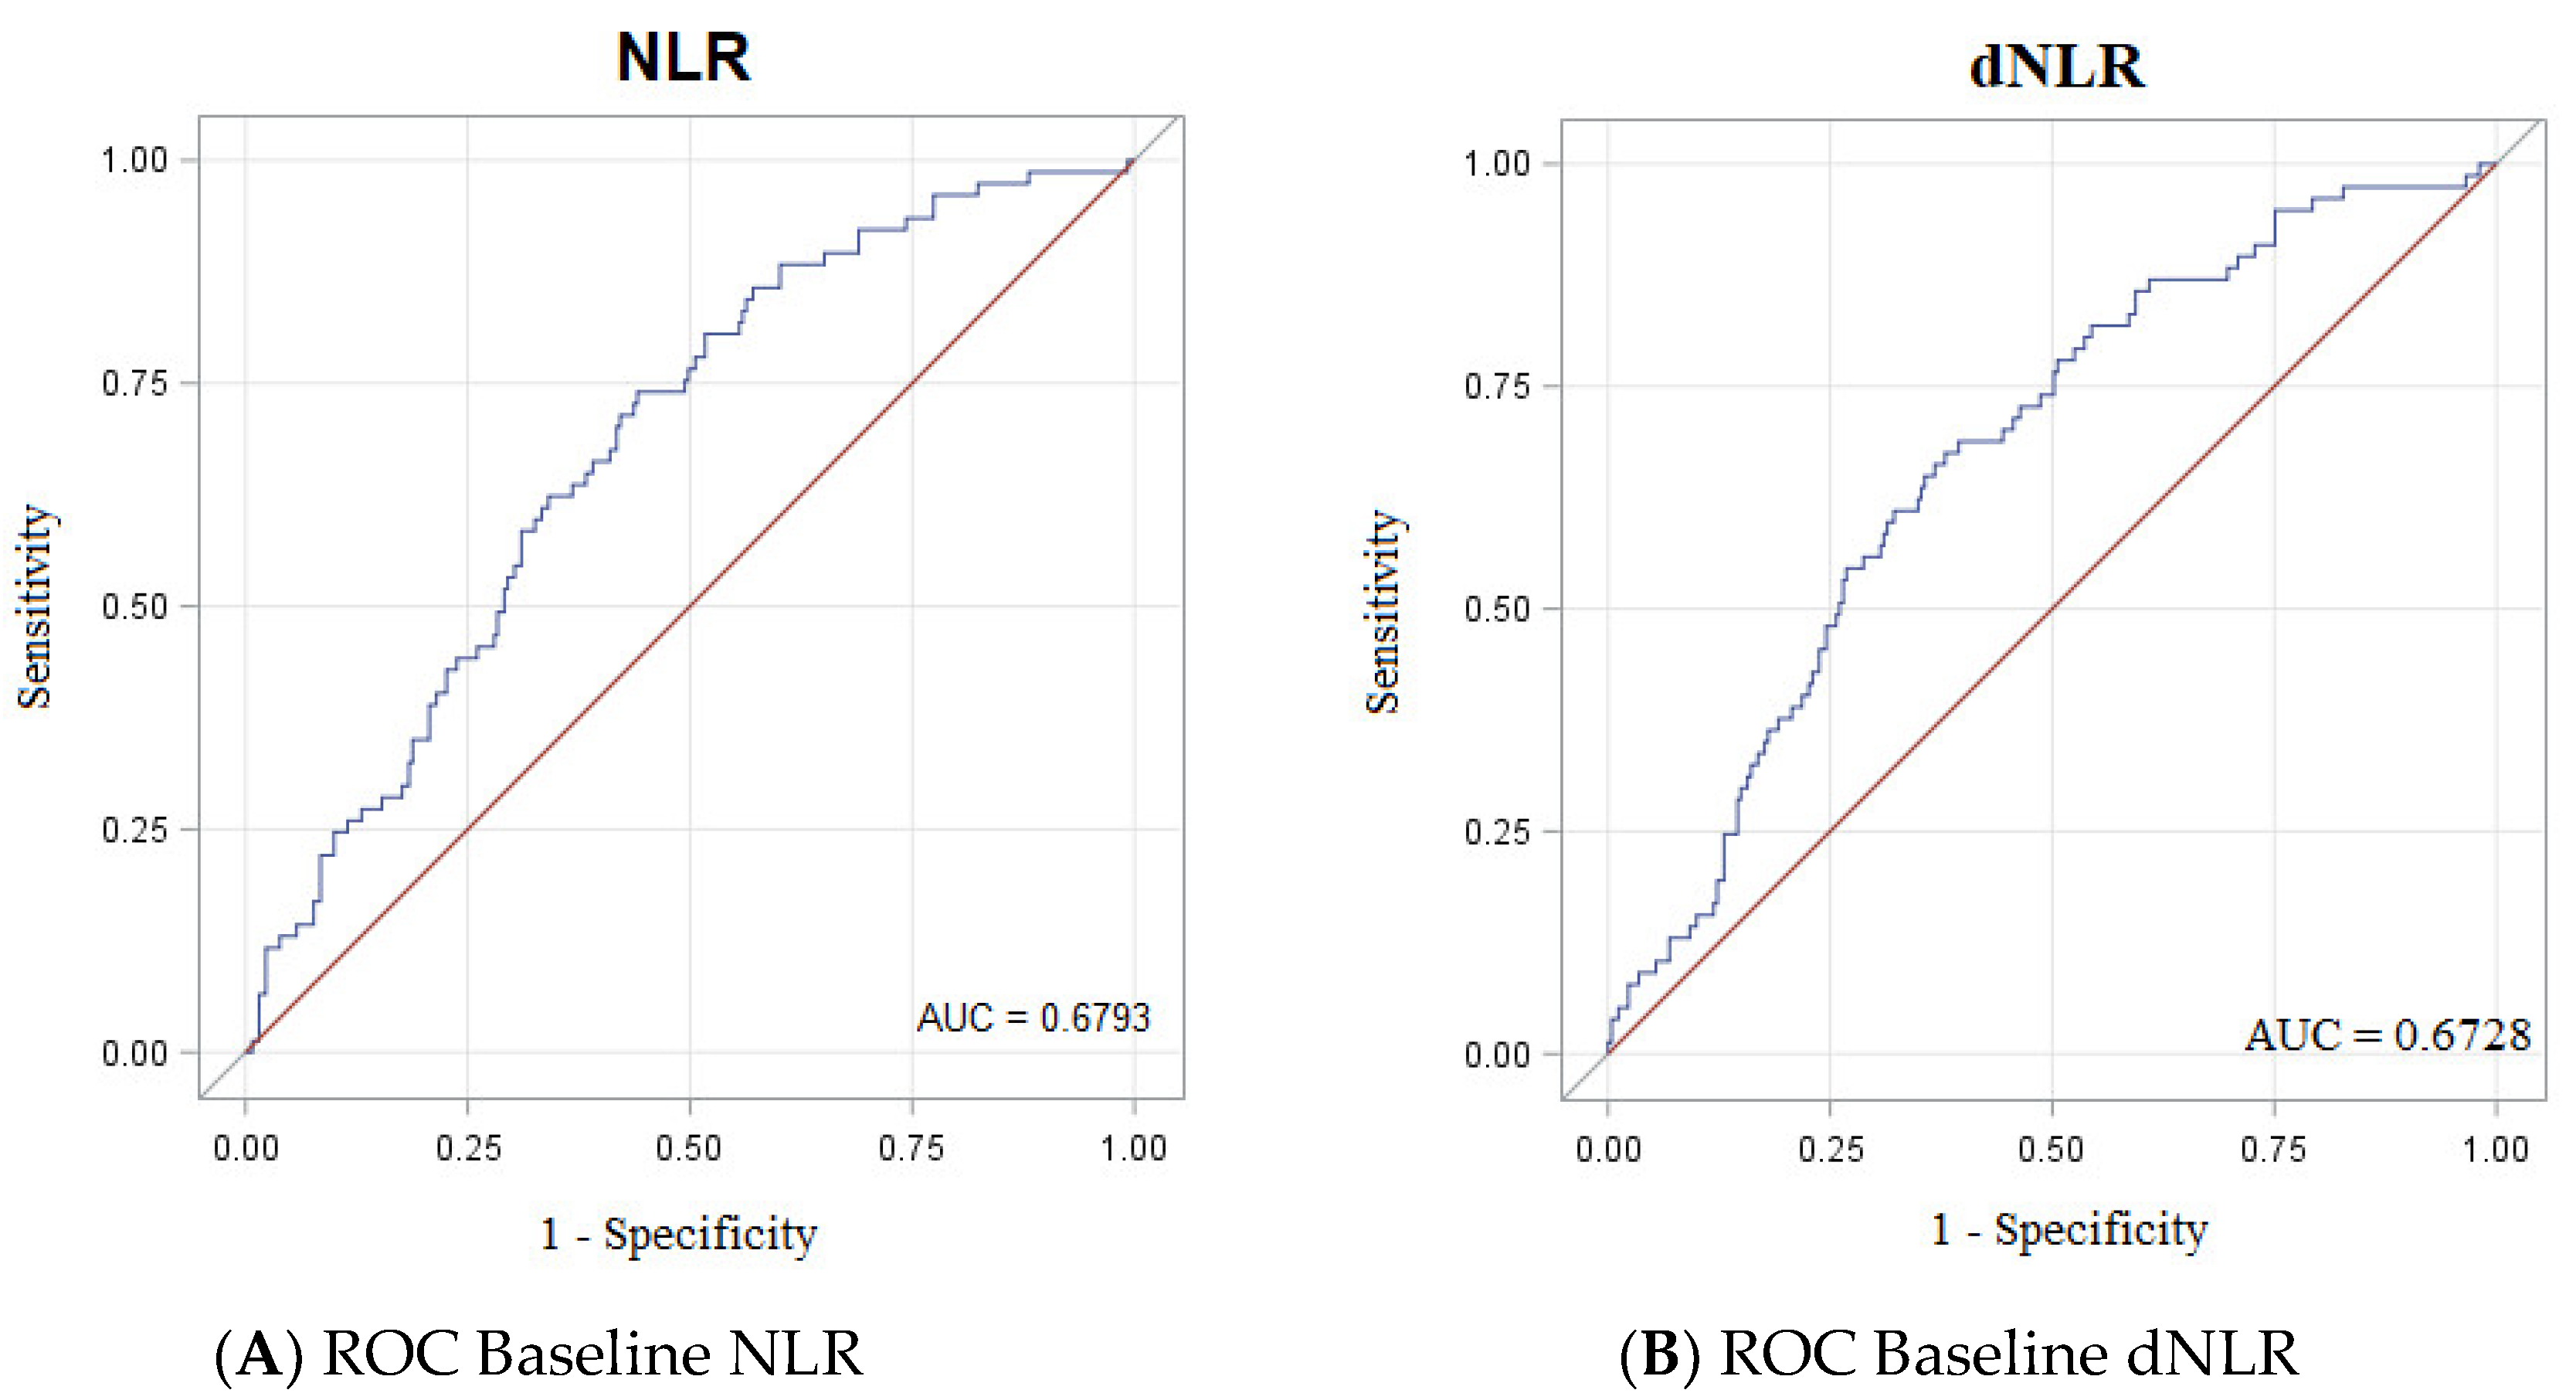
3.3. Accuracy of NLR, dNLR, PRL, Albumin and LDH as Biomarkers

The baseline values of NLR, dNLR, PRL, albumin and LDH were studied individually to assess their predictive power based on the inherent association with longer/shorter survival at one year.
AUC of the ROC curves was 0.60 (0.50–0.70 95% CI, p = 0.095) for LDH, 0.67 (0.61–0.74 95% CI, p < 0.0001) for NLR, 0.67 (0.60–0.73 95% CI, p < 0.0001) for dNLR, 0.63 (0.56–0.70 95% CI, p = 0.045) for PRL and 0.63 (0.53–0.74 95% CI, p = 0.006) for albumin.
The baseline values of NLR, dNLR, PLR and albumin significantly predicted OS at one year (see the Supplementary Material for ROC curves for PRL, LDH and albumin).
However, according to the AUC values and the statistical significance observed, NLR and dNLR were deemed the most meaningful biomarkers to be further explored, relating to response and survival.
The cut-off values for baseline NLR and dNLR identified through the ROC curves were NLR = 2.46 and dNLR = 1.61. In Figure 1, ROC curves for dNLR and NLR are shown. Consistent with the cut-offs identified, 286 patients had baseline NLR ≥ 2.46 and 116 had baseline NLR < 2.46. As for dNLR, 277 patients had baseline dNLR ≥1.61 and 125 had baseline dNLR < 1.61.

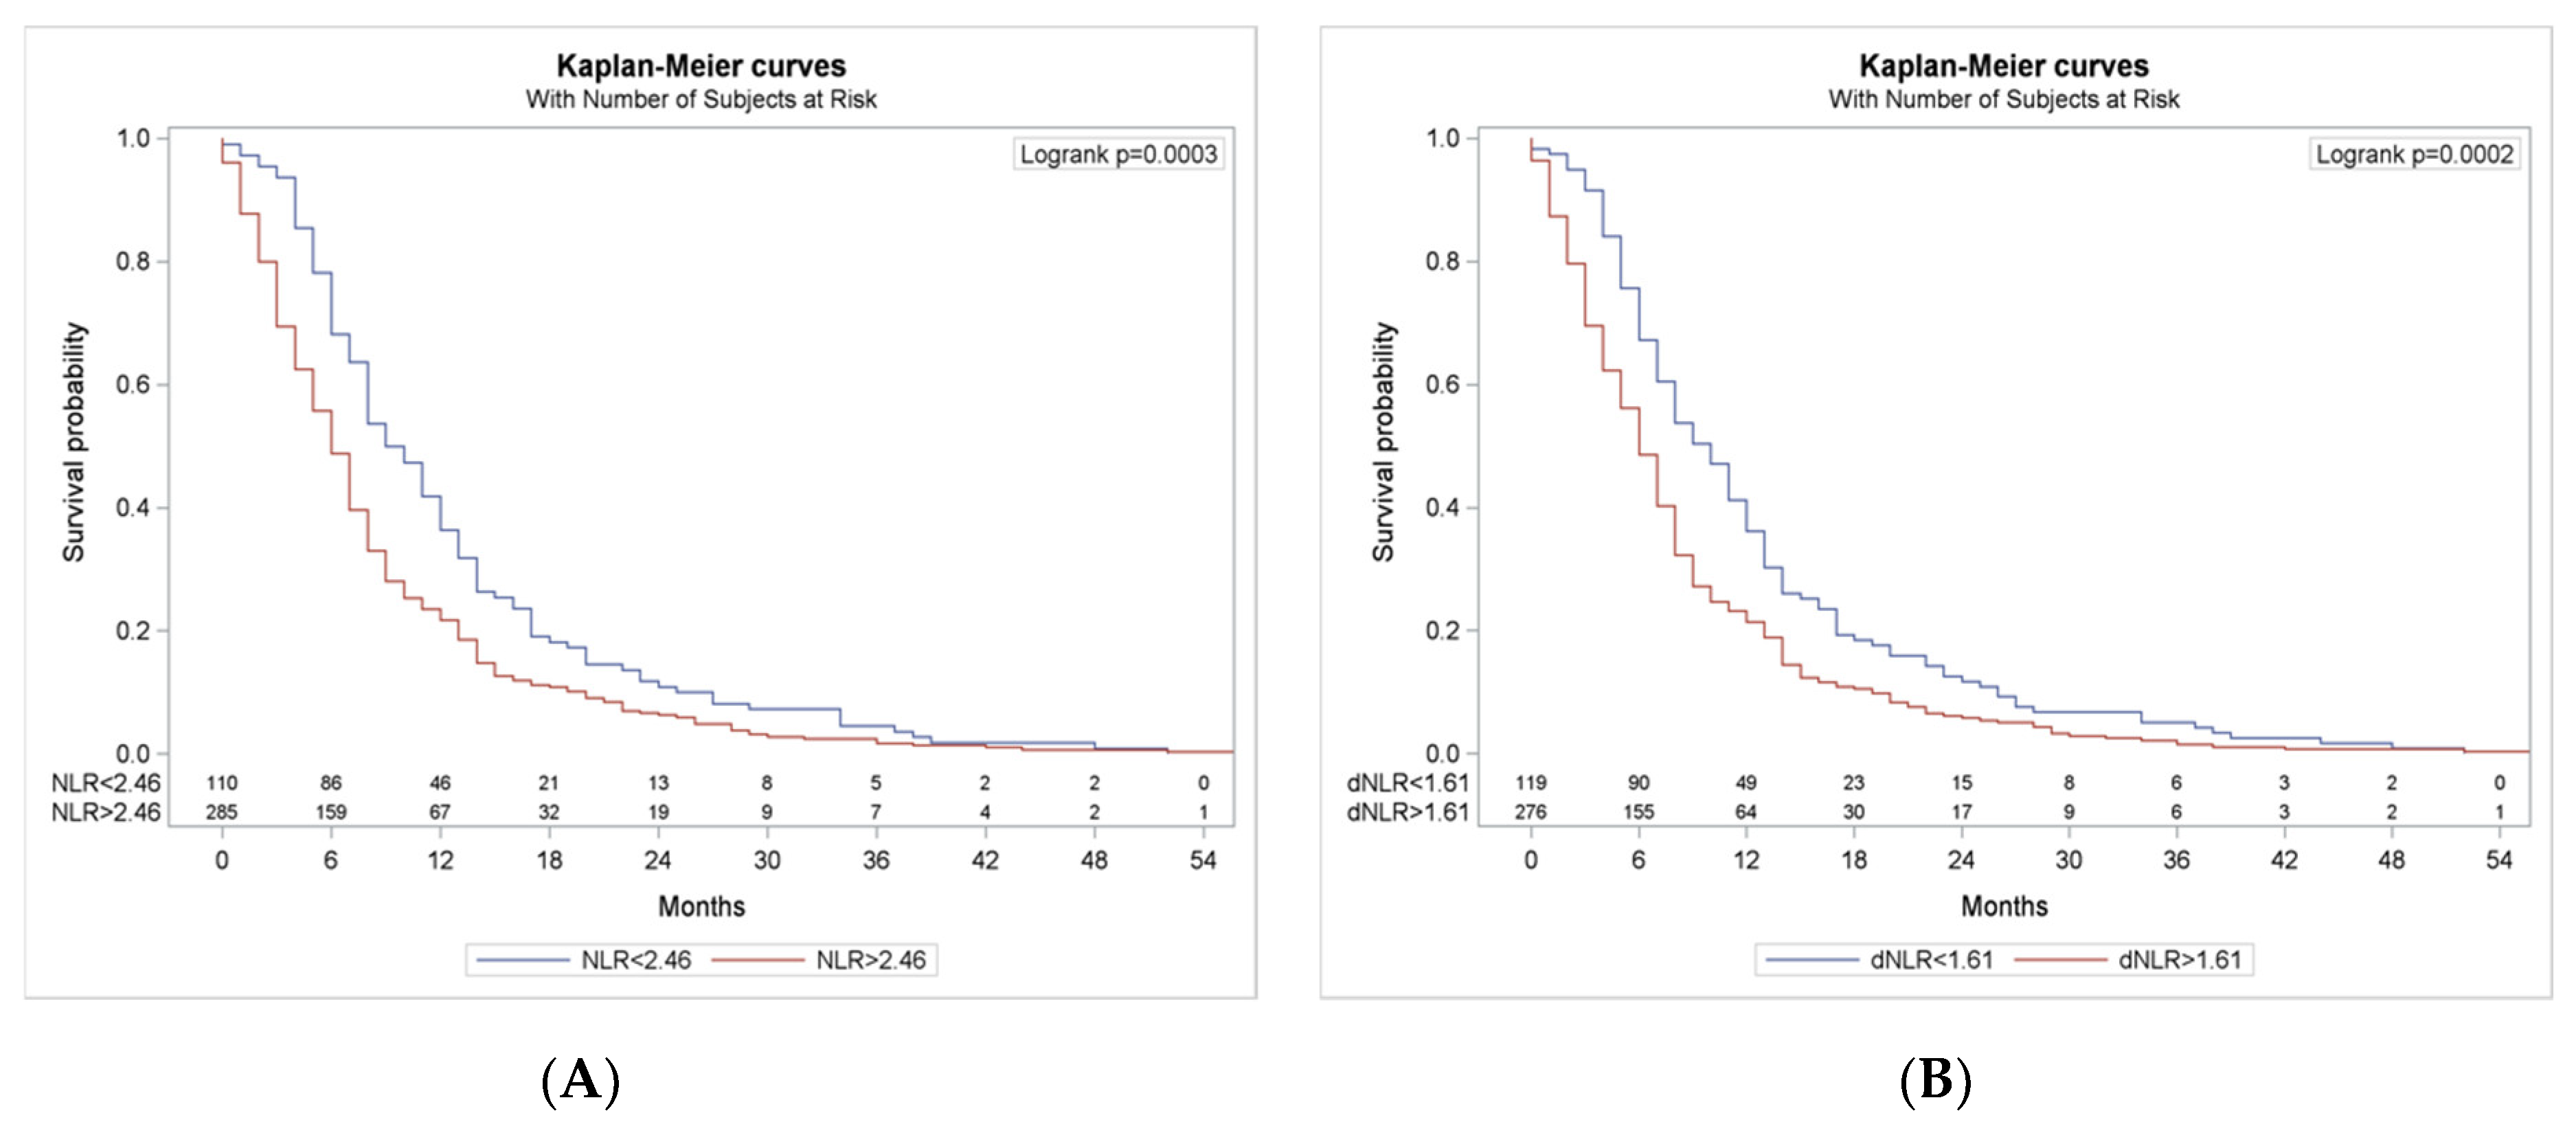
3.4. Survival According to NLR and dNLR Cut-Offs

The Kaplan-Meier curves in Figure 2 describe the OS in the population selected for NLR and dNLR cut-offs. Patients evaluable for survival according to NLR and dNLR were 395.
Patients with NLR < 2.46 reported a significantly longer OS compared to patients with NLR ≥ 2.46, with a median OS of 9.5 versus six months in the NLR high group, respectively (log-rank test p = 0.0003).
Similarly, patients with dNLR < 1.61 showed a significantly longer OS compared to those with dNLR ≥ 1.61 (median OS, ten vs six months in the dNLR low and high groups, respectively, log-rank test p = 0.0002).

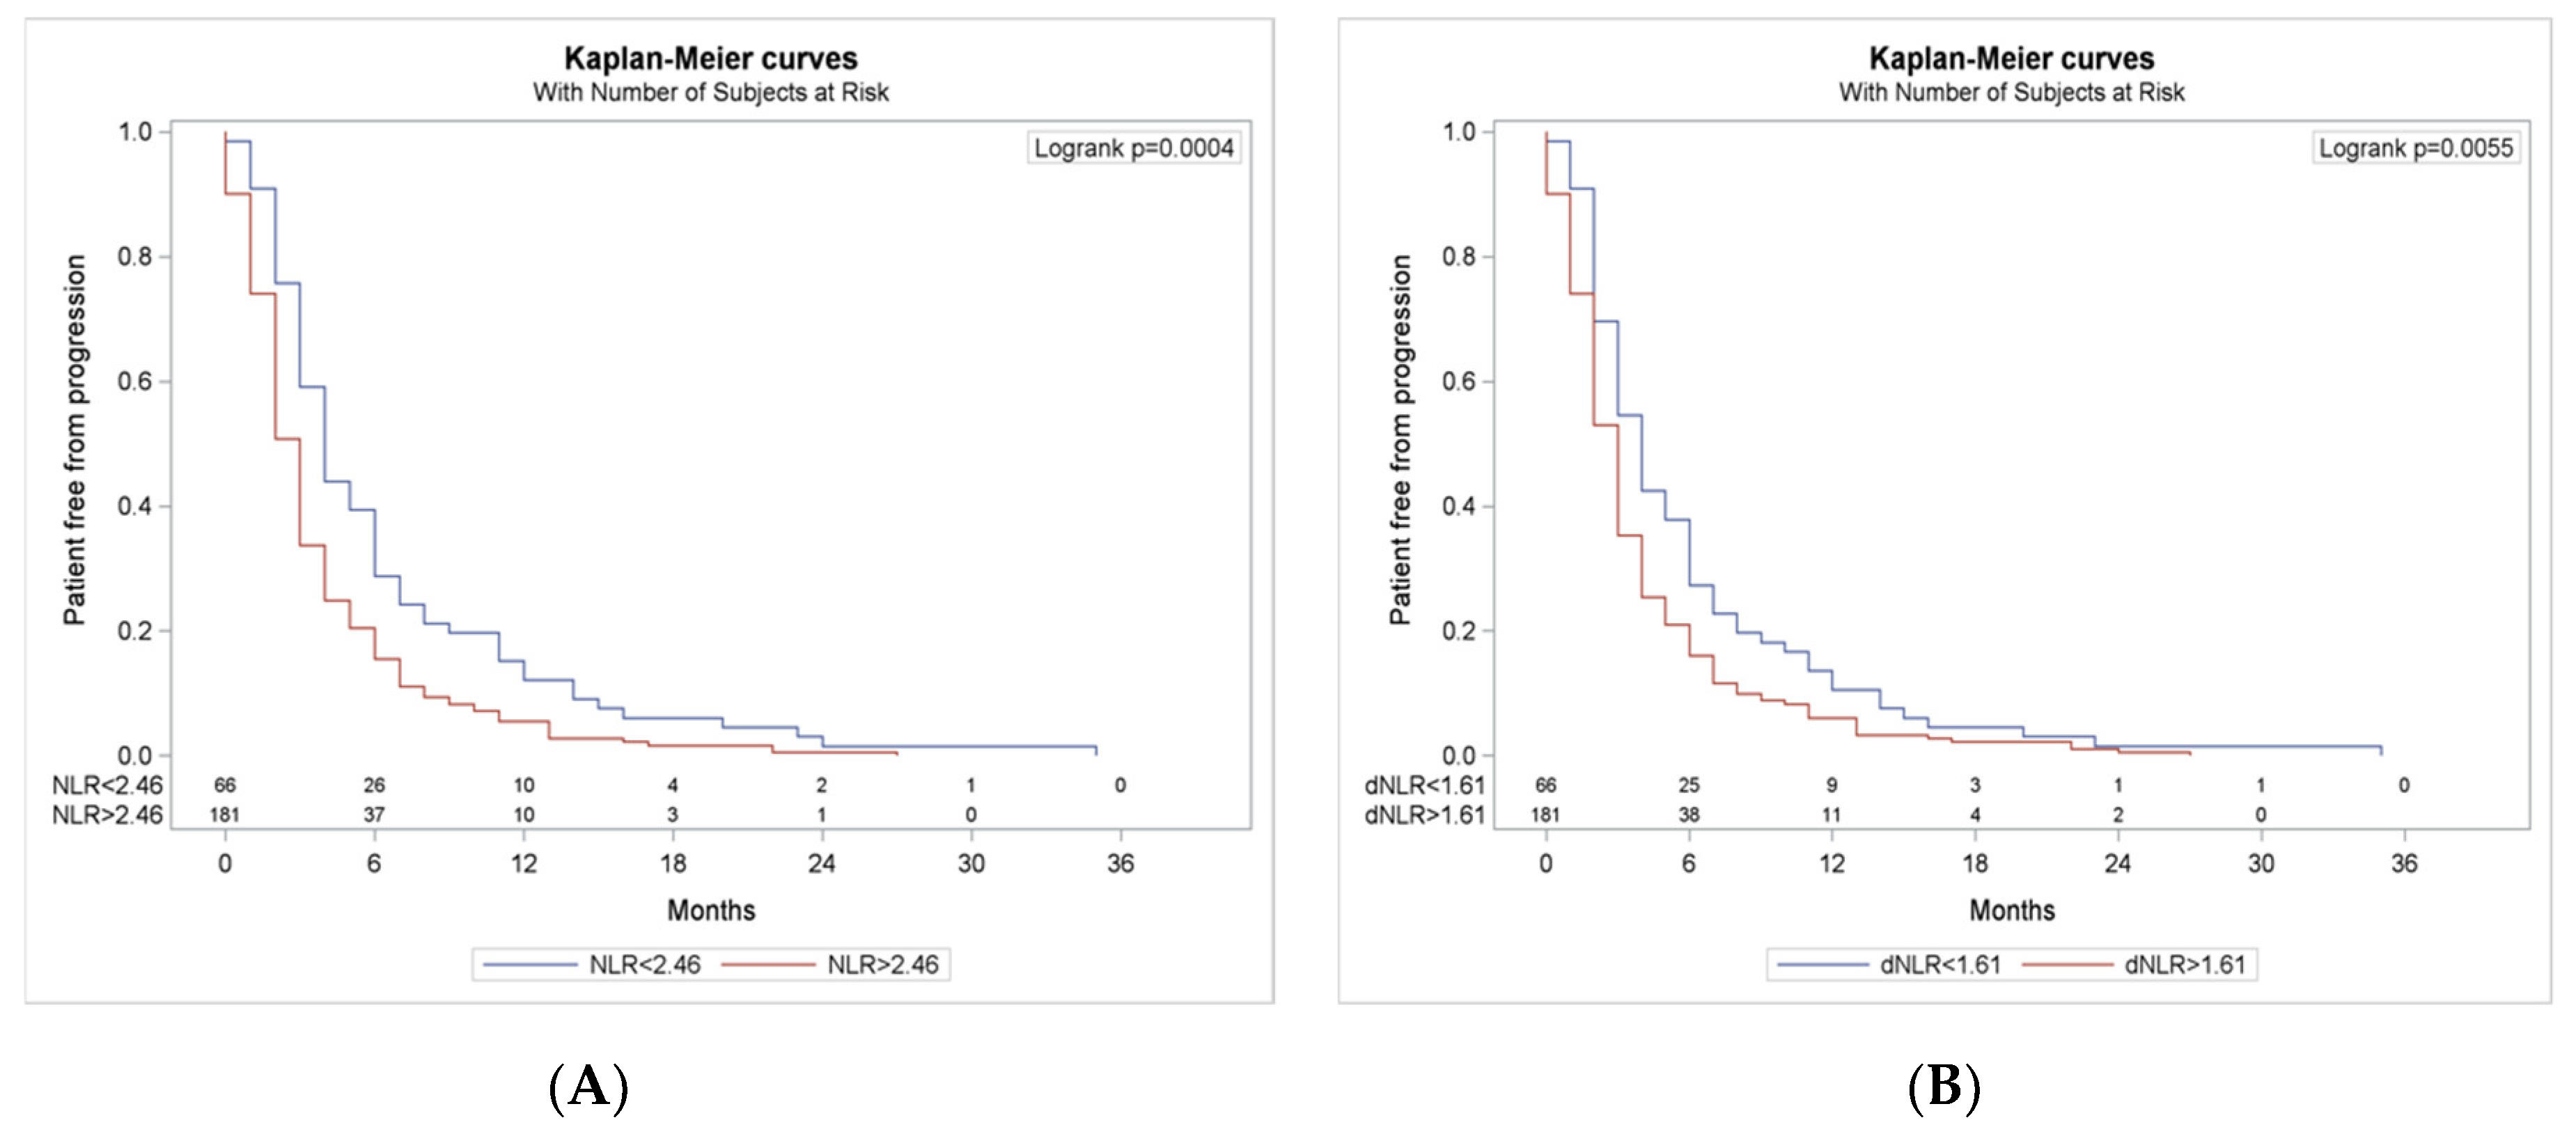
3.5. Progression Free Survival According to NLR and dNLR Cut-Offs

The Kaplan-Meier curves in Figure 3 describe the PFS in the population selected for NLR and dNLR cut-offs. Patients evaluable for PFS according to NLR and dNLR were 247.
PFS was significantly improved in the NLR < 2.46 group, with a median PFS of 4.0 versus 2.0 months in the NLR ≥ 2.46 (log rank test p = 0.0004).
Patients with dNLR < 1.61 also reported a better PFS, with a median PFS of 4.0 versus 3 months (log rank test p = 0.005).

3.6. Cox Model for Survival and Response

To assess the independent role of NLR and dNLR in predicting survival and response to ICI, possible confounding factors were evaluated using Cox models (see Table 2 for survival and Table 3 for response).
In the study population, NLR and dNLR were both associated with longer survival, where patients with a NLR ≥ 2.46 showed a HR = 1.55 for mortality at one year after ICI start (p = 0.002) and, similarly, dNLR showed a HR = 1.52 for mortality at one year after ICI (p = 0.002).
At a lower significance level and extent, better clinical conditions (ECOG PS) and PD-L1 < 50% were also associated with longer survival after ICI.
Smoking status was associated, with borderline significance, to a higher risk of death at one year.
As for independent predictive factors of response to ICI in terms of DCR (only the better performance status), NRL and dNLR were found to be statistically significant. In particular, patients with NLR ≥ 2.46 reported an HR = 1.67 for PD (p = 0.01). The predictive power of dNLR was even more pronounced, where dNLR ≥ 1.61 reported an HR = 1.8 for PD (p = 0.002). Smoking or PD-L1 status were not significantly associated with response to ICI.

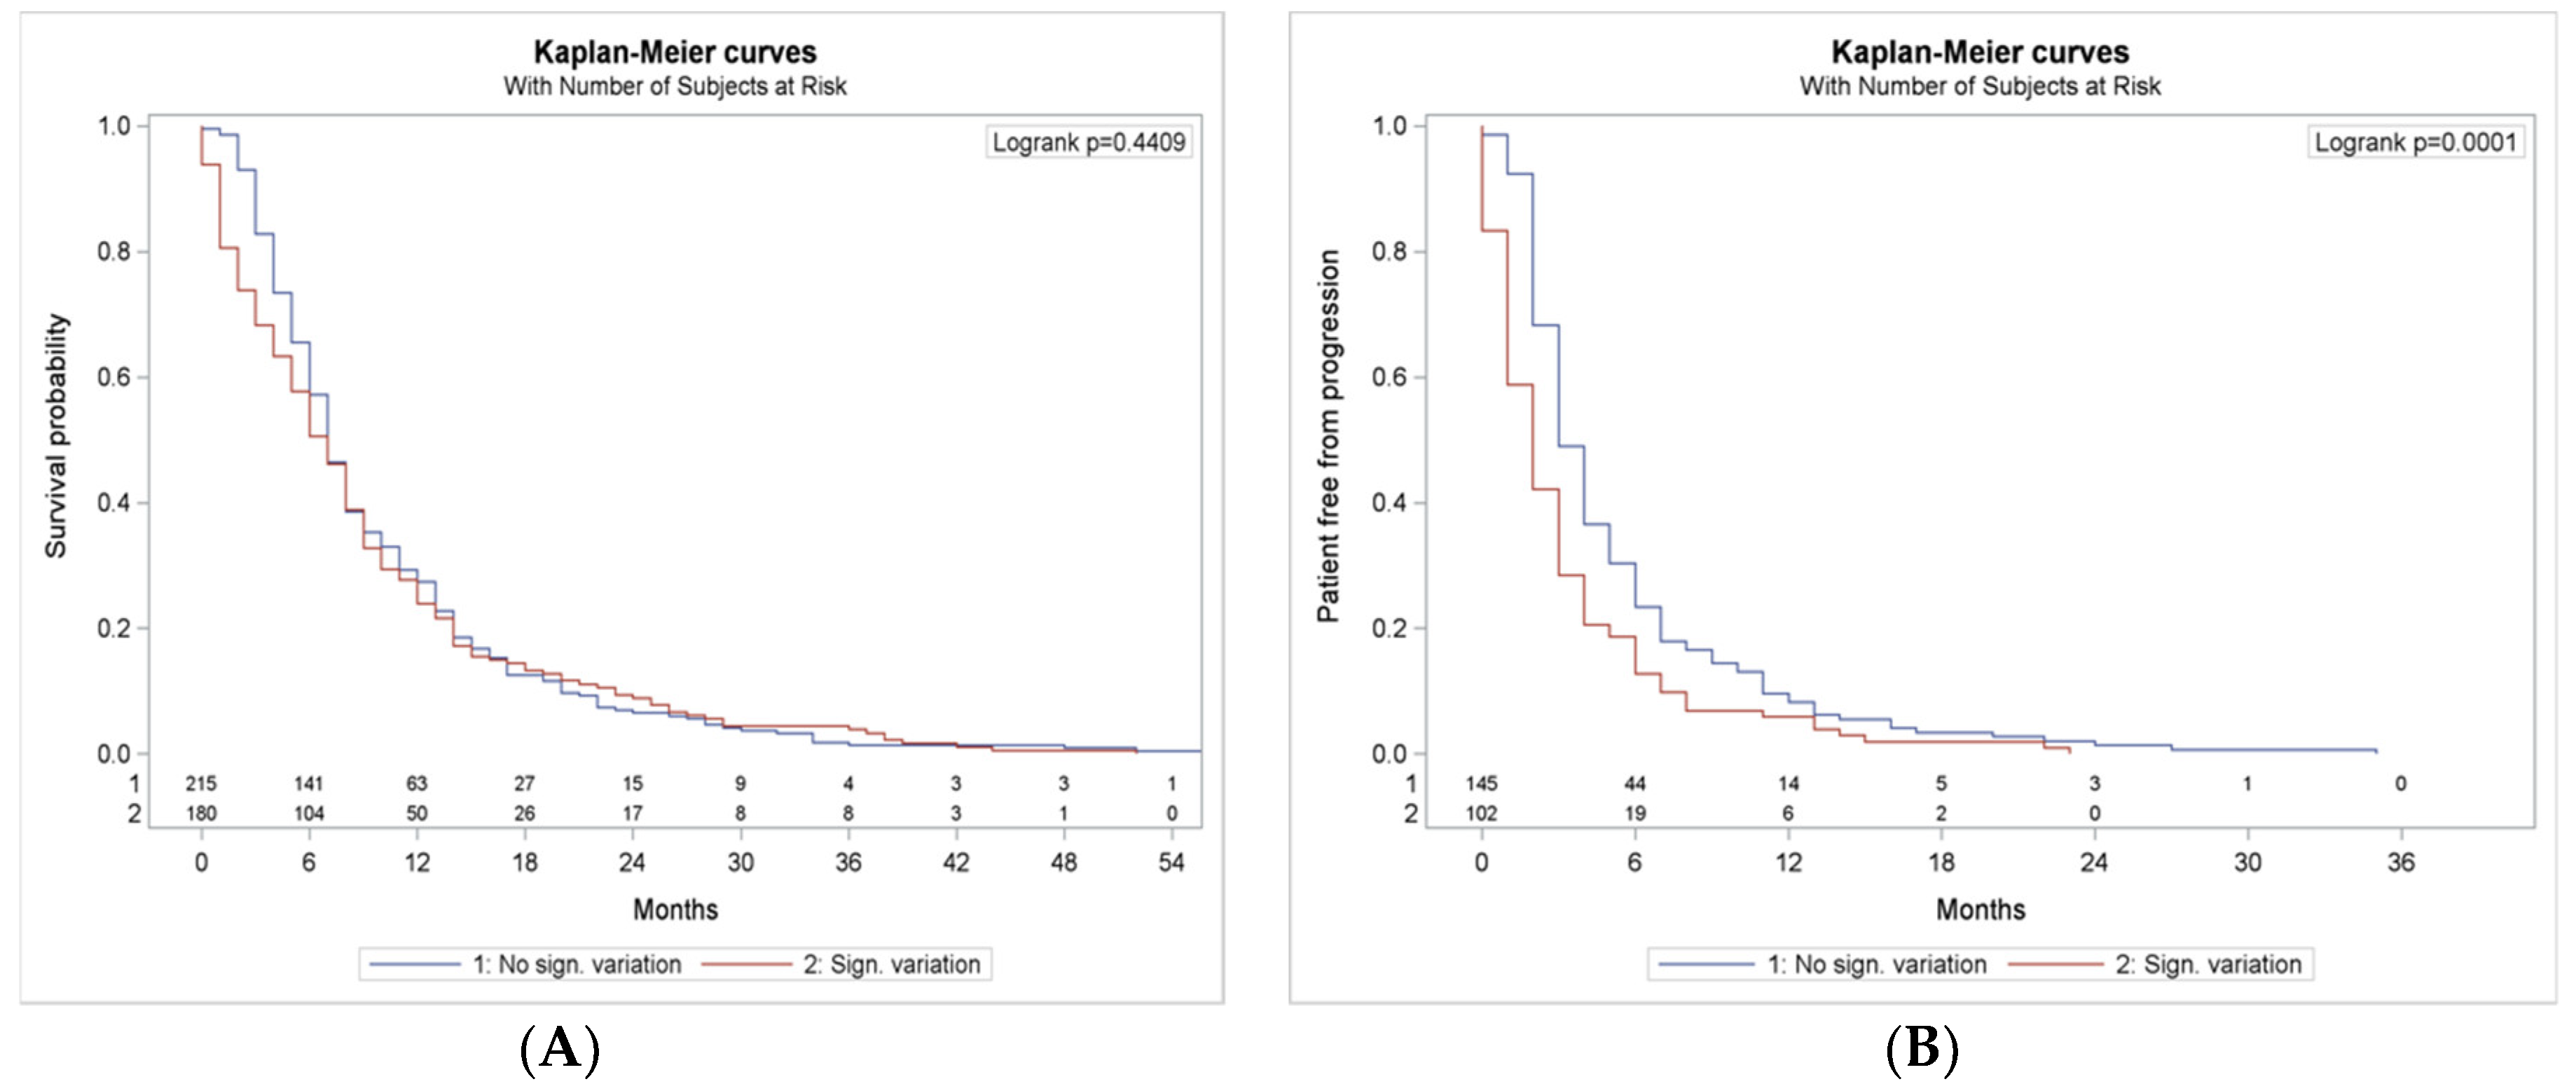
3.7. NLR and dNLR Changing During Treatment

The reduction in NLR and dNLR over time significantly predicted ICI response. Considering that ROC curve was set for OS at one year after treatment start, (long survivor OS >1 year, short survivor O <1 year), we sought to evaluate if a decrease in NLR and dNLR from baseline to third cycle (approximately six–nine weeks after treatment start) also predicted response and survival to ICI treatment, regardless of the absolute value of NLR and dNLR at baseline.
A decrease ≥ 1.04 for NLR (AUC 0.62; 95% CI 0.55–0.68; p = 0.006) from baseline to cycle three discriminated long survivors from short survivors; similarly, a dNLR decrease ≥ 0.41 (AUC 0.62; 95% CI 0.55–0.68; p= 0.001) from baseline to cycle three discriminated long from short survivors, as in Supplementary Figure S1.
Based on the findings from the ROC curve, reduction of dNLR during treatment seemed to be a stronger predictive factor of response to ICI, compared to NLR, despite both NLR and dNLR decrease being statically significant. Thus, we further explored if patients with decreased dNLR at cycle three had a significantly improved outcome. As shown in Figure 4, patients with a decrease in dNLR from baseline to cycle three reported a significantly longer PFS, but not OS (p = 0.001 and p = 0.44 for PFS and OS, respectively).

4. Discussion

4.1. ROC Based Cut-Offs for NRL and dNLR

In this retrospective multicenter Italian study, we retrieved data from a large sample of 402 advanced NSCLC patients treated with ICI, to assess the association between ratios derived from cell blood count and blood chemistry and clinical outcome. Among the variables considered based on the findings from ROC analyses, we deemed NLR and dNLR ratios to be worthy of further exploration as possible biomarkers.
When using the cut-off identified by the ROC curves (NLR = 2.46; dNLR = 1.61), we found that patients with low NLR or dNLR reported a significantly better outcome to ICI, either in terms of OS or PFS.
The literature already showed that data from cell blood count could play a prognostic and predictive role for response to ICI. The first clinical evidence of NLR association with clinical benefits comes from studies on patients receiving ipilimumab for metastatic melanoma. [11,12,13] The relative lymphocyte number was one of the most significant prognostic factors in a series of 616 patients treated with pembrolizumab [14].
With regard to NSCLC, NLR and, more recently, dNLR, have already been reported to be associated with better outcome to ICI, either in terms of response or survival time [15,16,21,23].
However, each study referred to different NLR and/or dNLR cut-offs to discriminate among responders and non-responders.
In patients with metastatic NSCLC treated with nivolumab, a NLR ≥ 5 was independently associated with worse overall and progression-free survival; NLR cut-off was based on previous reports from melanoma. [24] In another retrospective study on 52 patients receiving the same anti-PD-1 regimen, a NLR > 3.6 was associated with worse overall survival and with lower response rates [15]. Here, the study population was divided in tertiles according to the loge-values of NLR and PRL, whose prognostic value was also evaluated by ROC curve.
The most robust data on dNLR association with ICI outcome derive from a retrospective series from French investigators. Baseline dNLR and LDH were demonstrated to be strongly associated with ICI activity, PSF and OS. Moreover, when dNLR and LDH were tested in a chemotherapy control cohort, no significant association with OS or PFS was observed. [16] In this case too, the choice for dNLR cut-off was based on previous reports from melanoma patients.
In our study, NLR and dNLR cut-offs were defined based on ROC curves. More than other methods, ROC analysis is widely used to find cut off values in medicine [25], because it considers both sensitivity and specificity in order to assess the reliability of the model. Moreover, the ROC structure is simple and easy to read for non-mathematicians too. As concerns the specific method, the Youden Index is one of the most robust. [26]. However, a validation with an independent cohort would be necessary in order to assess the true reliability of the cut offs identified. This will be possible in the near future but is not reported in the present article.
The absolute value we found as a cut-off for dNLR (dNLR = 1.61) is also lower compared to other reports. We cannot exclude that the extent of systemic inflammation in NSCLC is lower than previously observed in melanoma. Further studies to prospectively validate the clinical utility of these ratios, which also provide a control group, are warranted.

4.2. Other Circulating Markers

As opposed to NLR and dNLR, data on the predictive role of PRL in response to ICI are scarce [15].
In our report, baseline albumin and PRL also significantly predicted OS at one year. However, based on AUC and p value, only NLR and dNLR were selected for further analyses.

4.3. Independent Predictive and Prognostic Role of NLR and dNLR

The independent predictive role of baseline NLR and dNLR was also confirmed in the Cox regression model, including age, ECOG PS, smoking status and PD-L1 expression on tumor cells, etc.
NLR and dNLR significantly predicted both survival at one year after treatment start and radiological response.
As expected, a significant independent risk factor for death or PD was clinical deterioration (ECOG PS 1–2 vs 0). Interestingly, a PD-L1 expression > 50% also emerged as a negative prognostic factor, although it had no significant impact on radiological response.
This finding may seem unexpected, since, currently, a high PD-L1 expression is the only approved biomarker of response to ICI monotherapy and patients whose tumors presents a PD-L1 expression > 50% are candidates for first-line ICI.
However, the largest part of our cohort received ICI as a second or further line of treatment (79%), when first-line treatment with pembrolizumab was not yet approved. Thus, since over 40% of the patients had a tumor expressing PD-L1 > 50%, it seems likely that about half of PD-L1 > 50% patients were heavily pre-treated at the time of ICI start. As a matter of fact, this line of treatment was heavily unbalanced in our cohort, and therefore was not included in the multivariate analysis.

4.4. NLR and dNLR Dynamics During Treatment

Using ROC curves, we also showed that, in the overall population, a decrease in NLR and dNLR early after ICI initiation (from baseline to cycle three), was associated with better outcome. Due to the stronger statistical significance of dNLR, either when decreased during treatment and at baseline, compared to NLR, we further explored dNLR dynamics in predicting outcome. We found that patients with a meaningful reduction of dNLR at cycle three reported a significantly longer PFS, compared with those in which dNLR difference was below the cut-off identified by the ROC curve.
Consistently with our findings, it has been shown already that lymphocyte variation during treatment may be related to ICI activity and, possibly, to patients’ outcome [17,18,19].
In the setting of metastatic melanoma, an increasing absolute lymphocyte count, between baseline and the end of dosing (Week 12), was found to be related to disease control and survival [19].
As for dynamics in cell blood count ratios, further data have been reported by an English group in a heterogeneous series of 55 patients receiving anti-PD-1/PD-L1 agents alone or in combination with a tyrosine kinase inhibitor. NLR was calculated at baseline and after two cycles (six weeks) of treatment. Patients with a decrease in median NLR after two cycles experienced longer PFS compared to those with NRL increase. However, the study population was divided post-hoc into two groups, based on median NLR increase/decrease post treatment [20]. By contrast, in our study, the decrease of NLR and dNLR from cycle one to cycle three was considered meaningful according to cut-offs identified by ROC curves.
In line with our observation, a Japanese group retrospectively assessed 101 NSCLC patients for variation in NLR at baseline and at two and four weeks after nivolumab administration. Whether baseline NLR did or did not impact on median PFS, NLR < 3 at both two and four weeks after nivolumab initiation was significantly associated with longer PFS. In this study, the population was also divided into two groups, according to NLR below or above 3 [21].
Considering the available evidence, it is still unknown if the reduction of these ratios early after ICI initiation could be even more clinically meaningful than low baseline NLR and NLR values.
To date, the dynamics of NLR and dNLR during ICI treatment is under investigation in a larger retrospective series of NSCLC by a French group. [22] In this series of 1485 NSCLC patients treated with ICI, dNLR was measured at baseline and after one cycle of ICI. Preliminary data showed that in cases where dNLR remained low (<3) or changed after one cycle of ICI, PFS and OS at 12 weeks were longer. This association does not seem to be influenced by PD-L1 expression.

4.5. Limitations and Future Perspectives

It has been inferred that, at least. NLR seems to be specifically prognostic in the context of NSCLC. [27] Our data, beyond supporting the prognostic role of baseline NLR and dNLR, also showed, in multivariate analysis, that these ratios were independently associated with ICI activity.
The absence of a control cohort receiving other types of systemic treatment does not allow us to make definitive conclusions.
Another limitation of our study is the retrospective nature of the analysis, which precludes definitive statements on the clinical utility of the cut-offs. Future prospective studies should validate the cut-off of these markers and investigate associations with other factors.
When compared to other potential biomarkers which are currently under investigation, such as TMB, TRC clonality or gene signatures associated with tumor microenvironment, [3,4,6,28] peripheral blood parameters are easier to perform and more affordable.
Additional unaddressed questions concern the role of NLR and/or dNLR when ICI is given in earlier lines of treatment, and especially within the newly available combinations, in particular with chemotherapy.

5. Conclusions

In the present NSCLC cohort, we showed that NLR and dNLR were independent biomarkers of response to ICI, not only as baseline values but also when decreased early after treatment initiation.
Moreover, we provided meaningful cut-offs to select patients that benefit most from ICI treatment using ROC curves for baseline and dynamic NLR and dNLR. The need to further explore and prospectively validate the clinical utility of these ratios remains crucial.

Supplementary Materials

The following are available online at https://www.mdpi.com/2673-5261/1/1/4/s1, Figure S1: ROC curve for baseline PRL (platelets – lymphocytes), Figure S2: ROC curve for baseline LDH (lactate dehydrogenase), Figure S3: ROC curve for baseline serum albumin, Figure S4: ROC curves for NLR e dNLR changing from baseline to cycle 3.

Author Contributions

Conceptualization, S.C. and S.N.; Data curation, S.C., A.M., A.A. and F.A.; Formal analysis, I.S. and G.M.; Investigation, S.C., P.P., G.N., G.B., A.L., H.S.P., R.B., T.V., S.G., A.C., M.M., D.G. and S.N.; Methodology, A.M., I.S. and G.M.; Project administration, S.C. and S.N.; Supervision, S.N.; Writing—original draft, A.M.; Writing—review & editing, S.C., P.P., G.N., G.B., A.L., H.S.P., R.B., T.V., S.G., F.A., A.C., M.M., F.T., D.G., G.M. and S.N. All authors have read and agreed to the published version of the manuscript.

Funding

This research received no external funding.

Conflicts of Interest

Carnio S., Mariniello A., Pizzutillo P., Numico G., Borra G., Lunghi A., Soto Parra H., Buosi R., Vavalà T., Stura I., Genestroni S., Alemanni A., Arizio F., Catino A., Montrone M., Tabbò F., Migliaretti G. declare no conflicts of interest. Galetta D. declares speaker’s fee per BMS, MSD, Roche, and advisor board for BI and Eli Lilly. Novello S. declares Speaker bureau for Eli Lilly, Roche, MSD, BMS, BI, Astra Zeneca.

References

  1. Planchard, D.; Popat, S.; Kerr, K.; Novello, S.; Smit, E.; Faivre-Finn, C.; Mok, T.; Reck, M.; Van Schil, P.; Hellmann, M.; et al. Correction to: “Metastatic non-small cell lung cancer: ESMO Clinical Practice Guidelines for diagnosis, treatment and follow-up.”. Ann. Oncol. 2019, 30, 863–870. [Google Scholar] [CrossRef] [PubMed]
  2. Attili, I.; Passaro, A.; Pavan, A.; Conte, P.; De Marinis, F.; Indraccolo, S. Combination immunotherapy strategies in advanced non-small cell lung cancer (NSCLC): Does biological rationale meet clinical needs? Crit. Rev. Oncol. 2017, 119, 30–39. [Google Scholar] [CrossRef]
  3. Goodman, A.M.; Kato, S.; Bazhenova, L.; Patel, S.P.; Frampton, G.M.; Miller, V.; Stephens, P.J.; Daniels, G.A.; Kurzrock, R. Tumor Mutational Burden as an Independent Predictor of Response to Immunotherapy in Diverse Cancers. Mol. Cancer Ther. 2017, 16, 2598–2608. [Google Scholar] [CrossRef] [PubMed] [Green Version]
  4. Kowanetz, M.; Zou, W.; McCleland, M.; Gandara, D.; Gadgeel, S.; Rittmeyer, A.; Barlési, F.; Park, K.; Shames, D.; Koeppen, H.; et al. MA 05.09 Pre-Existing Immunity Measured by Teff Gene Expression in Tumor Tissue is Associated with Atezolizumad Efficacy in NSCLC. J. Thorac. Oncol. 2017, 12, S1817–S1818. [Google Scholar] [CrossRef] [Green Version]
  5. Meléndez, B.; Van Campenhout, C.; Rorive, S.; Remmelink, M.; Salmon, I.; D’Haene, N. Methods of measurement for tumor mutational burden in tumor tissue. Transl. Lung Cancer Res. 2018, 7, 661–667. [Google Scholar] [CrossRef]
  6. Bodor, J.N.; Boumber, Y.; Borghaei, H. Biomarkers for immune checkpoint inhibition in non-small cell lung cancer (NSCLC). Cancer 2020, 126, 260–270. [Google Scholar] [CrossRef]
  7. Feliciano, E.M.C.; Kroenke, C.H.; Meyerhardt, J.A.; Prado, C.M.; Bradshaw, P.T.; Kwan, M.L.; Xiao, J.; Alexeeff, S.; Corley, D.; Weltzien, E.; et al. Association of Systemic Inflammation and Sarcopenia With Survival in Nonmetastatic Colorectal Cancer. JAMA Oncol. 2017, 3, e172319. [Google Scholar] [CrossRef]
  8. Buttigliero, C.; Pisano, C.; Tucci, M.; Vignani, F.; Bertaglia, V.; Iaconis, D.; Guglielmini, P.; Numico, G.; Scagliotti, G.V.; Di Maio, M. Prognostic impact of pretreatment neutrophil-to-lymphocyte ratio in castration-resistant prostate cancer patients treated with first-line docetaxel. Acta Oncol. 2017, 56, 555–562. [Google Scholar] [CrossRef] [Green Version]
  9. Pinato, D.J.; Stavraka, C.; Flynn, M.J.; Forster, M.D.; O’Cathail, S.M.; Seckl, M.J.; Kristeleit, R.S.; Olmos, D.; Turnbull, S.J.; Blagden, S.P. An Inflammation Based Score Can Optimize the Selection of Patients with Advanced Cancer Considered for Early Phase Clinical Trials. PLoS ONE 2014, 9, e83279. [Google Scholar] [CrossRef] [Green Version]
  10. Kumar, R.; Geuna, E.; Michalarea, V.; Guardascione, M.; Naumann, U.; Lorente, D.; Kaye, S.B.; De Bono, J.S. The neutrophil-lymphocyte ratio and its utilisation for the management of cancer patients in early clinical trials. Br. J. Cancer 2015, 112, 1157–1165. [Google Scholar] [CrossRef]
  11. Ferrucci, P.F.; Ascierto, P.A.; Pigozzo, J.; Del Vecchio, M.; Maio, M.; Cappellini, G.C.A.; Guidoboni, M.; Queirolo, P.; Savoia, P.; Mandalà, M.; et al. Baseline neutrophils and derived neutrophil-to-lymphocyte ratio: Prognostic relevance in metastatic melanoma patients receiving ipilimumab. Ann. Oncol. 2016, 27, 732–738. [Google Scholar] [CrossRef] [PubMed]
  12. Ferrucci, P.F.; Gandini, S.; Battaglia, A.; Alfieri, S.; Di Giacomo, A.M.; Giannarelli, D.; Cappellini, G.C.A.; De Galitiis, F.; Marchetti, P.; Amato, G.; et al. Baseline neutrophil-to-lymphocyte ratio is associated with outcome of ipilimumab-treated metastatic melanoma patients. Br. J. Cancer 2015, 112, 1904–1910. [Google Scholar] [CrossRef] [PubMed] [Green Version]
  13. Martens, A.; Wistuba-Hamprecht, K.; Foppen, M.G.; Yuan, J.; Postow, M.A.; Wong, P.; Romano, E.; Khammari, A.; Dreno, B.; Capone, M.; et al. Baseline Peripheral Blood Biomarkers Associated with Clinical Outcome of Advanced Melanoma Patients Treated with Ipilimumab. Clin. Cancer Res. 2016, 22, 2908–2918. [Google Scholar] [CrossRef] [PubMed]
  14. Weide, B.; Martens, A.; Hassel, J.C.; Berking, C.; Postow, M.A.; Bisschop, K.; Simeone, E.; Mangana, J.; Schilling, B.; Di Giacomo, A.-M.; et al. Baseline Biomarkers for Outcome of Melanoma Patients Treated with Pembrolizumab. Clin. Cancer Res. 2016, 22, 5487–5496. [Google Scholar] [CrossRef] [Green Version]
  15. Diem, S.; Schmid, S.; Krapf, M.; Flatz, L.; Born, D.; Jochum, W.; Templeton, A.J.; Früh, M. Neutrophil-to-Lymphocyte ratio (NLR) and Platelet-to-Lymphocyte ratio (PLR) as prognostic markers in patients with non-small cell lung cancer (NSCLC) treated with nivolumab. Lung Cancer 2017, 111, 176–181. [Google Scholar] [CrossRef] [PubMed]
  16. Mezquita, L.; Auclin, E.; Ferrara, R.; Charrier, M.; Remon, J.; Planchard, D.; Aix, S.P.; Ares, L.P.; Leroy, L.; Audigier-Valette, C.; et al. Association of the Lung Immune Prognostic Index With Immune Checkpoint Inhibitor Outcomes in Patients With Advanced Non-Small Cell Lung Cancer. JAMA Oncol. 2018, 4, 351–357. [Google Scholar] [CrossRef]
  17. Delyon, J.; Mateus, C.; Lefeuvre, D.; Lanoy, E.; Zitvogel, L.; Chaput, N.; Roy, S.; Eggermont, A.M.M.; Routier, E.; Robert, C. Experience in daily practice with ipilimumab for the treatment of patients with metastatic melanoma: An early increase in lymphocyte and eosinophil counts is associated with improved survival. Ann. Oncol. 2013, 24, 1697–1703. [Google Scholar] [CrossRef] [PubMed]
  18. Ku, G.; Yuan, J.; Page, D.B.; Schroeder, S.E.A.; Panageas, K.S.; Carvajal, R.D.; Chapman, P.B.; Schwartz, G.K.; Allison, J.; Wolchok, J.D. Single-institution experience with ipilimumab in advanced melanoma patients in the compassionate use setting. Cancer 2010, 116, 1767–1775. [Google Scholar] [CrossRef]
  19. Simeone, E.; Gentilcore, G.; Giannarelli, D.; Grimaldi, A.M.; Caracó, C.; Curvietto, M.; Esposito, A.; Paone, M.; Palla, M.; Cavalcanti, E.; et al. Immunological and biological changes during ipilimumab treatment and their potential correlation with clinical response and survival in patients with advanced melanoma. Cancer Immunol. Immunother. 2014, 63, 675–683. [Google Scholar] [CrossRef]
  20. Moschetta, M.; Uccello, M.; Kasenda, B.; Mak, G.; McClelland, A.; Boussios, S.; Forster, M.; Arkenau, H.-T. Dynamics of Neutrophils-to-Lymphocyte Ratio Predict Outcomes of PD-1/PD-L1 Blockade. BioMed Res. Int. 2017, 2017, 1–5. [Google Scholar] [CrossRef]
  21. Nakaya, A.; Kurata, T.; Yoshioka, H.; Takeyasu, Y.; Niki, M.; Kibata, K.; Satsutani, N.; Ogata, M.; Miyara, T.; Nomura, S. Neutrophil-to-lymphocyte ratio as an early marker of outcomes in patients with advanced non-small-cell lung cancer treated with nivolumab. Int. J. Clin. Oncol. 2018, 23, 634–640. [Google Scholar] [CrossRef] [PubMed] [Green Version]
  22. Mezquita, L.; Preeshagul, I.; Auclin, E.; Saravia, D.; Hendriks, L.; Rizvi, H.; Planchard, D.; Park, W.; Nadal, E.; Ruffinelli, J.C.; et al. Early change of dNLR is correlated with outcomes in advanced NSCLC patients treated with immunotherapy. Abstracts book. In Proceedings of the IASLC 2019 World Conference on Lung Cancer, Barcelona, Spain, 7–10 September 2019. [Google Scholar]
  23. Youden, W.J. Index for rating diagnostic tests. Cancer 1950, 3, 32–35. [Google Scholar] [CrossRef]
  24. Bagley, S.J.; Kothari, S.; Aggarwal, C.; Bauml, J.M.; Alley, E.W.; Evans, T.L.; Kosteva, J.A.; Ciunci, C.A.; Gabriel, P.E.; Thompson, J.C.; et al. Pretreatment neutrophil-to-lymphocyte ratio as a marker of outcomes in nivolumab-treated patients with advanced non-small-cell lung cancer. Lung Cancer 2017, 106, 1–7. [Google Scholar] [CrossRef] [PubMed]
  25. Habibzadeh, F.; Habibzadeh, P.; Yadollahie, M. On determining the most appropriate test cut-off value: The case of tests with continuous results. Biochem. Medica 2016, 26, 297–307. [Google Scholar] [CrossRef] [PubMed]
  26. Ruopp, M.D.; Perkins, N.J.; Whitcomb, B.W.; Schisterman, E.F. Youden Index and Optimal Cut-Point Estimated from Observations Affected by a Lower Limit of Detection. Biom. J. 2008, 50, 419–430. [Google Scholar] [CrossRef] [Green Version]
  27. Gu, X.-B.; Tian, T.; Tian, X.-J.; Zhang, X.-J. Prognostic significance of neutrophil-to-lymphocyte ratio in non-small cell lung cancer: A meta-analysis. Sci. Rep. 2015, 5, 12493. [Google Scholar] [CrossRef] [Green Version]
  28. Han, J.; Duan, J.; Bai, H.; Wang, Y.; Wan, R.; Wang, X.; Chen, S.; Tian, Y.; Wang, D.; Fei, K.; et al. TCR Repertoire Diversity of Peripheral PD-1+CD8+ T Cells Predicts Clinical Outcomes after Immunotherapy in Patients with Non-Small Cell Lung Cancer. Cancer Immunol. Res. 2019, 8, 146–154. [Google Scholar] [CrossRef]
Figure 1. Receiver Operating Characteristic (ROC) curves for baseline Neutrophil-to-Lymphocyte Ration NLR (A) and derived Neutrophils-to-(Leukocytes minus neutrophils) Ratio (dNLR) (B).
Jmp 01 00004 g001
Figure 2. (A) Overall survival in the study population according to NLR cut-offs. (B) Overall survival in the study population according to dNLR cut-offs.
Jmp 01 00004 g002
Figure 3. (A) Progression free survival in the study population according to NLR cut-offs. (B) Progression free survival in the study population according to dNLR cut-offs.
Jmp 01 00004 g003
Figure 4. (A) Overall survival in the study population according to changing dNLR from cycle one to cycle three, using the cut-off identified by the Receiver Operating Characteristic (ROC) curves. (B) Progression free survival in the study population according to dNLR changing from cycle one to cycle three, using the cut-off identified by the ROC curves.
Jmp 01 00004 g004
Table 1. Baseline patient characteristics.
Age (Mean 65.8; Range 39–86)N (%)
≤60 y104 (26%)
61–69 y134 (33%)
70–75 y119 (30%)
76–79 y27 (7%)
≥80 y18 (4%)
Sex
Male287 (71%)
Female155 (29%)
Smoking Status
Smoker118 (29%)
Former smoker231 (57%)
Never smoker40 (10%)
Unknow13 (4%)
Histology
Adenocarcinoma251 (62%)
Squamous135 (33%)
Others16 (5%)
ECOG PS
0156 (39%)
1228 (57%)
218 (4%)
Concomitant Steroids
No259 (70%)
Yes (≤10 mg/day)111 (30%)
Number of Metastatic Sites
0–2256 (64%)
3–4117 (29%)
5–615 (4%)
>614 (3%)
Metastatic Sites
Lung280 (70%)
Lymph Nodes252 (63%)
Pleura95 (24%)
Bone88 (22%)
Adrenal47 (12%)
Brain34 (8%)
Liver29 (7%)
Soft tissue9 (2%)
Pericardium6 (1%)
PD-L1 Status (n = 224)
<1%62 (27%)
1–49%39 (17%)
>50%96 (43%)
ICI Treatment Line
1st84 (21%)
≥2nd318 (79%)
Type of Prior Therapies
Chemotherapy307 (96%)
Targeted therapy6 (2%)
Chemo + antiangiogenics4 (1%)
Vaccines1
ICI Agent
Nivolumab239 (60%)
Pembrolizumab128 (32%)
Atezolizumab17 (4%)
Durvalumab13 (3%)
Durvalumab + tremelimumab5 (1%)
Abbreviations: ECOG PS: performance status according to ECOG; ICI: immune checkpoint inhibitor; PD-L1: programmed death-ligand1.
Table 2. (A) Role of NLR in a Cox model for risk of death at one year after treatment. (B) Role of dNLR in a Cox model for risk of death at one year after treatment.
VariableHR95% CIp
A
Age > 75 years1.0320.749–1.4220.85
Male1.0160.778–1.3270.91
Smokers1.4420.988–2.1040.06
ECOG 1–2 *1.3771.073–1.7650.01
PD-L1 > 50%1.3721.061–1.7740.02
NLR ≥ 2.561.5521.178–2.0460.002
B
Age > 75 years1.0160.738–1.3990.92
Male1.0080.772–0.3170.95
Smokers1.4070.964–2.0530.08
ECOG 1–2*1.3631.061–1.7520.01
PD-L1 > 50%1.3921.078–1.7980.01
dNLR ≥ 1.611.5221.162–1.9940.002
Abbreviations: ECOG PS: performance status according to ECOG. HR: hazard ratio. PD-L1: programmed death-ligand1. *: versus ECOG PS 0. Bold: statistically significant result.
Table 3. (A) Role of NLR in a Cox model for risk of progressive disease. (B) Role of dNLR in a Cox model for risk of progressive disease.
VariableHR95% CIp
A
Age > 75 years0.8270.520–1.3170.42
Male0.8660.608–1.2330.42
Smokers1.1570.676–1.9800.59
ECOG 1–2 *2.0331.414–2.922<0.000
PD-L1 > 50%1.0100.695–1.4680.96
NLR ≥ 2.561.6751.131–2.4800.01
B
Age >75 years0.08140.512–1.2950.38
Male0.8580.602–1.2220.4
Smokers1.1240.656–1.9240.67
ECOG 1–2 *1.9691.368–2.835<0.000
PDL1 > 50%1.0210.704–1.4830.9
dNLR ≥ 1.611.8431.244–2.7300.002
*: versus ECOG PS 0. Bold: statistically significant result.

