Proceeding Paper

Air Quality Index: Case of One-Day Monitoring of 253 Urban and Suburban Towns in Nigeria †

1
Science and Education Development Institute, Akure P.O. Box 219, Ondo State, Nigeria
2
Department of Agricultural Extension and Rural Development, Landmark University, Omu Aran 251103, Kwara State, Nigeria
3
Department of Agricultural and Bio-Environmental Engineering, Federal Polytechnic, P.M.B. 50, Ilaro 112106, Ogun State, Nigeria
4
Department of Geography, Federal University of Technology, Minna 920101, Niger State, Nigeria
5
Department of General Studies, Gombe State Polytechnic Bajoga, Bajoga 762102, Gombe State, Nigeria
*
Author to whom correspondence should be addressed.
Presented at the 4th International Electronic Conference on Atmospheric Sciences, 16–31 July 2021; Available online: https://ecas2021.sciforum.net.
Environ. Sci. Proc. 2021, 8(1), 4; https://doi.org/10.3390/ecas2021-10342
Published: 22 June 2021
(This article belongs to the Proceedings of The 4th International Electronic Conference on Atmospheric Sciences)

Abstract

:
Government departments use the air quality index (AQI) to inform the public about how unhealthy the air is now or may become in the future. As the AQI increases, so do health threats. In addition to reporting daily air quality, it is also a measure of how air pollution impacts one’s health over a limited period of time. The AQI was created to assist people in understanding how local air quality affects their health. Therefore, the aim of this study was to assess the air quality of one day of 253 towns in Nigeria, thereby determining the health threat in these towns. The data were collected from the Tutiempo Network’s regular dataset by the Environmental Protection Agency (EPA). Data on all of the major pollutants (O3, PM2.5, PM10, CO, NO, SO2) were collected and statistical analysis was performed. Kura (Kano State), a town in northern Nigeria, recorded the highest level of 184, while Idiroko, a border town (Nigeria–Benin Republic) in Ogun State, had the lowest value of 41. Kura was portrayed as unhealthy, while Idiroko was portrayed as healthy, implying that Idiroko air poses little to no danger, while Kura air showed that certain people of the general public, as well as members of sensitive groups, could encounter more severe health effects.

1. Introduction

Air pollution is a major environmental health risk. By reducing environmental impacts, nations around the world can reduce the burden of illness caused by stroke, heart disease, lung cancer, and both chronic and acute respiratory diseases, including asthma [1]. Nigeria, among the developing countries in Africa, has urban and suburban towns that are rapidly growing economically, population wise, and industrially, among others. As these towns are fast growing, there are records of high rates of illness and premature death caused by unhealthy air. An example is a recent World Bank study in Lagos, a former capital city of Nigeria, estimating that illness and premature deaths due to ambient air pollution caused losses of USD 2.1 billion in 2018, representing about 2.1% of Lagos State’s GDP. In the same year, it caused an estimated 11,200 premature deaths, the highest in West Africa. Children under five were the most affected, accounting for 60 percent of total deaths, while adults suffered from heart disease, lung cancer, and chronic obstructive pulmonary disease [2].
Nigeria ranks 152nd (out of 180 countries) on the Environmental Performance Index for Air Quality, so there is reason to be concerned about its air quality. Furthermore, according to the most recent World Health Organization air pollution database [3], air quality in many Nigerian cities hits dangerous to hazardous levels of PM2.5.
The AQI concerns the health effects that occur within a few hours or days of breathing polluted air. The AQI is being used by the EPA to regulate five key air pollutants under the Clean Air Act: ground-level ozone, particulate matter, carbon monoxide, sulfur dioxide, and nitrogen dioxide. To protect against negative effects, the EPA has established national air quality standards for each of these pollutants [4]. Data on AQI are scarce in Nigeria, particularly in remote areas. Because of the Internet of Things (IoT) and Citizen Science, low-cost sensors and satellite tracking have been used to assess the AQI in the environment of cities all over the world [5]. Tutiempo satellite data were used for a one-day assessment of AQI in this study to reduce data scarcity in Nigeria, particularly in rural areas. This is the first time this technique has been used in this part of the world. The purpose of this initial report was to assess the air quality index, PM2.5, PM10, O3, CO, NO, and SO2 levels in 253 towns and villages across the country. Two-year AQI monitoring will follow.

2. Materials and Methods

Tutiempo.net (powered by Tutiempo Network, S.L., Madrid, Spain) is a low-cost, citizen-based PM sensors network system that has been deployed globally [6] (https://en.tutiempo.net/air-quality/ilaro.html, accessed on 23 June 2021). Tutiempo.net offers measurements of pollutants (PM2.5, PM10, CO, NO2, SO2, O3), air quality index (AQI), world weather, global climate data, astronomy, and meteorological parameters (humidity, wind speed, and temperature), among others, using satellite images. One day’s worth of data from their website was used in this analysis. They have current air quality data as well as a forecast on their website. The data were presented in accordance with the Environmental Protection Agency’s (EPA) standard. The available data on AQI from 253 towns were computed and statistically analyzed in this study using Minitab software version 16 (descriptive, Pearson correlation, and box plot).

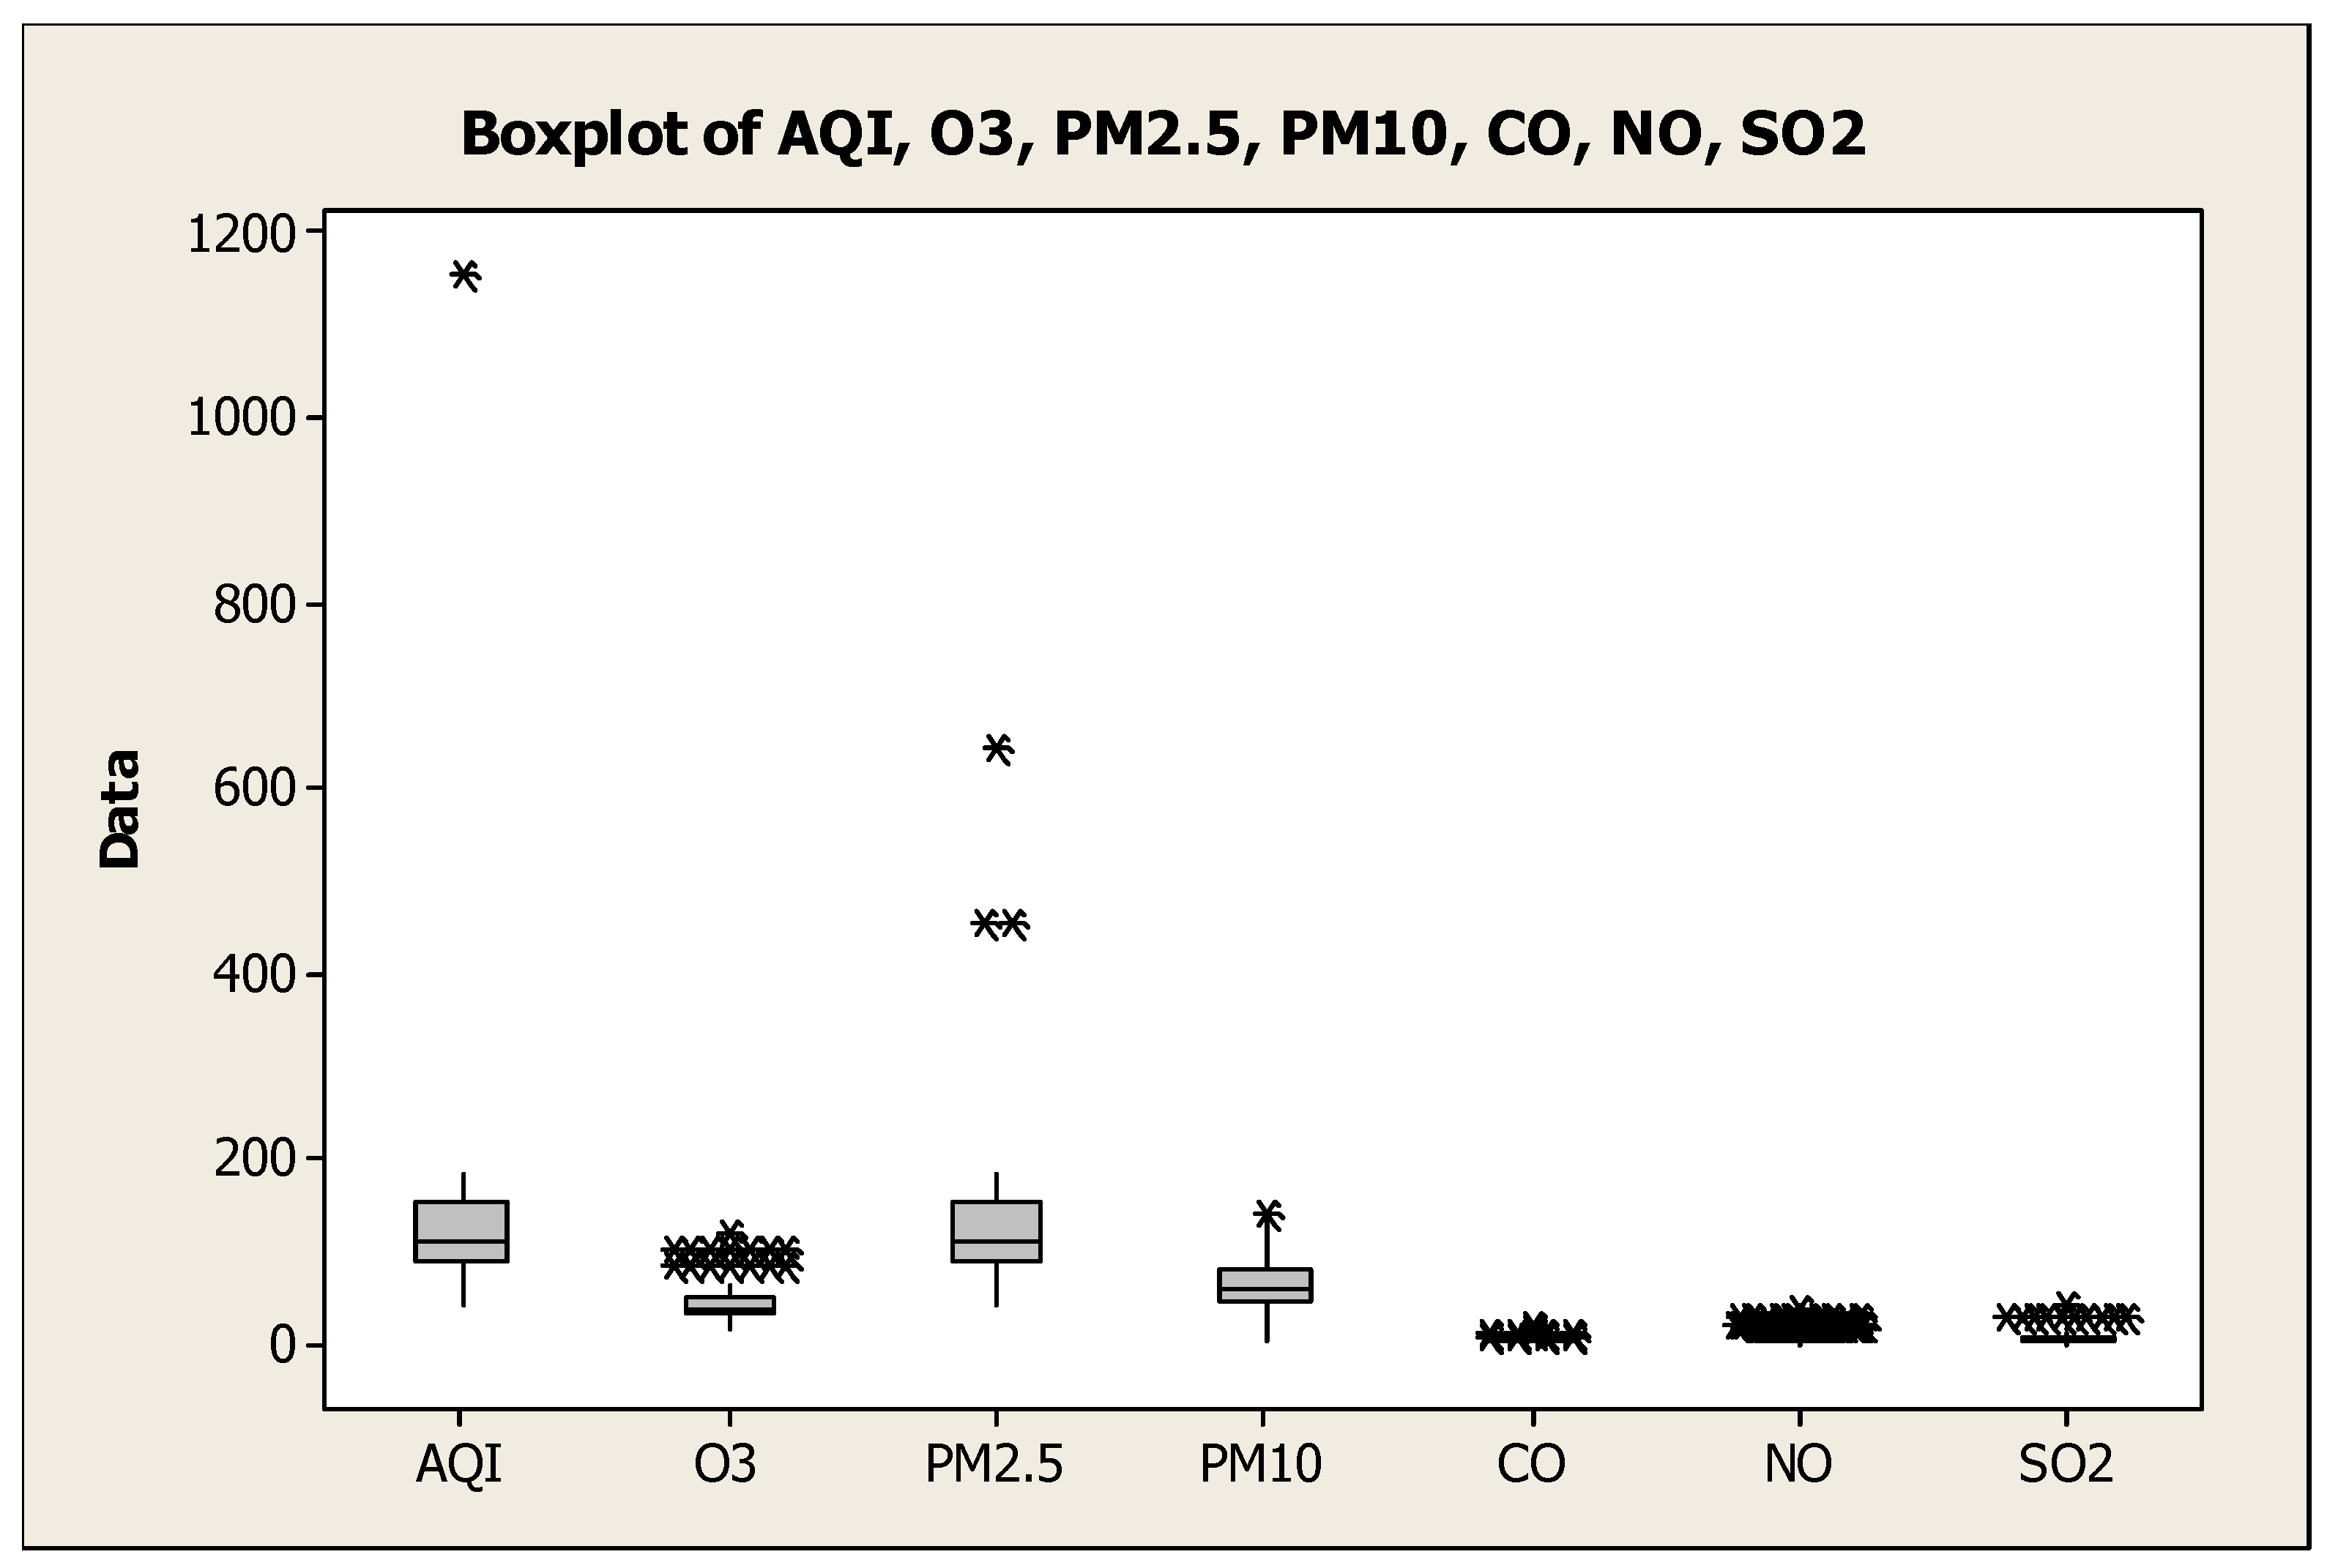
3. Results and Discussion

The cumulative AQI of all locations is 117.31, with minimum and maximum values ranging from 41 to 184, respectively (Table 1). Kura (Kano State) and Idi Iroko (Ogun State) have maximum (184) and minimum (41) levels, respectively. According to the study, the ranges between 169 and 184 are obtained from the northern part of the country. According to the findings of the study, the highest AQI levels are mostly found in the country’s northern regions. The high levels could be attributed to the area’s intense fighting and insecurity, as well as the burning of farm waste, wood for cooking, and fossil fuels. Meteorological factors may also play a role here. There is little or no rainfall, for example, which could have washed or dissolved the pollutants. However, since there is little or no rain, the temperature will be high, the humidity will be low, and the wind speed will be slow, resulting in high concentrations of pollutants. Environmental (caused by human activity) characteristics may have a larger impact on air quality than meteorological conditions [7].
Based on the AQI values, there is a level of concern with regard to human health. Table 2 is provided to categorize the levels based on the color, concern, and values of the index. Explanations and health effects are provided. Idiroko has the lowest value of 41 (Southwest), while Kura (Northwest) has the highest (184). The implication is that the AQIs of the selected towns are between “Good” and “Unhealthy” because the values fall under 0 to 50 and 151 to 200, respectively. The implications are (i) All towns and villages whose values fall under “good” have satisfactory air quality, and there is little or no risk of air pollution. (ii) On the other hand, some people or the general public in towns and villages that fall under unhealthy may experience health issues, and members of sensitive groups may experience more serious health issues. Members of the community must be environmentally conscious because any further introduction of pollutants into the environment may result in further health implications.
The amounts of pollutants are significantly (p > 0.01) related (Table 3). They are either weak or strong. Weakness is defined as a value less than 0.5. There are significant relationships between PM10 and O3 (r = 0.52), PM10 and PM2.5 (r = 0.52), CO and PM10 (r = 0.55), NO and O3, CO (r = 0.66), SO2 and O3 (r = 0.6), SO2 and PM10 (r = 0.59), and SO2 and NO2 (r = 0.61), indicating that the pollutants originated from the same sources (e.g., vehicle and wood/coal emissions).
Figure 1 depicts the data distribution in terms of lower quartile, upper quartile, median, minimum, and maximum in each of the five locations using box and whisker plots. This was carried out to demonstrate the difference in regular concentrations of air pollutants. The box plot essentially depicts a brief sketch of the distribution of the underlying data.

4. Conclusions

Based on one-day air pollutant concentrations from 253 urban and urban communities in Nigeria, the air quality index of pollutants (PM, O3, NO2, CO, and SO2) was monitored in this study. The following are the key findings: (i) High PM2.5 levels were the primary cause of heavy air pollution; (ii) Air pollution was regional, with daily mean CO, NO2, PM2.5, and PM10 levels significantly higher in the north than in other regions, particularly the south, indicating the combined impact of wood and biomass burning, cigarette smoke, vehicular emissions, soil dust sources, and undesirable weather patterns on air pollution.

Funding

No funds were received for this work.

Institutional Review Board Statement

Not applicable.

Informed Consent Statement

Not applicable.

Data Availability Statement

The data presented in this study are available on request from the corresponding author.

Acknowledgments

The authors wish to acknowledge Tutiempo Network, S.L. for making the data available for use. The authors greatly acknowledge the constructive contribution of the anonymous reviewers.

Conflicts of Interest

The authors declare no conflict of interest.

Abbreviations

The following abbreviations are used in this manuscript:
AQIAir Quality Index
IoTInternet of Things
WHOWorld Health Organization
NGONongovernmental organization

References

  1. Manisalidis, I.; Stavropoulou, E.; Stavropoulos, A.; Bezirtzoglou, E. Environmental and Health Impacts of Air Pollution: A Review. Front. Public Health 2020, 8, 14. [Google Scholar] [CrossRef] [PubMed] [Green Version]
  2. Kemper, C.; Chaudhuri, S. Air pollution: A silent killer in Lagos. World Bank Blogs. Published on Africa Can End Poverty. 2020. Available online: https://blogs.worldbank.org/africacan/air-pollution-silent-killer-lagos (accessed on 23 March 2021).
  3. WHO. WHO Global Urban Ambient Air Pollution Database (Update 2016). Public Health, Environmental and Social Determinants of Health (PHE). 2016. Available online: https://www.who.int/phe/health_topics/outdoorair/databases/cities/en/ (accessed on 1 May 2021).
  4. USEPA. Air Quality Index A Guide to Air Quality and Your Health. EPA-454/R-00-005. 2000. Available online: http://www.epa.gov (accessed on 23 June 2021).
  5. Abulude, F.O.; Damodharan, U.; Acha, S.; Adamu, A.; Arifalo, K.M. Preliminary Assessment of Air Pollution Quality Levels of Lagos, Nigeria. Aerosol. Sci. Eng. Aerosol. Sci. Eng. 2021, 5. [Google Scholar] [CrossRef]
  6. Tutiempo Network, S.L. Available online: https://www.calidadaire.net/nigeria.html (accessed on 1 May 2021).
  7. Akinwumiju, A.S.; Ajisafe, T.; Adelodun, A.A. Airborne Particulate Matter Pollution in Akure Metro City, Southwestern Nigeria, West Africa: Attribution and Meteorological Influence. J. Geovis. Spat. Anal. 2021, 5, 11. [Google Scholar] [CrossRef]
Figure 1. Boxplot of the results.
Environsciproc 08 00004 g001
Table 1. Basic description of the AQI results.
AQIO3PM2.5PM10CONOSO2
Mean117.3144.87117.466.875.486.846.58
Std Dev73.3316.3255.9527.426.946.25
Coef. Var62.5136.3647.6640.9845.45101.4994.96
Minimum4115413200
Maximum184118645143193742
Q188358845423
Q31535115383678
Skewness11.211.85.020.692.221.892.33
Kurtosis15.84.1839.68−0.197.763.077.11
Table 2. AQI, levels of concern and description.
Daily AQI ColourLevels of ConcernValues of IndexDescription of Air Quality
GreenGood0 to 50Air quality is satisfactory, and air pollution possess little or no risk
YellowModerate51 to 100Air quality is acceptable. However, there may be a risk for some people, particularly those who are unusually sensitive to air pollution
OrangeUnhealthy for Sensitive Groups101 to 150Members of sensitive groups may experience health effects. The general public is less likely to be affected
RedUnhealthy151 to 200Some members of the general public may experience health effects; members of sensitive group may experience more serious health effects
PurpleVery Unhealthy201 to 300Health alert: The risk of health effects is increased for everyone
MaroonHazardous301 and higherHealth warning of emergency conditions: everyone is more likely to be affected
Table 3. Pearson correlation coefficient of the pollutants.
AQIO3PM2.5PM10CONO2SO2
AQI1
O30.121
PM2.50.360.291
PM100.310.520.521
CO0.250.460.490.551
NO20.210.660.450.660.691
SO20.150.60.310.590.30.611
Publisher’s Note: MDPI stays neutral with regard to jurisdictional claims in published maps and institutional affiliations.

