1. Introduction
Tropical cyclones (TCs) are one of the natural hazards that annually cause major disasters worldwide, including many human deaths and large economic losses due to the increasing populations in coastal regions and the increasing economic value of infrastructure [
1].
The formation of TCs requires moist layers in the middle troposphere [
2,
3]. The cyclonic circulation provides part of the humidity for the development of connective cloudiness. Several studies [
4,
5,
6,
7,
8,
9,
10] have investigated the role of atmospheric moisture in TCs intensification. There are several methods to investigate the origin of moisture (e.g., Eulerian and Lagrangian). A further review and comparison of the different approaches used to study moisture transport may be found in Gimeno et al. [
11].
Although there have been many observational and modeling studies of TCs, and the Lagrangian diagnostic scheme has proved to be a powerful tool to identified moisture sources and study anomalous atmospheric moisture transports [
12,
13], the TCs’ water budgets through a Lagrangian approach have been poorly studied. Thus, in this study we aim to investigate the water budget of North Atlantic Hurricane Irma (2017) using Lagrangian analysis.
Hurricane Irma (2017)
Hurricane Irma (2017) was formed from a tropical wave at 0000 UTC 30 August [
14]. While moving westward to the south of a mid-level ridge over the eastern Atlantic, Irma strengthened rapidly in environmental conditions of low vertical wind shear and a fairly moist lower troposphere while it was over marginally warm sea surface temperature (SST). Only 48 h after genesis, Irma reached the major hurricane strength (category +3 hurricane on Saffir–Simpson scale) at 0000 UTC 1 September. The RI process (130 km/h in 48 h) underwent by Irma was at a remarkable rate that has only achieved by a small fraction of Atlantic tropical cyclones [
14].
The hurricane reached its maximum intensity of 286 km/h around 1800 UTC 5 September. As a category 5 hurricane, Irma made landfall on Barbuda and St. Martin around 0545 UTC and 1115 UTC 6 September, respectively. About 1630 UTC 6 September Hurricane Irma made its third landfall on the island of Virgin Gorda in the British Virgin Islands as a category 5 hurricane [
14]. Irma again made landfall on Little Inagua Island in the Bahamas at 0500 UTC 8 September at a category 4 intensity. Irma then turned slightly to the left, due to a building subtropical ridge, and moved toward the northern coast of Cuba and made a fifth landfall near Cayo Romano, Cuba, at 0300 UTC 9 September, with estimated maximum winds of 270 km/h.
The land interaction of the storm circulation in its movement along the northern coast of Cuba led to Irma weakening to a category 2 hurricane; however, the movement over warm waters in the Straits of Florida allowed the hurricane to re-intensify once again before making landfall for the sixth time near Cudjoe Key in the lower Florida Keys around 1300 UTC 10 September [
14]. Finally, Irma dissipated at 1200 UTC 13 September.
2. Material and Methods
2.1. Data
The information for Hurricane Irma was obtained from the Atlantic hurricane database (HURDAT2) [
15], available online at the National Hurricane Center (NHC) of the United States of America web page.
The rain rate from the Global Precipitation Measurement (GPM) [
16] was used. In this dataset, the precipitation is estimated from the various precipitation-relevant satellite. This dataset is merged into half-hourly 0.1° × 0.1° of latitude and longitude horizontal resolution.
2.2. FLEXPART Simulations
Global outputs from a modeling experiment using the FLEXPART v9.0 [
17] were utilized to investigate Hurricane Irma water budgets from 0000 UTC 30 August to 1200 UTC 13 September 2017. Initially, the model considers the atmosphere homogeneously divided into approximately 2 million particles (the number of air particles that must be higher than the meteorological model levels) uniformly distributed over the entire globe and permits one to track them backward and/or forward in time.
In this study, the particles residing over the area enclosed (target region) by the outer radius of each Hurricane Irma best track position were tracked backward in time up to 10 days, which is considered the residence time of the water vapour in the atmosphere [
18].
3. Results and Discussion
3.1. Identification of the Moisture Sources for Hurricane Irma Genesis and Intensification
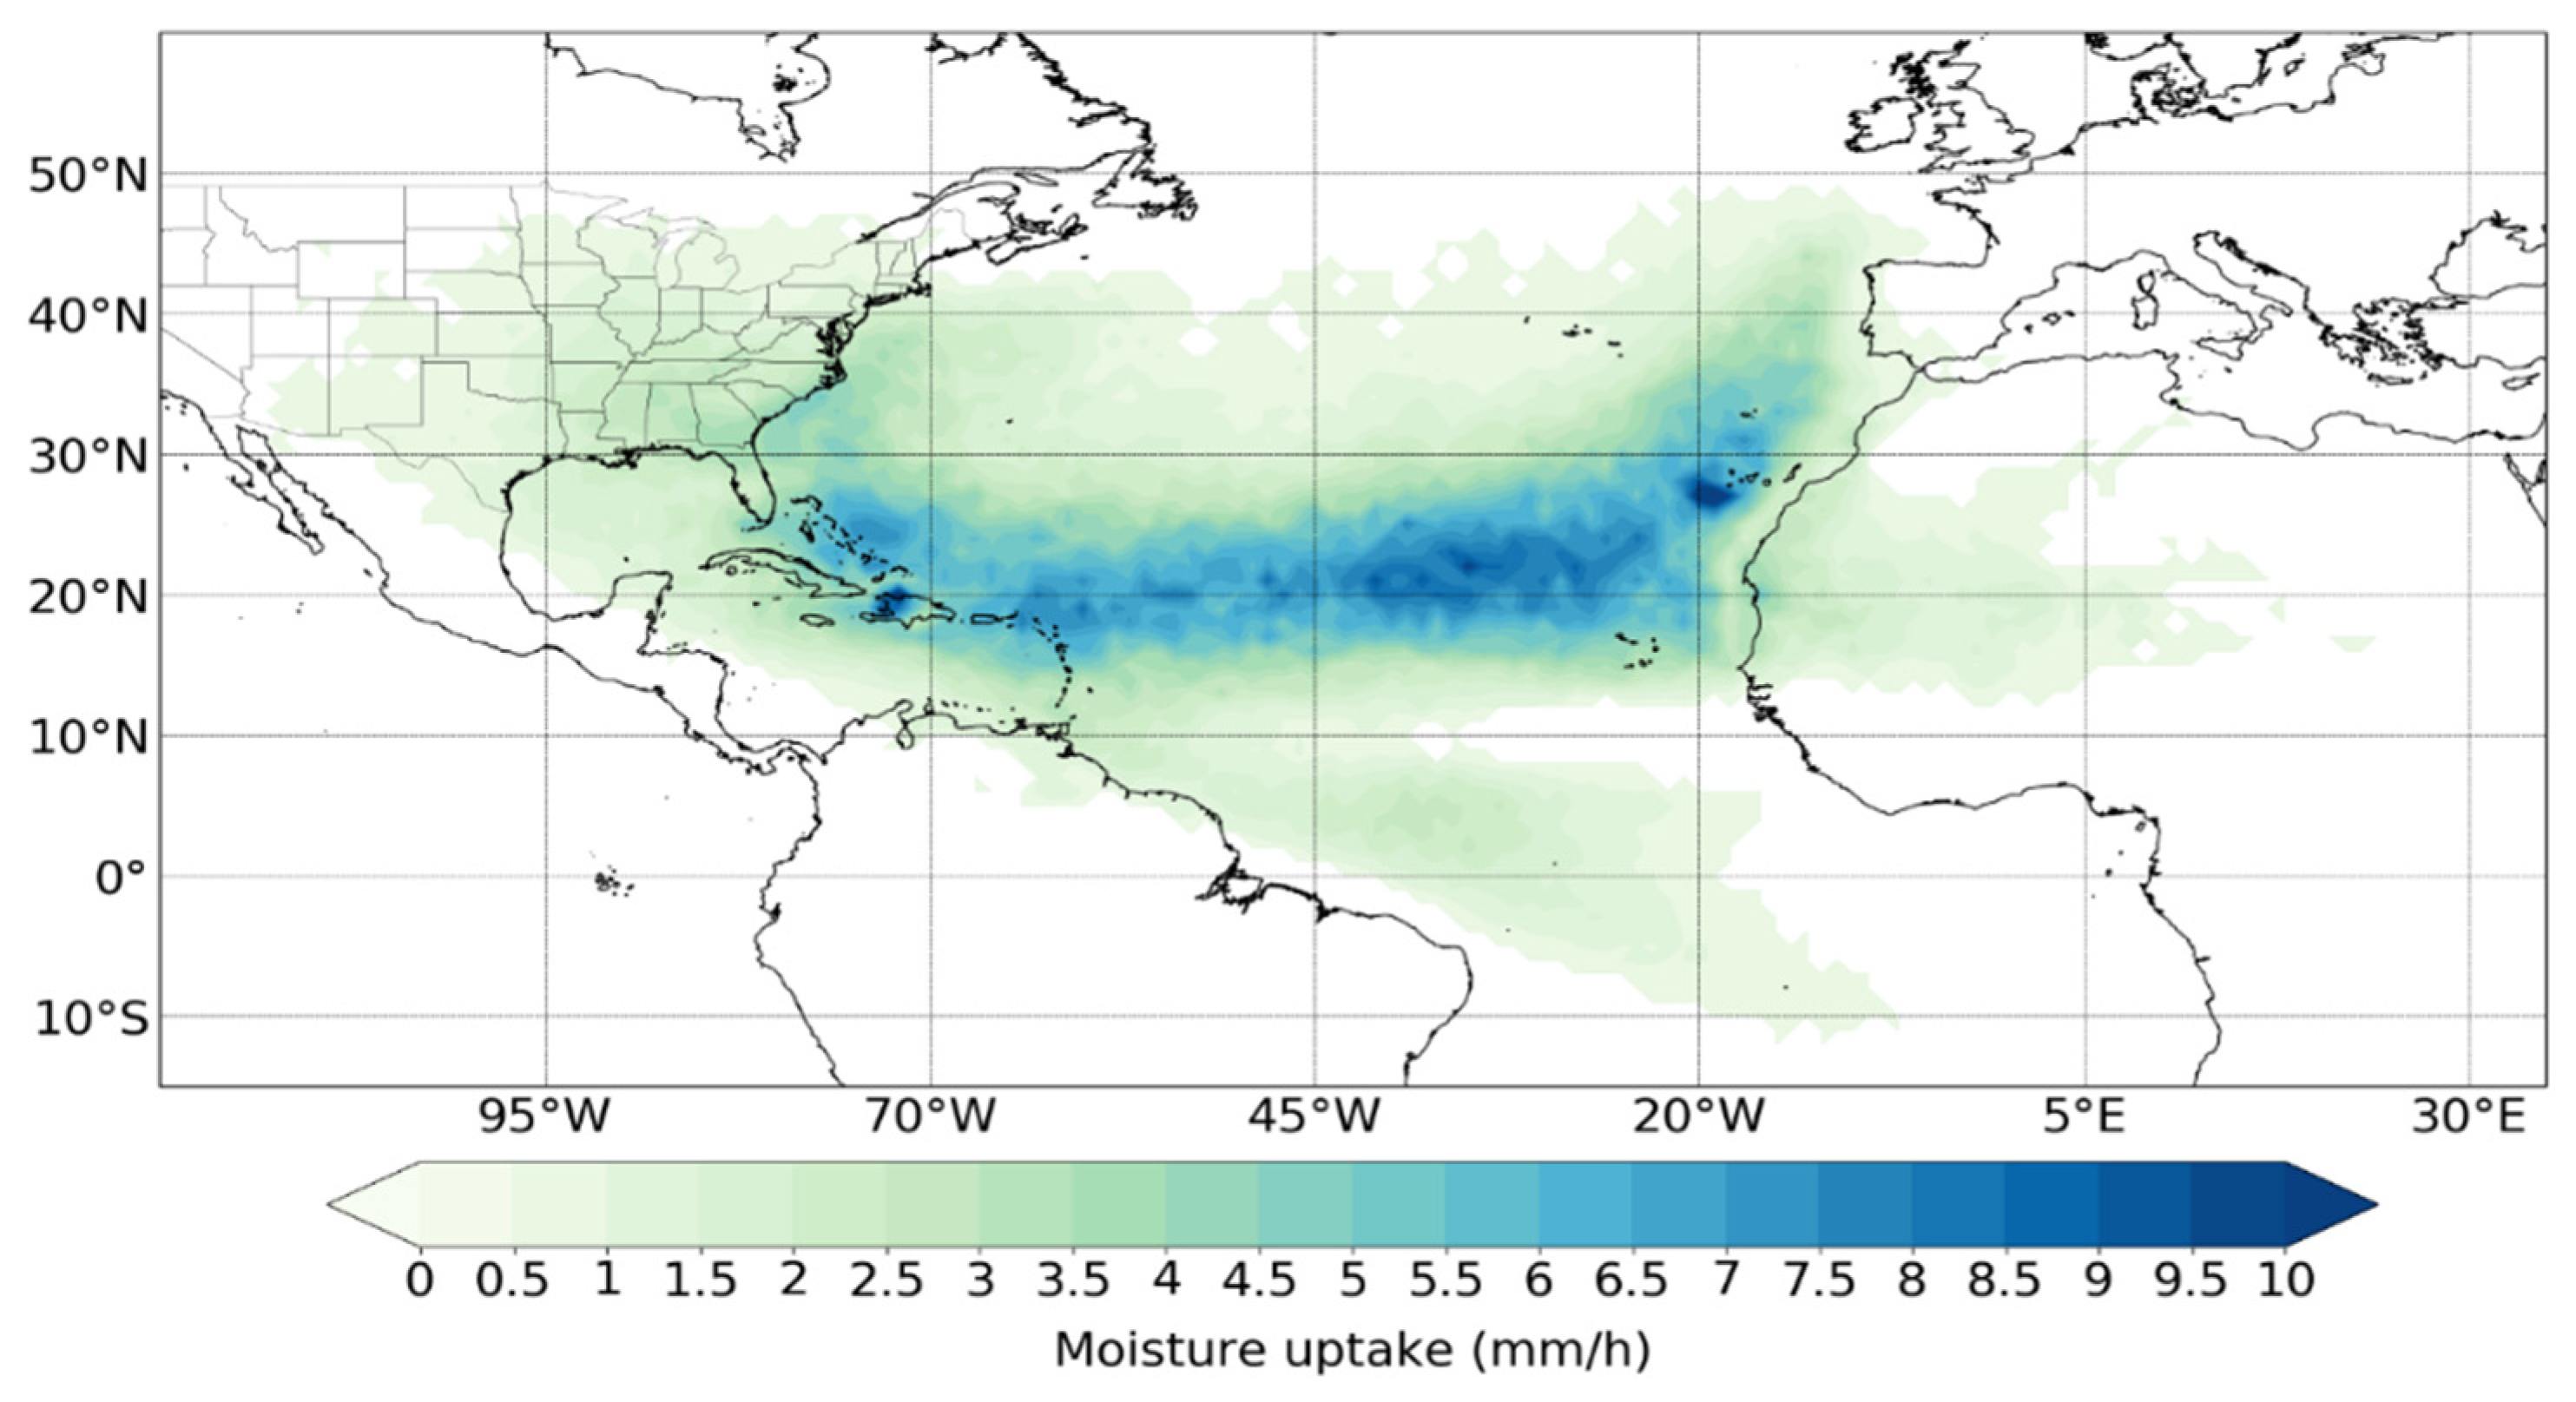
The moisture uptake composite from 0000 UTC 30 August to 1200 UTC 13 September reveals the moisture sources for Hurricane Irma (2017) genesis and intensification. Clearly, from
Figure 1 we identified the eastern North Atlantic along the northwest coast of Africa, from the Iberian Peninsula to the genesis position, and the Sahel region, as the main moisture sources that favoured the activation of the convection when Irma was still a tropical disturbance embedded in an easterly wave [
14]. The circulation of the North Atlantic Subtropical High-Pressure system (NASH) and the easterly winds acted as moisture transport mechanisms from the source regions to the genesis location.
Along the trajectory of Hurricane Irma, the easterly winds and the trade winds continued supplying atmospheric humidity to TC, which favored the intensification processes. Furthermore, the South Atlantic Subtropical High-Pressure system (SASH) transported water vapour from the South Atlantic Ocean to the Caribbean Sea, and then the easterly winds moved it towards Irma’s position. Additionally, the Caribbean Sea and the Gulf of Mexico contributed the atmospheric humidity required by Irma to keep the deep convection and warm core by releasing latent heat. Nevertheless, the band between 15° and 30° north latitude over the Atlantic Ocean exhibits the greatest moisture contribution for Irma development. At the end of Irma’s lifetime over the southeastern United States, we assume that a recycling process played an important role in moisture supply. These findings are supported by the vertical integrated moisture flux pattern.
3.2. Precipitation Rate Spatial Distribution
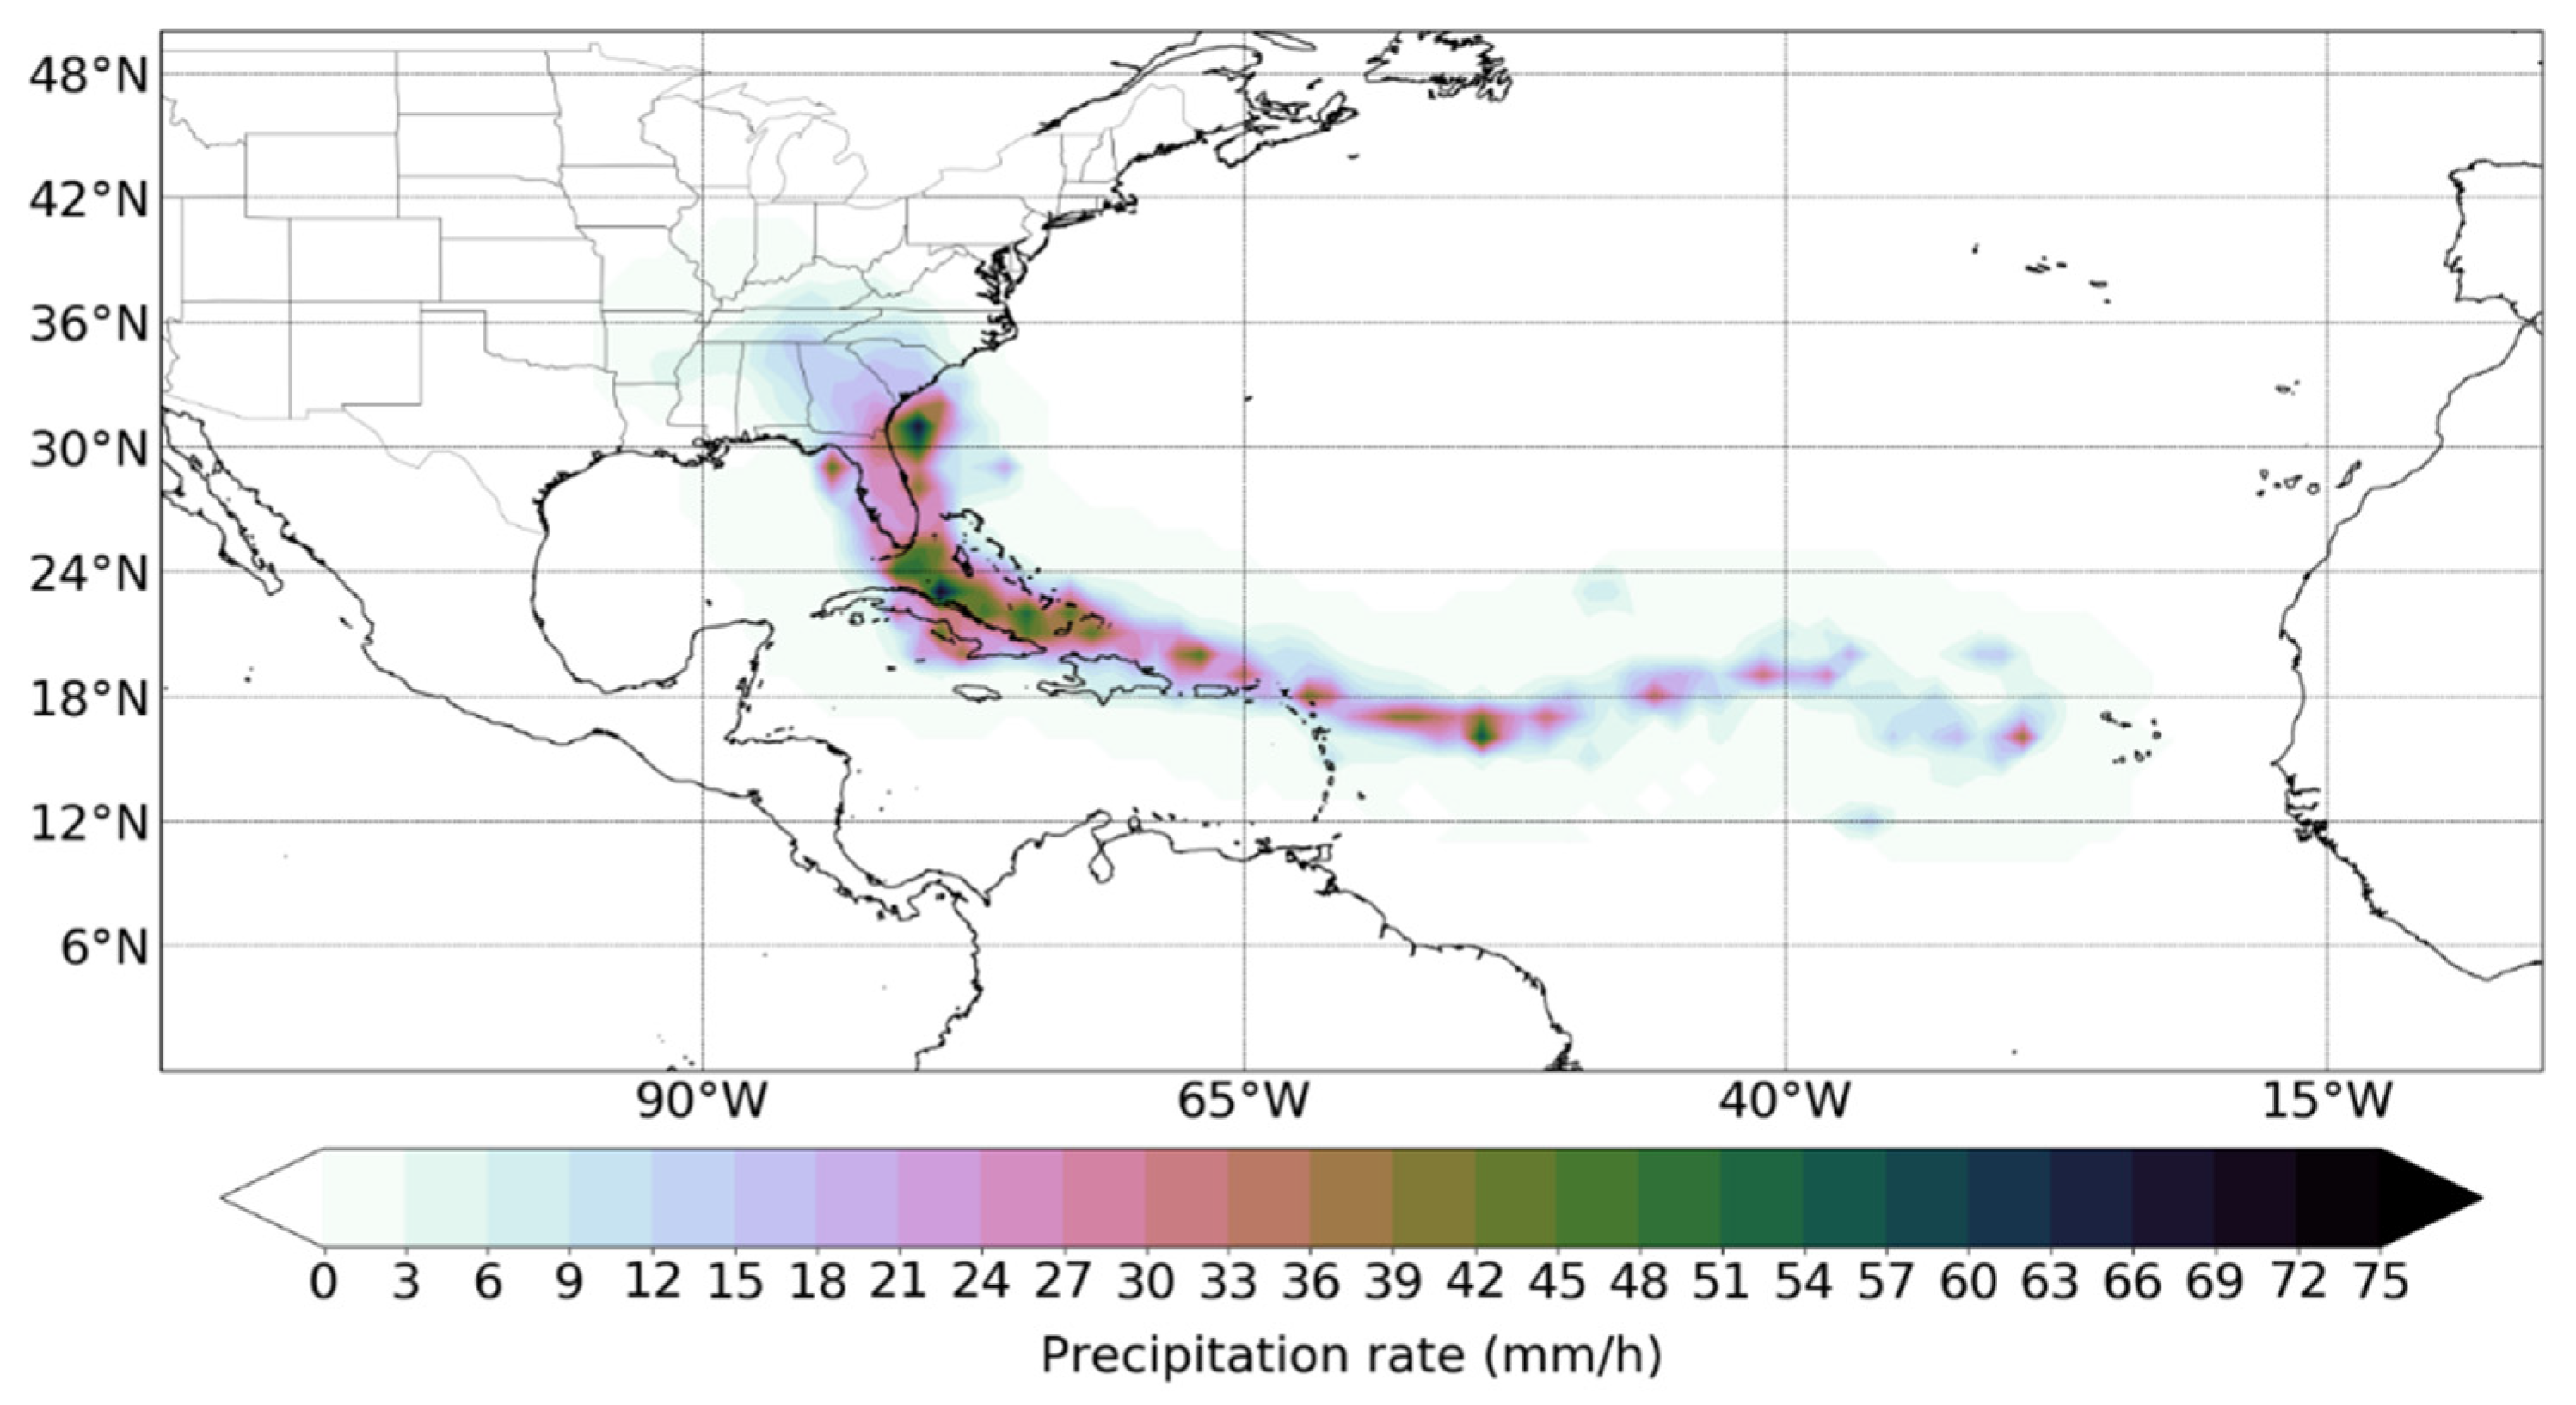
Figure 2 shows the precipitation rate from GPM along Hurricane Irma’s trajectory. Although Irma reached the major hurricane category just 48 h after genesis, the intensity of the precipitation was less than 8 mm/h during the initial lifetime. This feature may be linked to the fact that the inner core was quite compact at this time, with an estimated extension of 40 km [
14].
After the hurricane reached its maximum intensity close to the islands north of the Lesser Antilles Arc, the precipitation intensity increased to a maximum higher than 36 mm/h during its movement north of Cuba, as shown in
Figure 2. At this time, the higher precipitation rates were located in the northeast (NE) quadrant of the storm, coinciding with the regions with the highest moisture uptake, as can be easily verified in
Figure 1 and
Figure 2.
As Cangialosi et al. [
14] pointed out, Irma produced very heavy rainfall across a central-eastern portion of Cuba and over a large portion of the Florida peninsula, with the accumulated rainfall ranging from 250 to 380 mm.
3.3. Moisture Uptake vs. Rain Rate
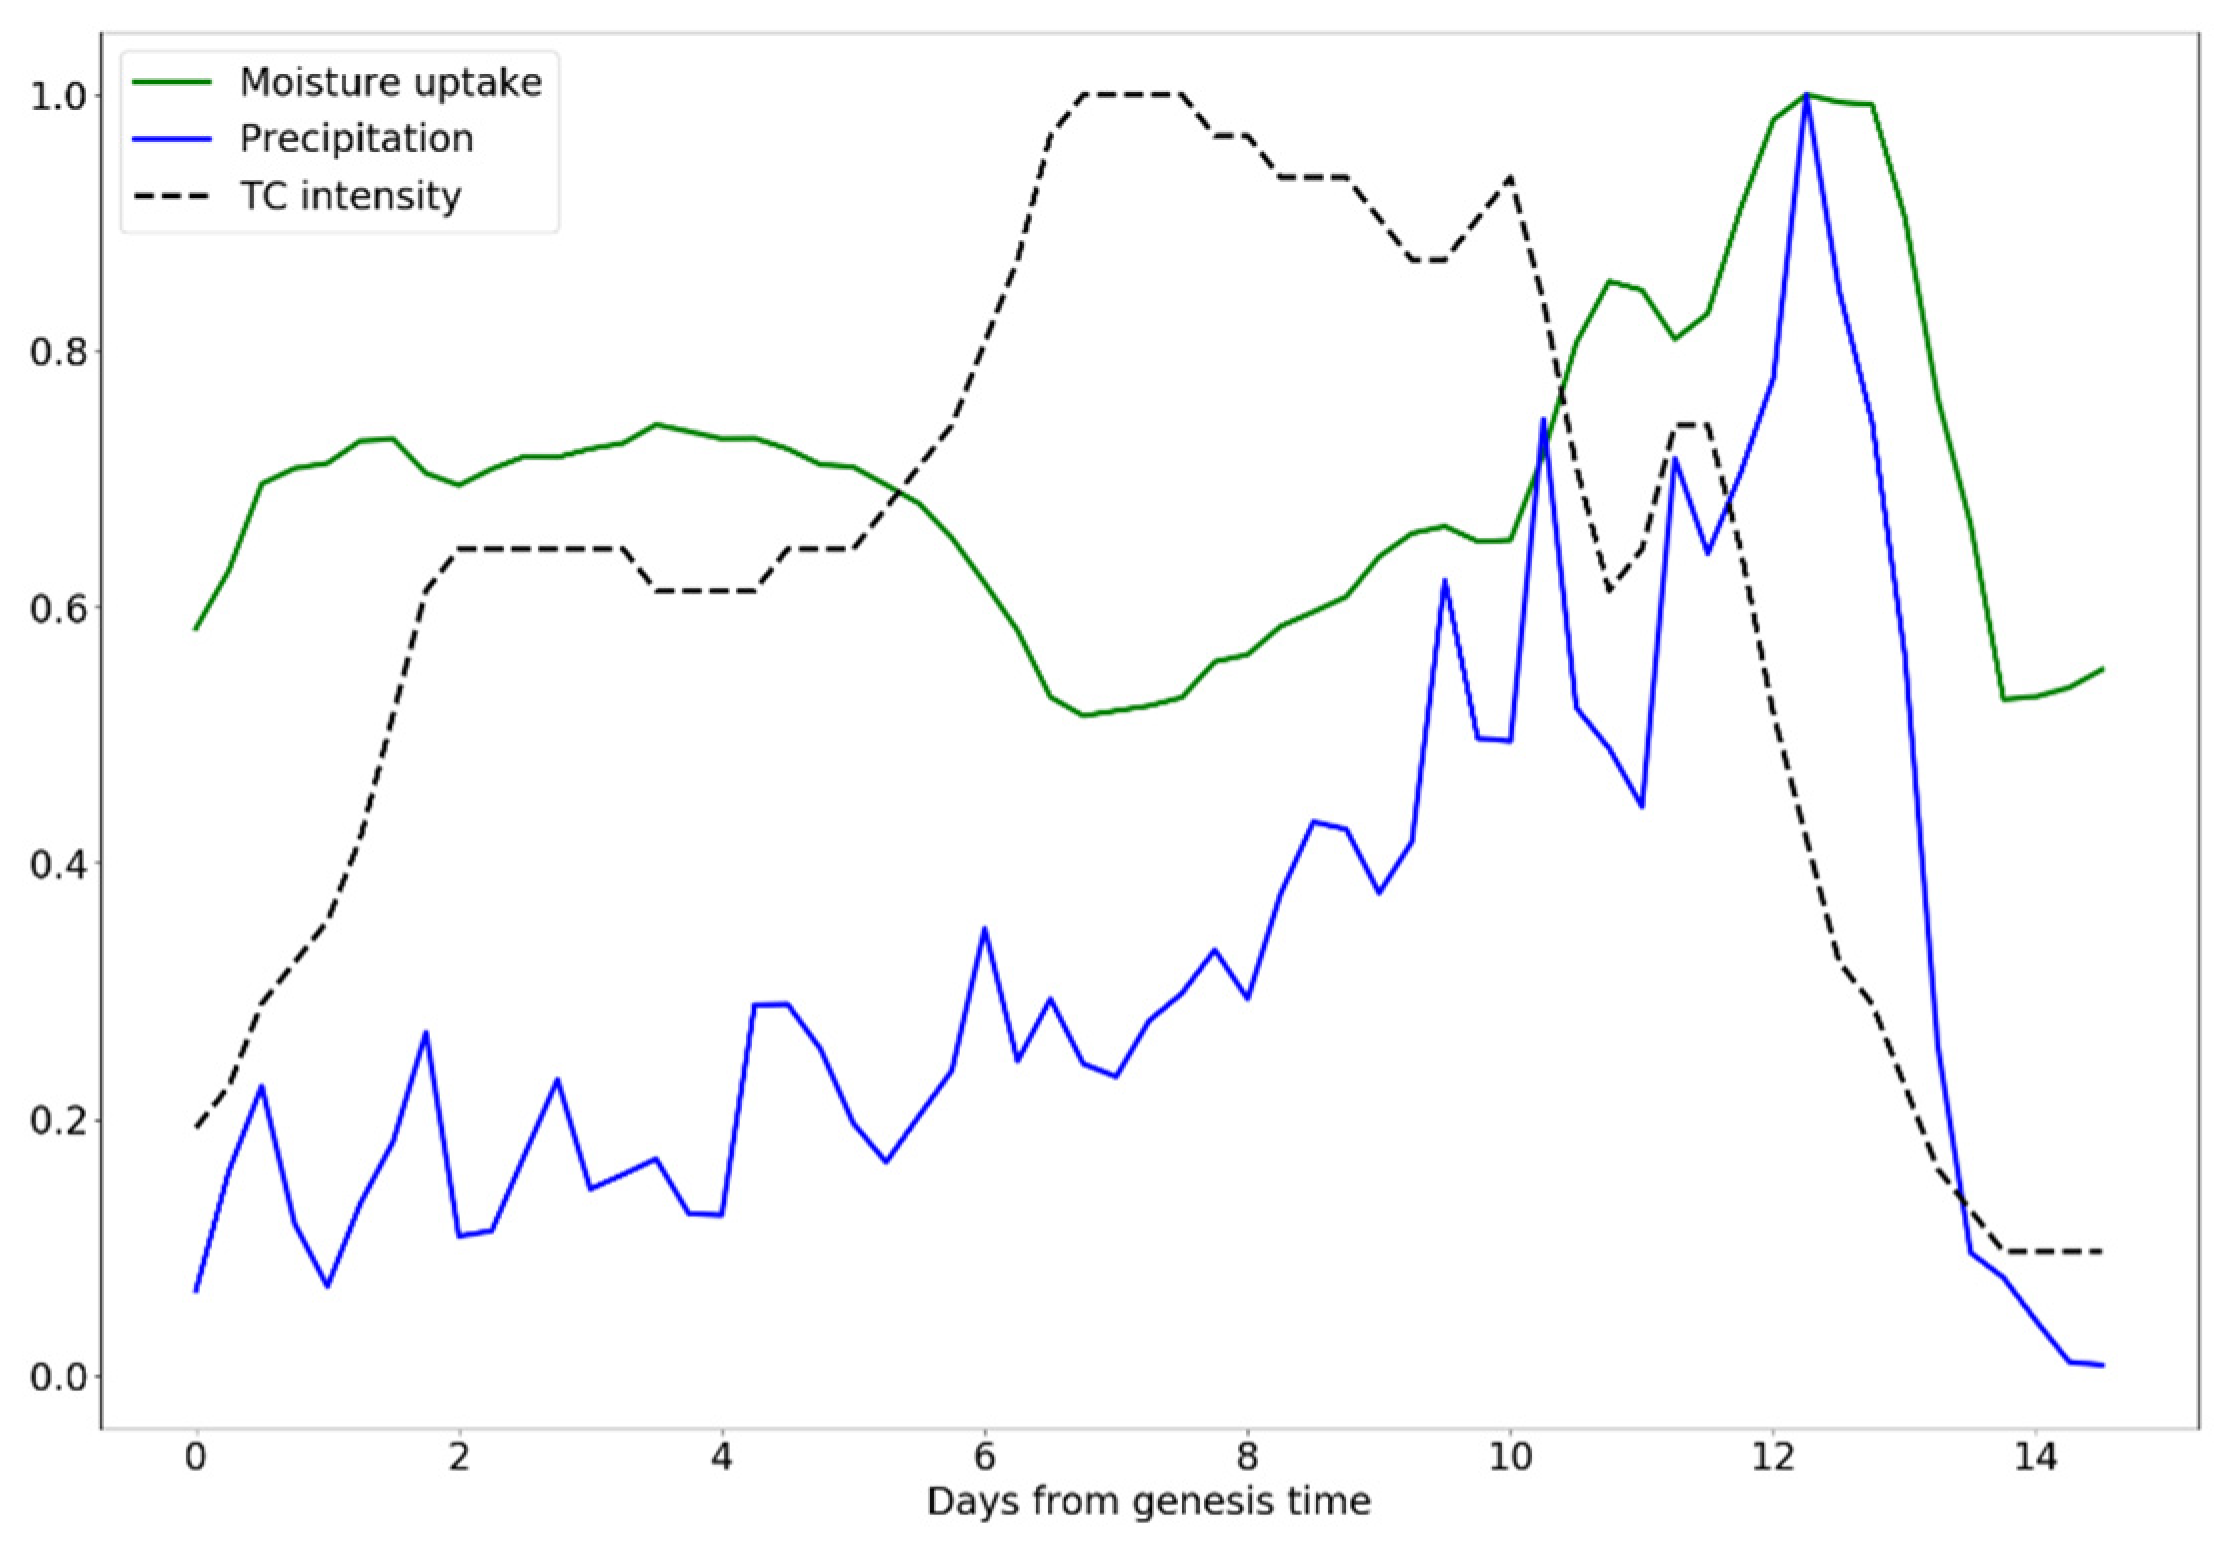
From
Figure 3 it can be inferred that in the eight days after the Irma genesis, the moisture uptake was higher than the precipitation rate, which favoured the continuous release of latent heat, a key factor in the intensification of TCs in agreement with Emanuel [
20]. Nevertheless, in the last five days (from day 9 to day 14) of Irma as a TC, the moisture uptake and the rain rate temporal evolution was very similar, which corresponds to the high accumulated rainfall during its movement along the north coast of Cuba and the Florida peninsula. It is notable that both magnitudes reach their maximum values at this time.
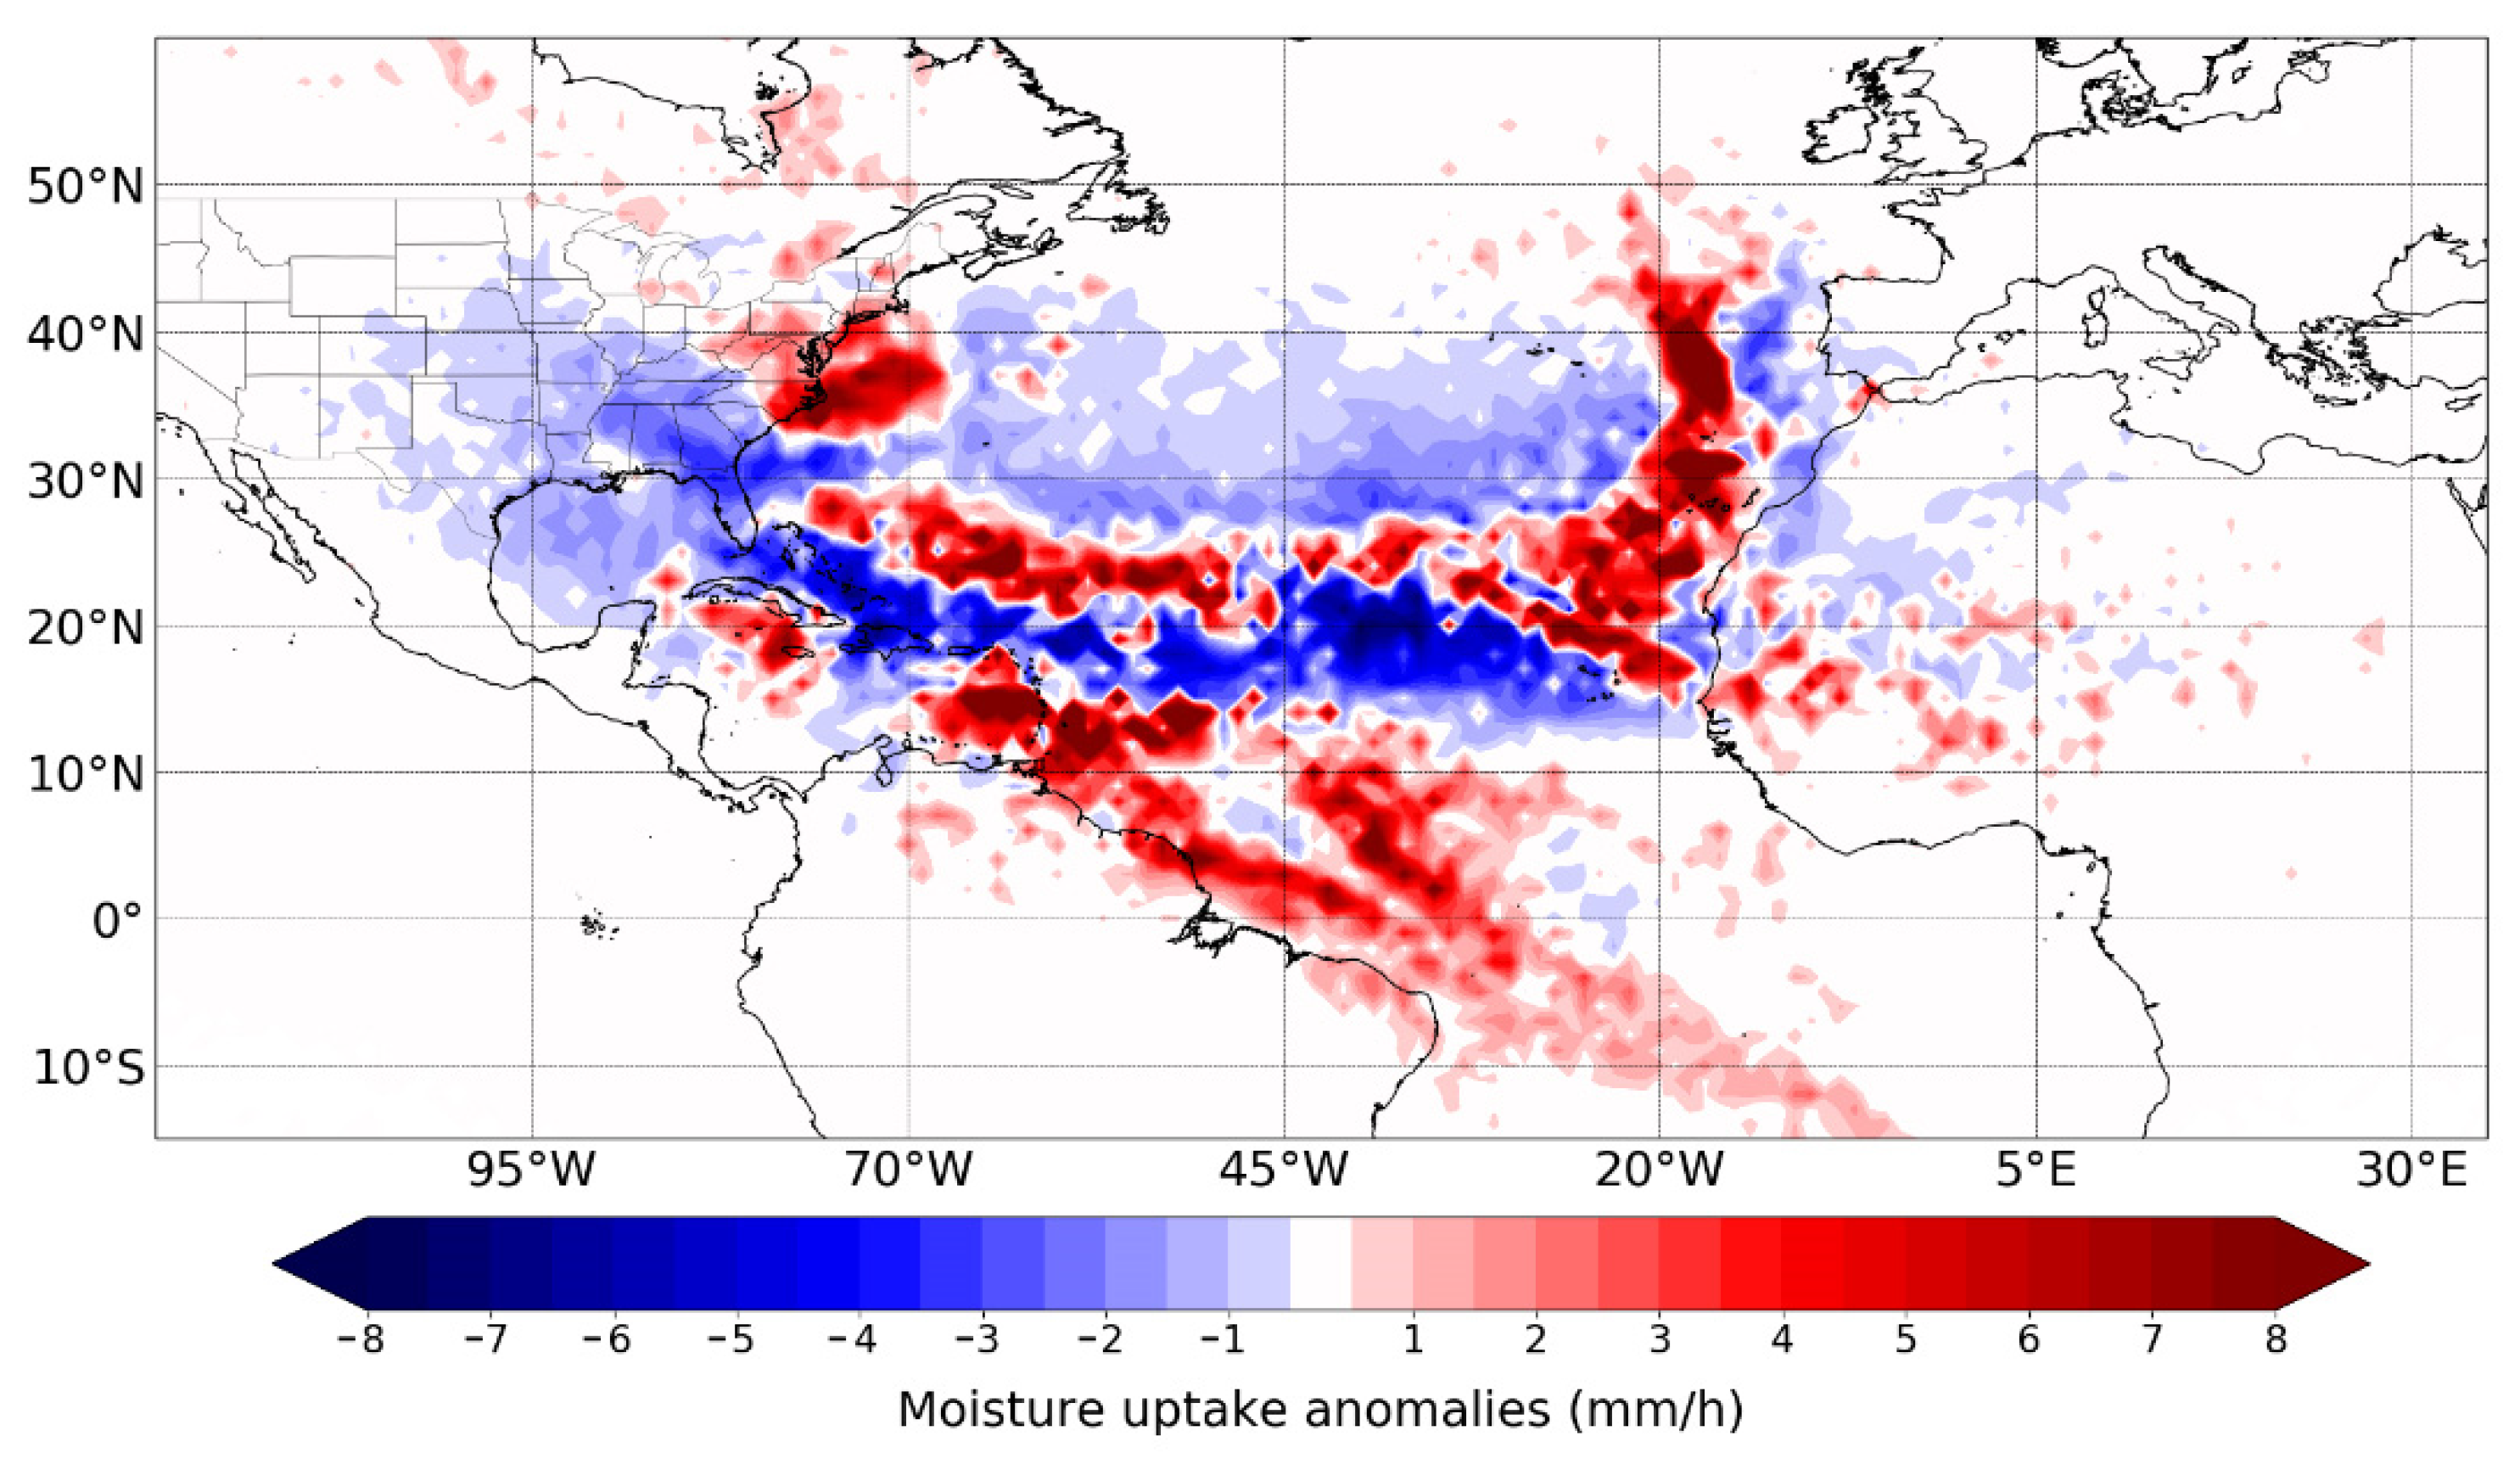
Figure 4 reveals that Irma took more moisture from the environment that was not related to TC circulation than it did moisture from ocean evaporation within the area enclosed by the outer radius in each best track position. Therefore, the secondary circulation transported more moisture inward and, thus induced a stronger moist core. In other words, the strong radial inflow transported highly moist air parcels from the surrounding environment inward to the inner core.
4. Conclusions
In this study we performed a Hurricane Irma (2017) water budget analysis through a Lagrangian approach. Hurricane Irma was one of the most severe hurricanes of the 2017 cyclonic season in the North Atlantic basin and caused heavy rainfall along the north coast of Cuba and Florida peninsula. To determine the moisture uptake for each position of the Irma best track and the water budget inside the system, the particle dispersion model FLEXPART was used.
The results showed that the North Atlantic Ocean between 15°–30° north latitude, the Sahel region, and the South Atlantic were the main moisture sources for the genesis and development of Irma. The Caribbean Sea, the Gulf of Mexico, and the southeastern United States of America also contributed, but to a lesser extent. Furthermore, the North Atlantic Subtropical High-Pressure system, the South Atlantic Subtropical High-Pressure system, and the easterly winds were identified as the main moisture transport mechanisms for supplying atmospheric humidity to Irma.
Despite the great intensity of Irma, during the first five–six days after genesis, the precipitation rate was less than 8 mm/h. However, when the hurricane center crossed over the Greater Antilles as an intense hurricane, the precipitation rate was greater than 20 mm/h, which supports the accumulated rainfall reported in Cuba and La Florida.
As expected, the moisture supplied from the surface under the area delimited by hurricane size is small, thus, the water vapour supplied from the environment through the secondary circulation transported more moisture inward. The accumulated moisture uptake anomalies along Hurricane Irma’s trajectory showed that both the Tropical North and South Atlantic Oceans were important sources of moisture for Irma development. However, the region of West Africa and the North Atlantic Ocean near the African continent and the Iberian Peninsula also provided humidity.
Author Contributions
A.P.-A., R.N., and L.G. conceived the idea of the study. A.P.-A., R.S., J.C.F.-A. and P.C.-H. processed the data and made the figures. A.P.-A. analyzed the results and wrote the manuscript. All authors analyzed the results and revised the final version of the manuscript. All authors have read and agreed to the published version of the manuscript.
Funding
The LAGRIMA project (grant No. RTI2018-095772-B-I00) was funded by the Ministerio de Ciencia, Innovación y Universidades, Spain. Partial support was also obtained from the Xunta de Galicia under the project “Programa de Consolidación e Estructuración de Unidades de Investigación Competitivas (Grupos de Referencia Competitiva)” (No. ED431C 2017/64-GRC).
Institutional Review Board Statement
Not applicable.
Informed Consent Statement
Not applicable.
Data Availability Statement
The datasets used in this study are freely available on the internet. The HURDAT2 database is accessible from
https://www.nhc.noaa.gov/data/#hurdat (accessed on 5 May 2021), and the GPM dataset is available at
https://gpm.nasa.gov/data/directory (accessed on 18 May 2021). The FLEXPART output to reproduce our results is available upon request from the corresponding author.
Acknowledgments
A.P.-A. acknowledges support from UVigo PhD grants. J.C.F.-A. and R.S. acknowledge support from the Xunta de Galicia (Galician Regional Government) under the grants No. ED481A-2020/193 and ED481B 2019/070, respectively. We also thank Xunta de Galicia under the Project ED431C 2021/44 (Programa de Consolidación e Estructuración de Unidades de Investigación Competitivas (Grupos de Referencia Competitiva) and Consellería de Cultura, Educación e Universidade).
Conflicts of Interest
The authors declare no conflict of interest.
References
- Shultz, J.M.; Russell, J.; Espinel, Z. Epidemiology of Tropical Cyclones: The Dynamics of Disaster, Disease, and Development. Epidemiol. Rev. 2005, 27, 21–35. [Google Scholar] [CrossRef] [PubMed] [Green Version]
- Gray, W.M. A global view of the origin of tropical disturbances and storms. Mon. Weather Rev. 1968, 96, 669–700. [Google Scholar] [CrossRef]
- Emanuel, K.A. The dependence of hurricane intensity on climate. Nature 1987, 326, 483–485. [Google Scholar] [CrossRef]
- Braun, S.A.; Sippel, J.A.; Nolan, D.S. The impact of dry mid-level air on hurricane intensity in idealized simulations with no mean flow. J. Atmos. Sci 2012, 69, 236–257. [Google Scholar] [CrossRef]
- Emanuel, K.; DesAutels, C.; Holloway, C.; Korty, R. Environmental control of tropical cyclone intensity. J. Atmos. Sci. 2004, 61, 843–858. [Google Scholar] [CrossRef]
- Ge, X.; Li, T.; Peng, M. Effects of vertical shears and midlevel dry air on tropical cyclone developments. J. Atmos. Sci. 2013, 70, 3859–3875. [Google Scholar] [CrossRef]
- Kimball, S.K. A modeling study of hurricane landfall in a dry environment. Mon. Weather Rev. 2006, 134, 1901–1918. [Google Scholar] [CrossRef]
- Wang, Z.; Montgomery, M.T.; Dunkerton, T.J. A dynamically-based method for forecasting20tropical cyclogenesis location in the Atlantic sector using global model products. Geophys. Res. Lett. 2009, 36, L03801. [Google Scholar] [CrossRef]
- Tao, D.; Zhang, F. Effect of environmental shear, sea-surface temperature, and ambient moisture on the formation and predictability of tropical cyclones: An ensemble-mean perspective. J. Adv. Model. Earth Syst. 2014, 6, 384–404. [Google Scholar] [CrossRef]
- Ying, Y.; Zhang, Q. A modeling study on tropical cyclone structural changes in response to ambient moisture variations. J. Meteor. Soc. Jpn. 2012, 90, 755–770. [Google Scholar] [CrossRef] [Green Version]
- Gimeno, L.; Stohl, A.; Trigo, R.M.; Dominguez, F.; Yoshimura, K.; Yu, L.; Drumond, A.; Durán-Quesada, A.M.; Nieto, R. Oceanic and Terrestrial Sources of Continental Precipitation. Rev. Geophys. 2012, 50, RG4003. [Google Scholar] [CrossRef]
- Stohl, A.; James, P. A Lagrangian analysis of the atmospheric branch of the global water cycle. Part I: Method description, validation, and demonstration for the August 2002 flooding in central Europe. J. Hydrometeorol. 2004, 5, 656–678. [Google Scholar] [CrossRef]
- Stohl, A.; James, P. A Lagrangian analysis of the atmospheric branch of the global water cycle. Part II: Moisture transports between the Earth’s ocean basins and river catchments. J. Hydrometeorol. 2005, 6, 961–984. [Google Scholar] [CrossRef]
- Cangialosi, P.J.; Latto, S.S.; Berg, R. National Hurricane Center Tropical Cyclone Report. Hurricane Irma (AL112017). National Hurricane Center. 2018. Available online: https://www.nhc.noaa.gov/data/tcr/AL112017_Irma.pdf (accessed on 14 March 2021).
- Landsea, C.W.; Franklin, J.L. Atlantic Hurricane Database Uncertainty and Presentation of a New Database Format. Mon. Weather Rev 2013, 141, 3576–3592. [Google Scholar] [CrossRef]
- Huffman, G.; Stocker, E.; Bolvin, D.; Nelkin, E.; Tan, J. GPM IMERG Early Precipitation L3 Half Hourly 0.1 Degree × 0.1 Degree V06; Goddard Earth Sciences Data and Information Services Center (GES DISC): Greenbelt, MD, USA, 2019. [Google Scholar] [CrossRef]
- Stohl, A.; Forster, C.; Frank, A.; Seibert, P.; Wotawa, G. Technical note: The Lagrangian particle dispersion model FLEXPART version 6.2. Atmos. Chem. Phys. 2005, 5, 2461–2474. [Google Scholar] [CrossRef] [Green Version]
- Numaguti, A. Origin and recycling processes of precipitating water over the Eurasian continent: Experiments using an atmospheric general circulation model. J. Geophys. Res. 1999, 104, 1957–1972. [Google Scholar] [CrossRef]
- Pérez-Alarcón, A.; Sorí, R.; Fernández-Alvarez, J.C.; Nieto, R.; Gimeno, L. Comparative climatology of outer tropical cyclone size using radial wind profiles. Weather Clim. Extrem.. 2021, 33, 100366. [Google Scholar] [CrossRef]
- Emanuel, K.A. An air–sea interaction theory for tropical cyclones. Part I: Steady-state maintenance. J. Atmos. Sci. 1986, 43, 585–604. [Google Scholar] [CrossRef]
| Publisher’s Note: MDPI stays neutral with regard to jurisdictional claims in published maps and institutional affiliations. |
© 2021 by the authors. Licensee MDPI, Basel, Switzerland. This article is an open access article distributed under the terms and conditions of the Creative Commons Attribution (CC BY) license (https://creativecommons.org/licenses/by/4.0/).


 ,
, 


