Next Article in Journal
Lockdown in Mars
Previous Article in Journal
Promoting the Co-Creation of Knowledge under Physical Distancing Conditions through the Participation of Youth in the Bunaken-Tangkoko-Minahasa Biosphere Reserve (North Sulawesi, Indonesia)
 
 
Please note that, as of 4 December 2024, Environmental Sciences Proceedings has been renamed to Environmental and Earth Sciences Proceedings and is now published here.
Proceeding Paper

Use of Statistical Approach Combined with SAR Polarimetric Indices for Surface Moisture Estimation over Bare Agricultural Soil †

Centre d’Études de la BIOsphère (CESBIO), Université de Toulouse, CNES/CNRS/INRAe/IRD/UPS, 18 avenue Edouard Belin, 31401 Toulouse, France
*
Author to whom correspondence should be addressed.
Presented at the 3rd International Electronic Conference on Geosciences, 7–13 December 2020; Available online: https://iecg2020.sciforum.net/#.
Environ. Sci. Proc. 2021, 5(1), 22; https://doi.org/10.3390/IECG2020-08543
Published: 24 November 2020

Abstract

:
This paper aims at addressing the potential of polarimetric indices derived from C-band Radarsat-2 images to estimate the surface soil moisture (SSM) over bare agricultural soils. Images have been acquired during the Multispectral Crop Monitoring (MCM) experiment throughout an agricultural season over a study site located in southwestern France. Synchronously with the acquisitions of the 22 SAR images, field measurements of soil descriptors were collected on surface states with contrasting conditions, with SSM levels ranging from 2.4% to 35.3% m3·m−3, surface roughness characterized by standard deviation of roughness heights ranging from 0.5 to 7.9 cm, and soil texture showing fractions of clay, silt and sand between 9%–58%, 22%–77%, and 4%–53%, respectively. The dataset was used to independently train and validate a statistical algorithm (random forest), SSM being estimated using the polarimetric indices and backscatter coefficients derived from the SAR images. Among the SAR signals tested, the performance levels are very uneven, as evidenced by magnitude of correlation (R2) ranging from 0.35 to 0.67. The following polarimetric indices present the best estimates of SSM: the first, second and third elements of the diagonal (T11, T22, and T33), eigenvalues (λ1, λ2, λ3 from Cloude–Pottier decomposition), Shannon entropy, Freeman double-bounce and volume scattering mechanisms, the total scattered power (SPAN), and the backscattering coefficients whatever the polarization state, with correlations greater than 0.6 and with RMSE ranged between 4.8% and 5.3% m3·m−3. These performances remain limited although they are among the best SSM estimates using C-band images, comparable to those obtained with other approaches (i.e., empirical, physical based, or model inversion).

1. Introduction

Numerous studies based on synthetic aperture radar (SAR) imagery have demonstrated the usefulness of microwave remote sensing data for surface soil moisture (SSM) estimation. Among the parameters that can be derived from these images, backscatter coefficients have been the subject of most studies especially in C-band [1,2,3]. The continuity of satellite missions in this frequency since the 1990s (with ERS-1/2, Envisat, Radarsat-1/2 or Sentinel-1a/b) explains the numerous studies, compared to the work carried out with other antenna configurations. In the majority of cases, the images delivered by these missions were characterized by one or even two polarization states. With missions such as Radarsat-2 and in particular the acquisition beam modes giving access to the four polarization states, the study of other metrics derived from satellite images became possible. Nevertheless, the performance and limitations associated with polarimetric approaches remain to be established, as only a few studies have been carried out on the contribution of these data to the estimation of SSM.
During the bare soil period, the sensitivity of certain polarimetric indices (i.e., alpha angle, entropy, anisotropy) was analyzed as a function of SSM or surface roughness. Some of the tested indices showed a low dynamic range with respect to the measured variables, the radar signals being generally characterized by a wide dispersion [4,5]. This trend was confirmed by the work aimed at estimating SSM in arid context, the polarimetric indices showing limited levels of performance in retrieving the small variation intervals of measured SSM [6]. During vegetative periods, attempts to estimate SSM were also tested on the basis of L-band data [7,8,9], also showing limitations in the use of polarimetric indices.
In this context, the objective of this study is to address and compare the performance of polarimetric SAR indices for SSM estimates using a statistical algorithm (i.e., random forests). The mean features of the study site are described together with the three key soil variables collected at each satellite overpass (Section 2.1 and Section 2.2). After image processing, independent statistical algorithms are trained and validated for each parameter derived from the Radarsat-2 images (procedure described in Section 2.3). The performance associated with the co- and cross-polarized backscattering coefficients, as well as those for polarimetric indices are presented, compared and discussed in Section 3 and Section 4.

2. Experiments

2.1. Study Site

From February to November 2010, the Multispectral Crop Monitoring campaign (MCM’10 campaign, see [10] for more details) was conducted on a network of agricultural plots located in southwestern France (Figure 1). Subject to a temperate climate, the surfaces were mainly allocated to seasonal crops (i.e., straw cereals, sunflower, corn, rapeseed, sorghum or soybean) being cultivated on more than half of the landscape. The bare soil conditions were observed after the harvest and before the sowing of the next crop (i.e., in spring and autumn). Several tillage events might occur on the same plot, resulting in contrasted roughness levels (ranging from smooth before the crop sowing to very rough after deep ploughing).

2.2. Materials

2.2.1. In Situ Data

  • Surface soil moisture
The regular measurements of SSM were collected by using portable probes (ML2x from ThetaProbe), allowing to sample the top soil layer (0–5 cm) along geo-located transects. The probes delivered a signal in mV that was converted in volumetric moisture expressed in cubic meter of water per cubic meter of soil (m3·m−3), through the determination of a calibration relationship [10]. The measurements were performed quasi-synchronously with satellite acquisitions over a wide range of conditions. The average values observed on the monitored plots varied between a minimum of 3.8% m3·m−3 and a maximum of 29.8% m3·m−3, extremes observed during summer months (after the harvest of the winter crops) or during the rainy period in February and May.
  • Soil texture
The fractions of clay, silt and sand were derived from core samples collected on the monitored plots (along the same transects used for the measurements of SSM). For each geo-located measurement, 16 core samples within a circle of 15 m of diameter and a depth of 25 cm were performed. The monitored plots presented an interesting variability regarding soil texture, fractions being between 9%–58% for the clay, between 22% and 77% for the silt and between 4% and 53% for the sand.
  • Surface roughness
A two-meter long needle prolimeter was used to measure the micro-relief after each change of surface condition. Two profiles were collected parallel and perpendicular to the tillage direction of the plot, and associated to obtain 4-m-long profiles. The surface roughness was finally characterized through the derivation of two variables: the root mean square height (hrms) and correlation length (lc). The values of hrms and lc were derived from parallel and perpendicular profiles on ploughed, stubble disked, harrowed, prepared cloddy, and prepared smooth soil. The highest values of hrms were observed on the ploughed plots in the perpendicular direction (reaching a maximum of 7.9 cm), while the lowest values were observed on the prepared plots in the parallel direction (with a minimum of 0.5 cm).

2.2.2. Radarsat-2 Satellite Data

Throughout the agricultural season, 22 microwave satellite images were acquired by the Canadian satellite Radarsat-2, on plots presenting bare soil conditions (Table 1). The SAR images were acquired in the C-band (f = 5.405 GHz, λ = 5.5 cm) using the full quad-polarization mode (FineQuad-Pol), which delivers products with HH, VV, HV, and VH polarizations [11]. They were acquired with eight different incidence angles, ranging from 24° to 41°, with pixel spacing of ~5 m.

2.3. Method

2.3.1. Images Processing

A radiometric calibration was first applied to the SAR images, they were then geo-coded (to correct the topographic deformations) and projected, procedures allowing the extraction of the backscattering coefficients at the plot spatial scale.
The processing steps aiming at deriving the polarimetric indices were performed on the SLC Radarsat-2 images, using the PolSARpro v5.0 software (Polarimetric SAR Data Processing and Educational Toolbox) [12]. Finally, the following 17 polarimetric indicators were analyzed here: entropy, anisotropy, alpha angle, and eigenvalues (λ1, λ2, λ3) (Cloude–Pottier decomposition), double-bounce, volume, and surface scattering (Freeman–Durden decomposition), SE, SEi, SEp, SPAN, RVI, and T11, T22, and T33.

2.3.2. From Satellite Signals to SSM Estimates

The parameters derived from the Radarsat-2 images (i.e., backscattering coefficients or polarimetric indices) were used independently to estimate the SSM, constituting one of the explanatory variables of the statistical algorithm proposed by [13]. In addition to the radar signals, the following variables were also considered as inputs: the incidence angles of the SAR images, the fractions of clay and sand, and the root mean square height (hrms) and correlation length (lc) (measured in the parallel and perpendicular directions). The random forest shows satisfactory results, especially for modelling non-linear relationships. Such dynamics are a characteristic of the sensitivity of SAR signals to surface parameters observed in different studies [14,15]. In a context of estimation of backscatter coefficients, the statistical algorithm offers for example better performances than electromagnetic modelling [16,17]. The targeted variable (i.e., SSM in the present case) was derived from a weighted mean of an ensemble of estimations, obtained from independent decision trees trained on different set of samples (limiting the problems of over-adjustment or the noise influence on data).
Whatever the considered parameter derived from the Radarsat-2 images, an independent statistical algorithm was trained and validated on a randomly partitioned subset of the initial dataset (each subset of data containing half of the collected points). This procedure was repeated ten times. Finally, the average values of the coefficient of determination (R2) and the root mean square error (RMSE) were derived from the comparison between the observed and estimated values of the SSM.

3. Results

3.1. Comparison of Statistical Performances Obtained Using Parameters Derived from SAR Images

An overview of the statistical performance is presented in Figure 2, summarizing the R2 and RMSE values obtained by comparing the SSM ground measurements to the estimates. The statistical approach is used with one of the parameters derived from the satellite, allowing for comparison of the results associated with each of the signals. A large disparity in performance levels is observed, with R2 values varying between 0.30 and 0.67 and errors ranging from 4.73 to 6.71% m3·m−3. Among the best-performing parameters, estimates based on backscatter coefficients regardless of the polarization state show correlations greater than 0.60, as do the following polarimetric indicators: the first, second, and third elements of the diagonal (T11, T22, and T33), eigenvalues (λ1, λ2, λ3 from Cloude–Pottier decomposition), Shannon entropy, Freeman double-bounce and volume scattering mechanisms, and the total scattered power (SPAN). For these parameters derived from full-polarization images, the error level is between 4.8% and 5.3% m3·m−3.

3.2. Focus on Promising Parameters Derived from the C-Band Images

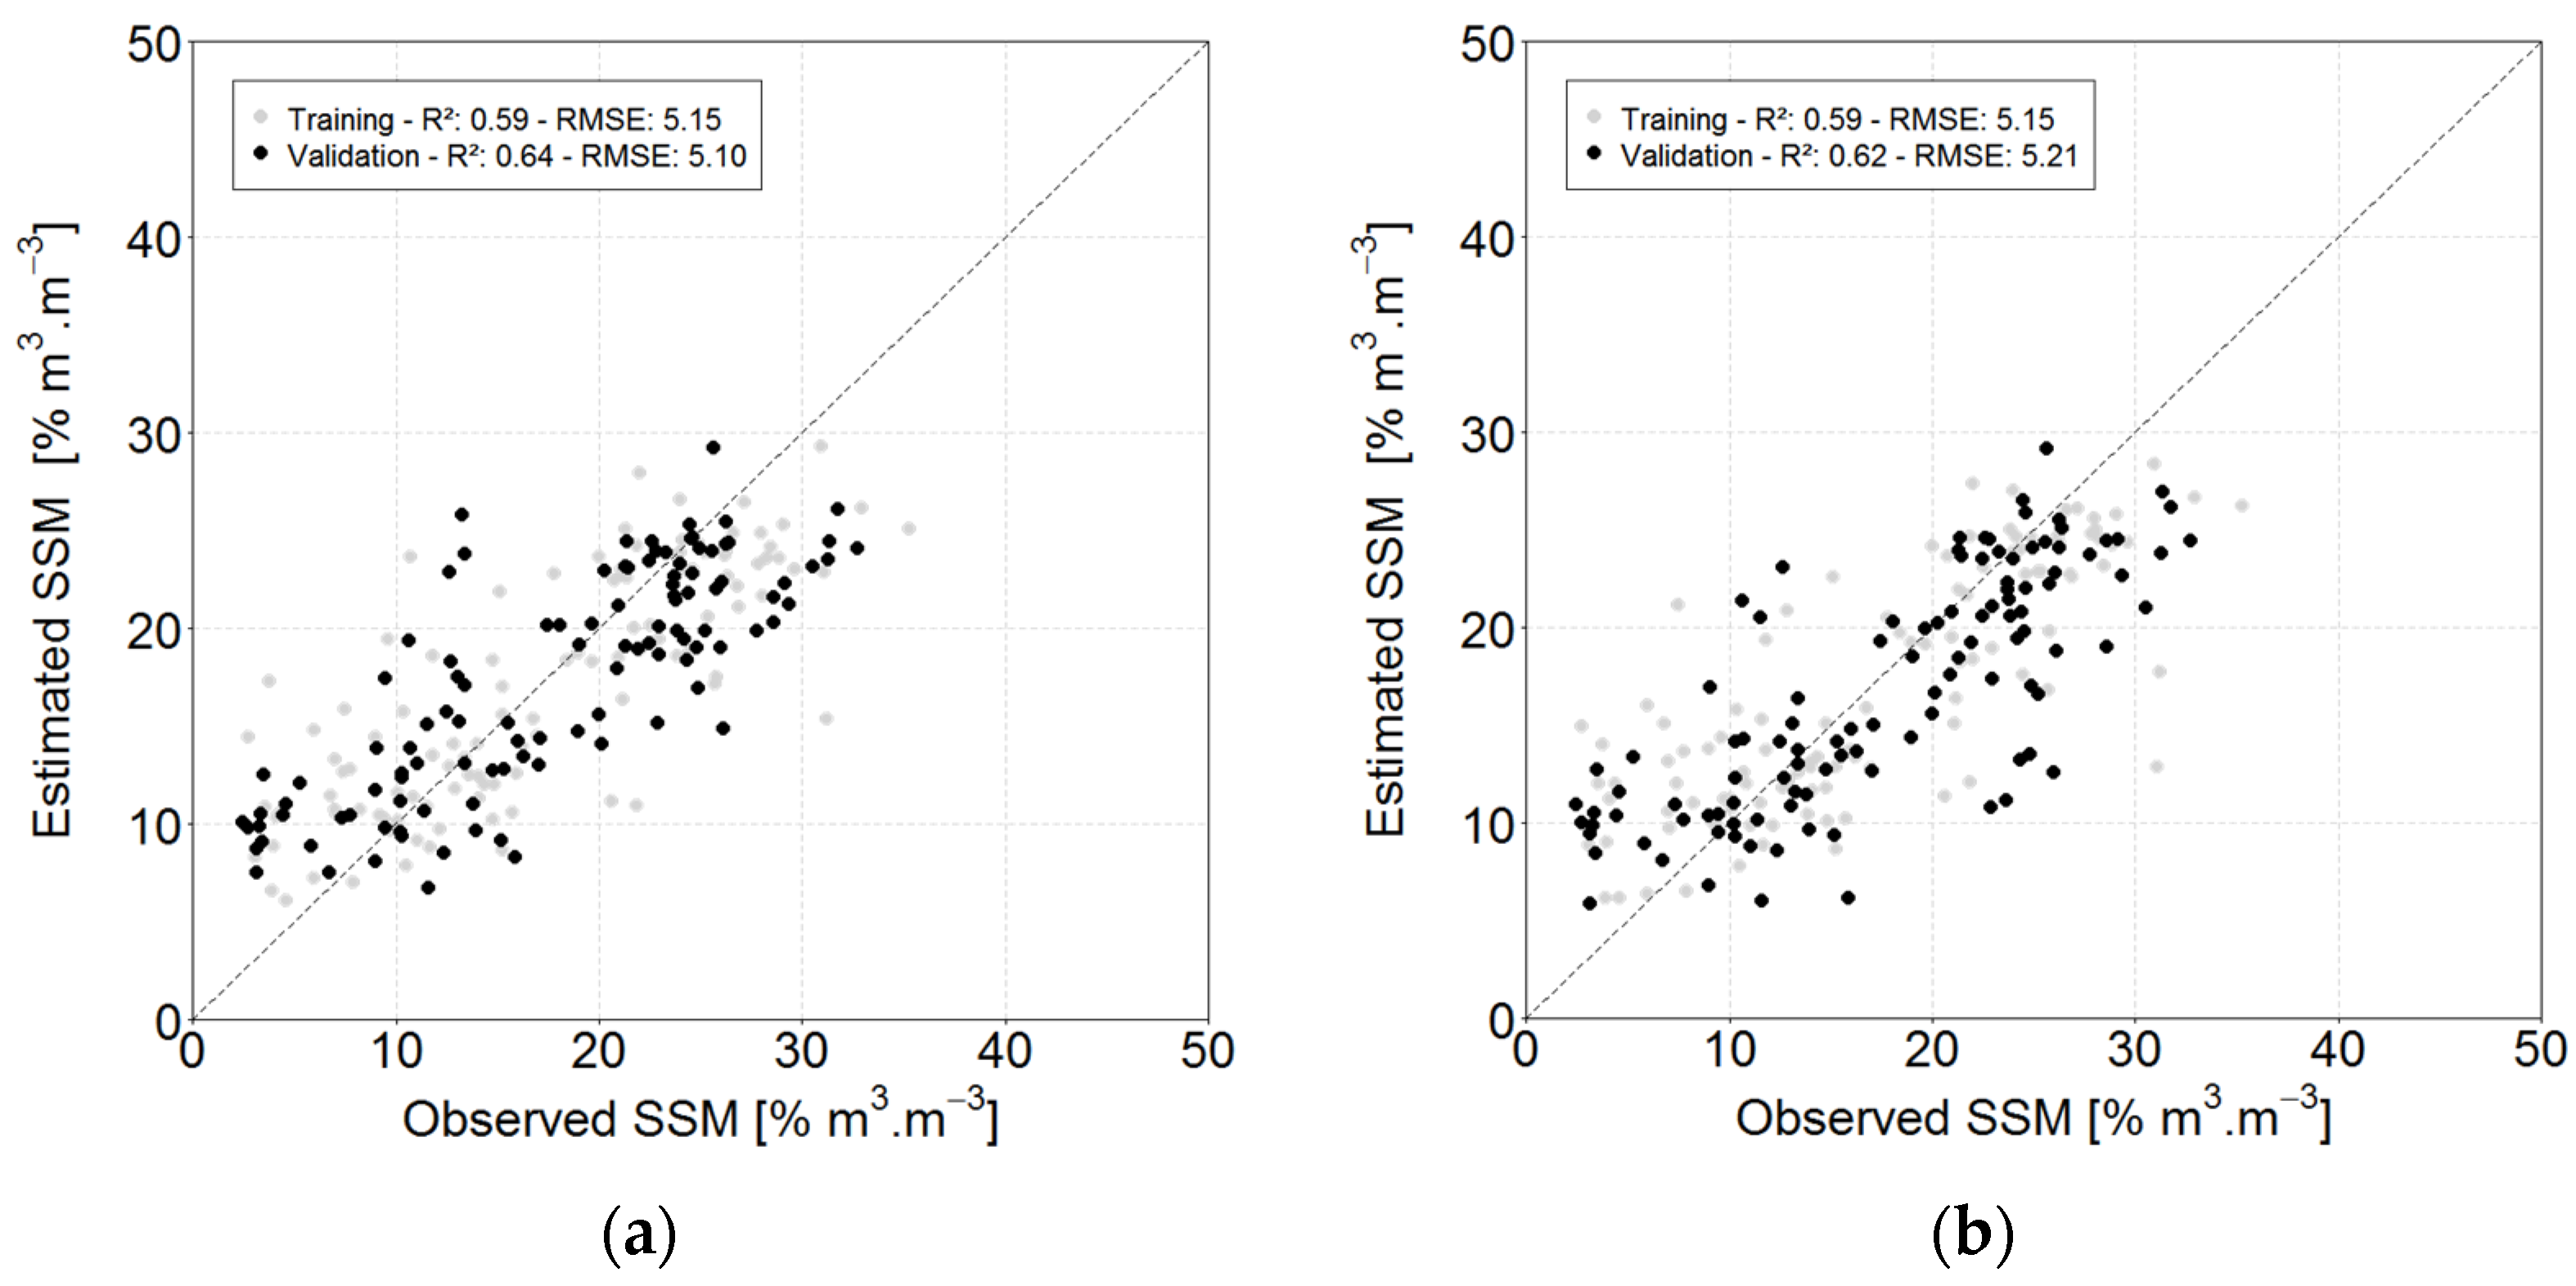
After the performance overview presented in the previous section, this section focuses on the best results. First of all, the comparison between in situ measurements of SSM and estimates based on backscatter coefficients, Figure 3 shows the independent subsets of samples used during the training and validation steps (in grey and black, respectively). In these cases, SSM estimates based on signals acquired with HH or VV co-polarization states are close (only results based on HH polarization state are presented hereinafter), with R2 and RMSE close to 0.64 and 5.10% m3·m−3, respectively. These performances are slightly higher than the values associated with cross-polarized signals (only HV presented hereinafter), with an R2 of 0.62 and an RMSE of 5.21% m3·m−3. These satellite signals have already been used to estimate SSM in previous studies [1,2,3], thus providing a useful baseline level of precision for comparing results obtained with polarimetric indicators.
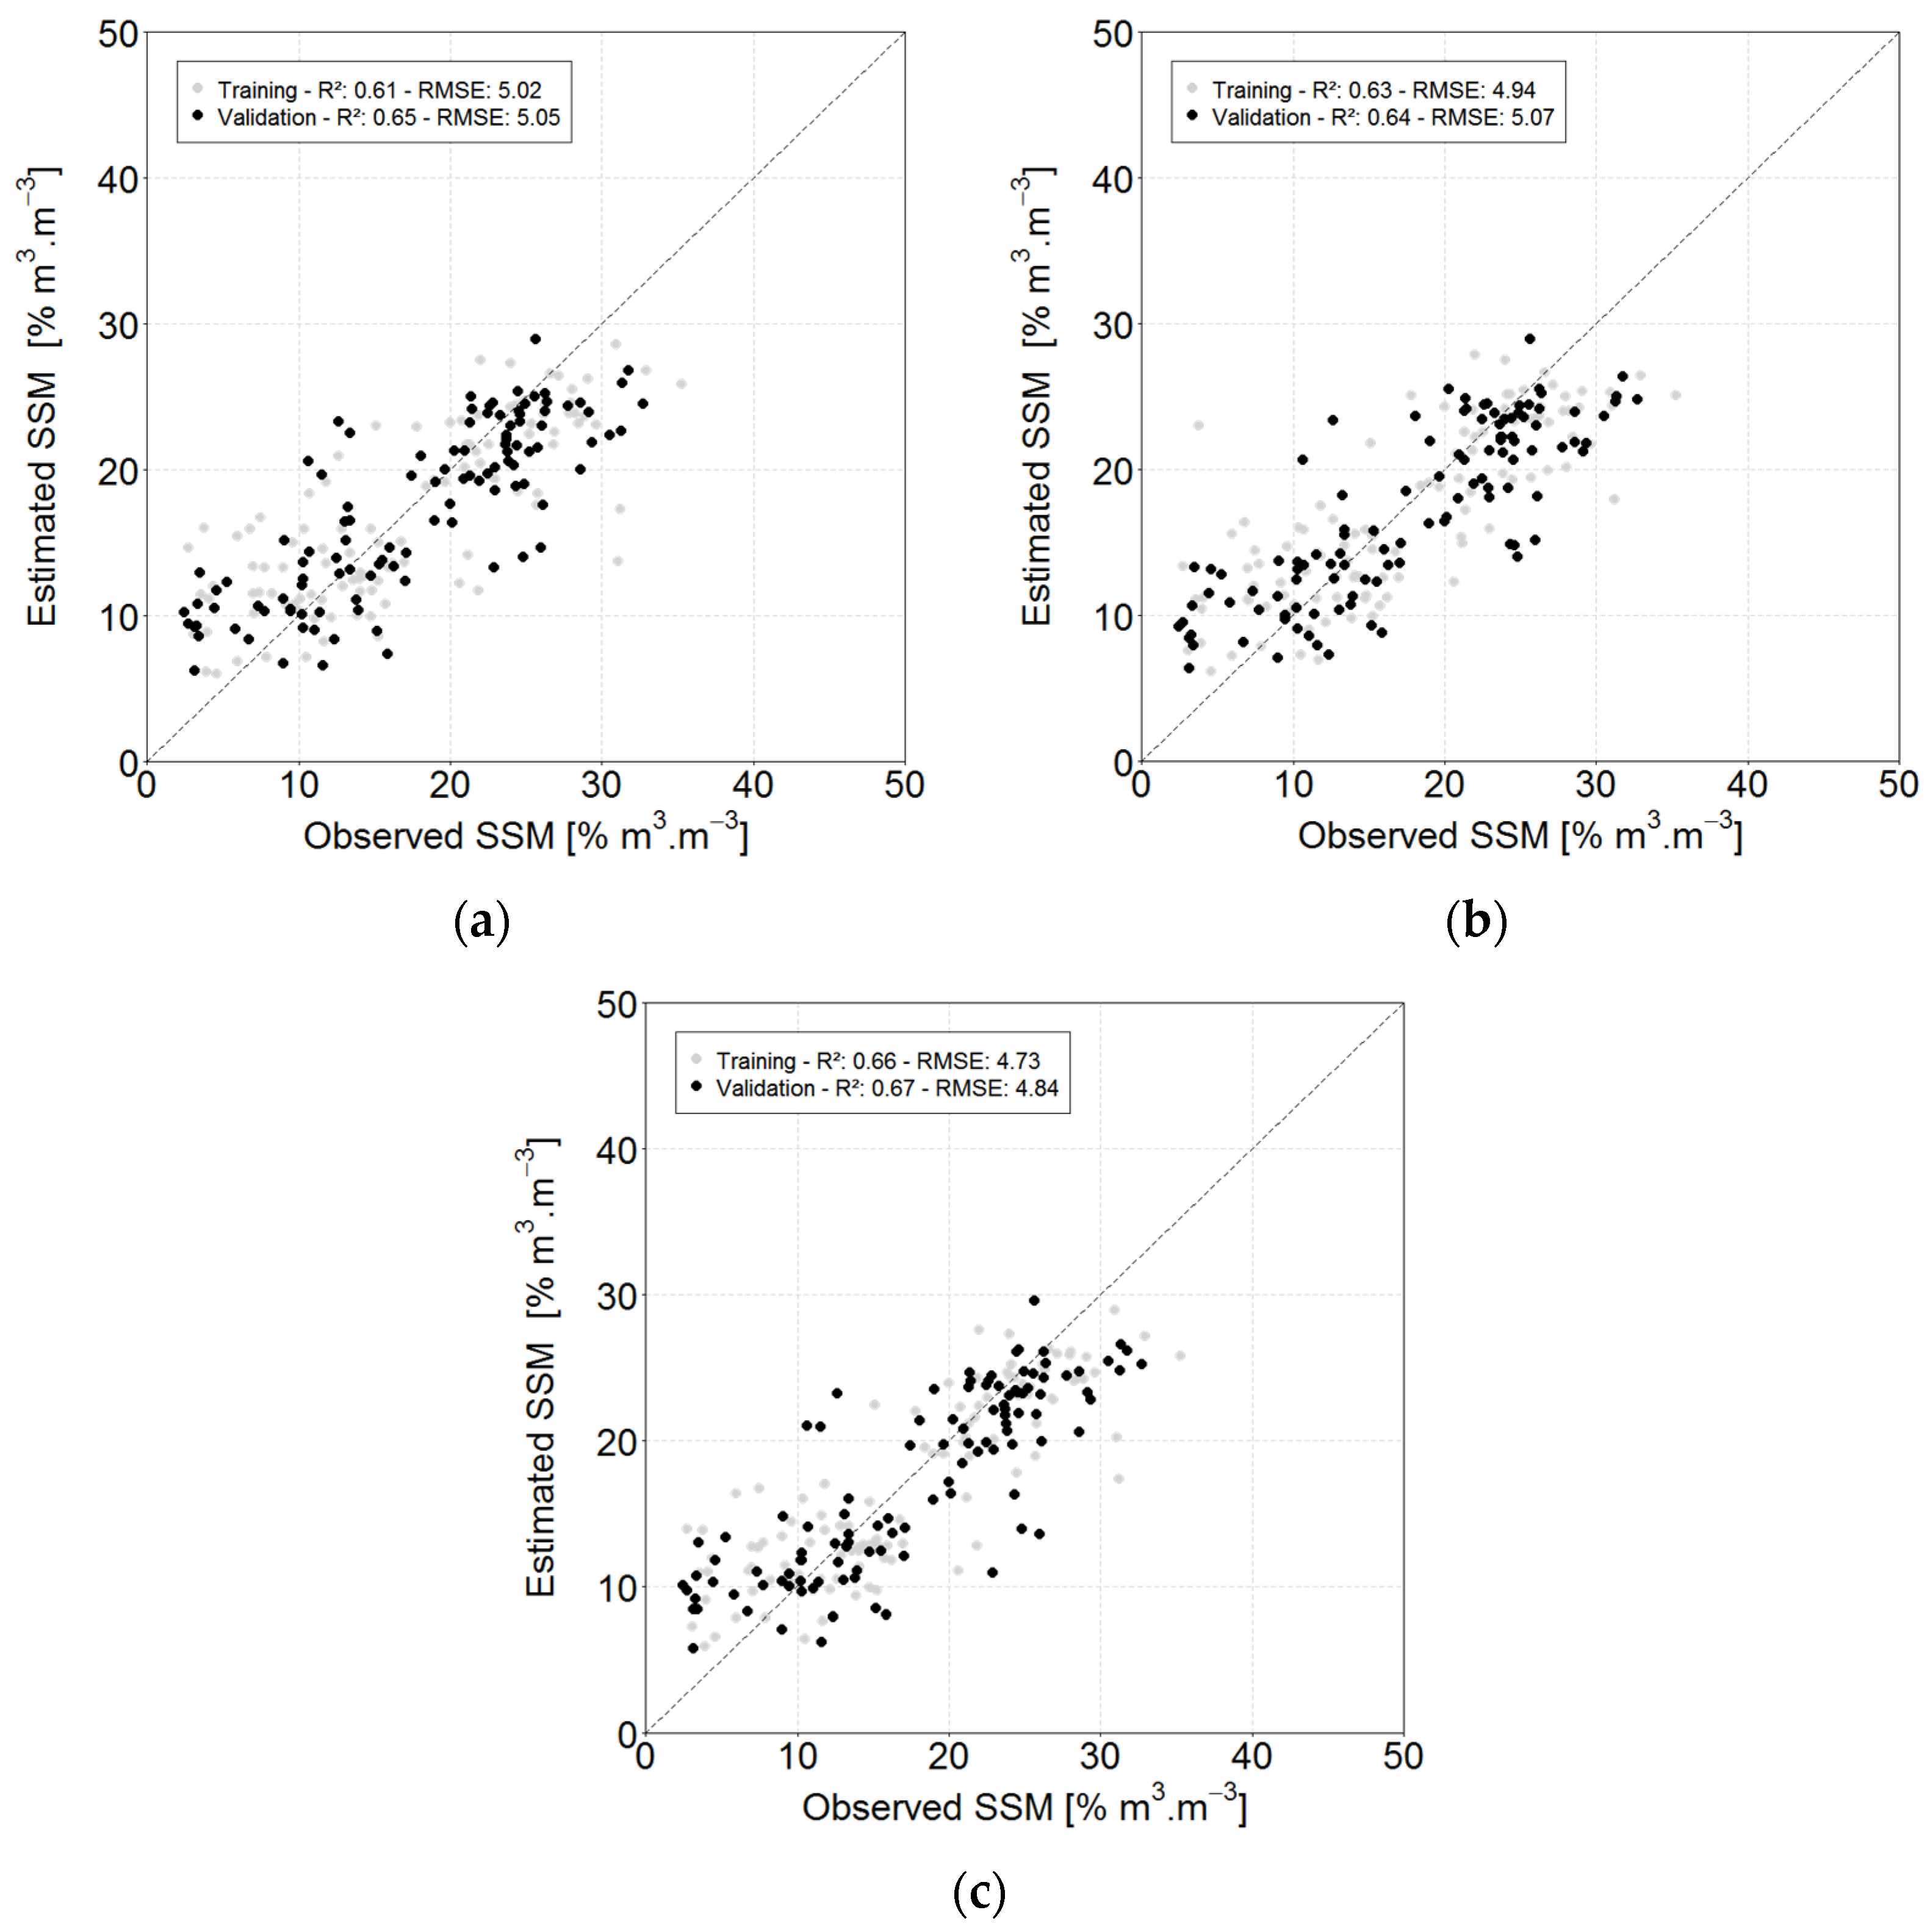
Among the tested parameters, only three cases are finally presented in Figure 4, with estimates based on the following polarimetric indicators: Shannon entropy, Freeman double-bounce and T22 (Figure 4a–c, respectively). Whatever the considered parameter, the magnitude of performance obtained with one of these signals exceeds the reference level previously established using the backscattering coefficients, with R2 greater than 0.641 and errors less than 5.07% m3·m−3. In the end, estimates based on T22 present the best performance level for the estimation of surface moisture at parcel scale based on microwave data acquired in C-band, with a correlation level of 0.671 and an error of 4.84% m3·m−3.

4. Discussion

Comparisons between measured and estimated SSM values show some dispersion, regardless of the considered radar signal. In the case of estimates based on backscattering coefficients, previous studies carried out in various contexts (i.e., on study sites with contrasting agricultural practices) and with different methods (i.e., through empirical or modelling approaches) show a wide range of performance levels [1,2,3]. The values of the statistical parameters associated with the signals acquired in co- or cross-polarization obtained here, are in the range of the best results presented in these studies with R2 varying between 0.61 and 0.84, and errors between 3.14% and 8.80% m3·m−3.
Regarding estimates based on polarimetric indices, the best results are in the same performance range as those based on backscattering coefficients. This comparison of performance over bare soil conditions is a novelty, the results obtained so far showed very limited performance of these satellite signals (with correlation levels (r) not exceeding 0.50, certainly explained by the range of variation of surface humidity values [6]) or a very low sensitivity to surface humidity [4,5]. In the end, this assessment is a necessary preliminary step for the use of these signals for the estimation of SSM during the vegetation period, the first studies having shown for the moment very limited results [7,8,9].

5. Conclusions

This study presents a comparison of the performance of a set of parameters that can be derived from radar images acquired with the four polarization states on the same study site (showing important variations of the surface parameters). The results are established on the basis of a statistical approach, implemented independently for each of the considered satellite signals, and allowing for the classification of the levels of accuracy of the polarimetric indices and backscattering coefficients. Among the best results, Shannon entropy, Freeman double-bounce, and T22 show performances equivalent or even superior to those obtained with the backscattering coefficients.
The analyses presented in this study are a first step in the perspective that would lead to propose a new approach to estimate SSM. The next step would be to determine the combination of polarimetric indices allowing a monitoring of SSM, without recourse to exogenous data, whether on the level of roughness or texture.

Author Contributions

The authors contributed equally to the various steps required to complete this study. All authors have read and agreed to the published version of the manuscript.

Institutional Review Board Statement

Not applicable.

Informed Consent Statement

Not applicable.

Data Availability Statement

The data presented in this study are available on request from the corresponding author.

Acknowledgments

Authors would like to thank especially Space Agencies for their support and confidence they have in this project (CNES, ESA, and DLR). Many thanks to farmers and people who helped for collecting ground data.

Conflicts of Interest

The authors declare no conflict of interest.

References

  1. Zribi, M.; Le Hégarat-Mascle, S.; Ottlé, C.; Kammoun, B.; Guerin, C. Surface soil moisture estimation from the synergistic use of the (multi-incidence and multi-resolution) active microwave ERS Wind Scatterometer and SAR data. Remote Sens. Environ. 2003, 86, 30–41. [Google Scholar] [CrossRef]
  2. Fieuzal, R.; Duchemin, B.; Jarlan, L.; Zribi, M.; Baup, F.; Merlin, O.; Hagolle, O.; Garatuza-Payan, J. Combined use of optical and radar satellite data for the monitoring of irrigation and soil moisture of wheat crops. Hydrol. Earth Syst. Sci. 2011, 15, 1117–1129. [Google Scholar] [CrossRef]
  3. Gherboudj, I.; Magagi, R.; Berg, A.A.; Toth, B. Soil moisture retrieval over agricultural fields from multi-polarized and multi-angular RADARSAT-2 SAR data. Remote Sens. Environ. 2011, 115, 33–43. [Google Scholar] [CrossRef]
  4. Baghdadi, N.; Cresson, R.; Pottier, E.; Aubert, M.; Zribi, M.; Jacome, A.; Benabdallah, S. A potential use for the C-band polarimetric SAR parameters to characterize the soil surface over bare agriculture fields. IEEE Trans. Geosci. Remote Sens. 2012, 50, 3844–3858. [Google Scholar] [CrossRef]
  5. Baghdadi, N.; Dubois-Fernandez, P.; Dupuis, X.; Zribi, M. Sensitivity of main polarimetric parameters of multifrequency polarimetric SAR data to soil moisture and surface roughness over bare agricultural soils. IEEE Geosci. Remote Sens. Lett. 2013, 10, 731–735. [Google Scholar] [CrossRef]
  6. Yang, L.; Feng, X.; Liu, F.; Liu, J.; Sun, X. Potential of soil moisture estimation using C-band polarimetric SAR data in arid regions. Int. J. Remote Sens. 2019, 40, 2138–2150. [Google Scholar] [CrossRef]
  7. Hajnsek, I.; Jagdhuber, T.; Schon, H.; Papathanassiou, K.P. Potential of estimating soil moisture under vegetation cover by means of PolSAR. IEEE Trans. Geosci. Remote Sens. 2009, 47, 442–454. [Google Scholar] [CrossRef]
  8. Wang, H.; Magagi, R.; Goita, K.; Jagdhuber, T.; Hajnsek, I. Evaluation of simplified polarimetric decomposition for soil moisture retrieval over vegetated agricultural fields. Remote Sens. 2016, 8, 142. [Google Scholar] [CrossRef]
  9. Wang, H.; Magagi, R.; Goita, K. Comparison of different polarimetric decompositions for soil moisture retrieval over vegetation covered agricultural area. Remote Sens. Environ. 2017, 199, 120–136. [Google Scholar] [CrossRef]
  10. Baup, F.; Fieuzal, R.; Marais-Sicre, C.; Dejoux, J.-F.; le Dantec, V.; Mordelet, P.; Claverie, M.; Hagolle, O.; Lopes, A.; Keravec, P.; et al. MCM’10: An experiment for satellite multi-sensors crop monitoring from high to low resolution observations. In Proceedings of the 2012 IEEE International Geoscience and Remote Sensing Symposium, Munich, Germany, 22–27 July 2012; pp. 4849–4852. [Google Scholar]
  11. Morena, L.C.; James, K.V.; Beck, J. An introduction to the RADARSAT-2 mission. Can. J. Remote Sens. 2004, 30, 221–234. [Google Scholar] [CrossRef]
  12. Pottier, E.; Ferro-Famil, L. PolSARPro V5.0: An ESA educational toolbox used for self-education in the field of POLSAR and POL-INSAR data analysis. In Proceedings of the 2012 IEEE International Geoscience and Remote Sensing Symposium, Munich, Germany, 22–27 July 2012; pp. 7377–7380. [Google Scholar]
  13. Breiman, L. Random Forests. Mach. Learn. 2001, 45, 5–32. [Google Scholar] [CrossRef]
  14. Ulaby, F.T.; Batlivala, P.P.; Dobson, M.C. Microwave backscatter dependence on surface roughness, soil moisture, and soil texture: Part I-Bare Soil. IEEE Trans. Geosci. Electron. 1978, 16, 286–295. [Google Scholar] [CrossRef]
  15. Hallikainen, M.T.; Ulaby, F.T.; Dobson, M.C.; El-Rayes, M.A.; Lil-Kun, W. Microwave dielectric behavior of wet soil—Part 1: Empirical models and experimental observations. IEEE Trans. Geosci. Remote Sens. 1985, 23, 25–34. [Google Scholar] [CrossRef]
  16. Fieuzal, R.; Baup, F. Improvement of bare soil semiempirical radar backscattering models (Oh and Dubois) with SAR multi-spectral satellite data (at X, C and L bands). Adv. Remote Sens. 2016, 5, 296–314. [Google Scholar] [CrossRef]
  17. Fieuzal, R.; Baup, F. Statistical estimation of backscattering coefficients in X-band over bare agricultural aoils. In Proceedings of the 2020 Mediterranean and Middle-East Geoscience and Remote Sensing Symposium (M2GARSS), Tunis, Tunisia, 9–11 March 2020; pp. 302–305. [Google Scholar]
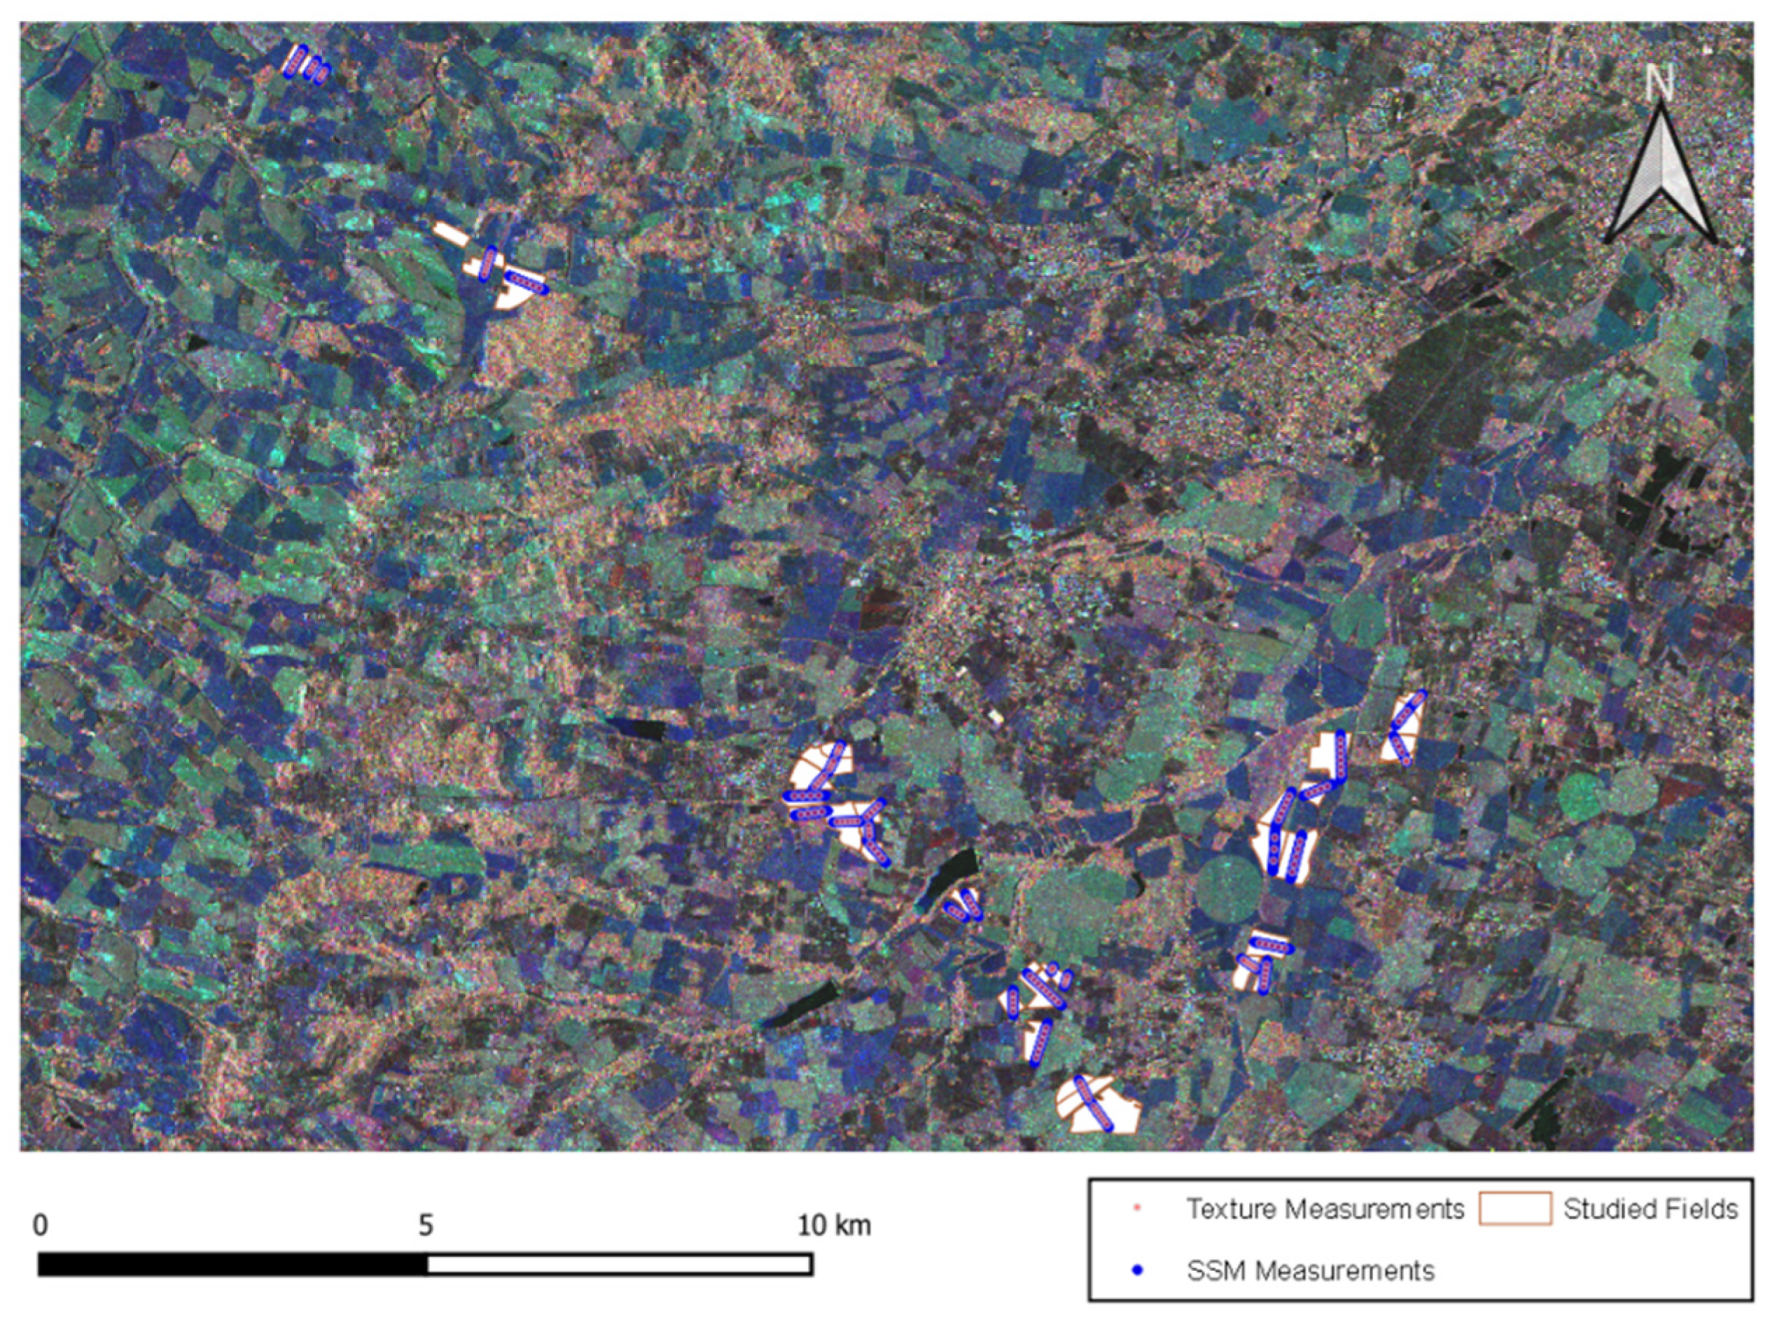
Figure 1. Location of the study site in southwestern France. The network of the surveyed fields is highlighted in white and superimposed on a color-composed Radarsat-2 image acquired on 04/15/2010 (polarizations VH, VV, and HH are presented in red, green, and blue, respectively).
Environsciproc 05 00022 g001
Figure 2. Summary of the statistical performances (coefficients of correlation and root mean square errors, bars, and dots respectively) for the parameters derived from the Radarsat-2 images, for the training (grey) or validation (black) subsets of samples.
Environsciproc 05 00022 g002
Figure 3. Comparison between the values of observed and estimated surface soil moisture, using the backscattering coefficients acquired in the C-band with polarization states HH (a) and HV (b). The grey and black dots represent the estimations performed considering the training or validation subsets of samples, respectively.
Environsciproc 05 00022 g003
Figure 4. Comparison between the values of observed and estimated surface soil moisture, using the following polarimetric indicators: Shannon entropy (a), Freeman double-bounce (b) and T22 (c) derived from Radarsat-2 images. The grey or black colors represent the estimations performed considering the training or validation subsets of samples, respectively.
Environsciproc 05 00022 g004
Table 1. Mean features of the Radarsat-2 acquisitions.
ModeAcquisition Date (MM/DD)PassIncidencePixel
AngleSize
(°)(m)
FQ503/05; 11/24A23.3–25.34.7 × 4.9
FQ610/21; 11/14D24.6–26.54.7 × 4.7
FQ1002/26; 04/15; 05/09; 09/30A29.1–30.94.7 × 5.1
FQ1103/26; 08/17D30.2–32.04.7 × 5.5
FQ1503/15; 04/08; 05/02; 08/30; 10/17A34.3–36.04.7 × 4.8
FQ1605/20; 07/31; 10/11D35.4–37.04.7 × 5.1
FQ2011/03A39.1–40.74.7 × 4.8
FQ2102/20; 03/16; 07/14D40.1–41.64.7 × 5.1
Publisher’s Note: MDPI stays neutral with regard to jurisdictional claims in published maps and institutional affiliations.