Proceeding Paper

Spatiotemporal Distribution of Soil Moisture Content over Ukraine and Its Relationship to Atmospheric Conditions †

Department of Military Training, Odessa State Environmental University, 15 Lvovskaya str., 65122 Odessa, Ukraine
Presented at the 3rd International Electronic Conference on Atmospheric Sciences, 16–30 November 2020; Available online: https://ecas2020.sciforum.net/.
Environ. Sci. Proc. 2021, 4(1), 20; https://doi.org/10.3390/ecas2020-08117
Published: 13 April 2021
(This article belongs to the Proceedings of The 3rd International Electronic Conference on Atmospheric Sciences)

Abstract

:
Spatiotemporal distribution of the soil moisture content of 0–10 cm underground has been assessed across the aroclimatic zones of Ukraine for the period 2000–2019. Calculated Soil Moisture Anomaly Index (SMAI) was used to characterize the degree of saturation of the soil, comparing to normal conditions. The North Atlantic Oscillation index (NAO) and the European Continental Blocking Index (ECBI) were used for the estimation of the influence of atmospheric circulation on soil moisture content in different seasons. The clear annual soil moisture content course is observed in all agroclimatic zones of Ukraine, when the maximum is observed in February, and the minimum is in August. The lowest soil moisture values are fixed in the Western Steppe and the maximum in the Carpathian region and Polesie. The analysis of time series of the SMAI showed the tendency to transition from mostly positive values to negative values in the past decade in summer and autumn. In winter and spring, no significant trends were found in the SMAI values. Analysis of the statistical relationship between the SMAI and the NAO indices, and the SMAI and the ECBI indices showed the features of the state of zonal flow and determined certain anomalies of soil moisture content.

1. Introduction

Ukraine has an rich reserve of fertile soil, so it can be one of the European leaders in the production of high-quality, environmentally friendly food. Soil is one of the main natural means of food production. Soil moisture and temperature are the main physical properties of soils that determine their fertility. Soil moisture affects the solubility, movement, and effectiveness of organic and mineral fertilizers, the degree of soil contamination by pesticides and other products of technogenic origin, and how many agricultural plants absorb chemicals harmful to human health.
Soil moisture deficit is one of the main factors in agricultural production limiting the yield and leading to negative changes in product quality. When analyzing the water regime of the soil, two main points are considered: (1) dynamics of productive moisture in a meter layer of soil; (2) distribution of moisture content in the soil profile. Soil wetness does not have a pronounced course. Evaporation and transpiration responsible for the rate of extraction of water from the soil during the drying are subjected to daily fluctuations. However, these fluctuations have a little effect on the full balance. Soil moisture content increase quite quickly during precipitation or irrigation, and slowly decrease between periods of the precipitation or/and irrigation [1]. This decrease is partially due to the gravitational flow of water, but mostly due to transpiration and surface evaporation. Depending on the balance of precipitation and transpiration, fluctuations in soil wetness are characterized by quite long periods (decade, month).
The soil moisture status regulates an initiation of drought and its progression while the deficit soil moisture is a good indicator of agriculture drought and intensity. Agricultural drought (also named as soil drought) is characterized by a lack of soil moisture, leading to plant stress, a decrease in bio-productivity and yield. The plant’s water needs are determined by weather conditions, biological characteristics of the plant species, the stage of its growth and development, as well as the physical and biological properties of soils. Moisture deficit in the topsoil during sowing can impede the germination of seeds, leading to decrease in seedlings and a reduction in yield.
The onset of agricultural drought over time can vary significantly from the onset of meteorological drought depending on the available moisture reserves. The occurrence of droughts is facilitated by the influence of additional factors preventing the accumulation of moisture reserves in the soil: in winter it is a lack of snow, in early spring it is unfavorable conditions for the absorption of melt water, in summer it is intense evaporation under the influence of strong and hot winds known as Sukhovei [2,3]. Drought intensifies when high atmospheric temperature concurrently prevails with low soil moisture conditions.
In generally, soil drought is caused by two main factors: very low soil moisture content and very low air humidity, which is caused by specific atmospheric circulation conditions as the stationary or blocking anticyclones [4]. The combination of soil and atmospheric drought leads to the so-called general drought, when the soil moisture is extremely low and the moisture deficit in the air is extremely high. As shown in [5], soil drought has an effect on the atmosphere, causing air humidity to drop dramatically. Therefore, in the region, with less and less rain fall every year, the soil moisture content also decreases. This leads to a high probability of simultaneous occurrence of drought in the atmosphere and soil.
The aim of the study is to investigate the spatiotemporal distribution of the soil moisture content in the layer 0–10 cm underground in different agroclimatic areas of Ukraine during 2000–2019 and to estimate a relationship between soil moisture anomalies and the atmospheric processes in different seasons using the blocking index and NAO index.

2. Materials and Methods

Spatiotemporal distribution of soil moisture has been assessed using time series of the monthly area-averaged soil moisture content (W) of 0–10 cm underground, generated by NASA GLDAS_NOAH025_M model [6] for period 2000–2019. Five main agroclimatic zones in Ukraine were investigated: Western Steppe and Eastern Steppe, Forest-Steppe, Polesie (or Mixed Forest), and Carpathian region (Figure 1).
Soil Moisture Anomaly Index (SMAI) values were calculated for each of the five selected agricultural regions using the equation [7]:
S M A I = W W ¯ σ W
where W is the long-term (2000–2019) average soil moisture content and σW its standard deviation.
As a dynamic indicator for state of the zonal flow related to blocking processes, the regional European Continental Blocking Index (ECBI) was used [8], which is determined by a ratio of the current (pt) and climatic (cl) pentad values of zonal wind component (u) at the level 300 mb. Zonal wind averaged over the region restricted by coordinates 10–60 E and 40–60 N:
  E C B I = 1 u ¯ p t u ¯ c l
The ECBI was calculated using NCEP-NCAR reanalysis data [9]. The time interval of 1980–2010 was taken as the basic period. Positive values of the ECBI indicate the blocking of zonal flow, the negative ones correspond to enhancing of zonal wind. Values of the ECBI close to 1 specify the extreme cases.
Time series of the monthly North Atlantic Oscillation index (NAO) was obtained from web-service of NOAA Climate Prediction Centre [10]. The statistical relationship between considered parameters was tested using Pearson’s correlation coefficient and significance of the correlation coefficients was evaluated using the F-test.

3. Results

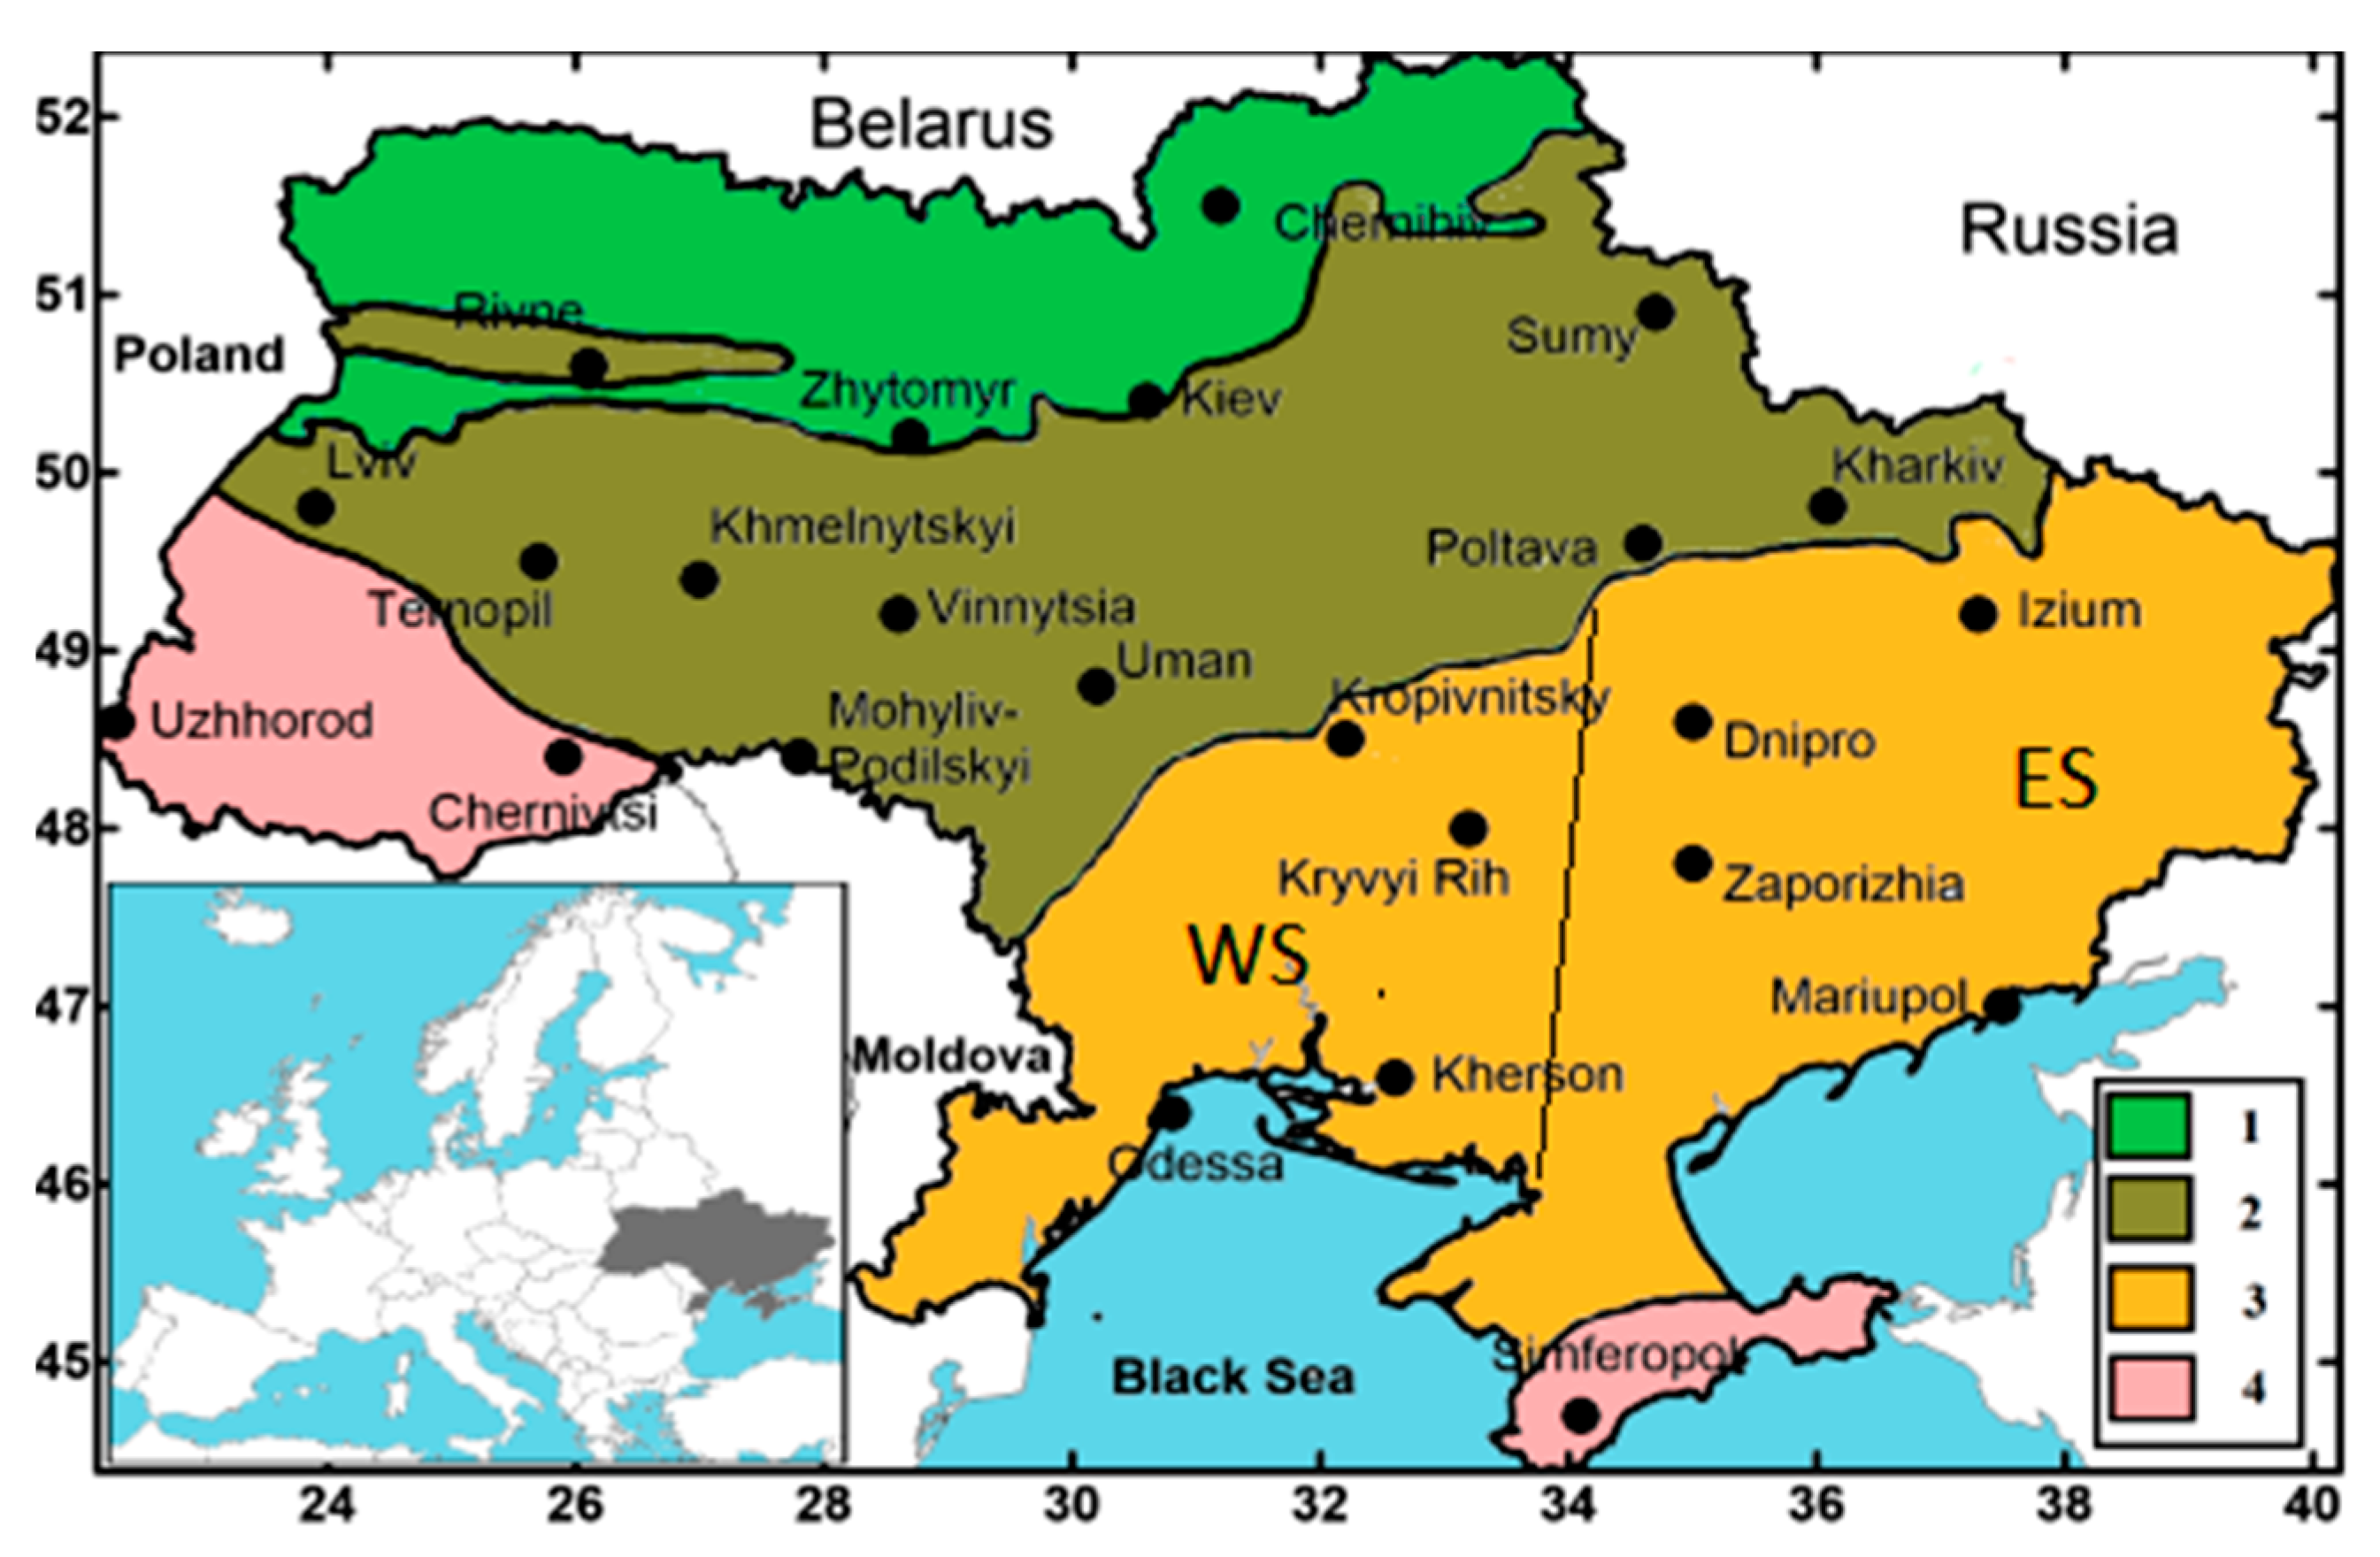
3.1. Spatial Distribution of Soil Moisture Content

The average monthly distribution of soil moisture content in the layer of 0–10 cm underground has the following features (Table 1). A clear annual course of W is observed in all agroclimatic zones with the maximum in February and the minimum in August. In general, the lowest average values of soil moisture content during the year are observed in the Western Steppe (15–31 kg/m2), and the maximum values are in the Carpathian region (24–38 kg/m2). In all zones, the intensive increase of soil moisture content starting from November, when W increases by 4–5 kg/m2 per month to the maximum in February. In the spring months starting from March, the soil moisture content decreases by an average of 2–3 kg/m2 per month until the onset of minimum values in late summer.
The spatial distribution of soil moisture content has a zonal pattern in Ukraine in winter and spring months. The maximum values of W in January and April are concentrated in the north-eastern regions of Ukraine as well as in the Carpathian region. In these areas in January the soil moisture content exceeds 40 kg/m2, and in April it decreases to 28–34 kg/m2. The lowest values of soil moisture in January are in the southern regions, where they range from 15–29 kg/m2. In April, the field of soil moisture content becomes quite homogeneous throughout the country compared to winter months, with a general decrease in soil moisture content.
In summer and autumn, the spatial distribution of soil moisture content throughout the country loses zonation. The highest values of moisture content are observed in the western regions and north-west of the country. Soil moisture content in these areas ranges from 21–30 kg/m2. The central, eastern, and southern regions are in relatively homogeneous conditions with lower soil moisture content comparing to the western regions. The lowest W values were observed in the Black Sea Steppe, where soil moisture content does not exceed 17–18 kg/m2. From summer to autumn W increases 1.0–1.5 kg/m2 across the country, and that in autumn the horizontal gradients of W decrease compared to summer, and then increase again in winter.

3.2. Time Course of the SMAI

The time series of SMAI were analyzed to assess the dynamics of soil moisture anomalies during the study period 2000–2019 in agroclimatic zones of Ukraine. Figure 2a–d demonstrates the time series of the SMAI index for the central months of the seasons, but we will describe the features of all months.
During the winter, the SMAI had significant year-on-year fluctuations in all agroclimatic zones, without any tendency predominantly of a certain anomaly (positive or negative). In December, increased soil moisture content was observed almost every two years, with the largest positive anomalies in the Steppe, Polesie, and the Carpathian region. December 2004, 2005, and 2010 were the wettest. For all zones prolonged lack of soil moisture was observed in December 2011–2015 as well as in 2006 and 2019. In January, the time course of the SMAI index is varied in zones both in time and in the amplitude of index fluctuations. In almost all zones, positive anomalies were fixed in January 2002–2004 and 2010–2013. In January 2005–2009 the dry conditions prevailed. From 2013 to 2018 in January the SMAI index had frequent fluctuations, and that in the Steppe areas positive anomalies were dominated, and in other regions the negative ones. In general, a significant deficit of soil moisture content was observed throughout the country in the winter of 2007–2009. In January-February, moisture deficits were formed in most regions in 2015, 2016, and 2018.
In March, the time series of the SMAI is quite homogeneous between agroclimatic zones, which indicates the spatial homogeneity of humidification conditions in this month. Long periods of high soil moisture were observed in March 2003–2006 and 2010–2013. Insufficient soil moisture content was formed in March 2007–2009, 2014–2017. In general, in the last decade there was a tendency of predominance of negative anomalies of soil moisture content in March. In April, there were generally small year-on-year fluctuations of the SMAI index relative to the neutral state [−1; +1] in all agroclimatic zones. There were two dry periods in April 2007 and 2009, and a period of high soil moisture content in April 2013 in all zones except the Steppe. In May, the time course of the SMAI index showed sharp interannual fluctuations, with prevailing of periods with positive values, especially in the second half of the study period, so, there is a tendency to increase soil moisture content in late spring. The strong deficit of soil moisture was observed in all agroclimatic zones in May 2000, 2002–2003, 2007, 2018.
During the summer, in all months there was a tendency to decrease the interannual variation of the SMAI index and the transition to a predominance of negative values in the late summer. In June, the largest deficits of soil moisture were observed in 2000, 2003, 2007. In 2012–2013 in the Steppe and Forest-Steppe there was a deficit of soil moisture, and in Polesie and the Carpathians, on the contrary, there was a comparable positive anomaly. From 2015 to 2019 (except 2016), negative values of the SMAI index were observed in almost all regions. In July, negative anomalies of soil moisture content were observed in all zones in 2002, 2007, and 2012–2017. At the same time, from the beginning of the study period until 2012, months with positive anomalies prevailed. In August, the interannual distribution of the SMAI index is most homogeneous compared to other summer months. In the period from 2001 to 2006, positive anomalies of soil moisture content prevailed in almost all zones. After 2007, mostly neutral soil moisture conditions were observed, and August 2015 was the driest.
In the autumn months, the time course of the SMAI index had a general tendency from mostly positive values in the first half of the study period to neutral or negative values in the second half. In September, there were sharp interannual fluctuations in the SMAI index with an interval of 1–2 years in almost all areas from positive to negative anomalies. The wettest months were in September 2001, 2004, 2010, and 2013. The dry period with predominant negative anomalies in September was observed from 2014 to 2019. In October 2001–2004, the largest positive anomalies of soil moisture content were observed. During 2005–2012, the time course of the SMAI index fluctuations was around the neutral state. At the end of the period, the frequency of negative anomalies of soil moisture increased, and driest October was observed in 2014–2015 and 2018–2019. In November, in the period 2001–2010 positive SMAI anomalies prevailed with a gradual decrease in the amplitude. In 2011, the largest negative anomaly of soil moisture content was observed in all zones, which coincided with the intense atmospheric autumn drought 2011 in Ukraine [11]. Large negative anomalies of the SMAI index were also recorded in different zones in November 2000, 2014, 2018–2019.

3.3. Relationship of the SMAI with Parameters of the Atmospheric Circulation

Analysis of the correlation coefficients (r) between the average monthly values of the SMAI index and the NAO index showed that in general, the statistical relationship between these parameters is weak, but in some months the relationship between the two processes increases. For all regions except the Eastern Steppe, significant correlation coefficients (on significance level α = 0.05) are observed in March and May, and range from −0.45 in the Western Steppe to −0.77 in the Carpathians. In this case, the statistical relationship is inverse, i.e., when the positive phase of NAO increases, the soil moisture content decreases. With the weakening of zonal flow (negative phase of NAO), soil moisture content increases. This feature is due to the fact that during the positive phase of NAO, intensive cyclonic activity develops in the northern parts of Europe, where there is an increased amount of precipitation [12]. In the southern regions of Europe, on the contrary, anticyclonic circulation with a deficit of precipitation is prevailed. Under the negative NAO phase, when the zonal flow is weakened over the continent, the meridional circulation intensity is increased, which may lead to the transport of warm and moist air masses from the Mediterranean to Eastern Europe.
During the study period in March the positive phase of NAO prevailed (60%), which contributed to the reduction of soil moisture content in early spring. In May, both phases of NAO had almost the same frequency, which indicates an increased variability of atmospheric processes during the restructuring of the atmospheric circulation to the summer regime. In the Western Steppe, the significant correlation between NAO and SMAI also was found in December, and in the Forest-Steppe in October (both r = −0.45). In December, the positive phase of NAO prevailed during the study period, and in October, as in May, both phases appeared of equal frequency. In summer, a positive statistical relationship between the parameters is observed only in July, but it is insignificant in all areas.
Analysis of the correlation coefficients between the SMAI index and the ECBI showed that in July there is a positive correlation between the parameters, i.e., an increase in meridionality (ECBI > 0) leads to an increase in soil moisture content, which obviously associated with the formation of cut-of-lows or upper deep troughs over the territory of Eastern Europe, which often provide active convection and precipitation in summer [13]. Intensification of the zonal flow (ECBI < 0), which in summer is usually accompanied by the spread of high pressure ridges from the west, on the contrary leads to negative anomalies of soil moisture content. In the autumn months, negative significant correlation coefficients predominate, with the highest values in October and November in most agroclimatic zones (r = −0.69 ...−0.49). That is, the blocking processes, associated in this period in Eastern Europe with the establishment of anticyclonic circulation, lead to a decrease in soil moisture due to the lack of precipitation. In the winter and spring months, the correlation, in general, is weak and heterogeneous in agroclimatic zones. But in January in Polesie a significant positive correlation (r = 0.46) is observed, so for this zone a positive contribution to the increase in soil moisture gives the intensification of zonal flow, accompanied by cyclonic activity in the northern part of the temperate zone.

4. Conclusions

Analysis of soil moisture content in a layer of 0–10 cm underground across the territory of Ukraine for the period 2000–2019 showed that this parameter has a clear annual course with a maximum in February and a minimum in August for all agroclimatic zones. The highest average annual moisture content is observed in Polesie and the Carpathian region, the smallest in the Western Steppe. Analysis of time series of the index of soil moisture anomalies showed that for all agroclimatic zones in winter there were no pronounced trends in the index values. During the spring months a tendency of a decrease in soil moisture content in March and an increase in May was found. In summer and autumn an increase of the repeatability of months with negative soil moisture anomalies after 2011–2012 was observed, which indicates an increase in the number of episodes of agricultural droughts in warm season during the past decade. Large-scale atmospheric circulation contributes to the formation of soil moisture anomalies. Negative anomalies of soil moisture content are formed in most regions of Ukraine under the influence of positive phase of the NAO, and that the influence of the NAO practically does not spread in the Eastern Steppe most distant from the Atlantic Ocean. Blocking processes in the atmosphere of Europe are accompanied by the formation of positive soil moisture anomalies in all agroclimatic zones of Ukraine in summer and autumn, in other seasons the impact of blocking is not significant.

References

  1. Hillel, D. Introduction to Environmental Soil Physics; Academic Press: Cambridge, MA, USA, 2003; pp. 259–282. [Google Scholar] [CrossRef]
  2. Buchinskij, I.E. Droughts and Dry Winds; Gidrometeoizdat: St. Petersburg, Russia, 1976; p. 214. [Google Scholar]
  3. Semenova, I.; Slizhe, M. Synoptic conditions of droughts and dry winds in the Black sea Steppe province under recent decades. Front. Earth Sci. 2020, 8, 69. [Google Scholar] [CrossRef]
  4. Cherenkova, E.A.; Semenova, I.G.; Kononova, N.K.; Titkova, T.B. Droughts and dynamics of synoptic processes in the south of the East European Plain at the beginning of the twenty-first century. Arid Ecosyst. 2015, 5, 45–56. [Google Scholar] [CrossRef]
  5. Zhou, S.; Williams, A.P.; Berg, A.M.; Cook, B.I.; Zhang, Y.; Hagemann, S.; Lorenz, R.; Seneviratne, S.I.; Gentine, P. Land–atmosphere feedbacks exacerbate concurrent soil drought and atmospheric aridity. Proc. Natl. Acad. Sci. USA 2019, 116, 18848–18853. [Google Scholar] [CrossRef] [PubMed]
  6. Giovanni Online Data System. Available online: https://giovanni.gsfc.nasa.gov/giovanni (accessed on 8 May 2020).
  7. del Pilar Jiménez-Donaire, M.; Tarquis, A.; Giráldez, J.V. Evaluation of a combined drought indicator and its predictive potential for agricultural droughts in Southern Spain. Nat. Hazards Earth Syst. Sci. Discuss 2019. under review. [Google Scholar] [CrossRef]
  8. Semenova, I.G. Regional atmospheric blocking in the drought periods in Ukraine. J. Earth Sci. Eng. 2013, 3, 341–348. [Google Scholar]
  9. NCEP/NCAR Reanalysis 1. Available online: https://psl.noaa.gov/data/gridded/data.ncep.reanalysis.html (accessed on 10 October 2019).
  10. NOAA Climate Prediction Centre. North Atlantic Oscillation (NAO). Available online: https://www.cpc.ncep.noaa.gov/products/precip/CWlink/pna/nao.shtml (accessed on 25 May 2020).
  11. Semenova, I.G. Meteorological and synoptic conditions of drought in Ukraine in autumn 2011. Ukrainian Hydrometeorol. J. 2012, 10, 58–64. [Google Scholar]
  12. Hurrell, J.W.; Kushnir, Y.; Visbeck, M.; Ottersen, G. An overview of the North Atlantic Oscillation. The North Atlantic Oscillation: Climate Significance and Environmental Impact. Am. Geophys. Union Monograph. 2003, 134, 1–35. [Google Scholar]
  13. Semenova, I.G.; Nazmudinova, O.M. Regional Synoptic Processes; TES: Odessa, Ukraine, 2019; p. 212. [Google Scholar]
Figure 1. A map of schematic location of the main agroclimatic zones of Ukraine: 1—Polesie; 2—Forest-Steppe; 3—Steppe; 4—Carpathian and Crimea mountains regions. Thin line divides schematically the Steppe on Western (WS) and Eastern (ES).
Environsciproc 04 00020 g001
Figure 2. Time course of the SMAI in different agroclimatic zones of Ukraine in central months of seasons in period 2000–2019: (a)—January; (b)—April; (c)—July; (d)—October.
Environsciproc 04 00020 g002
Table 1. Average monthly soil moisture content (kg/m2) in the layer 0–10 cm underground for the period 2000–2019.
MonthWestern SteppeEastern SteppeForest-SteppePolesieCarpathian RegionUkraine Average
January30.733.335.936.536.834.8
February31.134.038.238.938.336.5
March27.931.134.434.534.332.9
April24.926.927.927.228.227.1
May22.024.025.926.327.425.0
June19.821.123.624.826.622.9
July17.918.221.524.025.621.0
August15.315.418.421.824.218.3
September16.917.519.321.724.119.3
October19.420.021.823.725.321.6
November21.622.824.826.227.224.3
December25.027.229.831.031.229.0
Area average22.724.326.828.129.126.1
Publisher’s Note: MDPI stays neutral with regard to jurisdictional claims in published maps and institutional affiliations.

