Next Article in Journal
Remote Sensing Biological Pump Potential: Plankton Spatio-Temporal Modelling in the Philippine Seas with Emphasis on the Effects of Typhoons
Previous Article in Journal
Improved Hapke Model to Characterize Soil Moisture Content Variation
 
 
Please note that, as of 4 December 2024, Environmental Sciences Proceedings has been renamed to Environmental and Earth Sciences Proceedings and is now published here.
Proceeding Paper

Hydrothermal Alteration Features Enhancement and Mapping Using High-Resolution Hyperspectral Data †

by
Soufiane Hajaj
1,*,
Abderrazak El Harti
1,
Amine Jellouli
1,
Saloua Mnissar Himyari
2 and
Abderrazak Hamzaoui
2
1
Geomatics, Georesources and Environment Laboratory, Faculty of Sciences and Techniques, Sultan Moulay Slimane University, Beni Mellal 23000, Morocco
2
National Office of Hydrocarbons and Mines—Office National des Hydrocarbures et des Mines (ON-HYM), Moulay Hassan Boulevard, Rabat 10000, Morocco
*
Author to whom correspondence should be addressed.
Presented at the 5th International Electronic Conference on Remote Sensing, 7–21 November 2023; Available online: https://ecrs2023.sciforum.net/.
Environ. Sci. Proc. 2024, 29(1), 77; https://doi.org/10.3390/ECRS2023-16888
Published: 27 March 2024
(This article belongs to the Proceedings of ECRS 2023)

Abstract

:
Hydrothermal alteration mapping is considered as a widely adopted step in the mineral exploration of numerous ore deposits. In this work, the wavelength mapping and relative absorption band depth (RBD) method were applied to map hydrothermal alterations in a site from the abandoned mine of Idikel, western Anti-Atlas, Morocco. Fe2+/Fe3+, Al-OH, and Mg-Fe-OH/CO3 hydrothermal alteration minerals were targeted based on HyMap airborne imaging spectroscopy data. Using the wavelength mapping approach, the 900 to 1205 nm, 2094 to 2217 nm, and 2264 to 2318 nm ranges were selected to map Fe2+/Fe3+, Al-OH, and Mg-Fe-OH/CO3 absorption features, respectively. By carefully selecting these spectral ranges, the study aimed to achieve the accurate and reliable mapping of hydrothermal alteration features. The highest interpolated depth of Al-OH features was matched with a major cluster of pixels at 2200 nm. The highest interpolated depth of Mg-Fe-OH/CO3 was depicted at 2300 nm. The highest interpolated depth of Fe2+/Fe3+ was depicted between 900 and 1000. The relative absorption band depth method was also applied to enhance the detectability of hydrothermal alteration minerals. This method involves assessing the depth of the absorption bands associated with the target minerals, allowing for a detailed characterization of the alteration features. The combination of both wavelength mapping and enhancement methods contributed to a comprehensive and robust hydrothermal alteration mapping process. The identification of Fe2+/Fe3+, Al-OH, and Mg-Fe-OH/CO3 manifestations provided valuable insights into potential mineralization zones within the study area. Overall, this research contributes to the advancement of hydrothermal alteration mapping using hyperspectral data by selecting the required HyMap bands for mapping targeted alterations. The combination of wavelength mapping and enhancement methods proves to be a powerful approach for accurately identifying and characterizing hydrothermal alteration features using specific hyperspectral channels. The findings from this study can aid future mineral exploration endeavors in similar geological settings, providing valuable guidance for locating potential mineral resources in mountainous and challenging terrains.

1. Introduction

Hydrothermal alteration mapping is a crucial step in mineral exploration for a wide range of ore deposits. It involves the identification and characterization of mineral alterations in geological formations, providing valuable insights into potential mineralization zones. Indeed, within the realm of hydrothermal alteration minerals, a significant subset exhibits spectral features within the visible and infrared spectrum, spanning the range of 300 to 3000 nanometers [1]. This spectral activity signifies the minerals’ capacity to selectively absorb incident electromagnetic radiation at particular wavelengths, while concurrently reflecting the remaining wavelengths. This absorption of energy results in the emergence of distinct “spectral absorption features”, which possess diagnostic qualities that can be harnessed for the identification of minerals or mineral assemblages [2]. Recently, imaging spectroscopy data from various airborne and spaceborne platforms demonstrated a high ability in mineral mapping investigations [3,4,5].
In this study, we applied advanced techniques for hydrothermal alteration mapping using HyMap airborne imaging spectroscopy data in the context of the abandoned Idikel mine site in the western Anti-Atlas region of Morocco. This research focuses on the utilization of wavelength mapping and the relative absorption band depth method to pinpoint hydrothermal alteration minerals, specifically targeting Fe2+/Fe3+, Al-OH, and Mg-Fe-OH/CO3 manifestations. By strategically selecting spectral ranges, we aim to achieve precision and reliability in mapping these alterations. Furthermore, we employed the RBD method to enhance the detection of hydrothermal alteration minerals, enabling a more detailed characterization of these features. The combined use of wavelength mapping and enhancement methods results in a comprehensive and robust hydrothermal alteration mapping process.
By identifying and characterizing Fe2+/Fe3+, Al-OH, and Mg-Fe-OH/CO3 manifestations, this research provides valuable insights into potential mineralization zones within the study area. It significantly contributes to the advancement of hydrothermal alteration mapping using hyperspectral data by selecting specific HyMap bands for targeted alteration mapping. The integration of wavelength mapping and enhancement techniques is a powerful approach for accurately identifying and characterizing hydrothermal alteration features. This study holds the potential to assist future mineral exploration endeavors in similar geological settings, offering valuable guidance for locating potential mineral resources in challenging terrains, such as mountainous regions.

2. Material and Methods

2.1. Geological Setting and Alterations
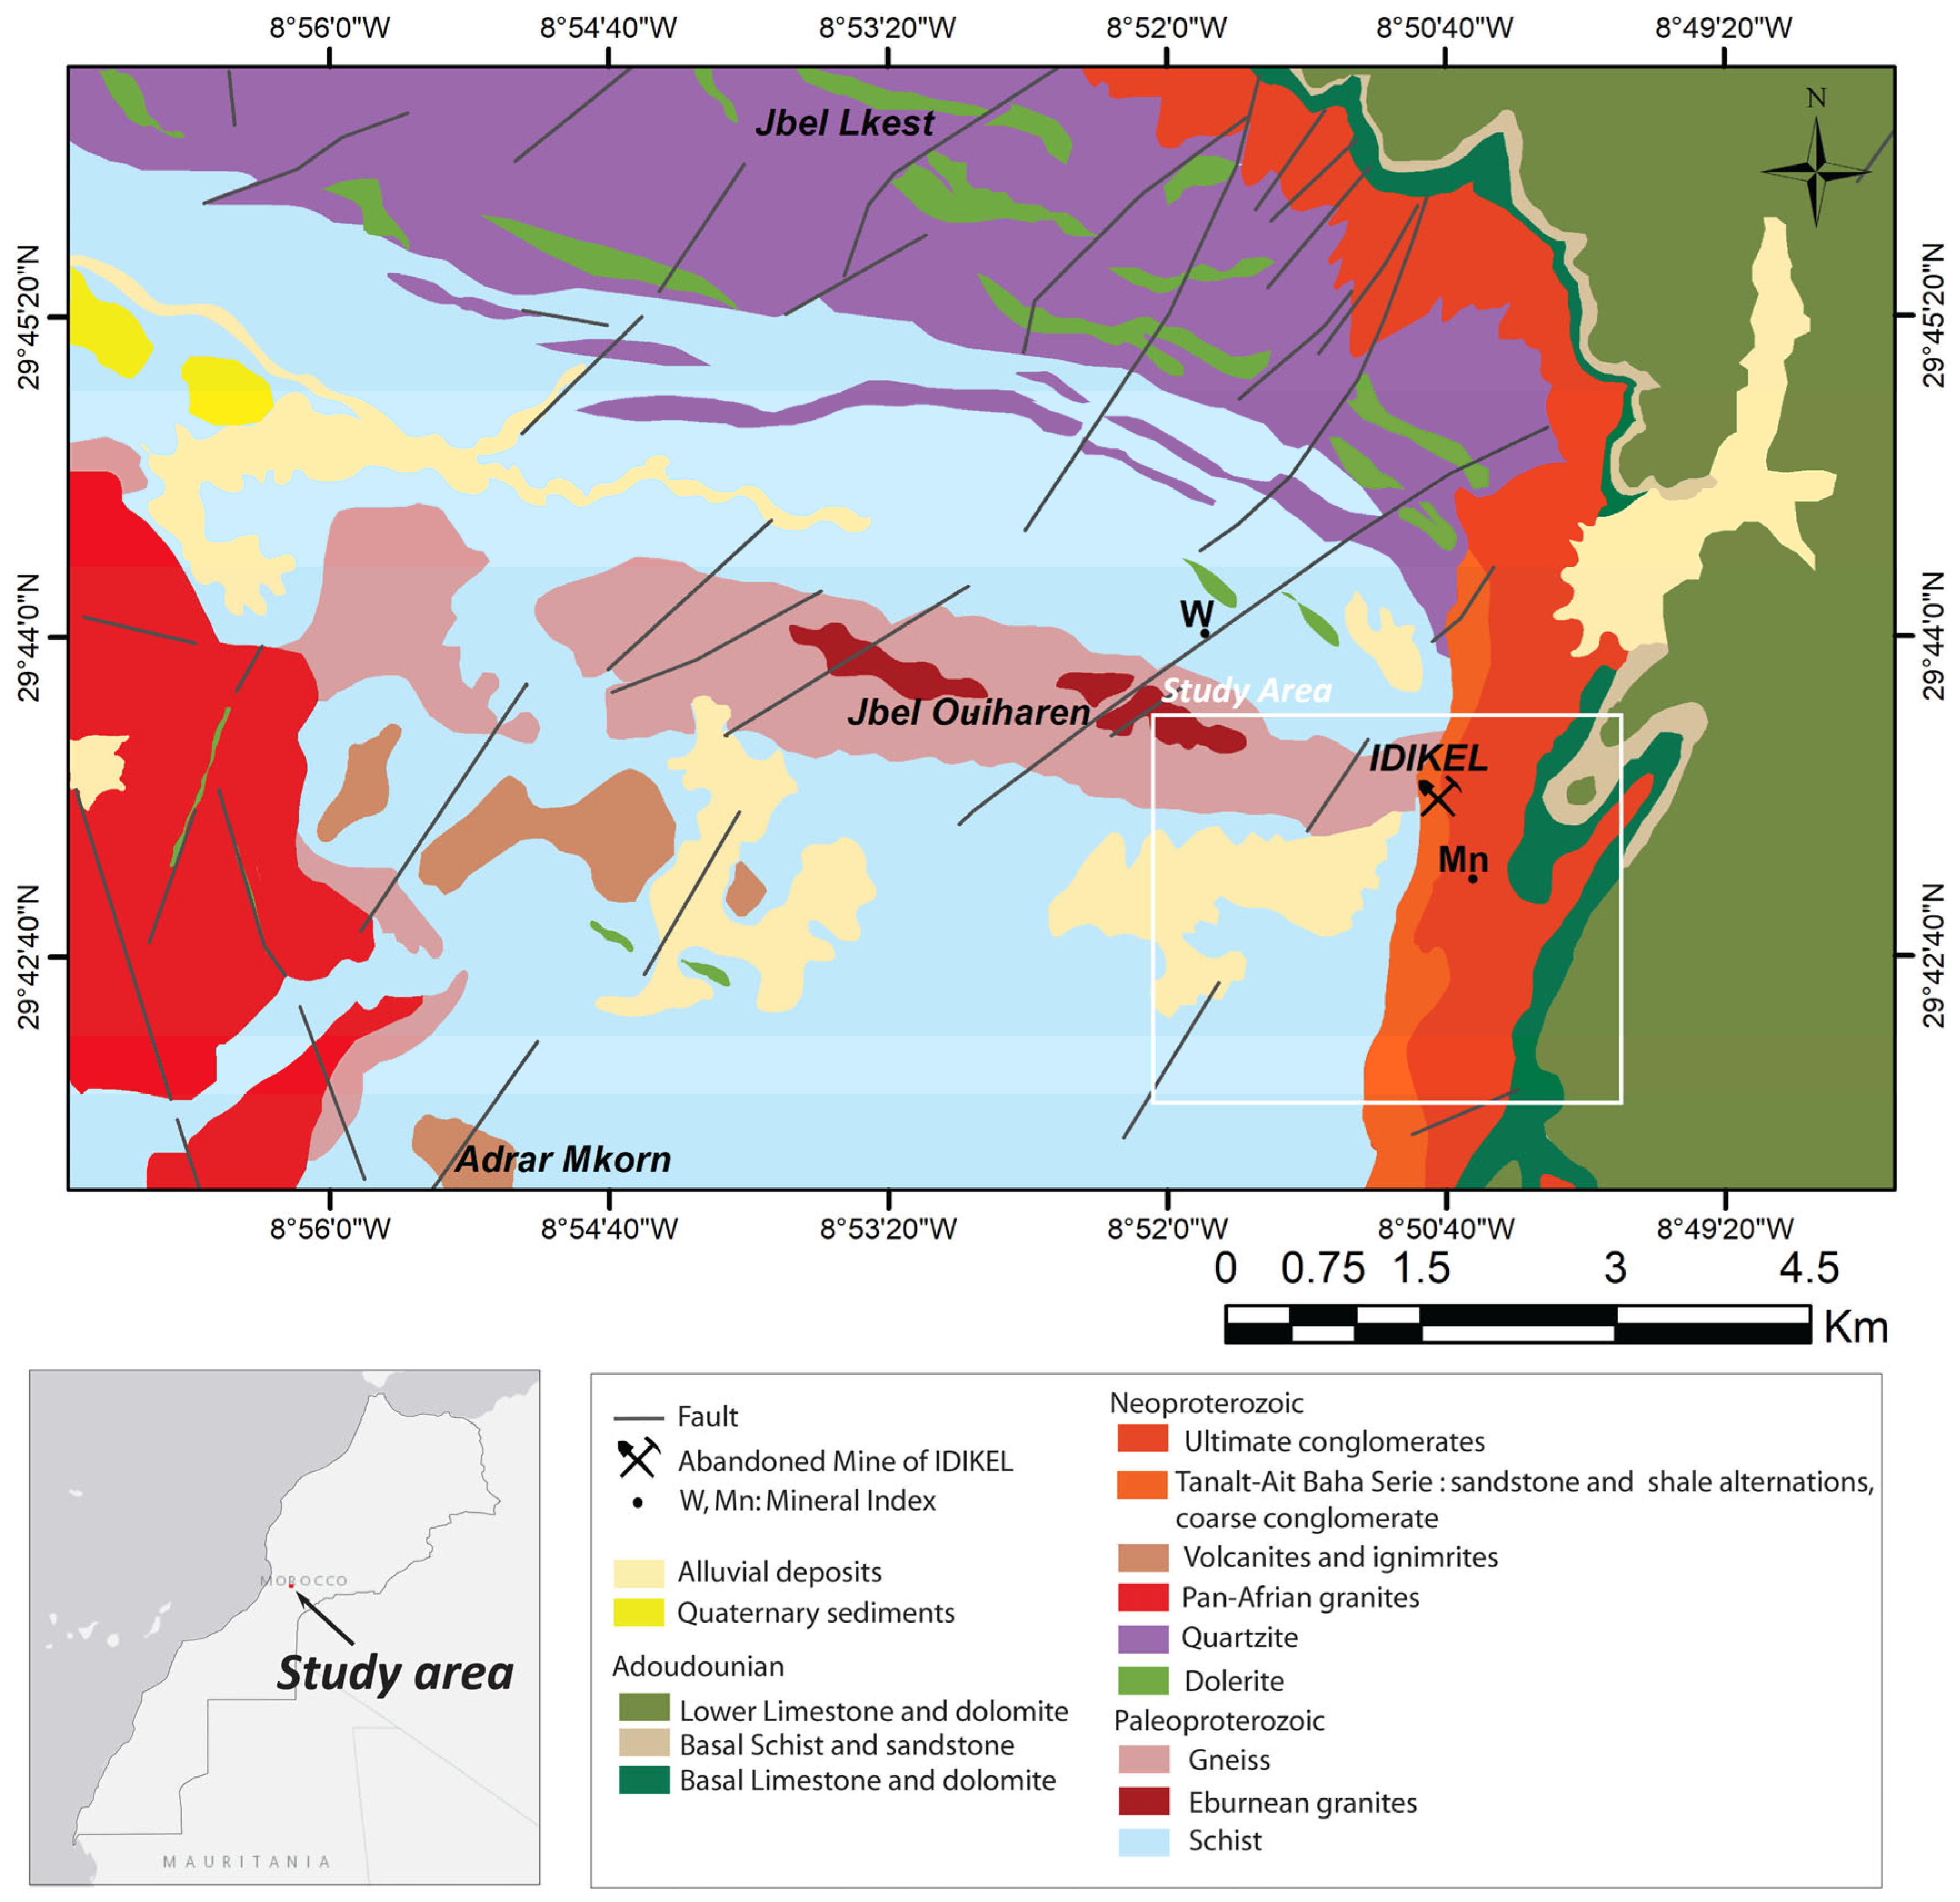
The geology of the Kerdous inlier located in the western Anti-Atlas belt, Morocco was principally structured by the Eburnean and Pan-African orogeny [6,7]. The geological map used for the study area located at the east Kerdous inlier was digitalized from the geological map of Tafraout. The Paleoproterozoic formations are materialized by metamorphic series, including gneisses, schist, and micaschist. The Neoproterozoic is unconformity deposited and it is intersected by rhyolitic vulcanites, granites, quartzites, ignimbrites, and Ultimate conglomerates of the Adoudounien base (see Figure 1) [7].
In the eastern region of Kerdous, historical mining operations are evident through the presence of the disused Manganese Idikel mine. Within the Ultimate conglomerates and quartzites lithological units, three distinct sites exhibit favorable conditions for conducting mineral exploration campaigns, which is verified by utilizing hyperspectral survey techniques [8]. The close spatial association between the NE-SW and NW-SE lineaments and alteration zones highlighted an important tectonic control of mineralization in the study area [8]. The alteration minerals in the study area include muscovite, dolomite, pyrophyllite, illite, haematite, kaolinite, and montmorillonite. Hydrothermal alteration potentially related to paleo-relief occurrence includes the silicification, sericitization, and dolomitization of the host rocks (for additional details, see [8]).
Figure 1. Geological map of the Ameln Valley area [9].
Environsciproc 29 00077 g001

2.2. HyMap Data and Remote Sensing Techniques

The HyMap hyperspectral imaging system, originally developed by Integrated Spectronic in Sydney, Australia and subsequently operated by HyVista [10], captures spectral information across 128 distinct spectral bands spanning the VNIR (Visible and Near-Infrared) and SWIR (Short-Wave Infrared) regions (from 0.45 μm to 2.5 μm) [11]. The HyMap dataset offers a high spatial resolution of approximately 5 meters and an average spectral resolution of 15 nanometers.
The RBD method uses a three-point formulation, wherein the sum of the bands displaying spectral shoulders is divided by the band representing the minimum of the absorption feature [12]. This technique possesses the capability to discern targets even under varying illumination conditions [13]. The RBD approach has been effectively employed to emphasize spectral attributes associated with alteration mineral zones or mineral assemblages, specifically those of the argillic, phyllic, and propylitic [14]. The development of three distinct RBDs within the spectral wavelength range of HyMap has enabled the mapping of manifestations related to Fe3+-Fe2+ by dividing the sum of Band 21 (755 nm) and 51 (1205 nm) by B31 (900) and multiplying it by band 21 (755 nm) and Band 4 (456 nm). Additionally, Al-OH is mapped by dividing the sum of band 101 (2094 nm) and 111 (2268 nm) by band 108 (2217 nm). The enhancement of Mg-Fe-OH/CO3 alteration minerals can be performed by dividing the sum of Band 111 (2268 nm) and 120 (2414 nm) by band 114 (2318 nm) [8,15]. This capability is grounded in the distinctive absorption features exhibited by these minerals [1]. In the current study, the RBD-derived images/maps were used to target Fe3+/Fe2+ alteration minerals including hematite and goethite showing absorption features from 450 to 1200 nm [16]; the Al-OH minerals including kaolinite, Muscovite/illite, pyrophyllite, and montmorillonite showing absorption features near 2200 nm [16]; and dolomite showing absorption features near 2318 nm [16]. According to the alteration minerals’ absorption features, the employability of these RBDs can be beneficial to map other minerals with common criteria, including calcite, chlorite, and epidote for Mg-Fe-OH/CO3 alteration minerals, as well as limonite and jarosite for Fe3+/Fe2+ alteration minerals [16].
The minimum wavelength mapper approach relies on the analysis of spectral absorption characteristics, including parameters like position and depth. It facilitates the generation of a visual representation, presented as a color-coded map, which serves as a proxy for mineral composition, mineral abundance, and spatial distribution [17]. The Minimum Wavelength Mapper method excels in computing a proxy for mineral composition and demonstrates its proficiency in detecting compositional alterations through the identification of subtle shifts in wavelength positions. These attributes underscore the method’s significance in mineralogical analysis. In contrast, techniques based on mineral endmembers or library spectra, such as the spectral angle mapper (SAM) and linear spectral unmixing (LSU), lack the capacity to discern minor alterations in the wavelength positions of absorption features or represent them as distinct endmembers [18].

3. Results and Discussion

Figure 2 shows the results of hydrothermal alteration mapping around the abandoned Idikel mine. The minimum wavelength mapping results exhibit the high abundance of the Al-OH alteration in the Ultimate conglomerate lithological unit, as highlighted in a purple color, while this alteration is absent in the carbonates units (Figure 2). The high alteration minerals abundance is related essentially to argillic and phyllic alterations [8]. Additionally, Fe2+/Fe3+ alterations were mapped in blue tones in gneisses and some parts of Ultimate conglomerates units. Based on previous mapping results in the Ameln valley shear zone, the Fe2+/Fe3+ features could be related to Hematite. Mg-Fe-OH/CO3 alterations were mapped yellow in carbonate units, represented by base limestone and dolomite, as well as lower limestone and dolomite, which can be due to the dolomite mineral, while little abundance of Mg-Fe-OH/CO3 minerals can be detected in Paleoproterozoic schist due to the presence of recent sediments (Figure 2). Figure 3 displays the plot of the absorption features’ depth as a function of the wavelength position for each result from wavelength mapping. Figure 3A demonstrates that the interpolated minimum wavelength was centered around 2200 nm. Figure 3B shows several features; the main interpolated depth of the wavelength was identified near 900 nm. However, the presence of several interpolated depths can explain the relatively weak abundance of Fe2+/Fe3+ within the study area. Figure 3C shows that the main interpolated depth is between 2285 nm and 2300 nm.
For RBD, Al-OH alteration minerals, which are mostly found in the Ultimate conglomerates unit and gneiss unit, are depicted as bright pixels on the RBD1 image map (Figure 2). For Fe2+/Fe3+ alteration minerals, these are often linked to lower limestone and dolomite and the Ultimate conglomerates lithological units. This alteration is depicted as bright pixels on the RBD2 image map (Figure 2). In the Adoudounien formations, the RBD3 exhibits a high spatial distribution of Mg-Fe-OH/CO3, particularly of carbonates in the lithological units of base limestone and dolomite, as well as lower limestone and dolomite (Figure 2).
The current method involves assessing the depth of the absorption bands associated with the target minerals, allowing a detailed characterization of the alteration features. The combination of both wavelength mapping and enhancement methods contributed to a comprehensive and robust hydrothermal alteration mapping process. The mapping results following minimum wavelength and RBD techniques have revealed a global agreement. In some cases, limited information was revealed by using the RBD technique for visualizing targeted minerals in the study area, which can be observed by an overspread of bright pixels, surpassing the specified alteration features. In addition, it was demonstrated that establishing the minimum wavelength technique within the three specified intervals proved to be useful in verifying the RBD-derived alteration maps. Accordingly, the detailed insights including the absorption depth percentage and the electromagnetic spectrum positions of the enhanced alteration features have been extracted successfully (see Figure 2 and Figure 3). The minimum wavelength mapping method is highly sensitive to small changes in mineral composition or percentage. This sensitivity allows it to create a single color-coded map that serves as a proxy for mineral composition, abundance, and spatial patterns [17]. The identification of Fe2+/Fe3+, Al-OH, and Mg-Fe-OH/CO3 manifestations provided valuable insights into potential mineralization zones within the study area.

4. Conclusions

In conclusion, this study has demonstrated the effectiveness of utilizing advanced techniques, including wavelength mapping and the RBD method, for the precise mapping of hydrothermal alterations in the Idikel mine site within the western Anti-Atlas of Morocco. By specifically targeting Fe2+/Fe3+, Al-OH, and Mg-Fe-OH/CO3 hydrothermal alteration minerals through HyMap airborne imaging spectroscopy data, we have achieved accurate and reliable mapping of these features. The integration of wavelength mapping and enhancement techniques has proven to be a powerful approach for accurately characterizing hydrothermal alteration features using specific hyperspectral channels. It is highlighted that applying the minimum wavelength technique within the three specified intervals provides useful insights and a further verification of the RBD-derived alteration maps. The current study findings hold the potential to guide future mineral exploration efforts in similar geological settings, particularly in challenging mountainous terrains, facilitating the discovery of potential mineral resources.

Author Contributions

S.H., A.E.H., A.J., S.M.H. and A.H. contributed equally to the manuscript and approved its final form. All authors have read and agreed to the published version of the manuscript.

Funding

This research received no external funding.

Institutional Review Board Statement

Not applicable.

Informed Consent Statement

Not Applicable.

Data Availability Statement

The used data are confidential.

Acknowledgments

We show appreciation to the ONHYM for providing the HyMap data. Also, the authors would like to thank the 5th International Electronic Conference on Remote Sensing organization committee for providing the opportunity to discuss the present work’s findings. The authors extend their gratitude to the reviewers for their valuable feedback, which has been instrumental in the refinement of the paper’s findings.

Conflicts of Interest

The authors declare that they have no conflicts of interest. It is affirmed that the manuscript has been comprehensively reviewed and endorsed by all the named authors.

References

  1. Clark, R.N.; Gallagher, A.J.; Swayze, G.A. Material absorption band depth mapping of imaging spectrometer data using a complete band shape least-squares fit with library reference spectra. In Proceedings of the Second Airborne Visible/Infrared Imaging Spectrometer (AVIRIS) Workshop, Pasadena, CA, USA, 4–5 June 1990; pp. 176–186. [Google Scholar]
  2. Hecker, C.; van Ruitenbeek, F.J.; van der Werff, H.M.; Bakker, W.H.; Hewson, R.D.; van der Meer, F.D. Spectral absorption feature analysis for finding ore: A tutorial on using the method in geological remote sensing. IEEE Geosci. Remote Sens. Mag. 2019, 7, 51–71. [Google Scholar] [CrossRef]
  3. Cardoso-Fernandes, J.; Santos, D.; Lima, A.; Teodoro, A.C. Assessing the PRISMA Potential for Mineral Exploration to Vector Low-Grade Lithium Deposits. In Proceedings of the IGARSS 2022–2022 IEEE International Geoscience and Remote Sensing Symposium, Kuala Lumpur, Malaysia, 17–22 July 2022; pp. 5985–5988. [Google Scholar]
  4. Pour, A.B.; Guha, A.; Crispini, L.; Chatterjee, S. Editorial for the Special Issue Entitled Hyperspectral Remote Sensing from Spaceborne and Low-Altitude Aerial/Drone-Based Platforms—Differences in Approaches, Data Processing Methods, and Applications; MDPI: Basel, Switzerland, 2023; Volume 15, p. 5119. [Google Scholar]
  5. Yao, F.; Liu, S.; Wang, D.; Geng, X.; Wang, C.; Wang, Y. Review on the development of multi-and hyperspectral Remote sensing technology for exploration of copper-gold deposits. Ore Geol. Rev. 2023, 162, 105732. [Google Scholar] [CrossRef]
  6. Choubert, G. Histoire Géologique du Précambrien de l’Anti-Atlas; Éditions du Service géologique du Maroc: Rabat, Morocco, 1964. [Google Scholar]
  7. Hassenforder, B. Evolution tectono-métamorphique du socle du Kerdous (Anti-Atlas occidental, Maroc) dans le cadre des orogenèses éburnéenne et pan-africaine. Sci. Géologiques Bull. Et Mémoires 1978, 31, 21–31. [Google Scholar] [CrossRef]
  8. Hajaj, S.; El Harti, A.; Jellouli, A.; Pour, A.B.; Himyari, S.M.; Hamzaoui, A.; Bensalah, M.K.; Benaouiss, N.; Hashim, M. HyMap imagery for copper and manganese prospecting in the east of Ameln valley shear zone (Kerdous inlier, western Anti-Atlas, Morocco). J. Spat. Sci. 2023, 69, 1–22. [Google Scholar] [CrossRef]
  9. Hajaj, S.; El Harti, A.; Jellouli, A.; Pour, A.B.; Mnissar Himyari, S.; Hamzaoui, A.; Hashim, M. Evaluating the Performance of Machine Learning and Deep Learning Techniques to HyMap Imagery for Lithological Mapping in a Semi-Arid Region: Case Study from Western Anti-Atlas, Morocco. Minerals 2023, 13, 766. [Google Scholar] [CrossRef]
  10. Cocks, T.; Jenssen, R.; Stewart, A.; Wilson, I.; Shields, T. The HyMapTM airborne hyperspectral sensor: The system, calibration and performance. In Proceedings of the 1st EARSeL Workshop on Imaging Spectroscopy, Zurich, Switzerland, 6–8 October 1998; pp. 37–42. [Google Scholar]
  11. Hausknecht, P. Hymap Data L2/3 Processing. J. Rep. Geol. Surv. Namib. 2005, 1, 48. [Google Scholar]
  12. Crowley, J.K.; Brickey, D.W.; Rowan, L.C. Airborne imaging spectrometer data of the Ruby Mountains, Montana: Mineral discrimination using relative absorption band-depth images. Remote Sens. Environ. 1989, 29, 121–134. [Google Scholar] [CrossRef]
  13. Lillesand, T.; Kiefer, R.W.; Chipman, J. Remote Sensing and Image Interpretation; John Wiley & Sons: Hoboken, NJ, USA, 2015. [Google Scholar]
  14. Beiranvand Pour, A.; Park, T.-Y.S.; Park, Y.; Hong, J.K.; M Muslim, A.; Läufer, A.; Crispini, L.; Pradhan, B.; Zoheir, B.; Rahmani, O. Landsat-8, advanced spaceborne thermal emission and reflection radiometer, and WorldView-3 multispectral satellite imagery for prospecting copper-gold mineralization in the northeastern Inglefield Mobile Belt (IMB), northwest Greenland. Remote Sens. 2019, 11, 2430. [Google Scholar] [CrossRef]
  15. Hajaj, S.; El Harti, A.; Jellouli, A.; Pour, A.B.; Himyari, S.M.; Hamzaoui, A.; Bensalah, M.K.; Benaouis, N.; Hashim, M. HyMap Airborne Imaging Spectroscopy for Mineral Potential Mapping of Cupriferous Mineralization in a Semi-Arid Region Based on Pixel/Sub-Pixel Hydrothermal Alteration Minerals Mapping–A Case Study. In Proceedings of the 25th EGU General Assembly, Vienna, Austria, 3–28 April 2023. [Google Scholar] [CrossRef]
  16. Hunt, G.R. Spectral signatures of particulate minerals in the visible and near infrared. Geophysics 1977, 42, 501–513. [Google Scholar] [CrossRef]
  17. Bakker, W.; van Ruitenbeek, F.; van der Werff, H. Hyperspectral image mapping by automatic color coding of absorption features. In Proceedings of the 7th EARSEL Workshop of the Special Interest Group in Imaging Spectroscopy, Edinburgh, UK, 11–13 April 2011. [Google Scholar]
  18. Portela, B.; Sepp, M.D.; van Ruitenbeek, F.J.; Hecker, C.; Dilles, J.H. Using hyperspectral imagery for identification of pyrophyllite-muscovite intergrowths and alunite in the shallow epithermal environment of the Yerington porphyry copper district. Ore Geol. Rev. 2021, 131, 104012. [Google Scholar] [CrossRef]
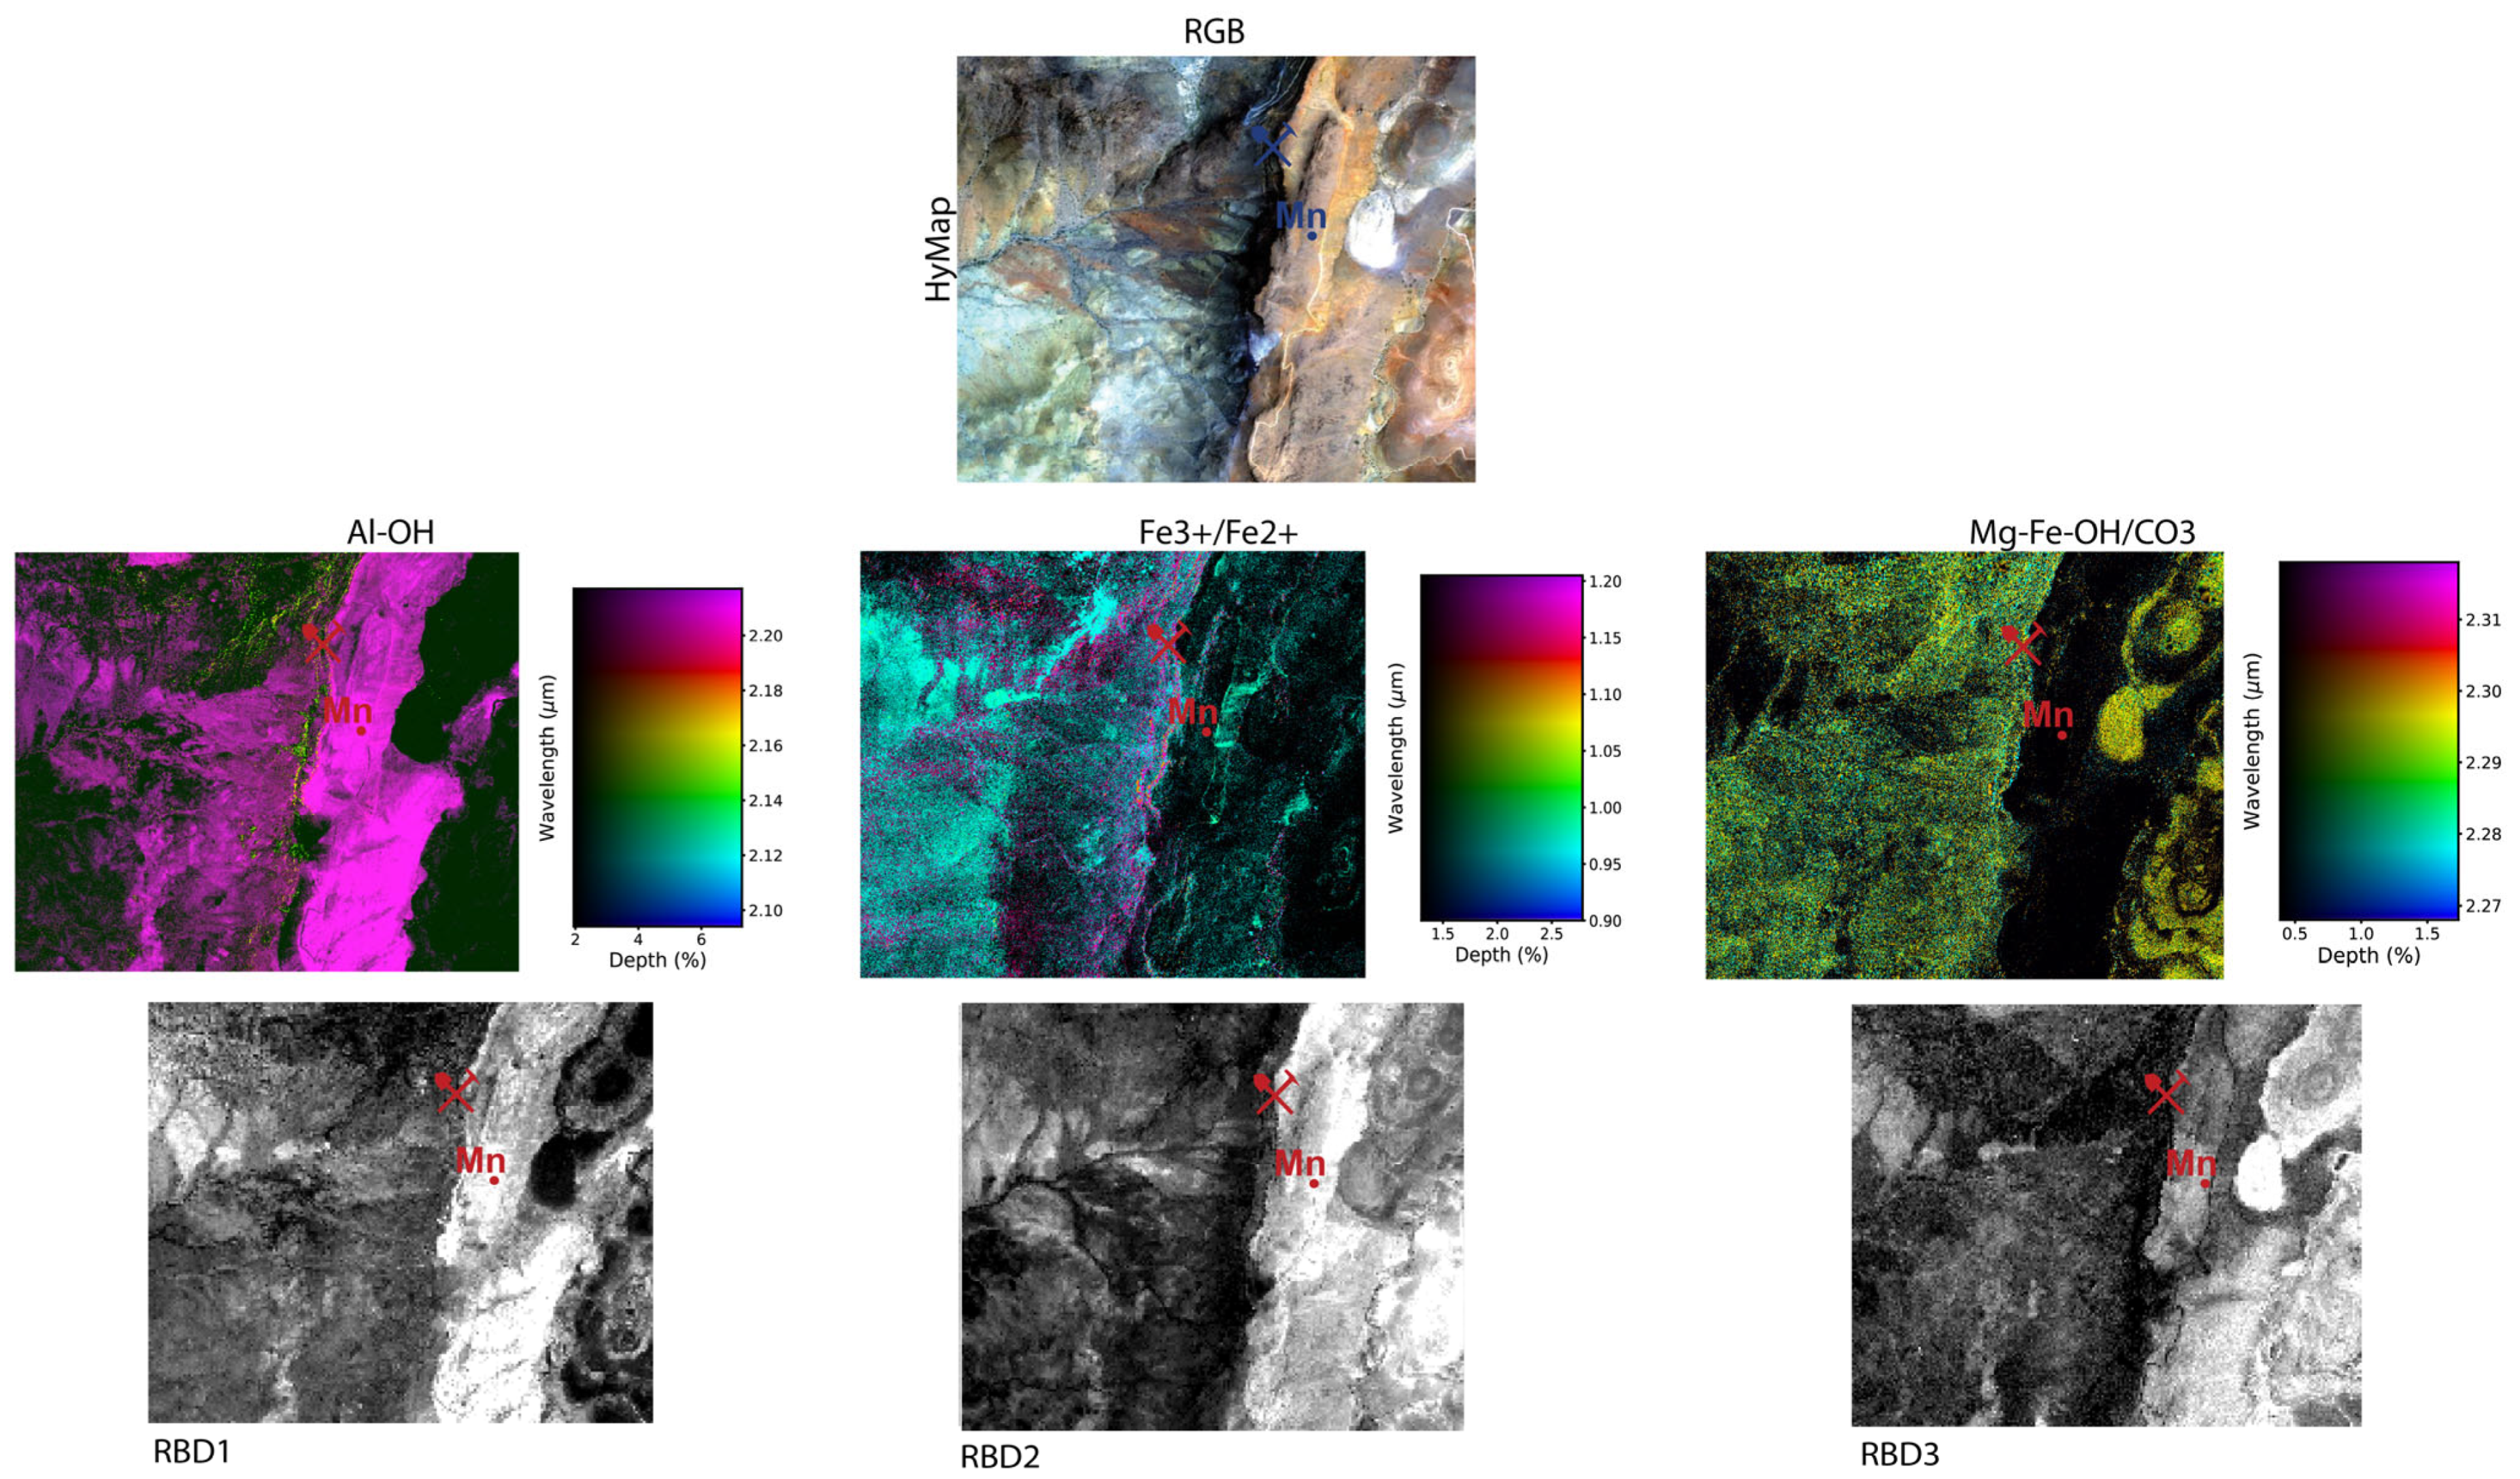
Figure 2. The results of the wavelength mapping and relative absorption band depth for the three targeted hydrothermal alteration features (i.e., Al-OH, Fe2+/Fe3+, and Mg-Fe-OH/CO3, from the left to the right) in the study area.
Environsciproc 29 00077 g002
Figure 3. The plot of the absorption features’ depth as a function of the wavelength position for each result of the wavelength mapping for Al-OH (A), Fe2+/Fe3+ (B), and Mg-Fe-OH/CO3 (C) hydrothermal alteration minerals.
Environsciproc 29 00077 g003
Disclaimer/Publisher’s Note: The statements, opinions and data contained in all publications are solely those of the individual author(s) and contributor(s) and not of MDPI and/or the editor(s). MDPI and/or the editor(s) disclaim responsibility for any injury to people or property resulting from any ideas, methods, instructions or products referred to in the content.