


Abstract
Glacier surface facies (GSFs) are visible glaciological regions that can be distinguished and mapped at the end of summer using optical satellite data. GSF maps act as visual metrics of glacier health when assessed independently or correlated with in situ mass balance measurements. The literature suggests that the spatiotemporal distribution of all accumulation and ablation facies are important inputs to 3D mass balance models because the GSF trends enhance the precision of models. For example, the progressive increase in the area and distribution of melting ice and decrease in the area and distribution of glacier ice, as estimated by satellite data, may signal potential mass loss without significant change in the overall area of the ablation zone. Tracking the evolution of GSFs in Svalbard is important for the predictive assessment of the cryosphere in the Arctic. This will further facilitate robust methods for monitoring GSFs on a planetary scale. In this context, we present a regional spatiotemporal analysis of GSFs of Midtre Lovénbreen, Ny Ålesund, Svalbard. We used openly available Landsat 8 Operational Land imager (OLI) and Sentinel 2A imagery taken in 2017–2022 to track the occurrence and variations of GSFs via machine learning. The current results suggest that ablation facies such as melting ice and dirty ice are increasing over time. Sentinel 2A provides finer resolution but is limited by its temporal coverage. Although Landsat is suitable for long-term trend analysis, its coarser resolution can lead to errors such as over/underestimation of smaller patches of facies on relatively smaller glaciers. As the spectral properties of GSFs are consistent over time, a robust set of spectra depicting variations in physical appearance of facies may be used to train machine learning algorithms, thereby improving efficacy. In forthcoming studies, our objective is to expand the temporal scope spanning decades and to trace facies evolution over longer time series.
1. Introduction
Glacier facies are the natural zones of a glacier’s evolutionary cycle. These zones are formed as result of precipitation, metamorphosis, and the discharge of snow. The entrainment and deposition of debris plays a key role in determining facies of the ablation zone. Facies are distinct due to their varying spatial and spectral properties. These properties can be used to map facies via satellite images. When mapped using Synthetic Aperture Radar (SAR), these facies are called radar facies, and when mapped using optical data, they are called surface facies. Glacier surface facies (GSFs), therefore, are the surface expressions of glacier facies as mapped using optical sensor (satellite/airborne) data.
GSF maps provide the opportunity to calibrate distributed mass balance models for improving their predictive performance [1], for tracking the development of streams and lakes for disaster management [2], and for assessing the overall hydrological resources of the glacial body [3]. Garg et al. [4] conducted spatiotemporal mapping of radar facies in Ny-Ålesund. However, radar facies and optical facies cannot be directly compared on account of the inherent differences in both the mechanism and nomenclature used to generate the maps. Although spatiotemporal variations using optical data have not been tested in Ny-Ålesund, snapshot classifications of facies have been performed for selected glaciers from the same region [5,6,7,8,9]. The current literature for mapping facies does not address the challenges and requirements for performing a long-term spatiotemporal analysis for larger study sites. In this current study, we present a preliminary experiment for monitoring spatiotemporal variations of facies for the Midtre Lovénbreen glacier in Ny-Ålesund, Svalbard.
2. Materials and Methods
2.1. Study Area and Data Used
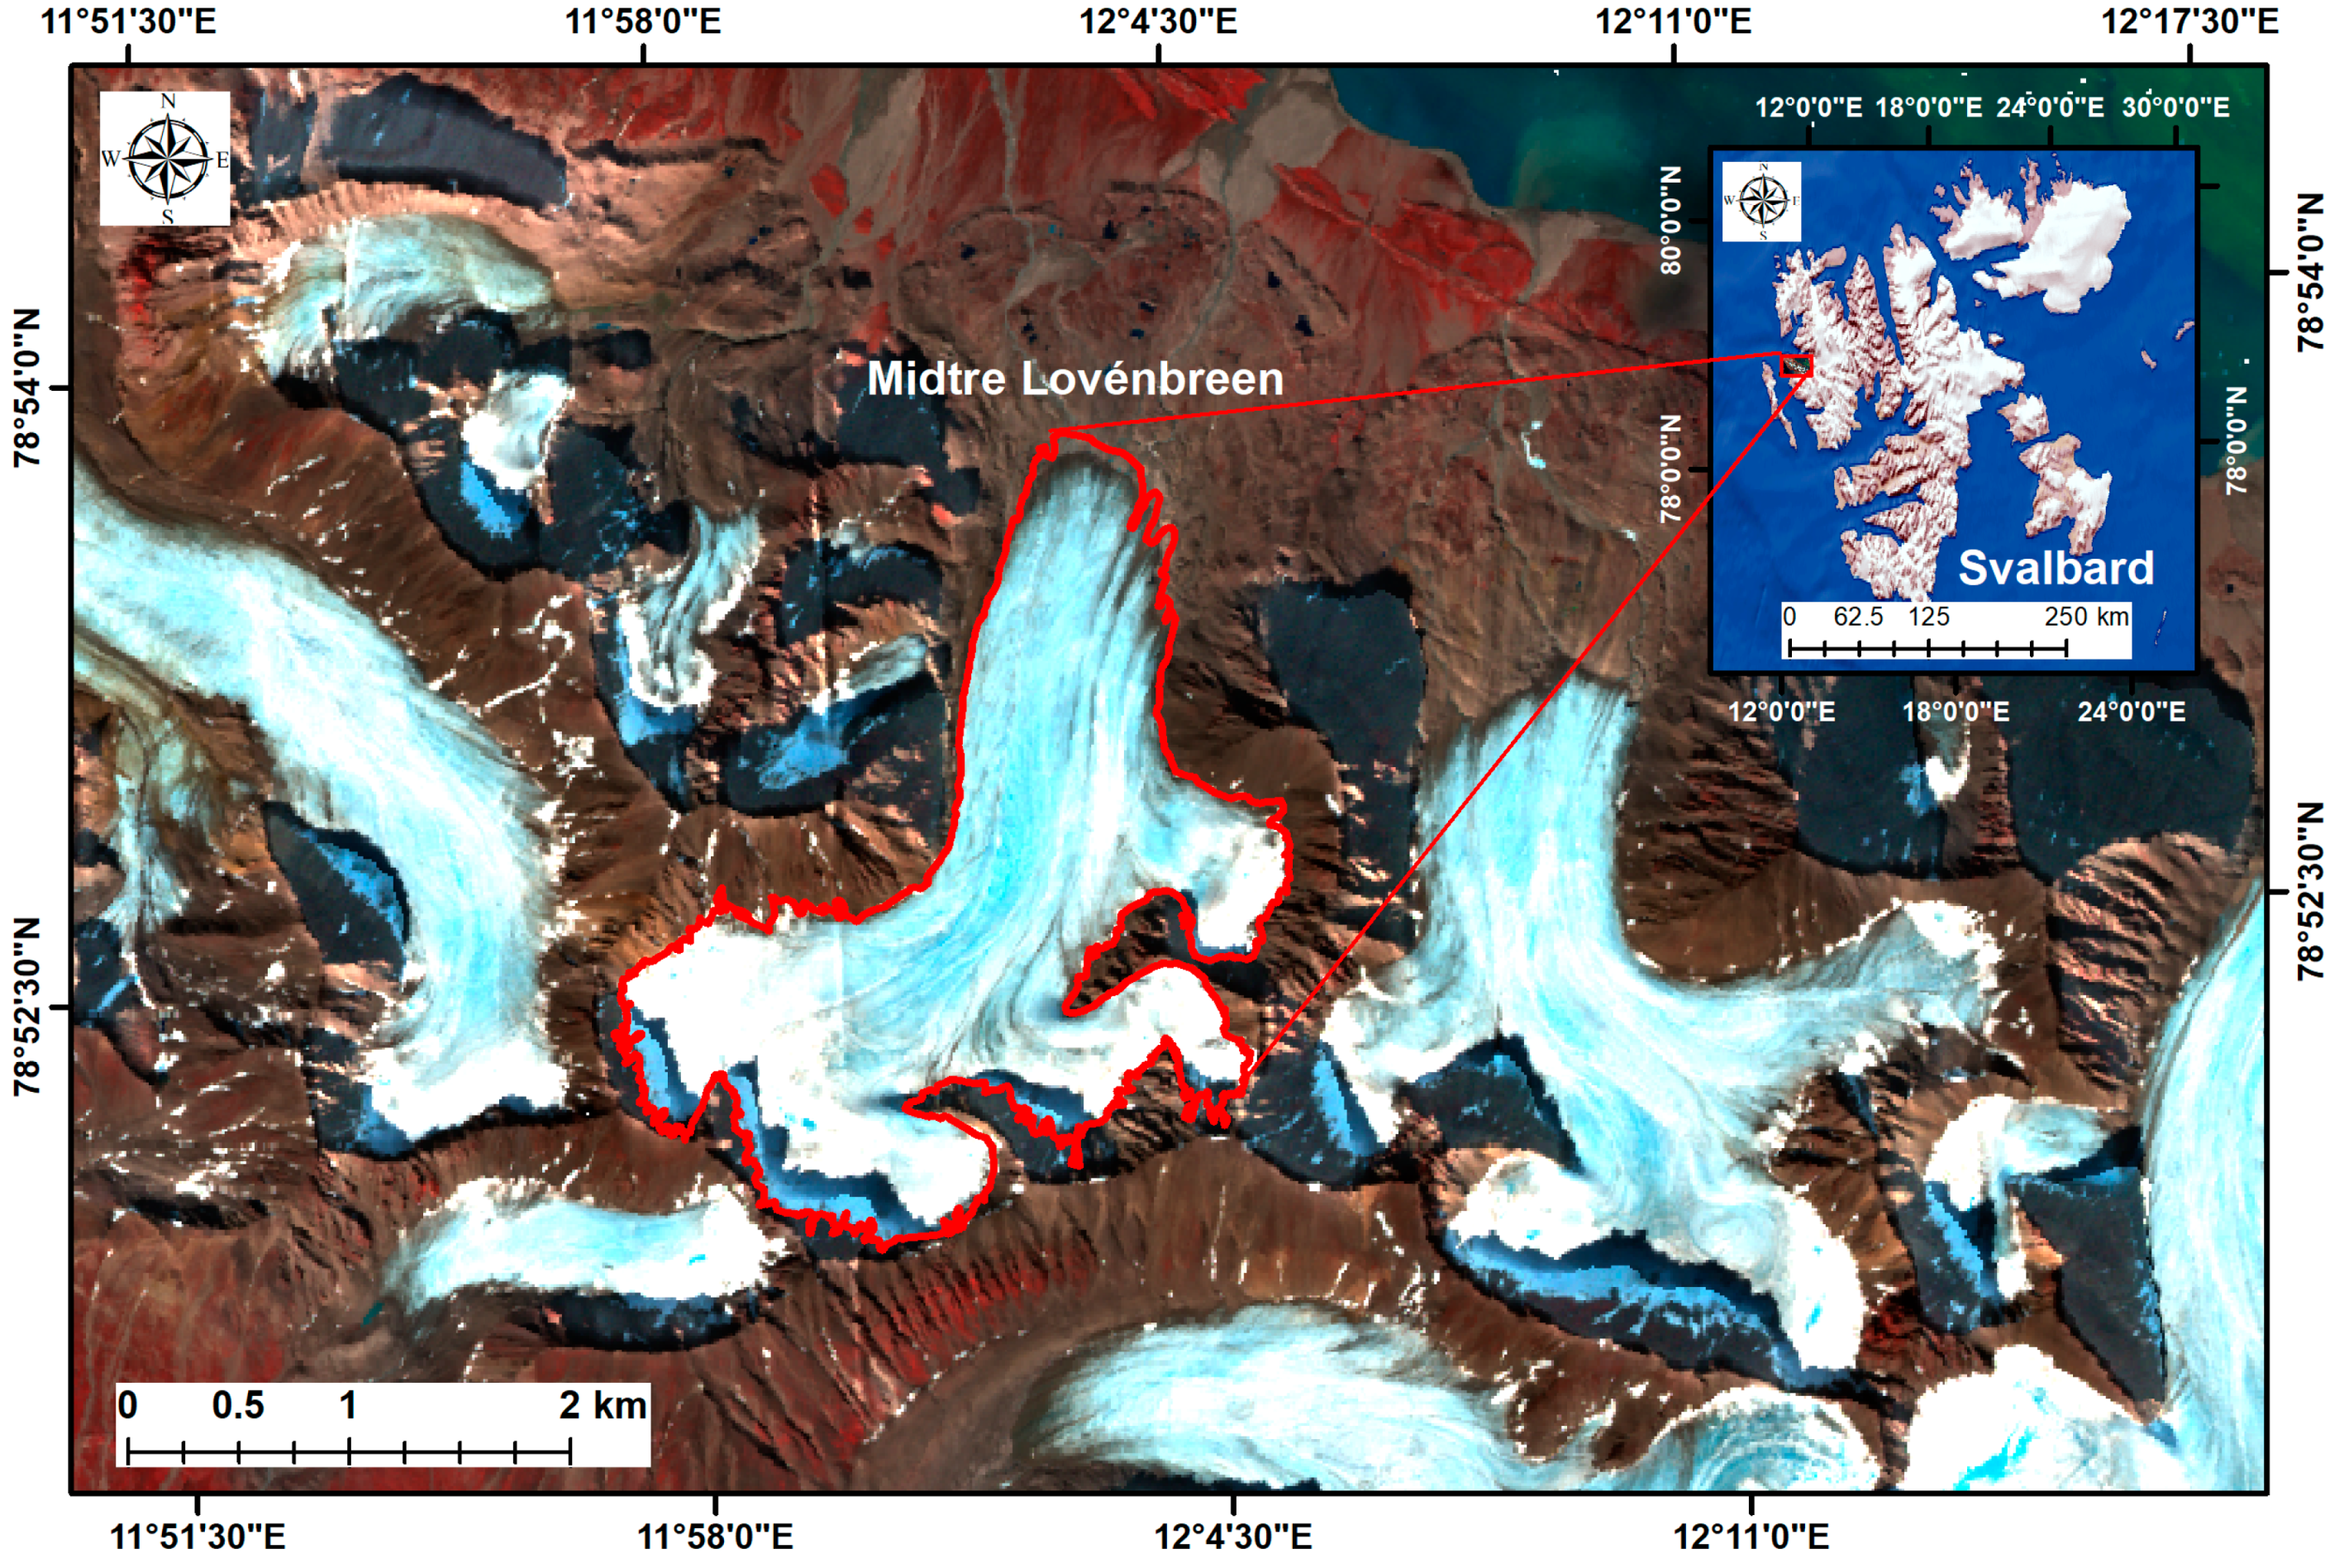
Ny-Ålesund, Svalbard, lying within 75° and 82° N presents an accelerated warming High Arctic environment. The rate of warming experienced here is twice the global average. This region comprises some of the most well-studied glaciers. The Midtre Lovénbreen (ML) glacier (Figure 1) is well monitored, with a long mass balance record [10]. ML has been utilized for mapping facies by several studies [9]. This provides a working repository of literature for this current study.
Figure 1.
Geographic location of the Midtre Lovénbreen glacier. The background image of the inset of Svalbard was obtained from Natural Earth; free vector and raster map data: naturalearthdata.com. Sentinel 2A Level 2A imagery of ML was acquired on 17 July 2022.
This current study aims to assess the spatiotemporal variations of glacier facies. As a preliminary experiment, we downloaded Level 2A Sentinel 2A (S2AL2A) and Level 2 Collection 2 Landsat 8 OLI (L8C2L2) images from 2017 to 2022. These products provide calibrated reflectance data. Table 1 provides the image acquisition dates of the respective images. For this experiment, we utilized only the 10 m high-resolution bands from S2AL2A. The S2AL2A spectral bands are blue (490 nm), green (560 nm), red (665 nm), and near-infrared (NIR) (842 nm). The corresponding four spectral bands from L8L2 were blue (482 nm), green (562 nm), red (655 nm), and NIR (865 nm). S2AL2A images were downloaded from https://dataspace.copernicus.eu/ (accessed on 28 January 2023), and L8C2L2 images were downloaded from https://earthexplorer.usgs.gov/ (accessed on 28 January 2023).
Table 1.
Date of image acquisitions and corresponding sensors. OLI: operational land imager.
2.2. Experimental Methodology
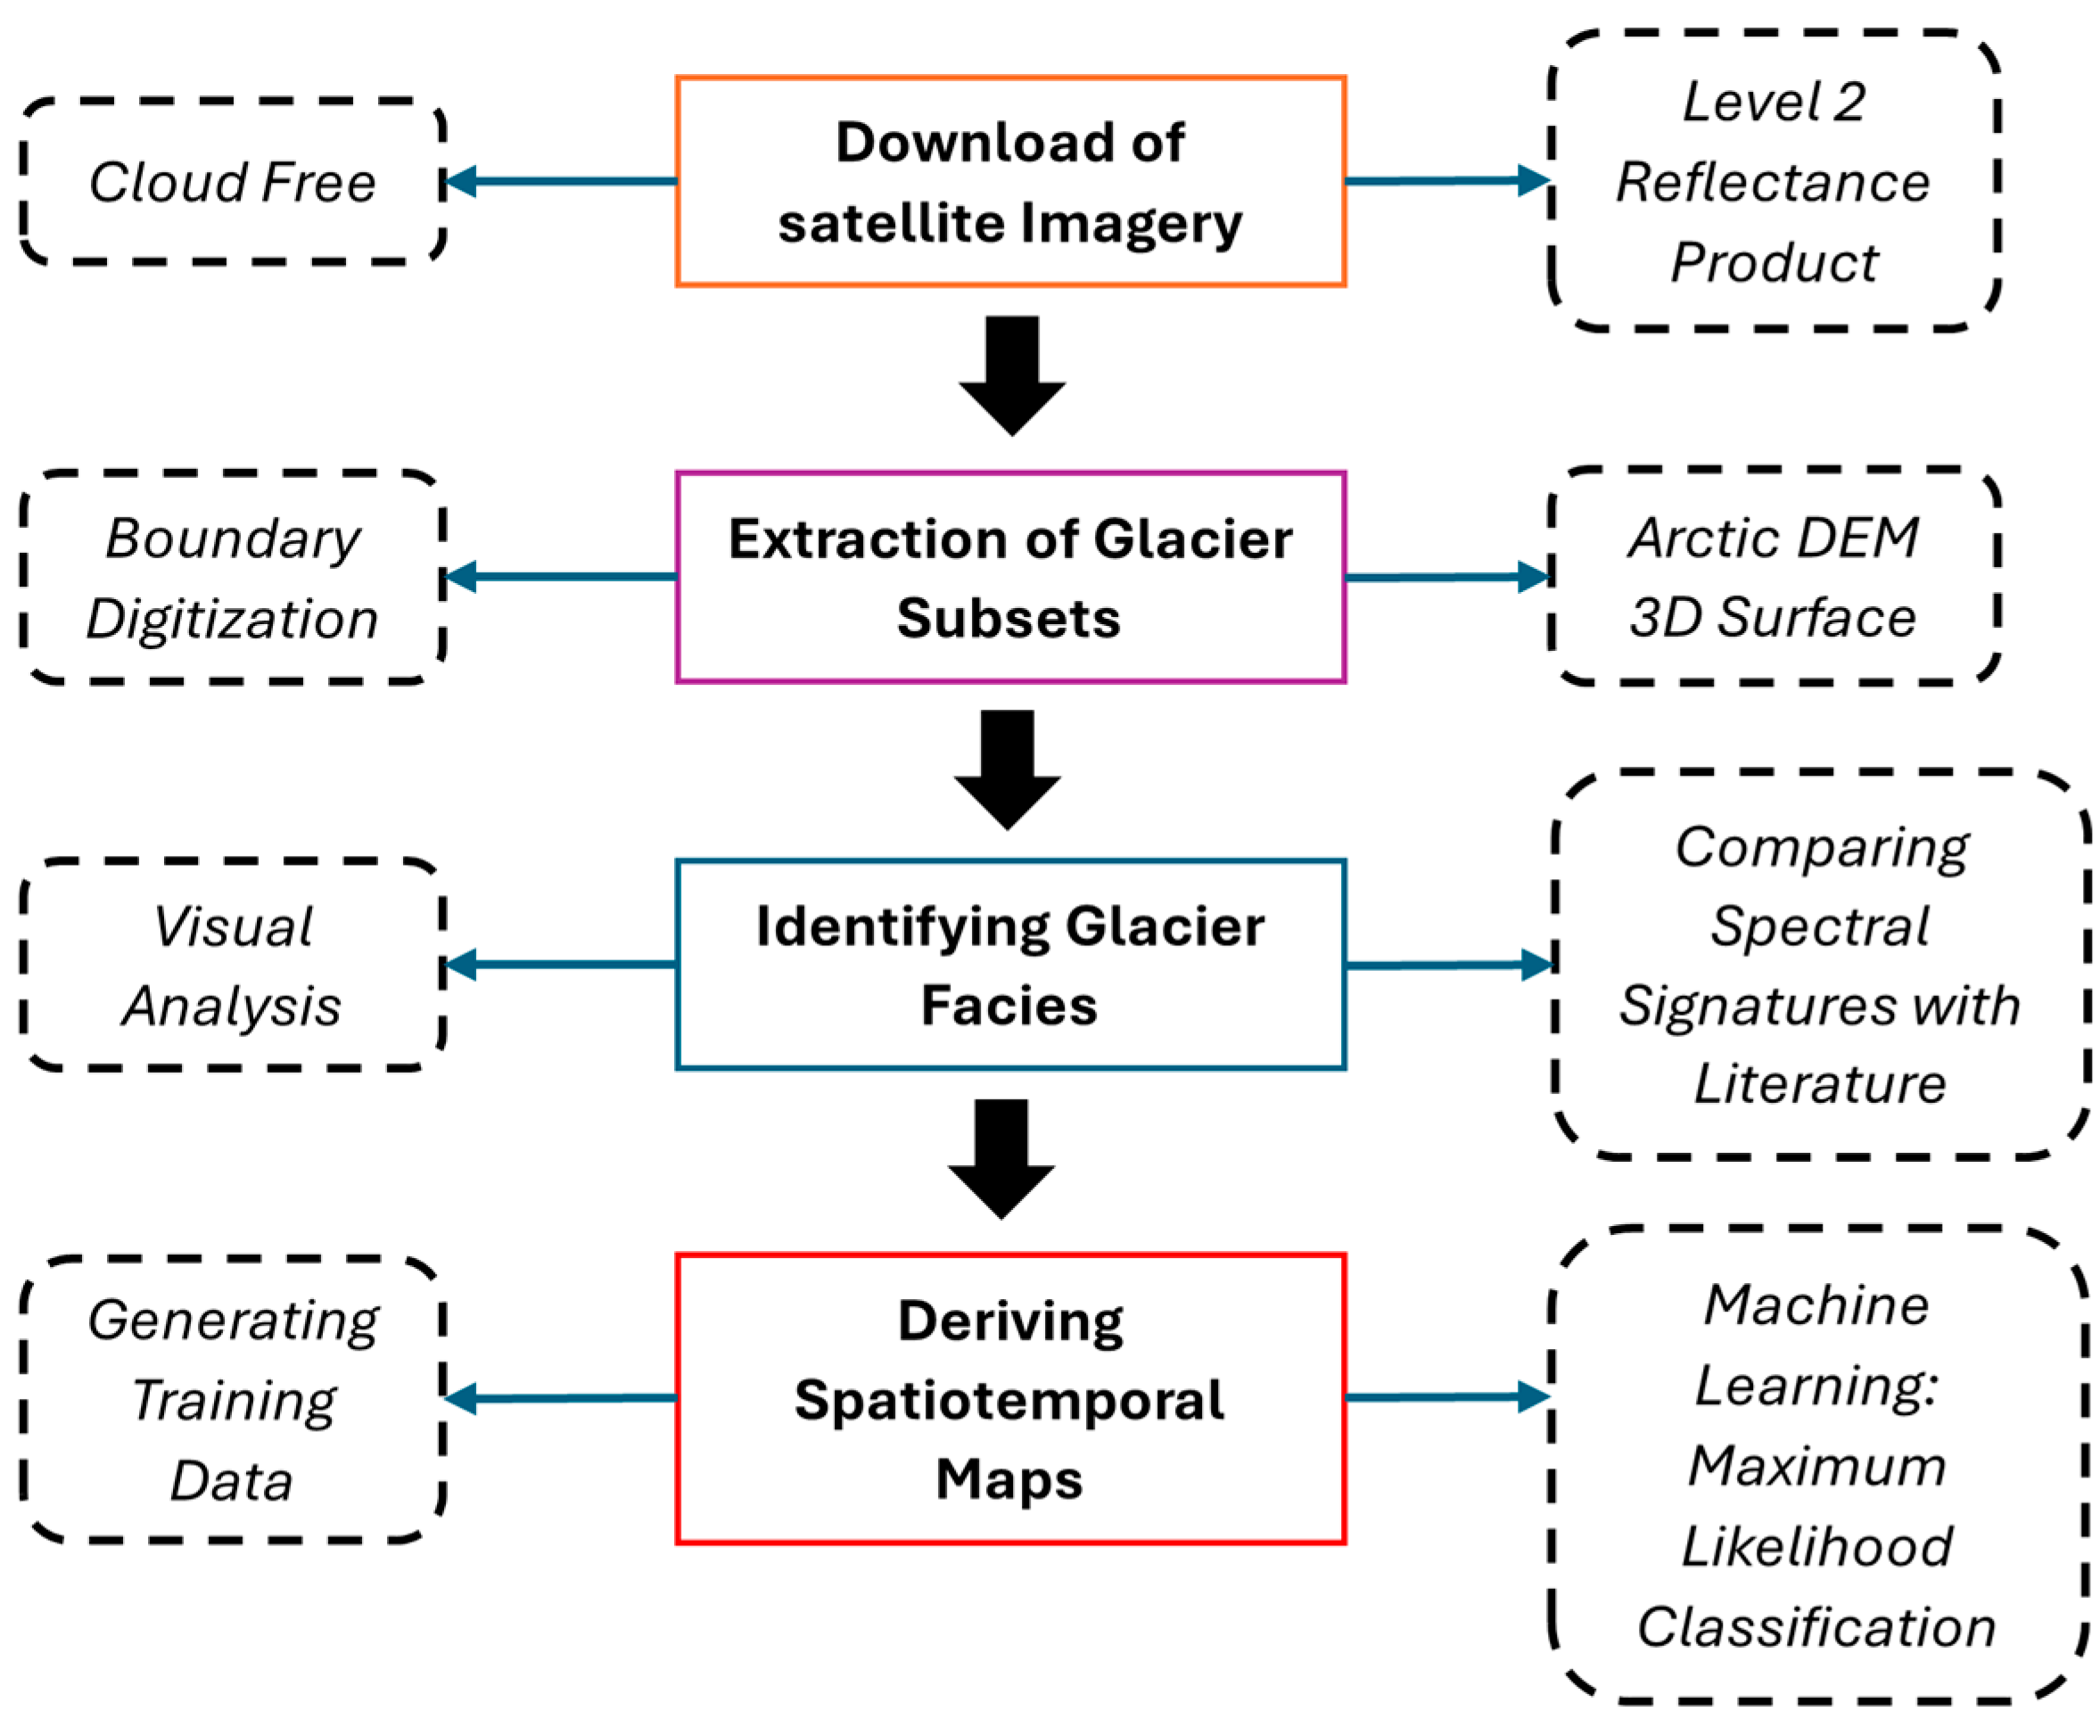
To focus on the spatiotemporal variations of the facies maps, we circumvented preprocessing of the satellite data and downloaded cloud-free reflectance products from each respective sensor. We analysed data from 2017 to 2022 as a preliminary assessment for testing short term changes. ML glacier extents were digitized over a 3D surface generated using an Arctic DEM [11]. The extents were used to extract individual glacier subsets from the overall datasets. Facies were then identified by assessing the visual and spectral properties of the images according to Jawak et al. [7,12]. The facies identified consisted of dry snow, wet snow, melting snow, saturated snow, glacier ice, melting ice, dirty ice, and shadowed snow. Subsequently, training data were generated for each glacier subset and used as input to the traditional soft machine learning maximum likelihood (MXL) algorithm. MXL was selected for this study, as it is well tested for its efficacy for mapping glacier facies [7,13]. Total area per facies per year was then calculated to determine trends and variability. Figure 2 illustrates the methodology of the current experiment.
Figure 2.
Methodology protocol for the practical implementation of this current study. DEM: digital elevation model.
3. Results and Discussion
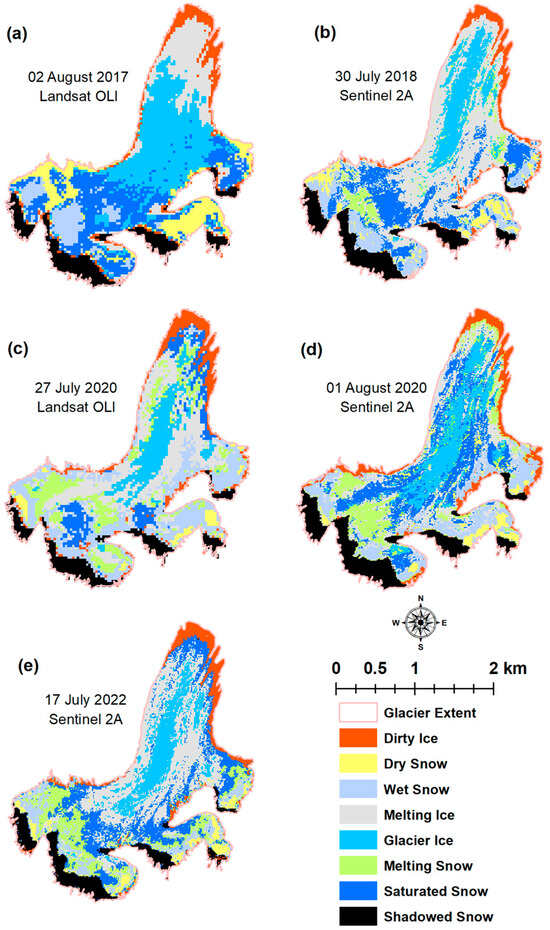
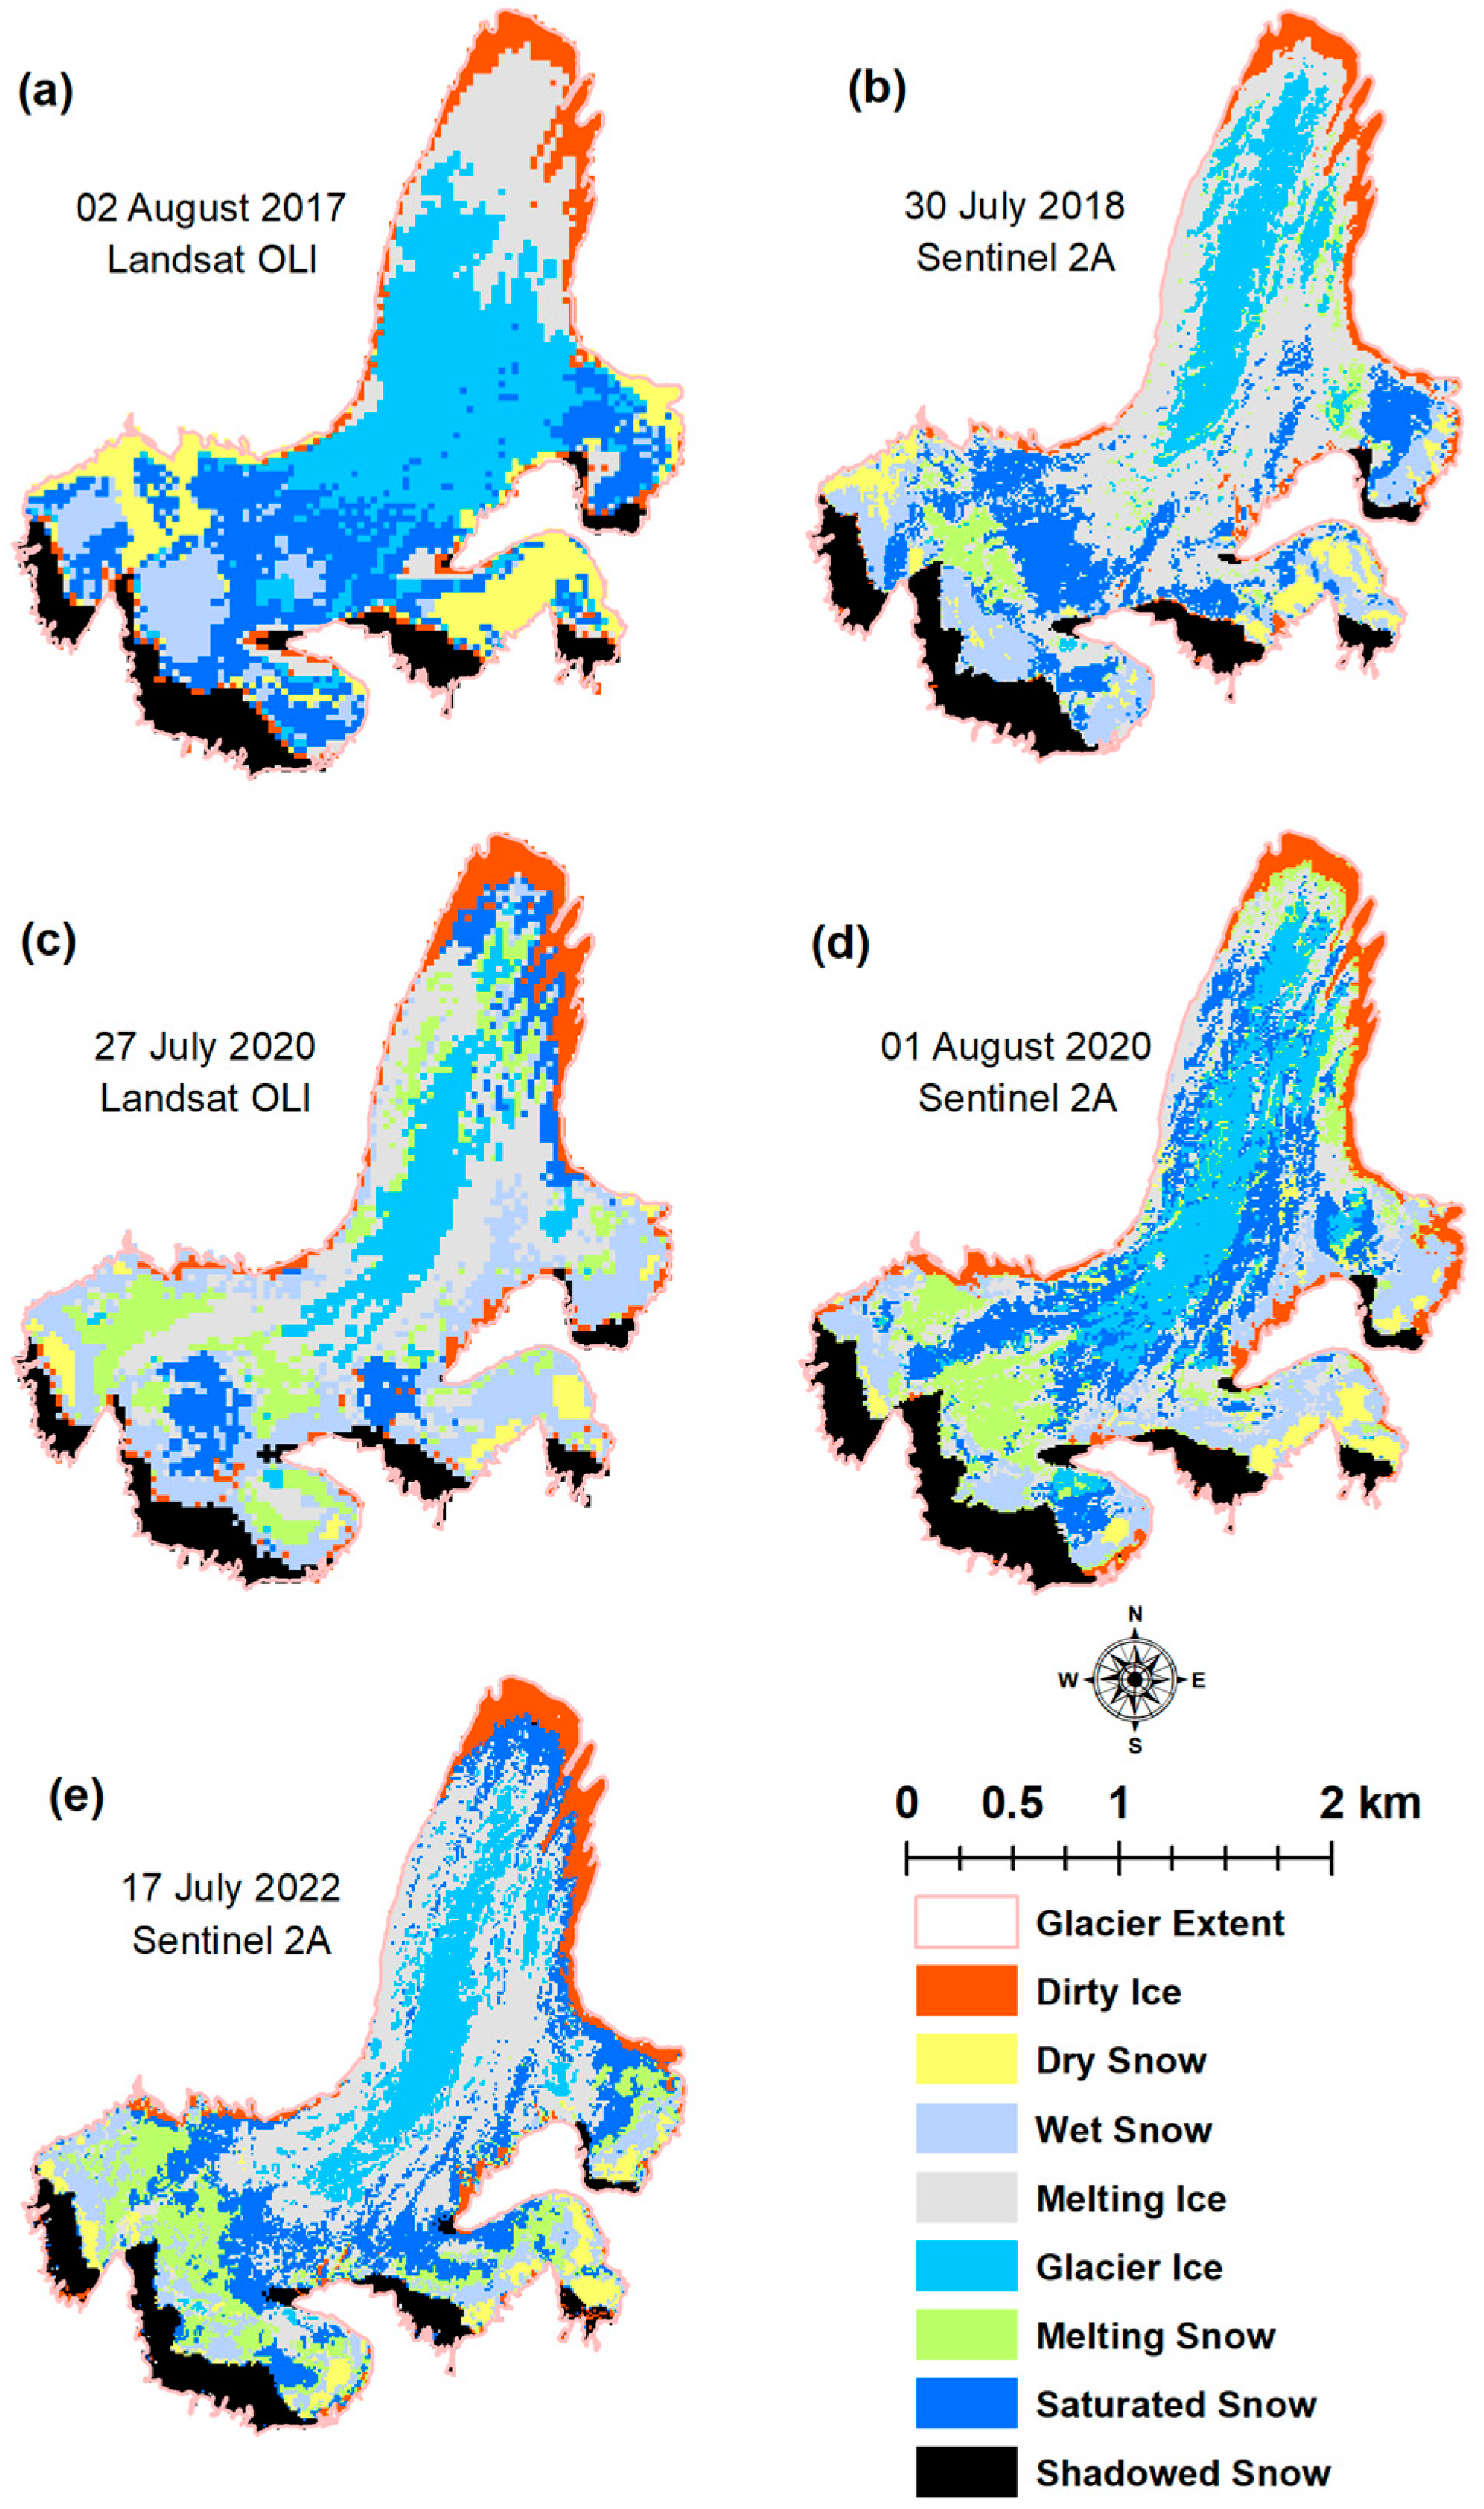
In this current analysis, we mapped glacier facies using L8C2L2 and S2AL2A imagery for assessing spatiotemporal variations in 2017–2022. Five GSF maps were produced, yielding different distributions of facies for each year. Table 2 displays the area per facies as a percentage.
Table 2.
Area per facies as a percentage for each year; 2020_L/S represent the individual Landsat/Sentinel-sensor-derived imagery for the year 2020.
From 2017 to 2022, we observe an overall increase in ablation facies. Melting ice and melting snow have increased in area by 16.05% and 10.66%, respectively. Most of this change can be suggested to have occurred because of the loss of glacier ice area to melting ice and a reduction in dry snow area to melting snow. This suggests that ML is increasing in melt facies and may most likely discharge this mass if the current trend continues to advance. For the year 2020, we analysed both L8C2L2 and S2AL2A images. Interestingly, we find that while wet snow and melting ice show a decrease in area by 10% in S2AL2A data, glacier ice and saturated snow show an overall increase in area, with saturated snow being the most affected, with an 8% increase in area. As the spectral bands of both sensors are almost similar, we speculate that spatial resolution plays a key role in determining the final maps of facies. In the case of very-high-resolution (VHR) imagery, we observe that spatial resolution improves object-based mapping because pixels can be combined to enhance homogeneity [8]. In this current study, we find that Sentinel 2A provides a better visualization and characterizability of facies. However, this may have occurred because ML is a relatively small glacier. On smaller glaciers, coarser pixels obscure much of the detail that can help identify training data for classification.
As this current study is a preliminary experiment for the long-term spatiotemporal mapping of glacier facies, we highlight key features for future research.
- Spectral signatures of facies are consistent and can be used across time to map facies [5,6]. However, spatial resolution is critical for determining the visibility of facies, especially for smaller glaciers. Although the Landsat archive provides an unparalleled repository for long-term monitoring, its spatial resolution can be challenging for targeting local, small, alpine glaciers.
- Although Landsat data can be pansharpened, we have observed, in previous experiments, that pansharpening distorts spectral information within the pixel [7,8,9]. Thus, while enhancing spatial resolution may improve the identification of facies, the distorted spectral information may misrepresent the facies, causing misclassification.
- In Sentinel 2A, only four spectral bands are of a 10 m spatial resolution; this suggests that the entire spectral range cannot be used as one dataset for mapping facies without a resampling of pixel dimensions. Another alternative could involve compiling individual bands with common spatial resolutions in separate datasets to map facies to avoid misrepresentation from spectral distortion.
- A limitation of this current study is lack of field data for the validation of thematic maps. However, our future research includes field validation of the thematic maps. Presently, we are focused on confronting these challenges by upscaling these methods at a Svalbard-wide scale.
- The availability of VHR data at a Svalbard-wide scale may help establish facies maps at a fine resolution and generate validation data for open-source thematic maps. Figure 3 displays the thematic classification of this study.Figure 3. GSF maps. (a) Landsat OLI map for 2017, (b) Sentinel 2A map for 2018, (c) Landsat OLI map for 2020, (d) Sentinel 2A map for 2020, (e) Sentinel 2A map for 2022.
- When performing long-term spatiotemporal analysis, cloud cover and illumination conditions determine the final set of images. In this current study, we could not obtain cloud-free data for 2019. Illumination at the time of scene capture determines the extent of shadow on the glacier body. Facies lying within shadow regions are difficult to identify, as the signature is distorted and can lead to misclassification [8]. Thus, we labelled this region as shadowed snow.
4. Conclusions
Spatiotemporal analyses of facies are important because the precision of distributed mass balance models relies on accurate spatial properties. The trends of accumulation and ablation facies act as reliable indicators of the evolution of a glacier. Mapping facies across time provides a robust assessment of the overall health of the glacier in addition to tracking the development of features such as supraglacial lakes and streams for resource and disaster management. Here, we presented a preliminary experiment to outline the challenges for conducting a long-term analysis of glacier facies. Utilizing Sentinel 2A Level 2 and Landsat OLI Collection 2 Level 2 data, we identified and characterized facies for the Midtre Lovénbreen glacier in Ny-Ålesund, Svalbard. The facies identified consist of dry snow, wet snow, melting snow, saturated snow, shadowed snow, glacier ice, melting ice, and dirty ice. Overall trends suggest that ablation facies such as melting ice and melting snow are increasing in their spatial distribution. The occurrence of facies needs to be monitored for a longer time span to identify robust trends. The challenges for spatiotemporal mapping consist of cloud cover, scene illumination, spatial resolution, spectral resolution, and the availability of field data. Our future research will involve mapping facies across larger time periods. These current results highlight important factors for conducting long-term analyses of facies and will play a critical role in upcoming experiments.
Author Contributions
Conceptualization, S.D.J. and S.F.W.; methodology, S.D.J., S.F.W., P.H.P. and K.B.; software, S.D.J., S.F.W., P.H.P. and K.B.; validation, S.D.J., S.F.W., P.H.P. and K.B.; formal analysis, S.D.J., S.F.W., P.H.P. and K.B.; investigation, S.D.J., S.F.W., P.H.P. and K.B.; resources, S.D.J., S.F.W., P.H.P. and K.B.; data curation, S.D.J., S.F.W., P.H.P. and K.B.; writing—original draft preparation, S.D.J., S.F.W., P.H.P. and K.B.; writing—review and editing, S.D.J., S.F.W., P.H.P. and K.B.; visualization, S.D.J. and S.F.W.; supervision, S.D.J. and K.B.; project administration, S.D.J. and K.B. All authors have read and agreed to the published version of the manuscript.
Funding
This research received no external funding.
Institutional Review Board Statement
Not applicable.
Informed Consent Statement
Not applicable.
Data Availability Statement
All Sentinel-2 data are freely available from the Copernicus Data Space Environment. Sentinel 2A Level 2A Data download: https://dataspace.copernicus.eu/ (accessed on 28 January 2023). Landsat 8 OLI data are available from the U.S. Geological Survey. See USGS Visual Identity System Guidance (https://www.usgs.gov/information-policies-and-instructions/copyrights-and-credits) (accessed on 28 January 2023) for further details.
Acknowledgments
We thank HOD, the Department of Civil Engineering, MIT, and the Director of MIT for their encouragement. We also thank HOD, the Department of Geography and Research Centre, PCCAS, and the Principal of PCCAS for their support.
Conflicts of Interest
The authors declare no conflicts of interest.
References
- Braun, M.; Schuler, T.V.; Hock, R.; Brown, I.; Jackson, M. Comparison of remote sensing derived glacier facies maps with distributed mass balance modelling at Engabreen, Northern Norway. IAHS Publ. Ser. Proc. Rep. 2007, 318, 126–134. [Google Scholar]
- Mitkari, K.V.; Arora, M.K.; Tiwari, R.K.; Sofat, S.; Gusain, H.S.; Tiwari, S.P. Large-Scale Debris Cover Glacier Mapping Using Multisource Object-Based Image Analysis Approach. Remote Sens. 2022, 14, 3202. [Google Scholar] [CrossRef] [Scilit]
- Haq, M.A.; Alshehri, M.; Rahaman, G.; Ghosh, A.; Baral, P.; Shekhar, C. Snow and glacial feature identification using Hyperion dataset and machine learning algorithms. Arab. J. Geosci. 2021, 14, 1525. [Google Scholar] [CrossRef] [Scilit]
- Garg, V.; Thakur, P.K.; Rajak, D.R.; Aggarwal, S.P.; Kumar, P. Spatio-temporal changes in radar zones and ELA estimation of glaciers in Ny-Ålesund using Sentinel-1 SAR. Polar Sci. 2022, 31, 100786. [Google Scholar] [CrossRef] [Scilit]
- Pope, A.; Rees, G. Using in situ spectra to explore Landsat classification of glacier surfaces. Int. J. Appl. Earth Obs. Geoinf. 2014, 27, 42–52. [Google Scholar] [CrossRef] [Scilit]
- Pope, A.; Rees, W.G. Impact of spatial, spectral, and radiometric properties of multispectral imagers on glacier surface classification. Remote Sens. Environ. 2014, 141, 1–13. [Google Scholar] [CrossRef] [Scilit]
- Jawak, S.D.; Wankhede, S.F.; Luis, A.J.; Balakrishna, K. Impact of Image-Processing Routines on Mapping Glacier Surface Facies from Svalbard and the Himalayas Using Pixel-Based Methods. Remote Sens. 2022, 14, 1414. [Google Scholar] [CrossRef] [Scilit]
- Jawak, S.D.; Wankhede, S.F.; Luis, A.J.; Balakrishna, K. Effect of Image-Processing Routines on Geographic Object-Based Image Analysis for Mapping Glacier Surface Facies from Svalbard and the Himalayas. Remote Sens. 2022, 14, 4403. [Google Scholar] [CrossRef] [Scilit]
- Jawak, S.D.; Wankhede, S.F.; Luis, A.J.; Balakrishna, K. Multispectral Characteristics of Glacier Surface Facies (Chandra-Bhaga Basin, Himalaya, and Ny-Ålesund, Svalbard) through Investigations of Pixel and Object-Based Mapping Using Variable Processing Routines. Remote Sens. 2022, 14, 6311. [Google Scholar] [CrossRef] [Scilit]
- King, E.; Smith, A.; Murray, T.; Stuart, G. Glacier-bed characteristics of midtre Lovénbreen, Svalbard, from high-resolution seismic and radar surveying. J. Glaciol. 2008, 54, 145–156. [Google Scholar] [CrossRef] [Scilit]
- Porter, C.; Morin, P.; Howat, I.; Noh, M.-J.; Bates, B.; Peterman, K.; Keesey, S.; Schlenk, M.; Gardiner, J.; Tomko, K.; et al. “ArcticDEM”, Harvard Dataverse, V1. 2018. Available online: https://www.pgc.umn.edu/data/arcticdem/ (accessed on 13 March 2022).
- Jawak, S.D.; Wankhede, S.F.; Luis, A.J. Explorative Study on Mapping Surface Facies of Selected Glaciers from Chandra Basin, Himalaya Using World, View-2 Data. Remote Sens. 2019, 11, 1207. [Google Scholar] [CrossRef] [Scilit]
- Shukla, A.; Ali, I. A hierarchical knowledge-based classification for glacier terrain mapping: A case study from Kolahoi Glacier, Kashmir Himalaya. Ann. Glaciol. 2016, 57, 1–10. [Google Scholar] [CrossRef] [Scilit]

Disclaimer/Publisher’s Note: The statements, opinions and data contained in all publications are solely those of the individual author(s) and contributor(s) and not of MDPI and/or the editor(s). MDPI and/or the editor(s) disclaim responsibility for any injury to people or property resulting from any ideas, methods, instructions or products referred to in the content. |
© 2023 by the authors. Licensee MDPI, Basel, Switzerland. This article is an open access article distributed under the terms and conditions of the Creative Commons Attribution (CC BY) license (https://creativecommons.org/licenses/by/4.0/).