1. Introduction
Reforestation plays a vital role in addressing climate change and preserving biodiversity, and reforestation projects yield positive socio-economic impacts, increasing employment and fostering community engagement by enriching local ecosystems. However, the success rate of reforestation depends on factors like site conditions, species selection, and effective management.
This study introduces an innovative approach to tree health prediction and continuous monitoring, integrating high-resolution satellite imagery, historical data, and meteorological insights. We compute key vegetation and meteorological indices to establish customized growing conditions. Time series models further enhance our understanding of growing conditions and facilitate informed site selection for reforestation initiatives.
The flexibility of our framework allows it to thrive in various situations, enabling well-informed choices in reforestation and land management. This adaptability, coupled with strategic planning and data-driven approaches, leads to high success rates. By leveraging the predictive power of the Normalized Difference Vegetation Index (NDVI), temperature, and precipitation, we effectively forecast NDVI up to six months in advance, enabling decision makers to adjust the management of the plots before the site conditions worsen.
This integrated approach offers a user-friendly means for stakeholders to assess tree health and stress levels, contributing to precise and sustainable environmental interventions. It emphasizes the value of data synergy and predictive modelling in advancing sustainable practices and ecological resilience.
2. Data Acquisition and Preparation
2.1. Software Tools and Libraries
Open source tools like the Google Earth Engine [
1], Facebook Prophet [
2], and xclim [
3]: Climate Services Library were instrumental in conducting our study. The Google Earth Engine, a planetary-scale geospatial analysis tool, provided the platform for processing and analysing satellite data, enabling the calculation of vegetation indices and meteorological parameters. Facebook Prophet, a library for time series forecasting, was utilized to analyse temperature and precipitation patterns, aiding in the prediction of future weather conditions. xclim: Climate Services Library contributed to downscaled ERA5 data [
4], facilitating the calculation of climate and weather indicators.
2.2. Data Collection Sources
Copernicus Sentinel 2 [
5], spanning from September 2015 to April 2023, provided satellite imagery for vegetation analysis. Planet NICFI, high-resolution satellite data covering the period from September 2020 to April 2023, contributed to the dataset for surface reflectance and vegetation indices. Copernicus ERA5, spanning from September 2015 to April 2023, supplied the meteorological and climate assimilation data required for the analysis. Additionally, data from reforestation projects, including the ECOSIA/TBSE-Ambatotsirongorongo protected area reforestation project, Bôndy Reforestation plots, and Tree-Nation Alamanga Reforestation project, were collected to gain insights into tree planting and site-specific information, enhancing the accuracy and applicability of the study’s findings.
2.3. Study Area
The site selection process in Madagascar involved identifying different reforestation sites, each with its own unique characteristics and objectives (see
Figure 1).
Site 1 is a large-scale project managed by Tree-Nation, which has been replanting the area with a variety of tree species since 2016. Over several years of reforestation efforts, this site has become the oldest among the selected sites, offering valuable insights into long-term tree growth and ecosystem development.
Site 2 focuses on mangrove and semi-wet species and was planted between 2020 and 2021. This site is managed by Bôndy, an organization dedicated to reforestation efforts. By specifically targeting mangrove and semi-wet species, this site contributes to the restoration and preservation of crucial coastal ecosystems in Madagascar.
Site 3 comprises scattered reforestation plots, also managed by Bôndy and planted between 2020 and 2021. The distribution of reforestation plots allows for a broader coverage of the area, enhancing biodiversity and ecosystem services. This approach recognizes the importance of restoring forests across various locations, promoting connectivity and ecological resilience.
Site 4 is part of a large rural restoration plan led by ECOSIA in collaboration with TBSE. In 2022, the project started planning the rollout of replanting previously logged sites, to be fully restored by 2025. This initiative addresses the restoration of degraded areas, aiming to reestablish healthy and thriving forests while supporting rural communities and sustainable land management practices.
The selection of these sites in Madagascar reflects the diverse approaches and strategies employed by different organizations to address reforestation challenges in various ecological contexts. By considering factors such as species diversity, ecosystem type, and restoration objectives, these sites contribute to the broader goal of ecological restoration and sustainable land use practices in Madagascar.
3. Methodology
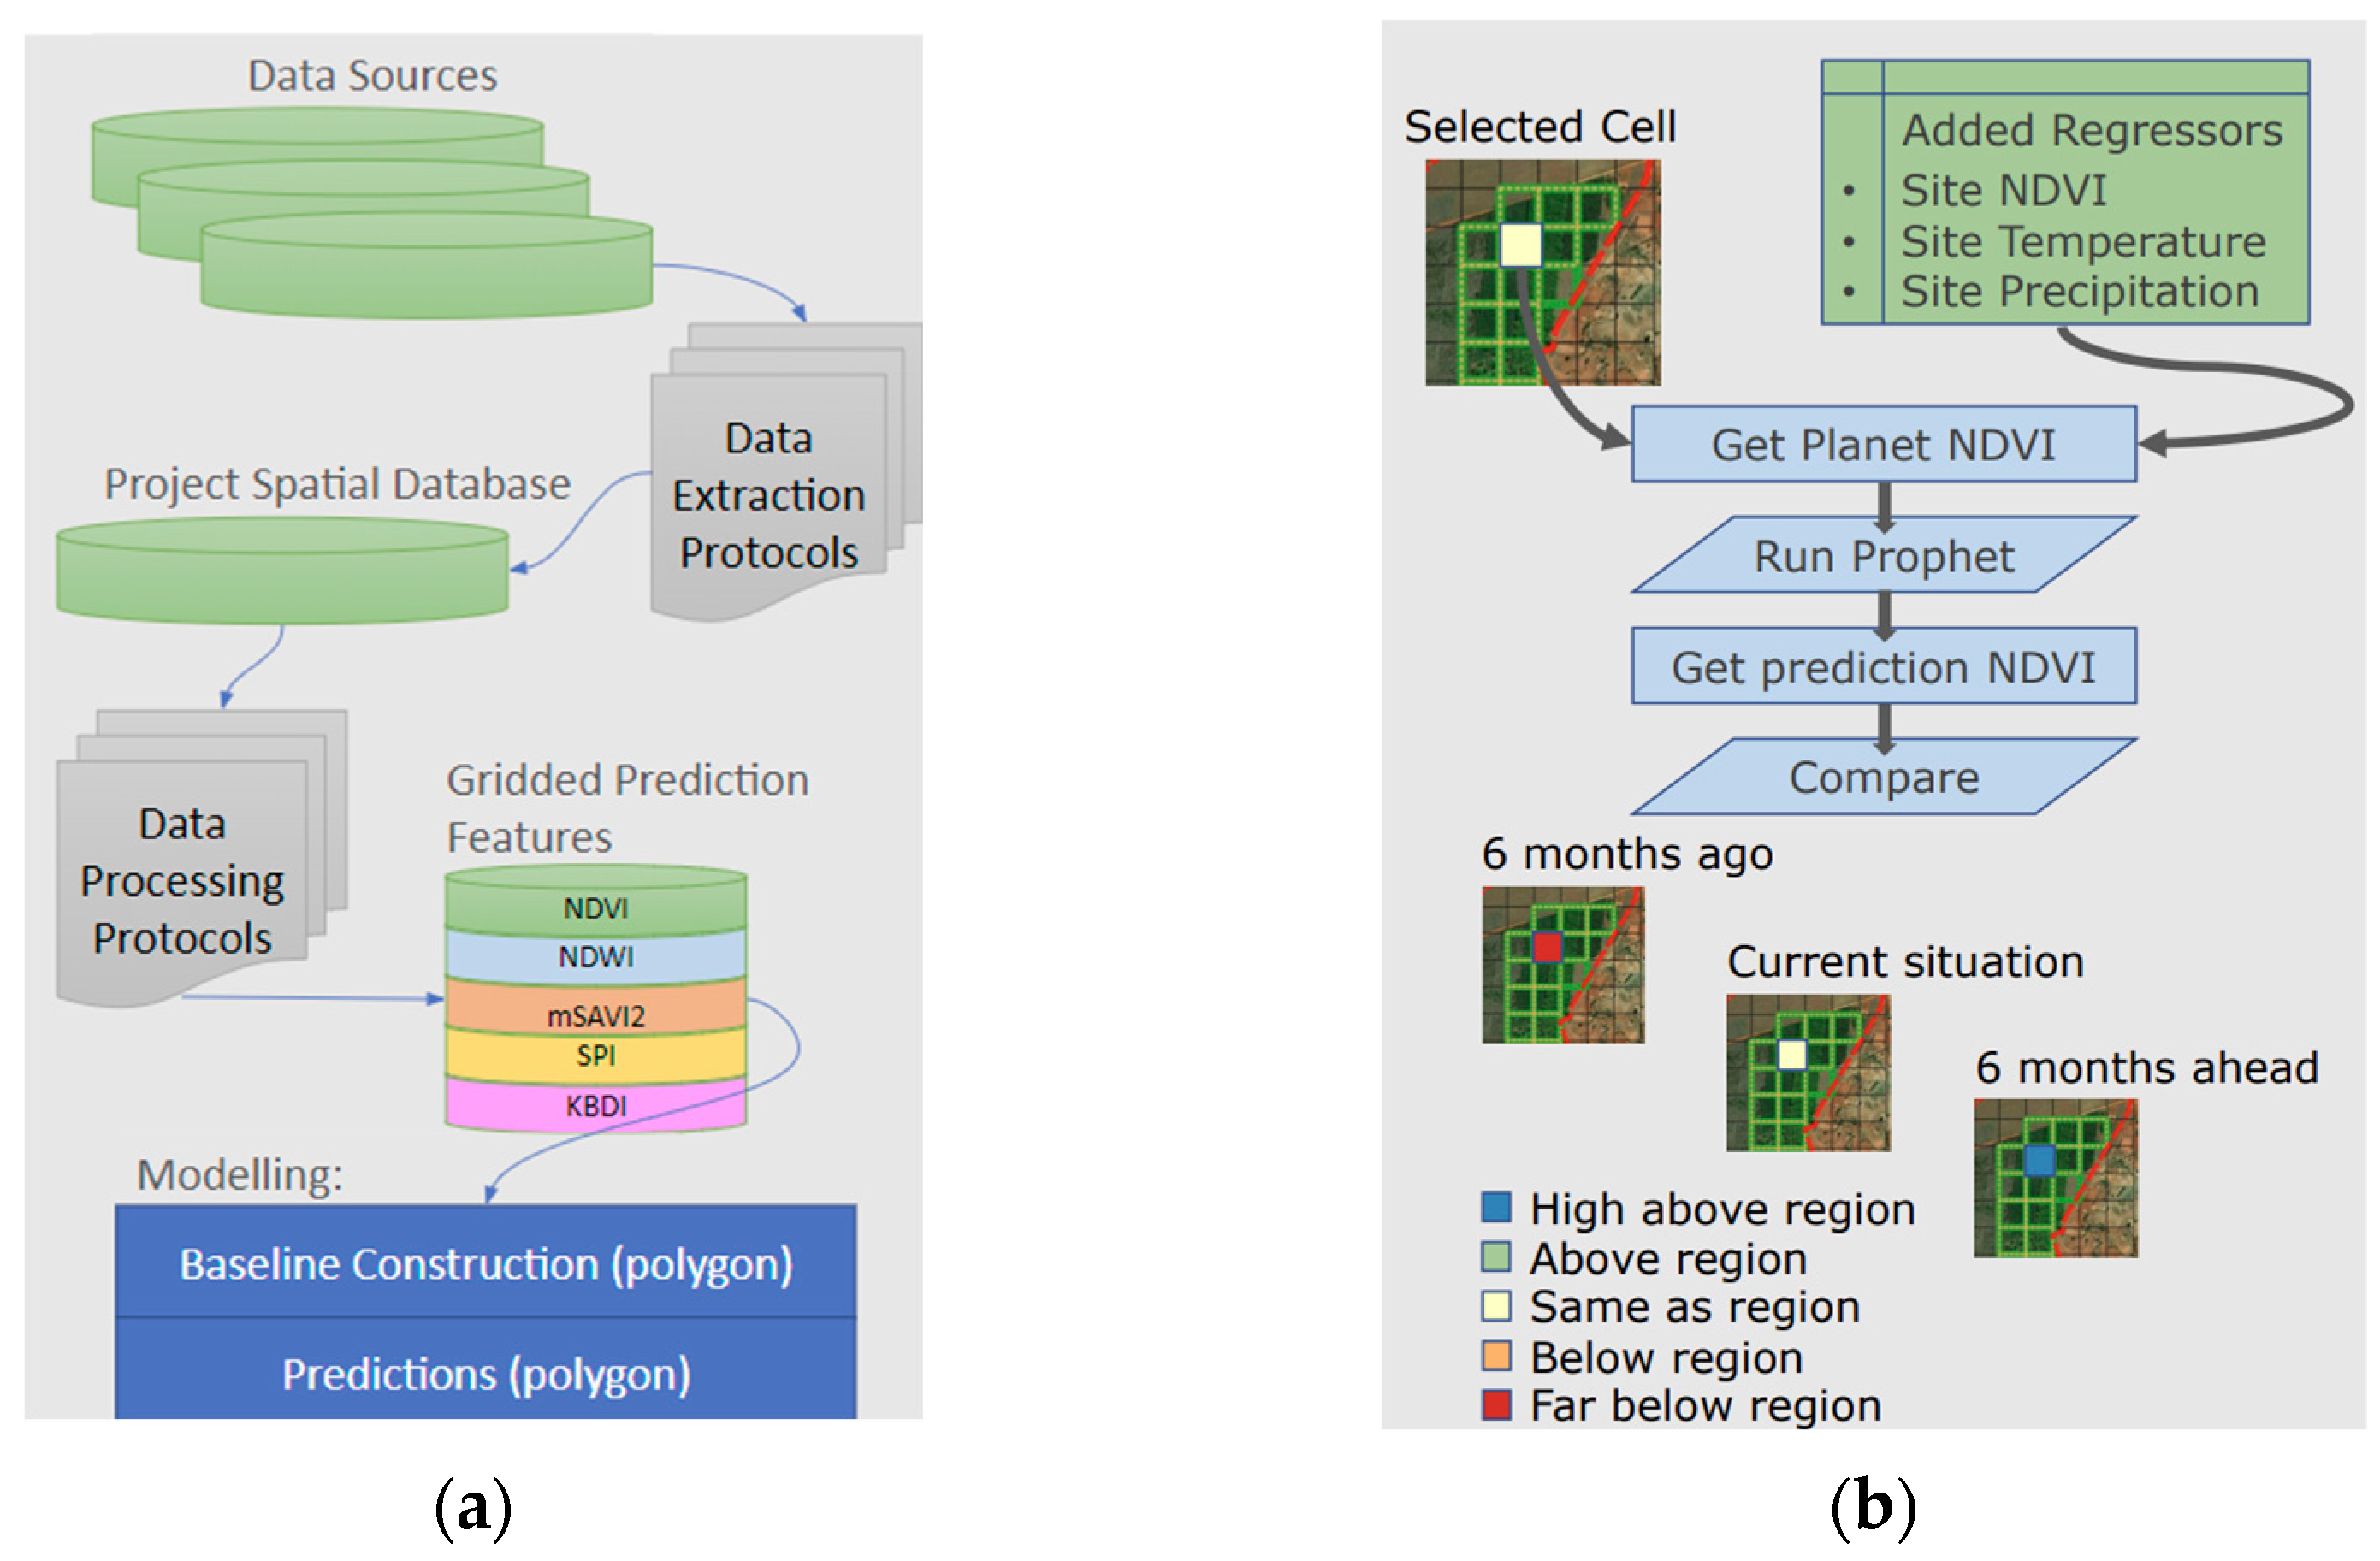
The methodology utilized in this study comprised several key steps. Firstly, satellite data were acquired from two sources, namely Copernicus (Sentinel 2 using GEE) and Planet (using QGIS plugin). Additionally, meteorological and climate assimilation data were obtained from the Copernicus Climate Data Store (ERA5). Information related to reforestation, including the number of trees planted and dates, was also acquired. The next phase involved data preparation and transformation. Vegetation indices such as NDVI, NDWI, and mSAVI-2 were calculated, along with meteorological indices like SPI and KBDI (
Figure 2a). Baseline data were constructed using Facebook Prophet for the year 2017, serving as a reference for future analysis. An automatic forecasting procedure was implemented using the constructed baseline. To assess vegetation health, the predicted NDVI for a specific site was compared with the average NDVI of the location, serving as a benchmark. Three control points were considered: the current month (March 2023—P2), six months in the past (September 2022—P1), and six months in the future (September 2023—P3). These comparisons provide valuable insights into the vegetation’s health and changes over time (
Figure 2b).
4. Analysis
The Planet-NICFI monthly surface reflectance and vegetation indices were calculated and averaged to a 100 m grid, enabling effective site comparison. The three selected vegetation indices were utilized to assess different aspects of vegetation health. The NDVI (Normalized Difference Vegetation Index) was employed to identify areas with deep vegetation, focusing on values higher than 0.6. This threshold allowed for the identification of regions with robust and thriving vegetation cover. Additionally, the NDWI (Normalized Difference Water Index) was utilized to avoid areas experiencing deep droughts, with values higher than −0.5 indicating healthier moisture levels. Finally, the mSAVI-2 (modified Soil-Adjusted Vegetation Index) was employed to detect early stages of crop development, with values higher than 0.6 indicating the presence of young and growing crops. These vegetation indices and their respective thresholds provided valuable insights into the health and development stages of vegetation across the analysed sites (
Figure 3).
To calculate the KBDI (Keetch–Byram Drought Index [
6]) and SPI (Standardized Precipitation Index [
7]), as the climate and weather indicators, the temperature and precipitation in the hourly ERA5 Global Climate and Weather reanalysis data were downscaled using two different methods: the temperature was corrected using the JAXA 30 m Digital Elevation Model (DEM) to account for the temperature difference between the average elevation (in ERA5) and the height in the DEM (at 30 m), and the precipitation was downscaled using a simple smoothing (spline) function at a higher spatial resolution (1 km) and using the nearest precipitation value as input for the model.
Downscaling the ERA5 data proved crucial for this study, significantly enhancing the precision of the KBDI and SPI indices, particularly in regions characterized by an intricate topography (
Figure 4a). These downscaled datasets were subsequently employed in computing the KBDI and SPI indices and played a pivotal role in forecasting precipitation and temperature at four specific sites, utilising time series models developed with the Facebook Prophet library (
Figure 4b). The KBDI index, a widely acknowledged metric for evaluating drought conditions, necessitated the utilisation of downscaled ERA5 data. Furthermore, the SPI was determined using two distinct time scales: SPI-03, which incorporates a three-month smoothing approach, and SPI-24, which employs a two-year smoothing approach.
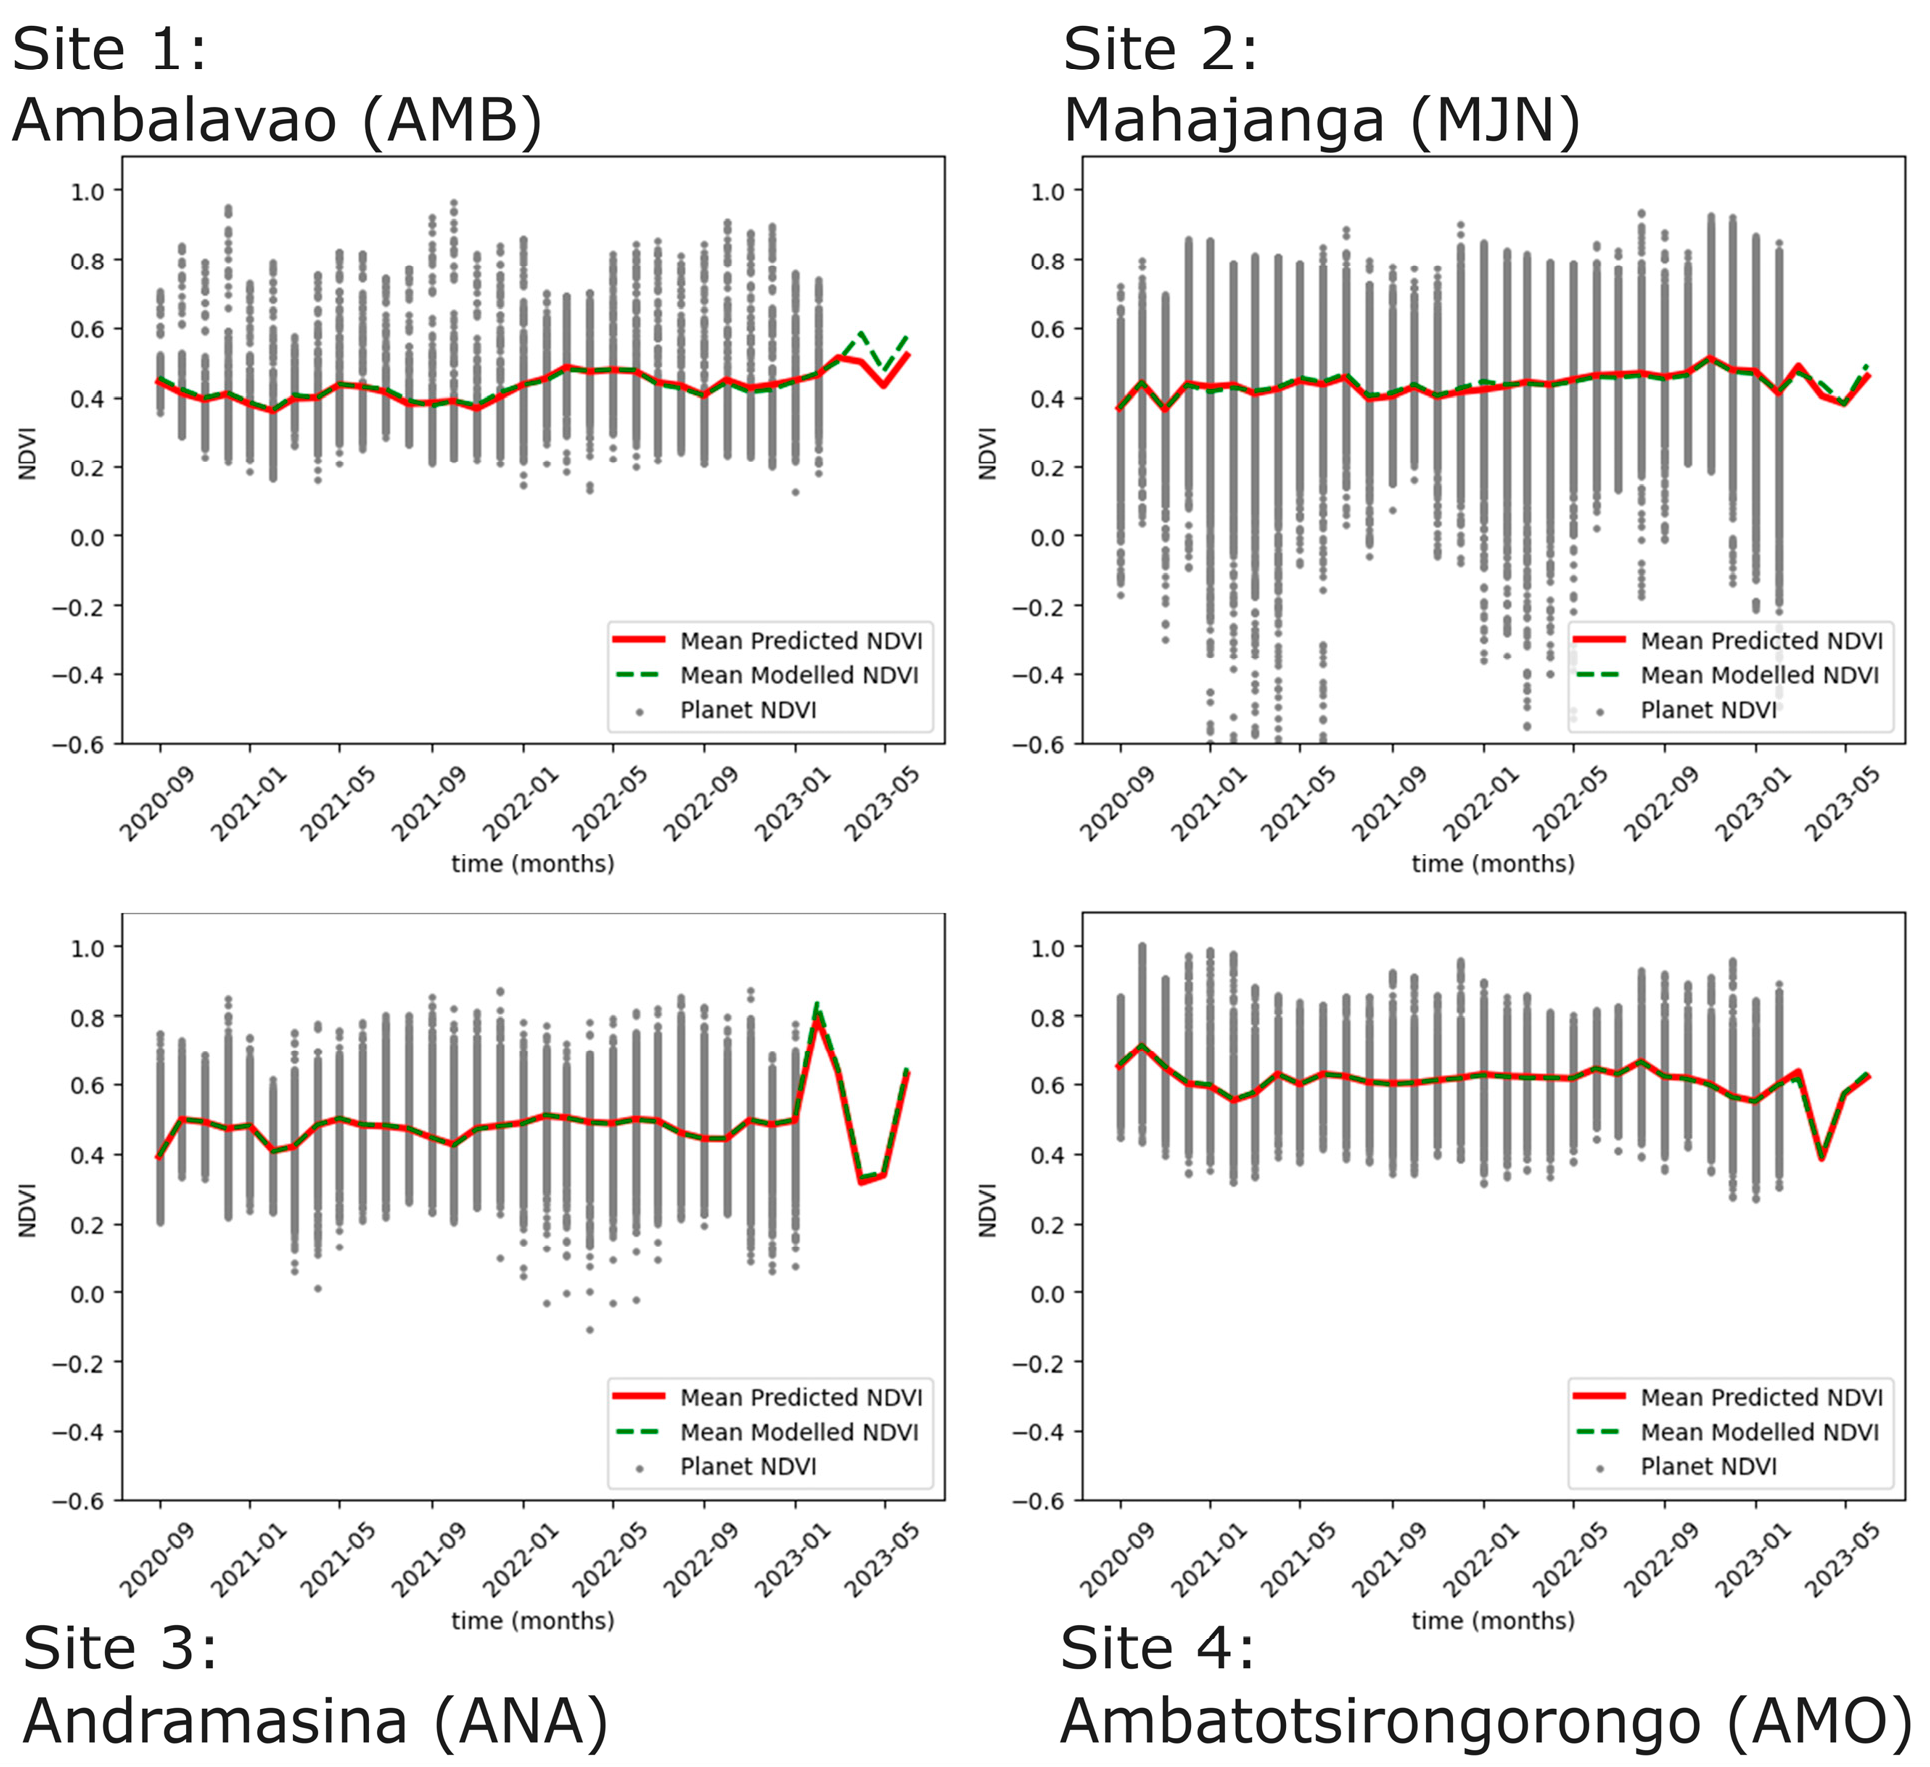
Using PlanetScope [
8] (visual and surface reflectance basemaps), the NDVI was predicted. The average NDVI for all four test cases remained relatively constant at around 0.4. Incorporating Sentinel 2 data expanded the time series from September 2020 to January 2019, improving data stability. However, predicting NDVI six months into the future with the available time period posed challenges. Despite this, the integration of multiple data sources provided valuable insights into vegetation dynamics and health (
Figure 5).
5. Results and Findings
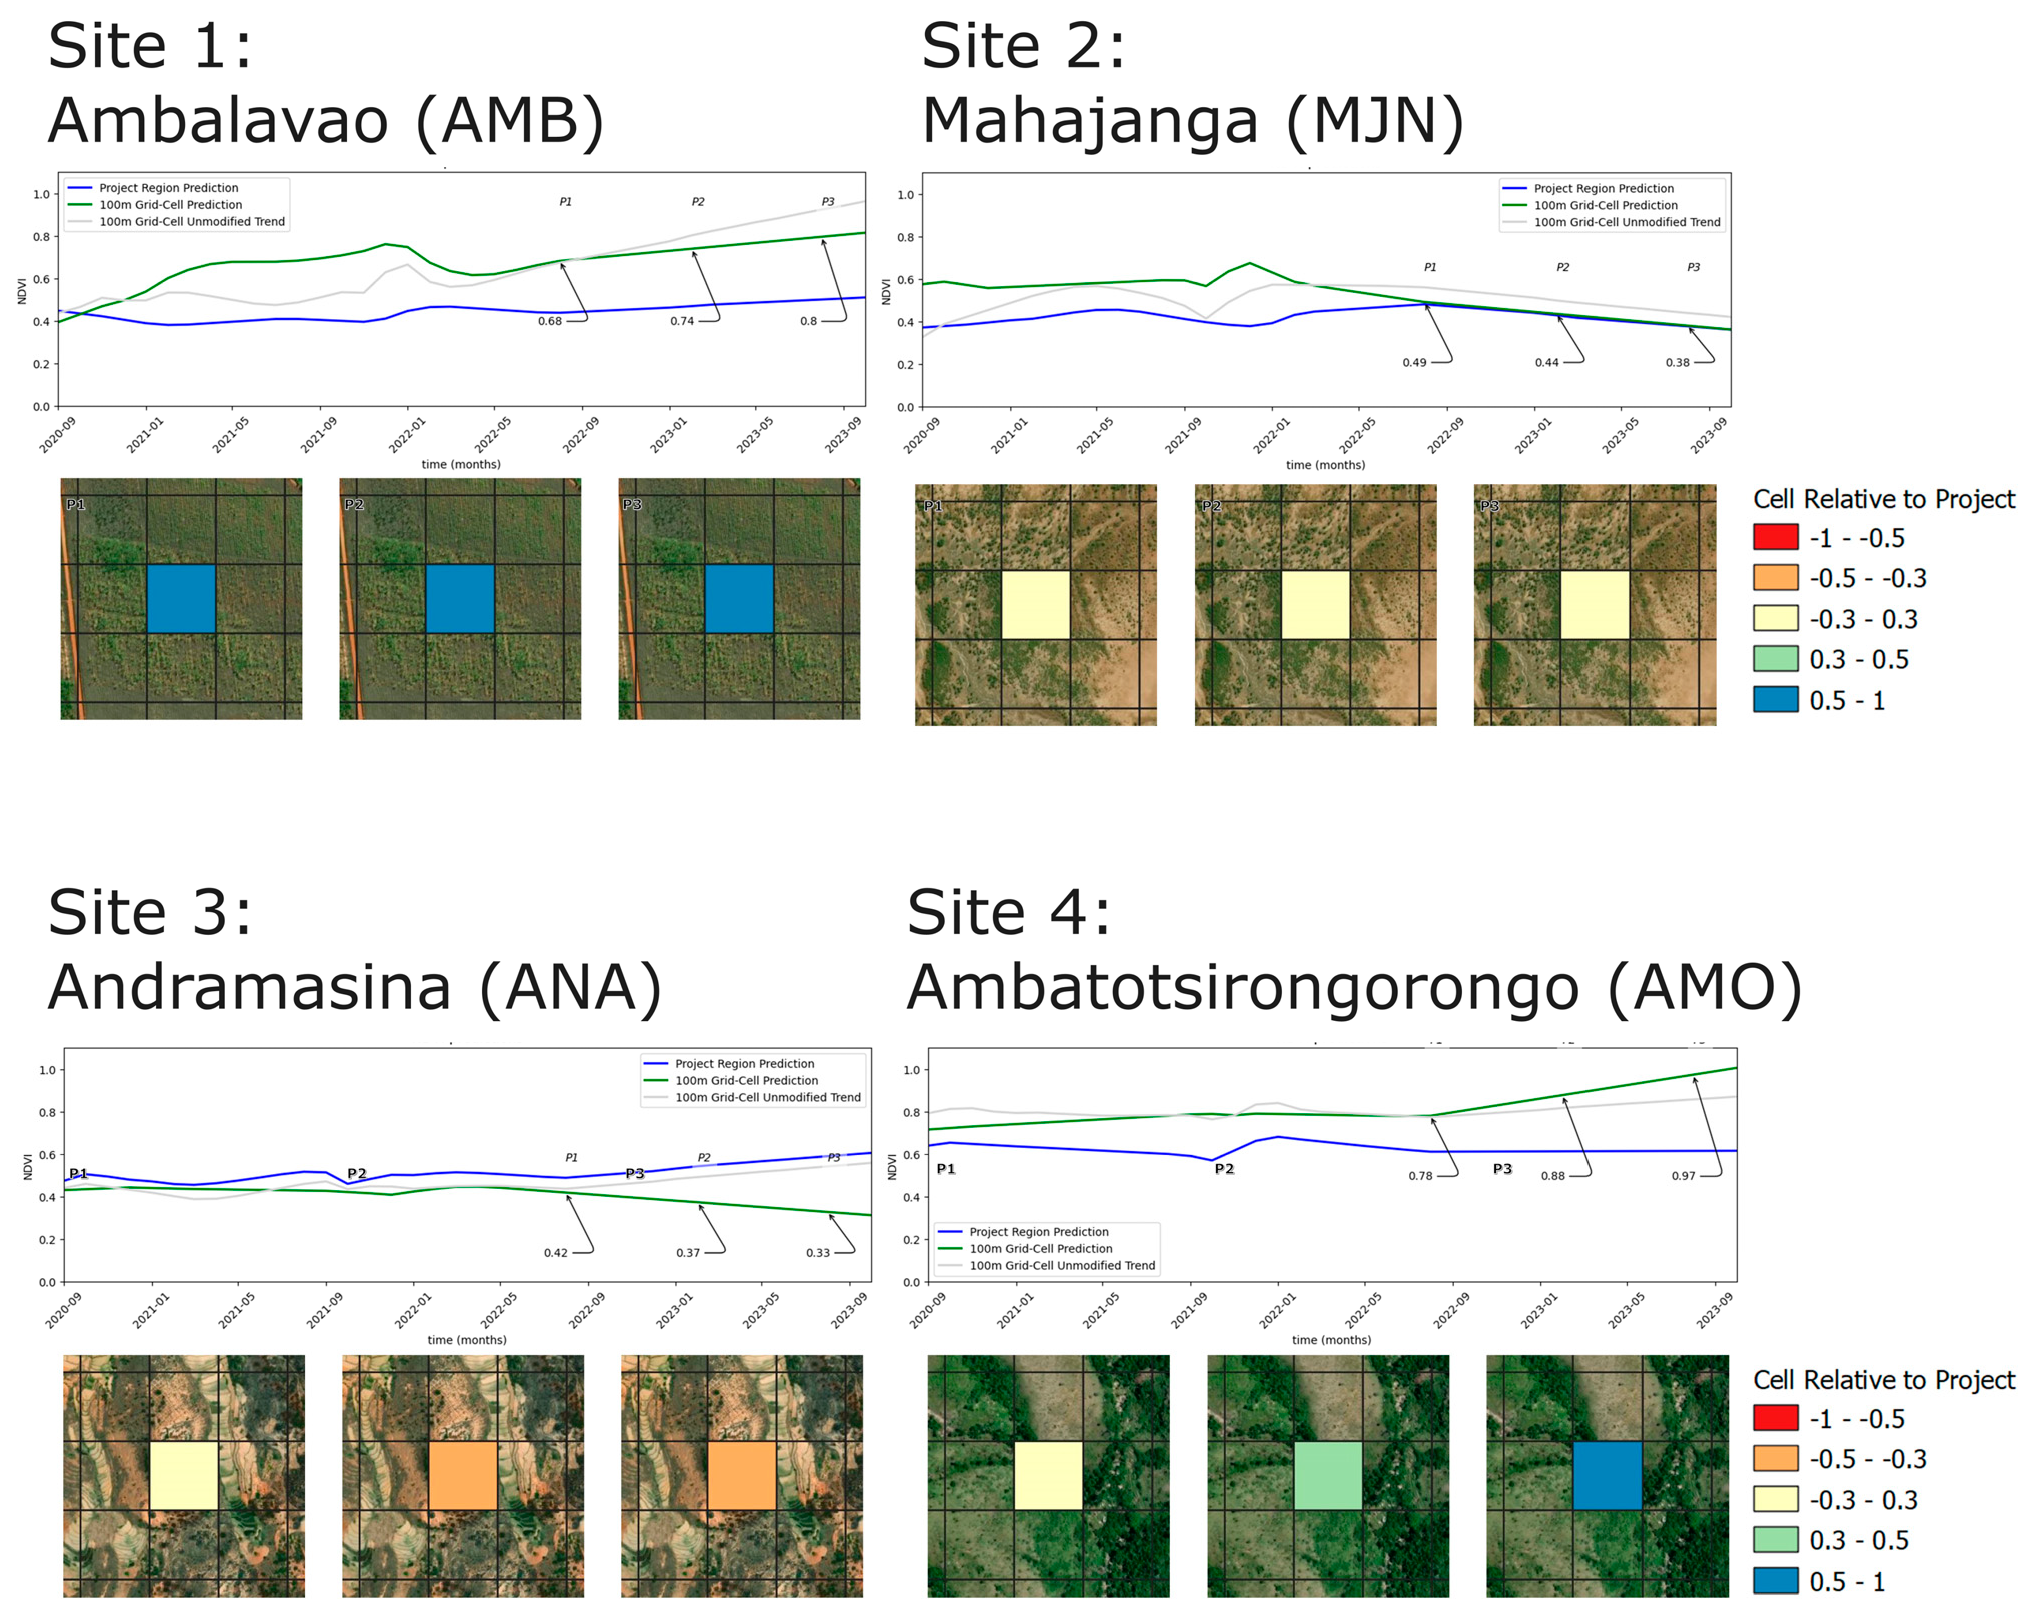
The proposed workflow offers a versatile framework for regional forecasting which is adaptable to different sites and scenarios. While three vegetation indices are derived from satellite data, only NDVI is utilized as a predictor of tree health and stress due to its strong signal across the selected sites (
Figure 6). Meteorological indicators such as SPI and KBDI provide insights into site-specific weather patterns, but currently, they are not integrated as regressors in the prediction. This is because the SPI exhibits excessive noise, while KBDI lacks clear seasonality. The findings indicate that by employing Facebook Prophet and combining NDVI, temperature, and precipitation as regressors, a straightforward approach for predicting NDVI six months in advance is achieved. This enables effective planning and decision-making in agriculture, land management, and reforestation programs.
6. Conclusions
By integrating data-driven approaches, such as satellite imagery and meteorological data, into reforestation efforts, we can effectively monitor and predict tree health.
This proposed workflow showcases the effective utilization of diverse data sources and tools to forecast NDVI six months in advance. Although data preparation can be time-consuming, the incorporation of Facebook Prophet and the combination of NDVI, temperature, and precipitation predictions as regressors yielded favourable results. The straightforward approach of comparing the site’s NDVI with the regional average allowed for direct sub-regional comparisons.
Overall, this workflow holds promise for predicting NDVI in various areas within a specified timeframe, while also highlighting the value of Facebook Prophet in forecasting and regression analysis. Moving forward, further research and development will focus on enhancing the accuracy and precision of predictions. This includes expanding the workflow to encompass larger regions, incorporating additional vegetation indices that exhibit strong signals at specific sites, and integrating more data sources or extending the time series for improved analysis. It is our intention to collaborate with field teams in validating the method through ground truthing the forest tree growth by exploring the inventories to create a benchmark database for the predictions.
Author Contributions
Conceptualization, G.v.d.D. and D.B.; methodology, G.v.d.D. and D.B.; validation, G.v.d.D. and D.B.; formal analysis, G.v.d.D. and D.B.; writing—review and editing, G.v.d.D. and D.B.; visualization, G.v.d.D. and D.B. All authors have read and agreed to the published version of the manuscript.
Funding
This research received no external funding.
Informed Consent Statement
Informed consent was obtained from all subjects involved in the study.
Data Availability Statement
The data utilized in this study is readily available through various sources. Specifically, the metrological data spanning from September 2015 to April 2023 was obtained from Copernicus ERA5 [
4], while Sentinel 2 satellite imagery covering the same period was obtained from Copernicus website [
5]. Additionally, data from Planet NICFI, focusing on the period from September 2020 to April 2023, were also utilized [
8]. These datasets are openly available and can be accessed for further analysis and validation purposes.
Acknowledgments
We would like to thank the ECOSIA/TBSE-Ambatotsirongorongo protected area reforestation project and Bôndy Reforestation for their willingness to share the reforestation plots and timelines of reforestation.
Conflicts of Interest
The authors declare no conflicts of interest.
References
- Gorelick, N.; Hancher, M.; Dixon, M.; Ilyushchenko, S.; Thau, D.; Moore, R. Google Earth Engine: Planetary-scale geospatial analysis for everyone. Remote Sens. Environ. 2017, 202, 18–27. [Google Scholar] [CrossRef]
- Taylor, S.J.; Letham, B. Forecasting at scale. Am. Stat. 2018, 72, 37–45. [Google Scholar] [CrossRef]
- Bourgault, P.; Huard, D.; Smith, T.J.; Logan, T.; Aoun, A.; Lavoie, J.; Dupuis, É.; Rondeau-Genesse, G.; Alegre, R.; Barnes, C.; et al. xclim: Xarray-based climate data analytics. J. Open Source Softw. 2023, 8, 5415. [Google Scholar] [CrossRef]
- Muñoz Sabater, J. ERA5-Land Hourly Data from 1950 to Present. Copernicus Climate Change Service (C3S) Climate Data Store (CDS). 2019. Available online: https://doi.org/10.24381/cds.e2161bac (accessed on 29 September 2023).
- Copernicus Sentinel Data 2015–2023, Retrieved from Google Earth Engine [1] (2023), Processed by ESA. Available online: https://oceancolor.gsfc.nasa.gov/resources/how-to-cite/sentinel-eula/ (accessed on 29 September 2023).
- Finkele, K.; Mills, G.; Beard, G.; Jones, D. National gridded drought factors and comparison of two soil moisture deficit formulations used in prediction of Forest Fire Danger Index in Australia. Aust. Meteorol. Mag. 2006, 55, 183–197. [Google Scholar]
- McKee, T.B.; Doesken, N.J.; Kleist, J. The Relationship of Drought Frequency and Duration to Time Scales. In Proceedings of the 8th Conference on Applied Climatology, Anaheim, CA, USA, 17–22 January 1993; American Meteorological Society: Boston, MA, USA, 1993. [Google Scholar]
- Mouselimis, L. PlanetNICFI: Processing of the ‘Planet NICFI’ Satellite Imagery Using R. R Package Version 1.0.4 Using Imagery 2021 Planet Labs Inc. All Use Subject to the Participant License Agreement. 2022. Available online: https://CRAN.R-project.org/package=PlanetNICFI (accessed on 29 September 2023).
| Disclaimer/Publisher’s Note: The statements, opinions and data contained in all publications are solely those of the individual author(s) and contributor(s) and not of MDPI and/or the editor(s). MDPI and/or the editor(s) disclaim responsibility for any injury to people or property resulting from any ideas, methods, instructions or products referred to in the content. |
© 2023 by the authors. Licensee MDPI, Basel, Switzerland. This article is an open access article distributed under the terms and conditions of the Creative Commons Attribution (CC BY) license (https://creativecommons.org/licenses/by/4.0/).


