1. Introduction
Seagrass ecosystems support rich marine biodiversity and are among the most productive ecosystems in the world, providing a wide range of ecological services such as nutrient cycling, erosion control, sediment stabilization, and habitats for numerous species [
1]. Furthermore, they sequester and store substantial quantities of carbon, referred to as blue carbon. They are able to capture up to 35 times faster than tropical rainforests [
2]. Nevertheless, various anthropogenic threats such as coastal development, water pollution, destructive fishing practices, and climate change are causing an accelerated loss of these valuable ecosystems. In fact, 29% of the known areal extent has disappeared since seagrass areas were initially recorded in 1879 [
3].
Monitoring these ecosystems is, therefore, of paramount importance in order to define protected areas and carry out management and conservation tasks. While traditional in situ monitoring methods provide accurate results, they are frequently hindered by their expense, significant time consumption, and restricted coverage area. In response to those limitations, there has been a growing interest in leveraging satellite imagery as a cost-effective and large-scale alternative for monitoring these ecosystems [
4,
5].
Regarding the Canary Islands (Spain), an archipelago situated off the northwest coast of Africa, it is well known that the most common seagrass specie is the Cymodocea nodosa.
Therefore, the main objective of this research is to evaluate the ability of Sentinel-2 satellite data to map C. nodosa using machine learning algorithms and assess blue carbon stocks within the study area.
2. Materials and Methods
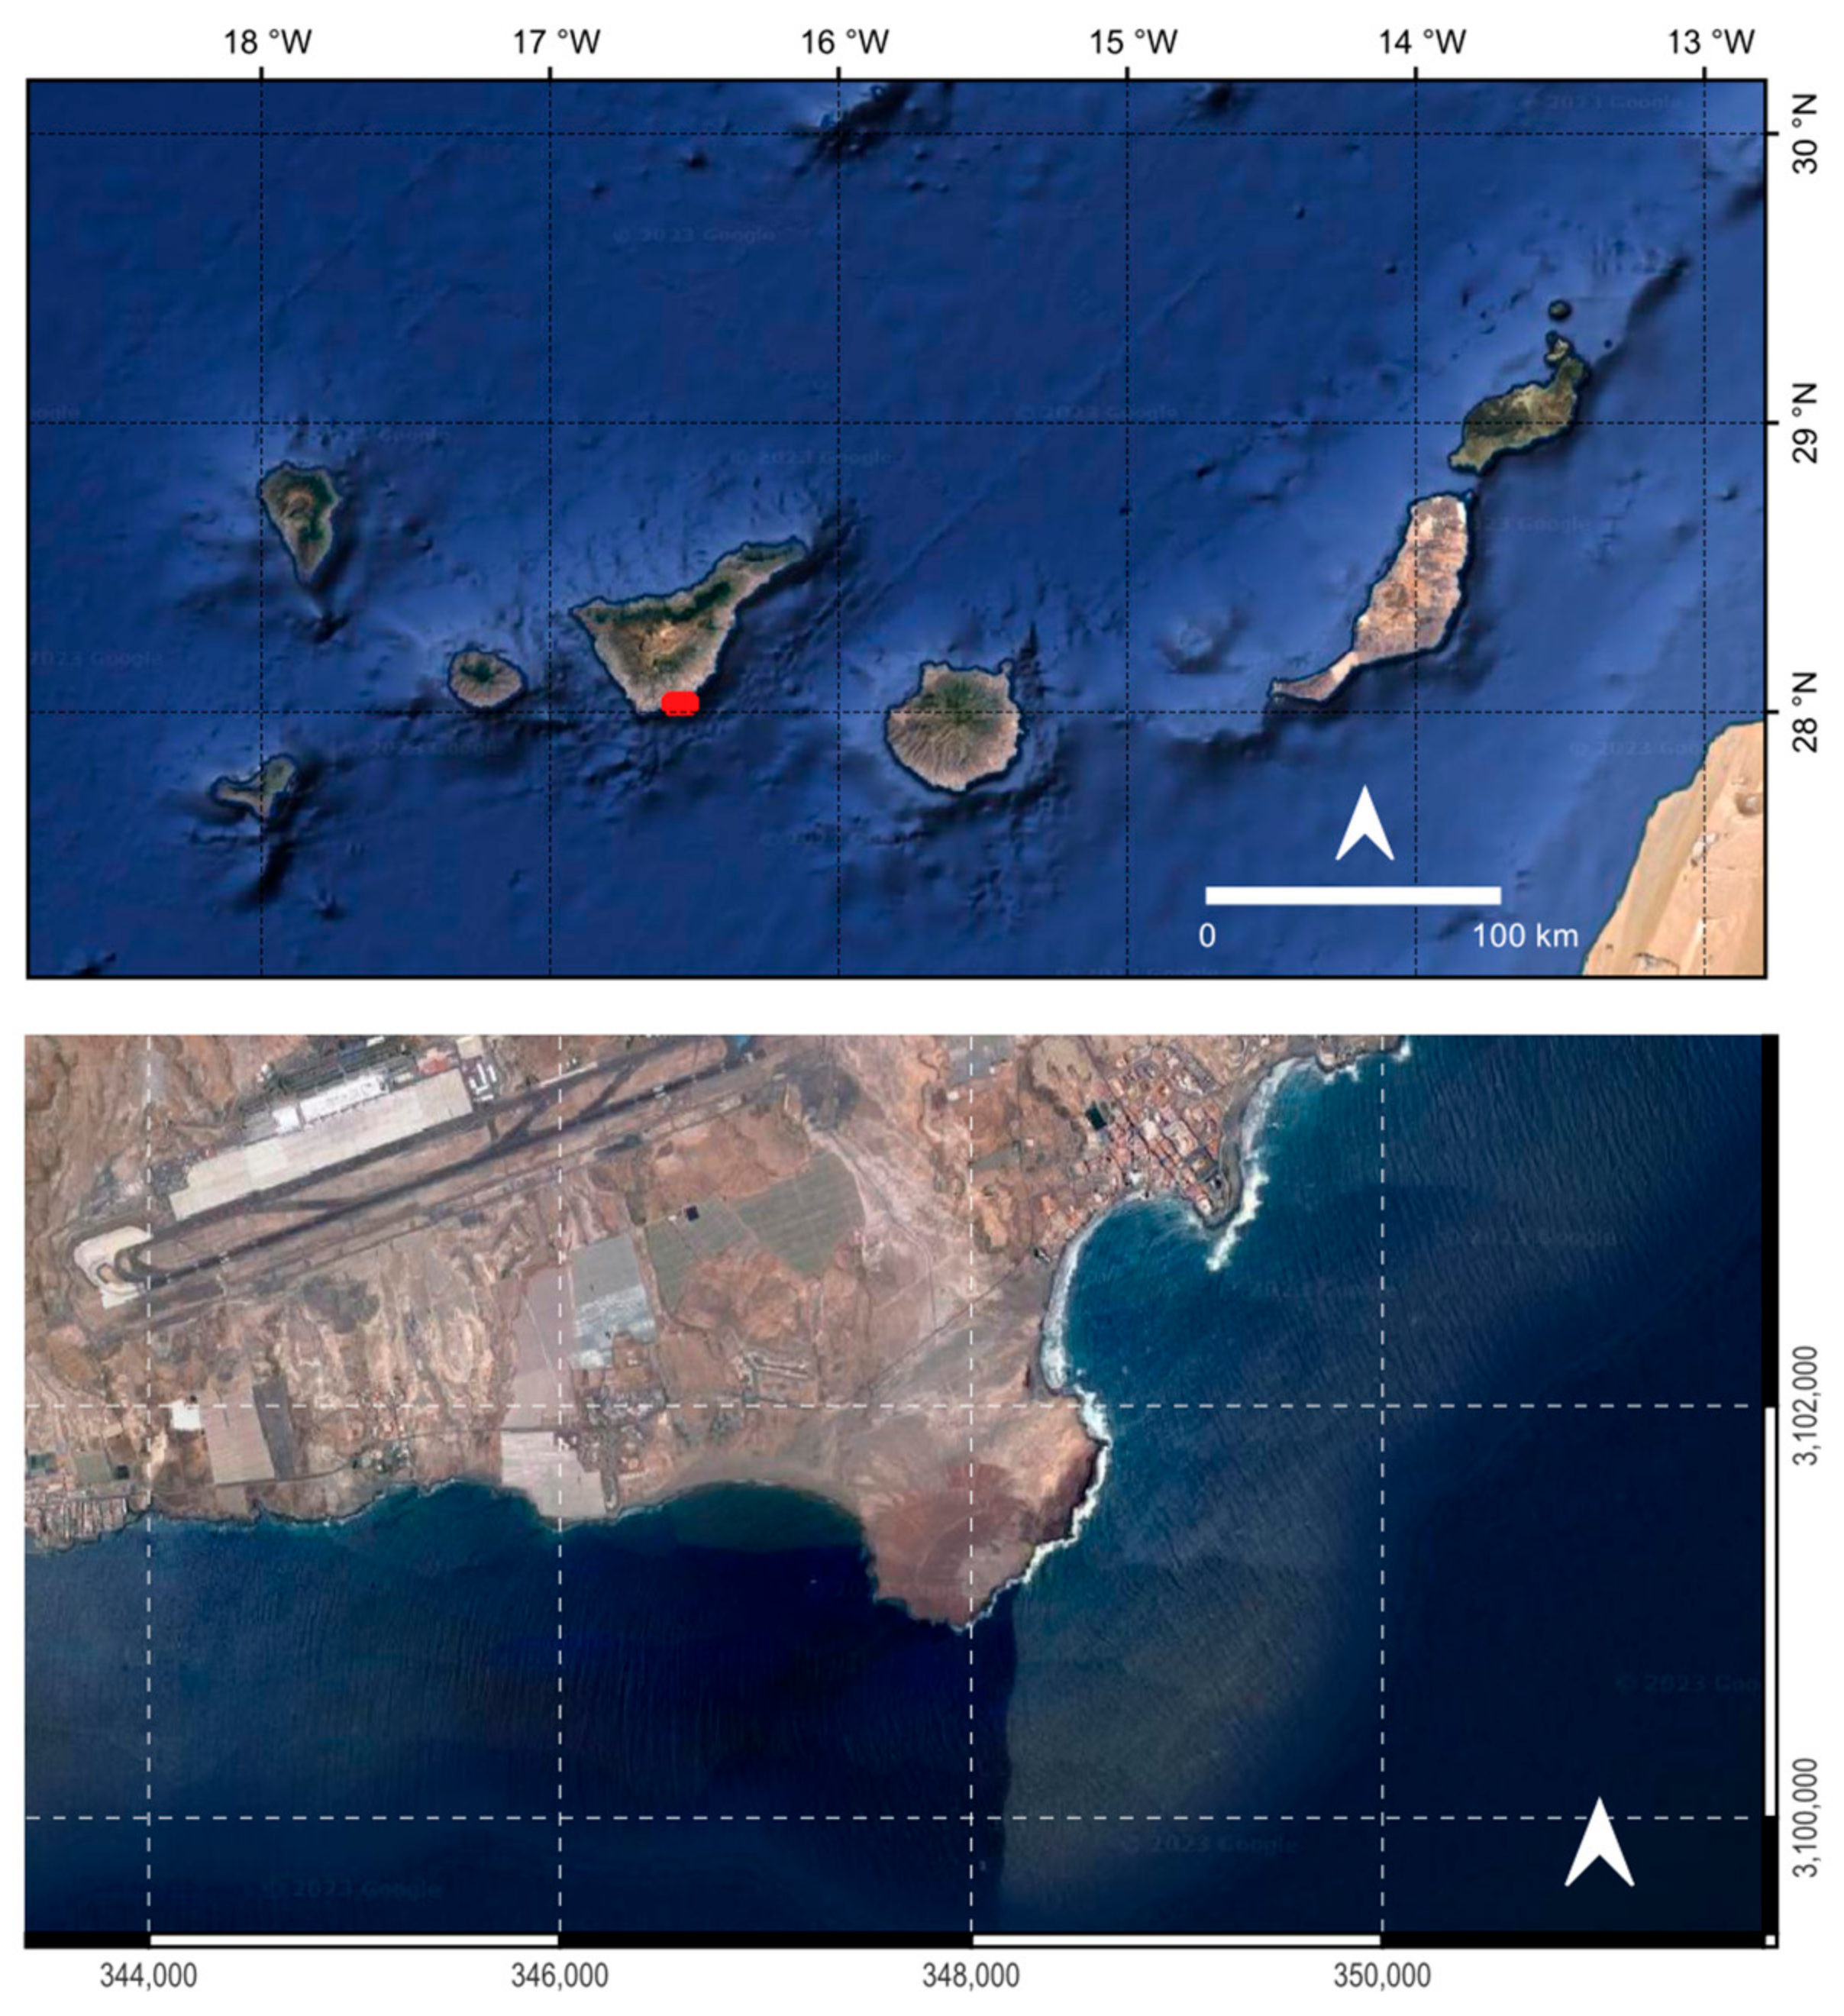
2.1. Study Area
This study focuses on El Médano, located in the municipality of Granadilla de Abona, on the island of Tenerife (
Figure 1). Notably, El Médano is home to vast meadows of
C. nodosa, making it a distinctive study site for mapping seagrass.
2.2. Field Data
Field data from 2016, provided by the Vice-Ministry of the Environment of the Canary Islands Government [
6], stands as the only reference for mapping the
C. nodosa meadows at El Médano. It is essential to acknowledge the potential significant changes that might have taken place since that time. Consequently, a mixed approach was followed to determine the training polygons for the classifiers, as detailed further.
2.3. Methodology
A level 1C (L1C) Sentinel-2 image, captured on 27 October 2022, containing top of the atmosphere (TOA) reflectance data was used. The main challenge faced was the attenuation of the reflected optical signal caused by both the atmosphere and the water column.
2.3.1. Image Pre-Processing
For this study, Sentinel-2′s 10-m resolution bands B2, B3, B4, and B8 were employed.
Sen2Cor (Version: v2.11) [
7] was used to perform the atmospheric correction. The required aerosol optical thickness, water vapor column, and the ozone layer were sourced from the Sentinel-2 auxiliary files AUX_CAMSFO and AUX_ECMWF, both of which contain data from the European Centre for Medium-Range Weather Forecasts.
For masking out land pixels, a threshold value of 0.1 was imposed in the NIR band (B8) to perform a two-class classification. Afterwards, Sen2Coral (Version: v1.1) [
8] was used to perform the sunglint correction in order to avoid pixel misclassification caused by the specular reflection of the light off the ocean’s surface. Sen2Coral uses the Hedley’s algorithm shown in Equation (1) [
9],
where
is the corrected reflectance of the pixel in band
,
is the reflectance of the pixel in presence of sun glint in band
,
is the regression slope,
is the reflectance in the NIR band of the pixel in presence of sun glint, and
is the minimum reflectance in the NIR band from all the pixels of the image.
To limit classification to areas of seagrass growth and comply with the 20–30 m depth constraint of the water column correction method, optically deep waters were masked out with bathymetry data provided by [
6].
Finally, to perform the water column correction, Lyzenga’s method [
10] was employed. It consists of generating new synthetic bands, known as Depth Invariant Indexes, using attenuation coefficients (Equations (2)–(4)).
is the Depth Invariant Index of the and bands, and are the reflectances of the bands and respectively, and are the corresponding attenuation coefficients for each band, is the variance of the band , is the variance of the band and is the covariance of the bands and .
2.3.2. Classification and Blue Carbon Assessment
Due to uncertainties about changes in the seagrass patch relative to the 2016 in situ mapping, it was not possible to define training polygons using this data. Therefore, an initial unsupervised classification was performed using the K-Means algorithm and all the Depth Invariant Indexes. This approach provides a clearer understanding of potential changes in seagrass coverage. Training polygons were then defined in those pixels where the 2016 field data mapping intersected with the unsupervised classification.
The Random Forest (RF), K-Nearest Neighbors (KNN); and KDTree-KNN algorithms were used for supervised classifications. Furthermore, cross-validation method was applied to optimize algorithms’ hyperparameters. The assessment of these classifications was done using the F1 score. This metric ensures a balanced evaluation, specially when there are varying quantities of training polygons for each class, providing a comprehensive understanding of the model’s accuracy.
The InVEST Coastal Blue Carbon (Version: 3.8.0, USA, CA) model was used to quantify the Mg of CO
2 sequestered in the study area by the
C. nodosa. Two primary look-up tables (LUT’s) needed to be built considering biophysical factors of the
C. nodosa. Research papers employing this method in the Canary Islands [
11,
12] were analyzed for the completion of these LUT’s. Within the scope of this study, each seagrass pixel is presumed to sequester the same amount of carbon. The total sequestered CO
2 can then be calculated for the whole study area by multiplying the total number of seagrass pixels identified in the mapping process, equivalent to seagrass hectares, by the sequestration rate per hectare
3. Results and Discussion
The outcome for the unsupervised classification conducted by the K-Means algorithm with a cluster count of
is illustrated in
Figure 2a. Results reveal an area of 221 ha occupied by the
C. nodosa.
Figure 2b,c, show the highest and least extent of seagrass, respectively, after applying different supervised classification algorithms. The largest seagrass extent (245 ha) was achieved using the KNN algorithm with 5 neighbors, while the least seagrass extent (230 ha) was obtained using the RF algorithm with 11 trees.
Upon completion of the classification process, the RF algorithms demonstrated the top F1-scores, falling within a range of 0.96 to 0.99. In contrast, both KNN and KDTree-KNN showed lower F1-scores, with values ranging between 0.84 and 0.96.
In a previous study [
4] using WorldView-2 imagery and Lyzenga’s water column correction method, the authors obtained an accuracy of 71.84% when mapping
C. nodosa in this study area. The results were noisier, resulting in worse metrics. This may be due to the difference in spatial resolution between the WorldView-2 (1.8 m) and Sentinel-2 (10 m). Higher spatial resolution can detect more nuanced turbidity variations, while Sentinel-2 inherently averages turbidity (reflectance values) due to its larger pixel size, resulting in a smoother image. Consequently, when applying Lyzenga’s water column correction method to Sentinel-2 image, the turbidity variations are not as pronounced as those observed in the WorldView-2 image, and therefore, the performance increases. In contrast, our results are in agreement with those of other research which compares the performance of WV-3 and Sentinel-2 in mapping benthic habitats using Lyzenga’s method [
5]. They found that WV-3 pixels appeared to be noisier than Sentinel-2 ones.
From the hectares of seagrass determined by each of the algorithms, an average of 237 ± 5 ha was calculated. Using this average value, the blue carbon sequestered in the study area was estimated to be 111,000 ± 2000 Mg of CO
2. When comparing these figures with the annual CO
2 emissions from various sectors in the Canary Islands, it was found that the seagrass in the study area could offset the CO
2 emissions from the entire industrial combustion plant sector of the Canary Islands, which totaled 76,430 Mg of CO
2 in 2019 and 61,690 Mg of CO
2 in 2020 [
13].
4. Conclusions
This study has successfully demonstrated the capability of Sentinel-2 satellite imagery to map and monitor seagrass meadows in the Canary Islands. The pre-processing workflow implemented presents a promising approach for handling Sentinel-2 image data in similar studies across different locations. Furthermore, this study, has clearly demonstrated the instrumental role seagrass ecosystems can play in regional strategies to achieve net zero carbon emissions.
Author Contributions
Conceptualization, J.V.-Y., L.M.-G., E.C. and M.A.; methodology, J.V.-Y.; software, J.V.-Y. and E.C.; validation, J.V.-Y., L.M.-G., E.C. and M.A.; formal analysis, J.V.-Y.; investigation, J.V.-Y.; resources, J.V.-Y.; data curation, J.V.-Y.; writing—original draft preparation, J.V.-Y.; writing—review and editing, J.V.-Y., L.M.-G., E.C. and M.A.; visualization, J.V.-Y.; supervision, J.V.-Y., L.M.-G., E.C. and M.A.; project administration, J.V.-Y. All authors have read and agreed to the published version of the manuscript.
Funding
This research received no external funding.
Institutional Review Board Statement
Not applicable.
Informed Consent Statement
Informed consent was obtained from all subjects involved in the study.
Data Availability Statement
This study is based upon data obtained from the Sentinel-2 satellite, part of the Copernicus program by the European Space Agency (ESA). The Sentinel-2 data used in this research are publicly available and can be accessed through the Copernicus Open Access Hub (
https://scihub.copernicus.eu/). The specific datasets analyzed during the current study are available from the corresponding author on reasonable request. All processing steps and methodologies used to analyze the Sentinel-2 data are detailed in the Methods section of this paper. The field data used is referenced as [
6].
Conflicts of Interest
The authors declare no conflict of interest.
References
- Orth, R.J.; Carruthers, T.J.B.; Dennison, W.C.; Duarte, C.M.; Fourqurean, J.W.; Heck, K.L.; Hughes, A.J.; Kendrick, G.A.; Kenworthy, W.J.; Olyarnik, S.V.; et al. A global crisis for seagrass ecosystems. BioScience 2006, 56, 987–996. [Google Scholar] [CrossRef]
- Mcleod, E.; Chmura, G.L.; Bouillon, S.; Salm, R.; Björk, M.; Duarte, C.M.; Lovelock, C.E.; Schlesinger, W.H.; Silliman, B.R. A blueprint for blue carbon: Toward an improved understanding of the role of vegetated coastal habitats in sequestering CO2. Front. Ecol. Environ. 2011, 9, 552–560. [Google Scholar] [CrossRef] [PubMed]
- Waycott, M.; Duarte, C.M.; Carruthers, T.J.B.; Orth, R.J.; Dennison, W.C.; Olyarnik, S.V.; Calladine, A.; Fourqurean, J.W.; Heck, K.L.; Hughes, A.D.; et al. Accelerating loss of seagrasses across the globe threatens coastal ecosystems. Proc. Natl. Acad. Sci. USA 2009, 106, 12377–12381. [Google Scholar] [CrossRef] [PubMed]
- Mederos-Barrera, A.; Marcello, J.; Eugenio, F.; Hernández, E. Seagrass mapping using high resolution multispectral satellite imagery: A comparison of water column correction models. Int. J. Appl. Earth Obs. Geoinf. 2022, 113, 102990. [Google Scholar] [CrossRef]
- Wilson, K.L.; Wong, M.L.; Devred, E. Comparing Sentinel-2 and WorldView-3 Imagery for Coastal Bottom Habitat Mapping in Atlantic Canada. Remote Sens. 2022, 14, 1254. [Google Scholar] [CrossRef]
- Monterroso, O.; Rodríguez, M.; Pérez, O.; Ramos, E.; Álvarez, O.; Cruces, L.; Ruiz, M.; Miguel, A.; González, M. Memoria Final del Estudio “Cartografía de Cymodocea nodosa en Tenerife y La Gomera”. Viceconsejería de Medio Ambiente del Gobierno de Canarias; Cima-Informe Técnico; Dirección General de Protección de la Naturaleza: Santa cruz de Tenerife, Spain, 2018; 164p. [Google Scholar]
- Main-Knorn, M.; Pflug, B.; Louis, J.; Debaecker, V.; Müller-Wilm, U.; Gascon, F. Sen2Cor for Sentinel-2. Image Signal Process. Remote Sens. XXIII 2017, 10427, 1032704. [Google Scholar] [CrossRef]
- Serco Italia SPA. Sen2Coral Toolbox for Coral Reef Monitoring, Great Barrier Reef (Version 1.1). 2019. Available online: https://rus-copernicus.eu/portal/the-rus-library/learn-by-yourself/ (accessed on 20 March 2023).
- Hedley, J.; Harborne, A.R.; Mumby, P.J. Technical note: Simple and robust removal of sun glint for mapping shallow-water benthos. Int. J. Remote Sens. 2005, 26, 2107–2112. [Google Scholar] [CrossRef]
- Lyzenga, D.R. Remote sensing of bottom reflectance and water attenuation parameters in shallow water using aircraft and Landsat data. Int. J. Remote Sens. 1981, 2, 71–82. [Google Scholar] [CrossRef]
- González-García, A.; Arias, M.; García-Tiscar, S.; Alcorlo, P.; Santos-Martín, F. National blue carbon assessment in Spain using InVEST: Current state and future perspectives. Ecosyst. Serv. 2022, 53, 101397. [Google Scholar] [CrossRef]
- Casas, E.; Martín-García, L.; Hernández-Leal, P.A.; Arbelo, M. Species Distribution Models at Regional Scale: Cymodocea nodosa Seagrasses. Remote Sens. 2022, 14, 4334. [Google Scholar] [CrossRef]
- Observatorio de la Energía de Canarias-Emisiones. (s.f.). Available online: https://www3.gobiernodecanarias.org/ceic/energia/oecan/estadisticas-2/emisiones (accessed on 5 May 2023).
| Disclaimer/Publisher’s Note: The statements, opinions and data contained in all publications are solely those of the individual author(s) and contributor(s) and not of MDPI and/or the editor(s). MDPI and/or the editor(s) disclaim responsibility for any injury to people or property resulting from any ideas, methods, instructions or products referred to in the content. |
© 2023 by the authors. Licensee MDPI, Basel, Switzerland. This article is an open access article distributed under the terms and conditions of the Creative Commons Attribution (CC BY) license (https://creativecommons.org/licenses/by/4.0/).


