Next Article in Journal
Detection of Methane Point Sources with High-Resolution Satellites
Previous Article in Journal
Wildfire Pollution Emissions, Exposure, and Human Health: A Growing Air Quality Control Issue
 
 
Please note that, as of 4 December 2024, Environmental Sciences Proceedings has been renamed to Environmental and Earth Sciences Proceedings and is now published here.
Proceeding Paper

The Solar Influence on Tropical Cyclones Occurring over the Bay of Bengal and Arabian Sea †

Department of Physics, Swami Vivekananda Institute of Science and Technology, Dakshin Gobindapur, Kolkata 700145, India
Presented at the 6th International Electronic Conference on Atmospheric Sciences, 15–30 October 2023; Available online: https://ecas2023.sciforum.net/.
Environ. Sci. Proc. 2023, 27(1), 37; https://doi.org/10.3390/ecas2023-15123
Published: 14 October 2023
(This article belongs to the Proceedings of The 6th International Electronic Conference on Atmospheric Sciences)

Abstract

:
During the last few decades, a prominent example of extreme weather events in the Indian Ocean region has been cyclonic storms. In this paper, annual variations of different categories of tropical cyclonic storms over the Bay of Bengal (BOB) and Arabian Sea (ARS) are analyzed. The analysis reveals that the total number of cyclones (TNC) has increased at a high rate (the gradient being + 1.67 per year) and that there are more CSs over the BOB than over the ARS. The rate of increase in CSs over the Arabian Sea is more than that over the Bay of Bengal. Furthermore, two interesting features were noted: (i) monsoons tend to prohibit the formation of CSs; (ii) cyclonic storms (CSs) increased with the increase in Global Sea Surface Temperature (GSST) during said period. An attempt was also made to find out the influence of solar activity on these extreme weather events. Keeping in mind that the sunspot number (SSN) is an indicator of the strength of solar effects, it was found that, most of the time, a high SSN value was associated with a small number of total cyclones (CSs). A high SSN (>90) and number of cyclones showed ahigh correlation coefficient (0.78). The significance was at the 99.99% level, while the correlation coefficient (CC) of cyclones with time was 0.53, and with SSN < 60, it was 0.095. Thus, it appears that although CS frequency is increasing with time, the influence of sunspots is such that it basically opposes the formation of cyclones provided the SSN exceeds a certain critical value (roughly 90).

1. Introduction

The Indian Ocean is one of the most tropical cyclone (TC)-generating regions in the world, like hurricanes in the Northern Atlantic Ocean (NATL) and Eastern North Pacific Ocean (ENP) and typhoons in the Western North Pacific Ocean (WNP) and Western South Pacific (WSP) (Li et al., 2013) [1]. The Arabian Sea (ARS) and Bay of Bengal (BoB) are the main TC-generating areas. These two seas are surrounded by extremely populated land areas. Around 7516 km of India and 710 km of Bangladesh are exposed to nearly 10% of the world’s tropical cyclones (NCRMP reports).
According to some previous work (Girishkumar & Ramachandran, 2012) [2], there are two primary TC seasons, April to May (pre-monsoon) and October to November (post-monsoon) (Balaguru et al., 2012) [3]. In the post-monsoon period in the BoB, the TC frequency (Singh et al., 2001) [4]. The formation of TCs in the BoB and ARs is less significant compared to their formation in the Atlantic and Pacific. But much more populated areas are devastated due to the occurrence of landfall from TCs in these Indian Ocean regions (Webster, P.J, 2008) [5], (Islam et al., 2009) [6], (McPhaden, M.J., 2009) [7].
The internal variability in post-monsoon TC activity in the BoB, focusing on climate phenomena such as El Niño–Southern Oscillation (ENSO) (Girishkumar and Ravichandran 2012) [2], the Indian Ocean Dipole (Singh 2008) [8], (Girishkumar and Ravichandran 2012) [2], the Madden–Julian oscillation (Kichuki and Wang, 2010) [9] and CO2 induced increases in TC intensity in the coupled climate model (CCM) but considering only the Atlantic and Pacific basins (Knutson and Tuleya 2004) [10] (Webster et al., 2005) [11], has also been studied in terms of the above effects.
In India, one of the extreme weather events that occur is cyclones, or hurricanes/typhoons/willy willies are known in other parts of world (Niyas et al., 2009) [12]. Cyclones in India occur mainly either over the Bay of Bengal (BOB) i.e., on the eastern side, or over the Arabian Sea (ARS), i.e., the western side. There are different categories of cyclones according to the wind speed, e.g., cyclones, severe cyclones, super cyclones, etc. (Table 1). We shall discuss first the genesis and frequency distribution of cyclonic storms for the period of 1990 to 2009.
The solar influence on the Earth’s climate is a very well-established concept. There are several kinds of approaches that have been carried out in the last few decades (Kim et al., 2017) [13]. Solar cycles excite the Earth’s magnetic field as well as its electric field system and thermodynamic system (Kim & Chang, 2014) [14]; (Lee & Yi, 2016) [15]; (Na et al., 2016) [16]. The various properties of solar variability have been determined in several important discussions (Svenesmark & Friis-Christensen, 1997) [17]; (Reid, 2000) [18], (Tinsley, 2000) [19]; (Roldugin & Tinsley, 2004) [20]; (Scafetta & West, 2006) [21].

2. Materials and Methods

2.1. Data

In this study, the best tracking data for tropical cyclones and a maximum wind speed of more than 20 kt/h were obtained from a report from the Cyclone Warning Division of Indian Meteorological Division (IMD), New Delhi and the Cyclone E-Atlas published by IMD. Sunspot numbers (SSNs) were obtained from Sunspot Index and Long-term Solar Observations (SILSO), i.e., SILSO data/images, Royal Observatory of Belgium, Brussels. The best tracking data consisted of three-hourly (00:00, 03:00, 06:00, 09:00, 12:00, 15:00, 18:00, 21:00 UTC) center positions (latitudes and longitudes in degrees), gradient of the maximum wind speed in knots (three-hourly averages), and the central pressure in hPa for all TCs of a certain TC intensity or higher.

2.2. Genesis and Frequency Distribution of Cyclonic Storms

With the available data from the IMD (Indian Meteorological Department), we found that during the period of 1990–2009, the maximum number of CSs occurred in 1999, with 88, followed by 84 in 2004 and 80 in 2001, while minimal numbers occurred in1990, with 32, 1991, with 30, and 1993, with 23.
Again, we found that the mean numbers of cyclones over the BoB and ARS were 42 and 12 per year respectively.
Therefore, the frequency of cyclones over the BOB is more than 3 times that over the ARS.
The time series data has been plotted between 1990 and 2009, in Figure 1, Figure 2, Figure 3 and Figure 4. We find from Figure 4 that the frequency of cyclones over the ARS is irregular. For example, out of these 20 years, there were no CSs in 7 of the years over ARS at all (but such a situation never occurred in the BOB region).
Let us now analyze the monthly variation in CSs, as is given in Table 2 for both the regions. From Table 2, we make the following observations:
There are no cyclones in either region between the months of July and August. Also, there are no cyclones in the ARS from January to April.
The frequency of CSs is the maximum in May and then in November over both the BOB and ARS. The ratio is 153:132 = 1.16 for BOB/ARS, and then, in the month of November, it is 262:68 = 3.9. Thus, the maximum no. of CSs occurs over the ARS, in November, and is almost 4 times that over the BOB, but in May, the CS no. is almost the same over the BOB and ARS.
Let us now analyze the seasonal variation in CSs shown in Table 3.
From Table 3, it becomes evident that monsoon time is not suitable for the formation of cyclonic storms over the BOB and ARS. In other words, monsoons appear to resist the formation of CSs. However, the resistance appears to be weaker over the ARS.
Also, we found that the frequency of CSs during pre-monsoon and post-monsoon is higher over the BOB than it is over the ARS. But, during a monsoon, the reverse happens; namely, the frequency over the ARS is nearly 1.7 times that over the BOB region.
Thus, it appears that CSs over the BOB (in Eastern India) and ARS (Western India) are inversely interlinked. Now, the rate of increase in CSs in the ARS is higher than that in the BOB (vide Figure 4); therefore, in future, Western India may be more vulnerable to frequent cyclones, and reverse is true for Eastern India, thereby implying that, in the long run, this may lead to a change in climatic conditions on the Indian peninsula.

2.3. The Annual Variation in Cyclone Frequency for Different Categories

There are different categories of cyclone over the Indian peninsula, viz., the Bay of Bengal and Arabian Sea. We plotted the no. of different types of cyclonic storm against time, which is shown in Figure 1a–d. But super cyclonic storms (SuCSs) are mostly absent, except in 1990, 1991, 1999 and 2007, when the numbers were 3, 4, 6, and 2, respectively. From the curves and the equations of the trend lines, we found the rates and correlation coefficients, including average values, as shown in Table 3. From the above table, we find that all the rates are positive, but the highest rate of increase in total cyclonic storms is 1.67 per yr., and the average no. of total CSs is 59.25. However, it can be noted that intense tropical cyclones in the North Indian Ocean during the period of 1887–1998 also exhibited a similar trend (Singh, Ali Khan and Rahaman, 2008) [8]; also see (Webster et al., 2008) [5].

3. Results

We plotted the 3-year moving average values of total CSs (TCS) and only CSs, generating Figure 2a and Figure 2b respectively. We can note that while the no. of CSs increased step by step during the 1990–1996, 1997–2001, and 2002–2010 periods like upward stairs, with the maximum no. of CSs being (≈30, 35, 55), the total no. of CSs increased suddenly after 1996. Evidently, some other type of cyclone might be responsible for this sudden jump. If we look at Figure 2c,d, we can note that two categories, namely, severe cyclones (SCSs) and very severe cyclones (VSCSs), are two events which have higher frequency after the mid-1990s. In fact, it has been pointed out (Singh et al., 2001) that the frequency of intense tropical cyclones has increased more than that of normal cyclones. In fact, our study reveals that during the 1990–2009 period, while the rates of VSCSs and SCSs were lower—namely, 0.42 and 0.22, respectively—the rate of CSs was 1.1 per year. The 3-year moving average exhibited a declining tendency in recent years. Table 4 shows temporal trend of different categories of cyclonic storm.
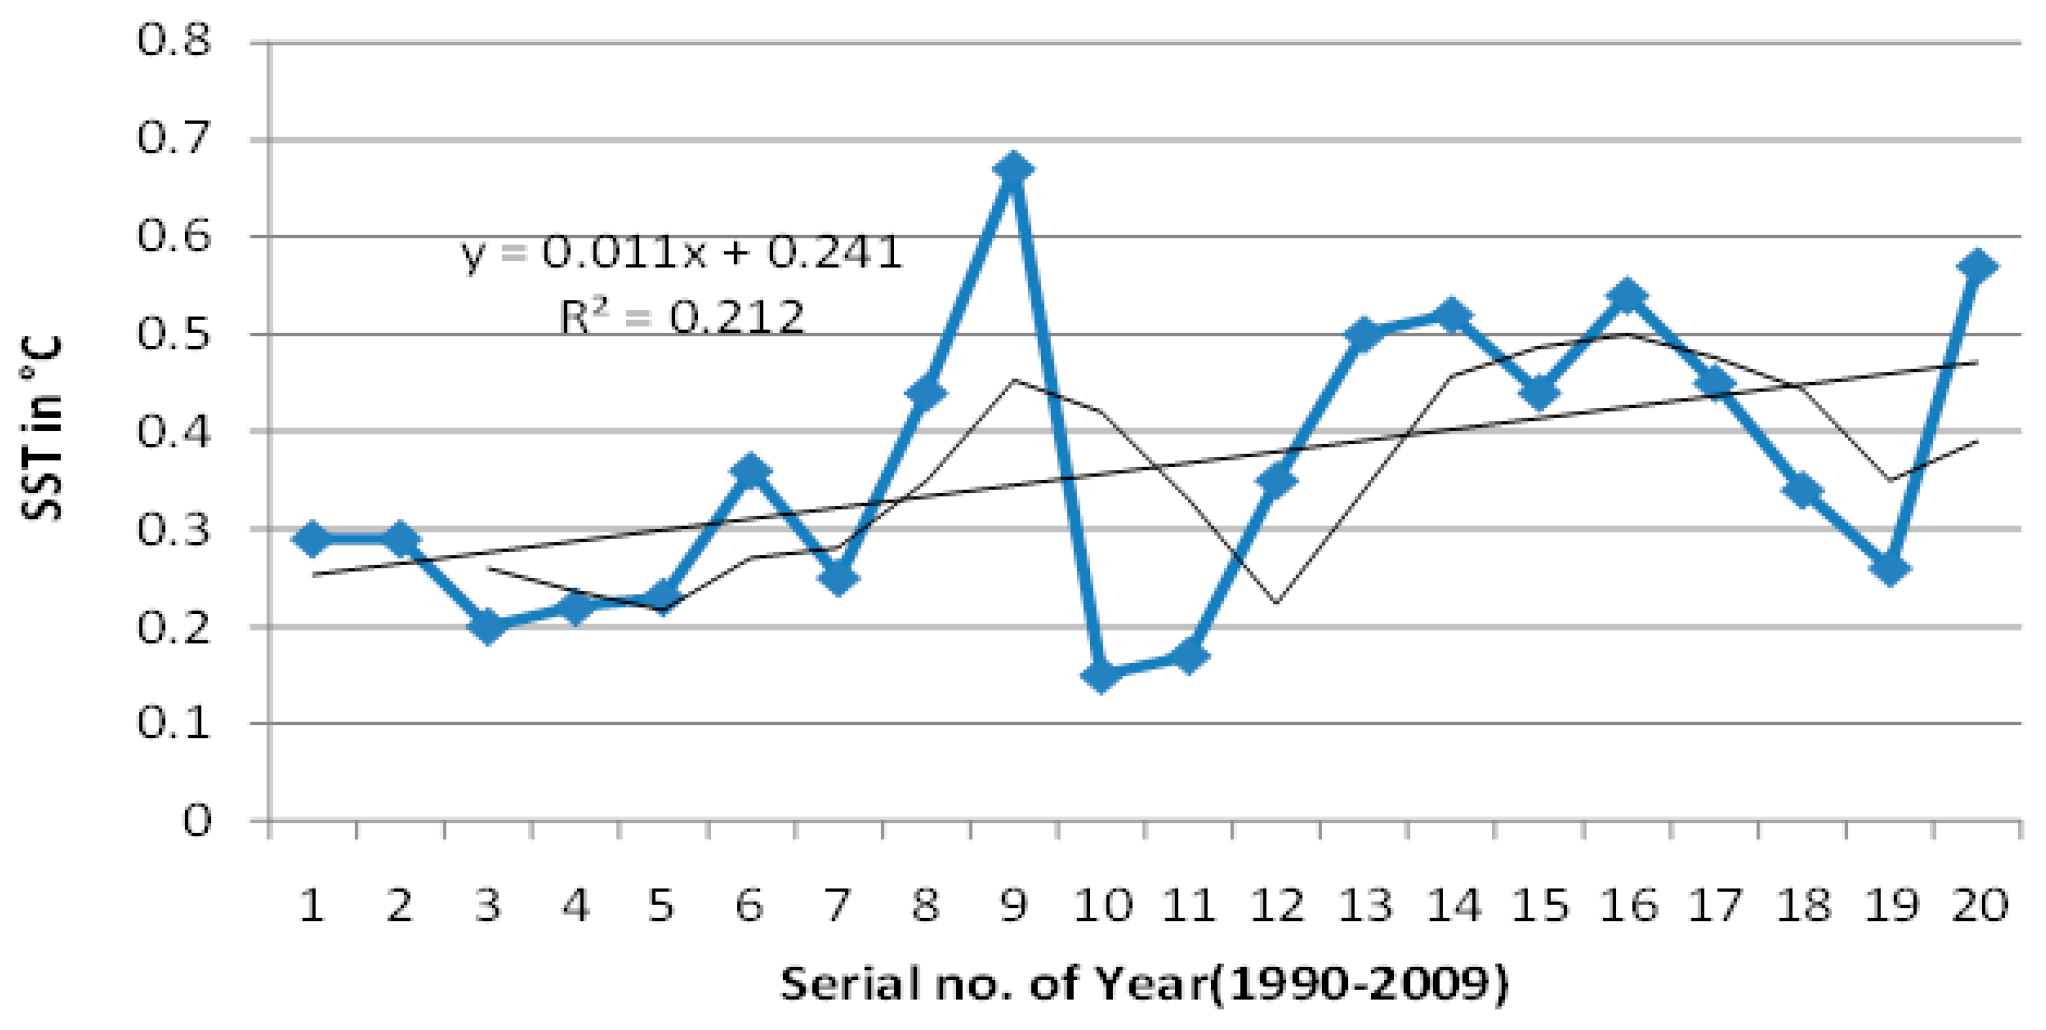
Often, sea surface temperature (SST) is said to be an influential agent for cyclone formation; we shall not discuss this, except for the fact that when SST and CSs are plotted, both are found to increase with time (SST has an increase rate of 0.1 per year, while TCS has an increase rate of 1.67 per year). Thus, it appears that at least SST does not give any resistance to cyclone formation (Sikka, 1977) [22].
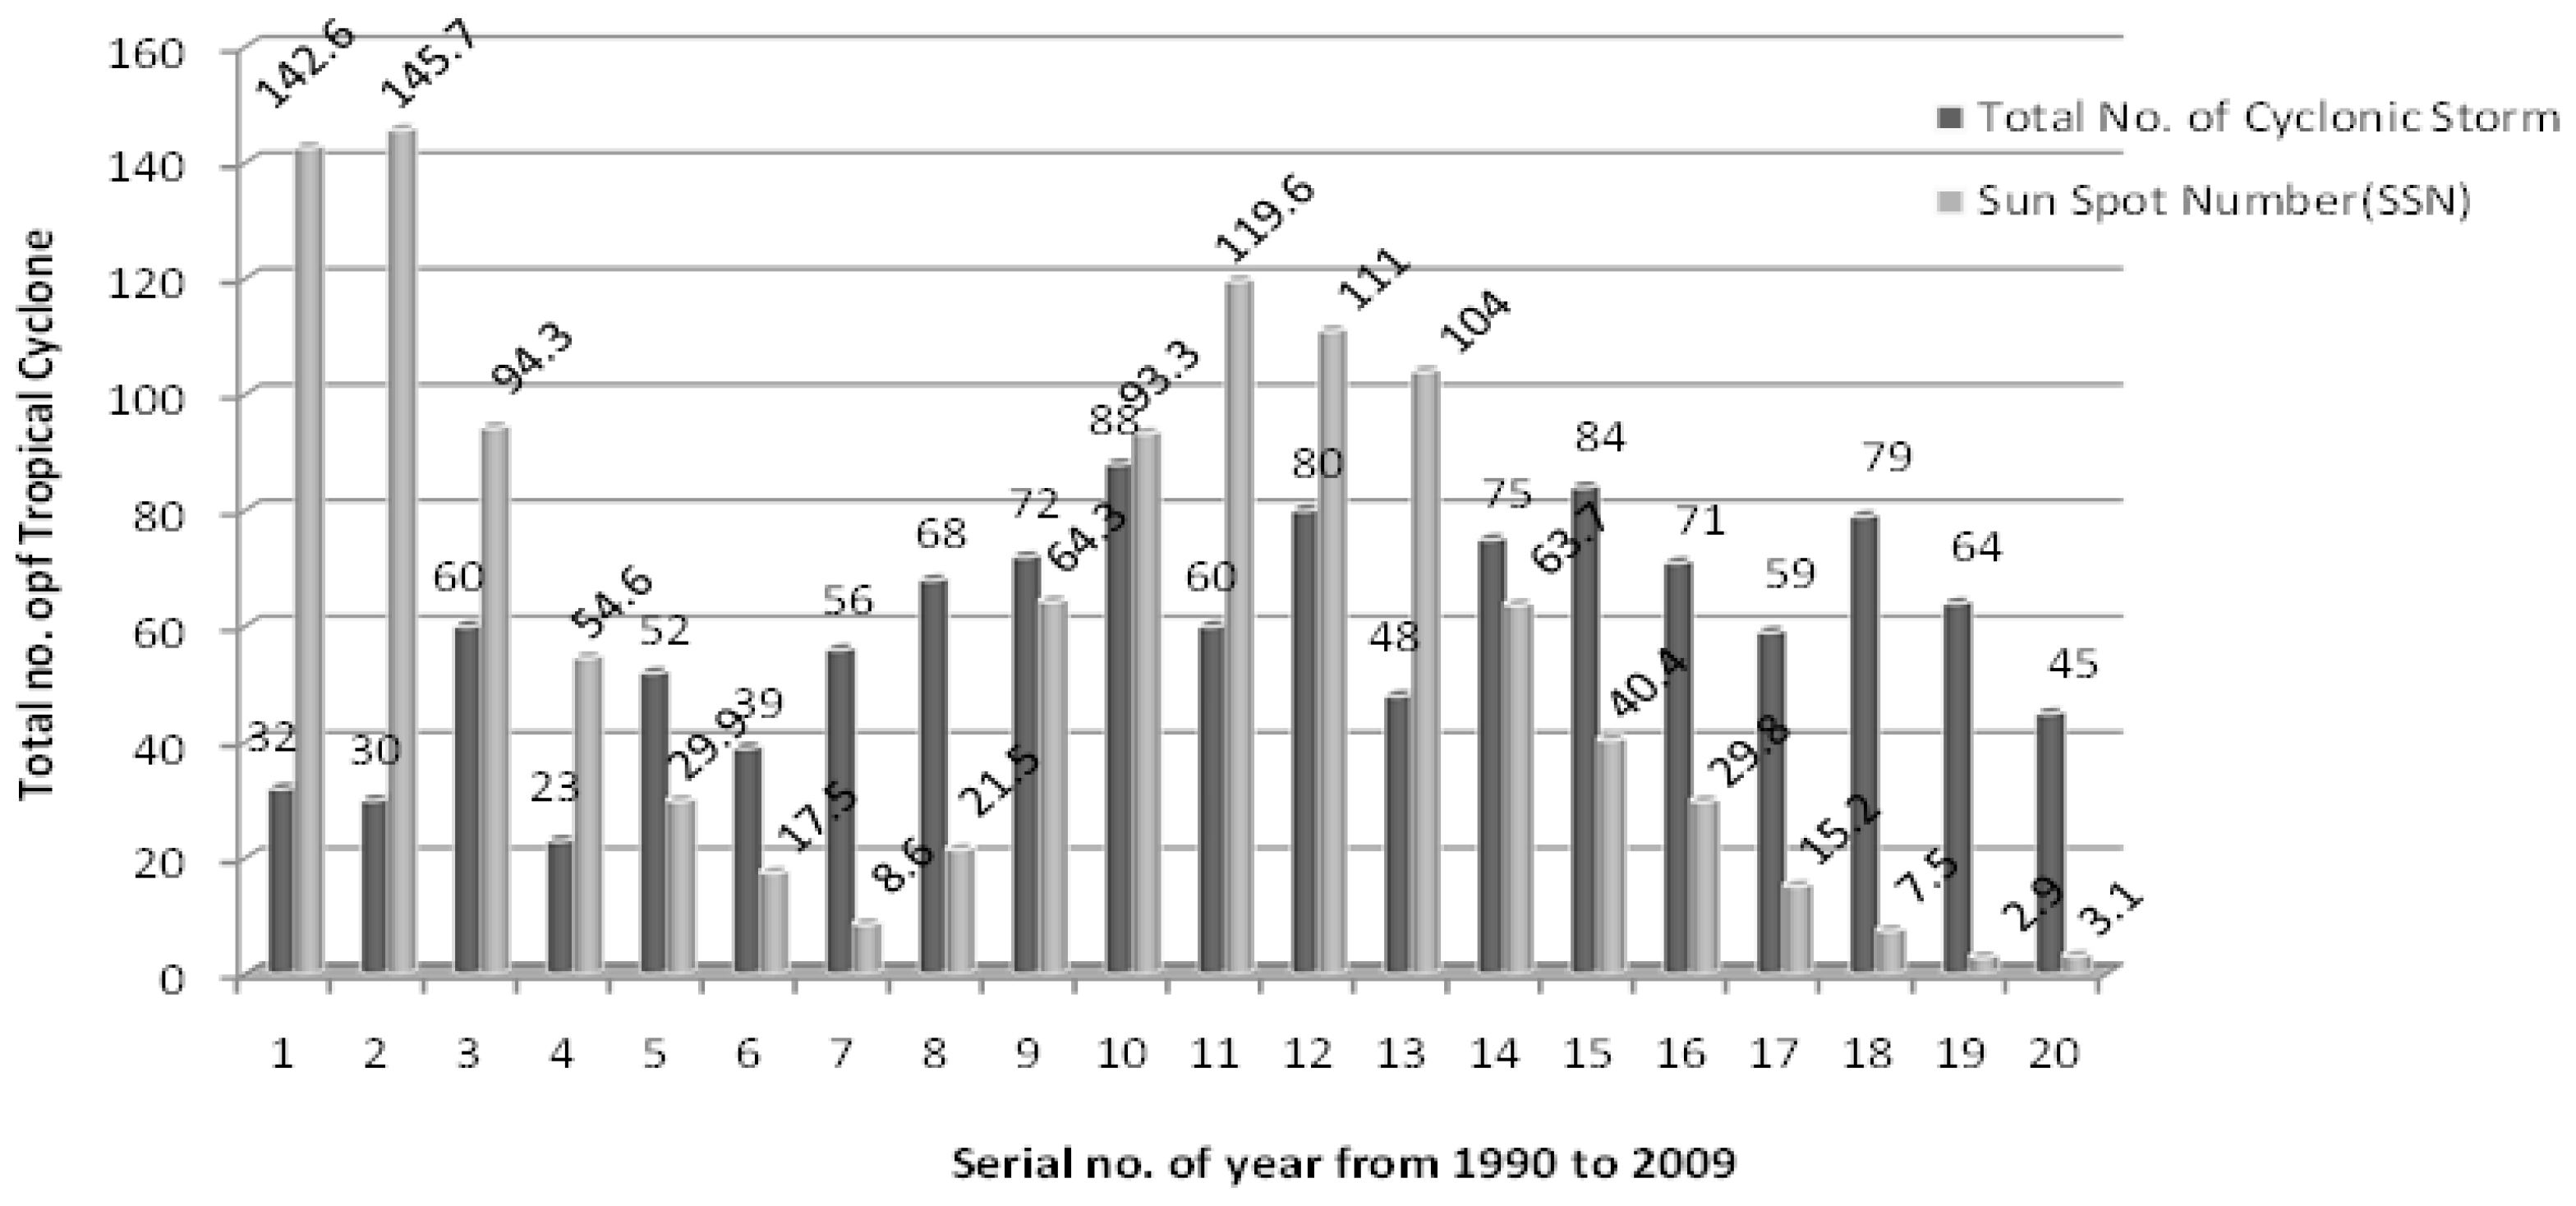
We know that sunspot number (SSN)is an indicator of solar activities. If we take all SSNs < 60 and the corresponding CSs, the correlation coefficient comes out to be 0.095, but if we take SSNs > 90, the CC becomes −0.784, which clearly indicates that an inverse relationship exists, provided the SSN is greater than some critical value (say, 90). The existence of this critical SSN has also been observed in many events. Now, if we calculate the no. of CSs in the years of solar max. and min., we obtain the values shown in Table 5.
From Table 5, we find from the solar maximum to solar minimum that the average total CSs increase from 39 to 60, i.e., by 53%, although only CSs remain almost the same, and SCSs and VSCSs increase by nearly 5 times as much. This again supports the adverse effect of a high SSN on cyclone formation when solar activities increase. Figure 5 shows a comparative graph of the SSN and the no. of tropical cyclones.

Funding

This research received no external funding.

Institutional Review Board Statement

Not applicable.

Informed Consent Statement

Not applicable.

Data Availability Statement

Sunspot data from the World Data Center SILSO, Royal Observatory of Belgium, Brussels.

Conflicts of Interest

The author declares no conflict of interest.

References

  1. Li, Z.; Yu, W.; Li, T.; Murty, V.S.N.; Tangang, F. Bimodal character of cyclone climatology in the Bay of Bengal modulated by monsoon seasonal cycle. J. Clim. 2013, 26, 1033–1046. [Google Scholar] [CrossRef]
  2. Girishkumar, M.; Ravichandran, M. The influences of ENSO on tropical cyclone activity in the Bay of Bengal during October–December. J. Geophys. Res. Oceans 2012, 117, C2. [Google Scholar] [CrossRef]
  3. Balaguru, K.; Chang, P.; Saravanan, R.; Leung, L.R.; Xu, Z.; Li, M.; Hsieh, J.-S. Ocean barrierayers’ effect on tropical cyclone intensification. Proc. Natl. Acad. Sci. USA 2012, 109, 14343–14347. [Google Scholar] [CrossRef] [PubMed]
  4. Singh, O.; Khan, T.M.A.; Rahman, M.S. Has the frequency of intense tropical cyclones increased in the north Indian Ocean? Curr. Sci. 2001, 80, 575–580. [Google Scholar]
  5. Webster, P.J. Myanmar’s deadly daffodil. Nat. Geosci. 2008, 1, 488–490. [Google Scholar] [CrossRef]
  6. Islam, T.; Peterson, R.E. Climatology of landfalling tropical cyclones in Bangladesh 1877–2003. Nat. Hazards 2009, 48, 115–135. [Google Scholar] [CrossRef]
  7. Mc Phaden, M.J.; Foltz, G.R.; Lee, T.; Murty, V.S.N.; Ravichandran, M.; Vecchi, G.A.; Vialard, J.; Wiggert, J.D.; Yu, L. Ocean-atmosphere interactions during cyclone nargis. EOS Trans. Am. Geophys. Union 2009, 90, 53–54. [Google Scholar] [CrossRef]
  8. Singh, O. Indian Ocean dipole mode and tropical cyclone frequency. Curr. Sci. 2008, 94, 29–31. [Google Scholar]
  9. Kikuchi, K.; Wang, B. Formation of tropical cyclones in the northern Indian Ocean associated with two types of tropical intraseasonal oscillation modes. J. Meteorol. Soc. Jpn. Ser. II 2010, 88, 475–496. [Google Scholar] [CrossRef]
  10. Knutson, T.; Landsea, C.; Emanuel, K. Tropical Cyclones and Climate Change: A Review. Glob. Perspect. Trop. Cyclones Sci. Mitig. 2010, 243, 243–284. [Google Scholar]
  11. Webster, P.J.; Holland, G.J.; Curry, J.A.; Chang, H.-R. Changes in tropical cyclone number, duration, and intensity in a warming environment. Science 2005, 309, 1844–1846. [Google Scholar] [CrossRef] [PubMed]
  12. Niyas, N.; Srivastava, A.; Hatwar, H. Variability and Trend in the Cyclonic Storms over North Indian Ocean; National Climate Centre, Office of the Additional Director General of Meteorology (Research), India Meteorological Department: New Delhi, India, 2009. [Google Scholar]
  13. Kim, J.-H.; Kim, K.-B.; Chang, H.-Y. Solar influence on tropical cyclone in western North Pacific Ocean. J. Astron. Space Sci. 2017, 34, 257–270. [Google Scholar] [CrossRef]
  14. Kim, J.-H.; Chang, H.-Y. Statistical properties of geomagnetic activity indices and solar wind parameters. J. Astron. Space Sci. 2014, 31, 149–157. [Google Scholar] [CrossRef]
  15. Lee, S.; Yi, Y. Abnormal winter melting of the Arctic sea ice cap observed by the spaceborne passive microwave sensors. J. Astron. Space Sci. 2016, 33, 305–311. [Google Scholar] [CrossRef]
  16. Na, S.-H.; Cho, J.; Kim, T.-H.; Seo, K.; Youm, K.; Yoo, S.-M.; Choi, B.; Yoon, H. Changes in the Earth’s Spin Rotation due to the Atmospheric Effects and Reduction in Glaciers. J. Astron. Space Sci. 2016, 33, 295–304. [Google Scholar] [CrossRef]
  17. Svensmark, H.; Friis-Christensen, E. Variation of cosmic ray flux and global cloud coverage—A missing link in solar-climate relationships. J. Atmos. Sol.-Terr. Phys. 1997, 59, 1225–1232. [Google Scholar] [CrossRef]
  18. Reid, G.C. Solar variability and the Earth’s climate: Introduction and overview. Space Sci. Rev. 2000, 94, 1–11. [Google Scholar] [CrossRef]
  19. Tinsley, B.A. Influence of solar wind on the global electric circuit, and inferred effects on cloud microphysics, temperature, and dynamics in the troposphere. Space Sci. Rev. 2000, 94, 231–258. [Google Scholar] [CrossRef]
  20. Roldugin, V.; Tinsley, B. Atmospheric transparency changes associated with solar wind-induced atmospheric electricity variations. J. Atmos. Sol.-Terr. Phys. 2004, 66, 1143–1149. [Google Scholar] [CrossRef]
  21. Scafetta, N.; West, B. Phenomenological solar signature in 400 years of reconstructed Northern Hemisphere temperature record. Geophys. Res. Lett. 2006, 33, 17. [Google Scholar] [CrossRef]
  22. Sikka, D. Some aspects of the life history, structure and movement of monsoon depressions. In Monsoon Dynamics; Springer: Berlin/Heidelberg, Germany, 1978; pp. 1501–1529. [Google Scholar]
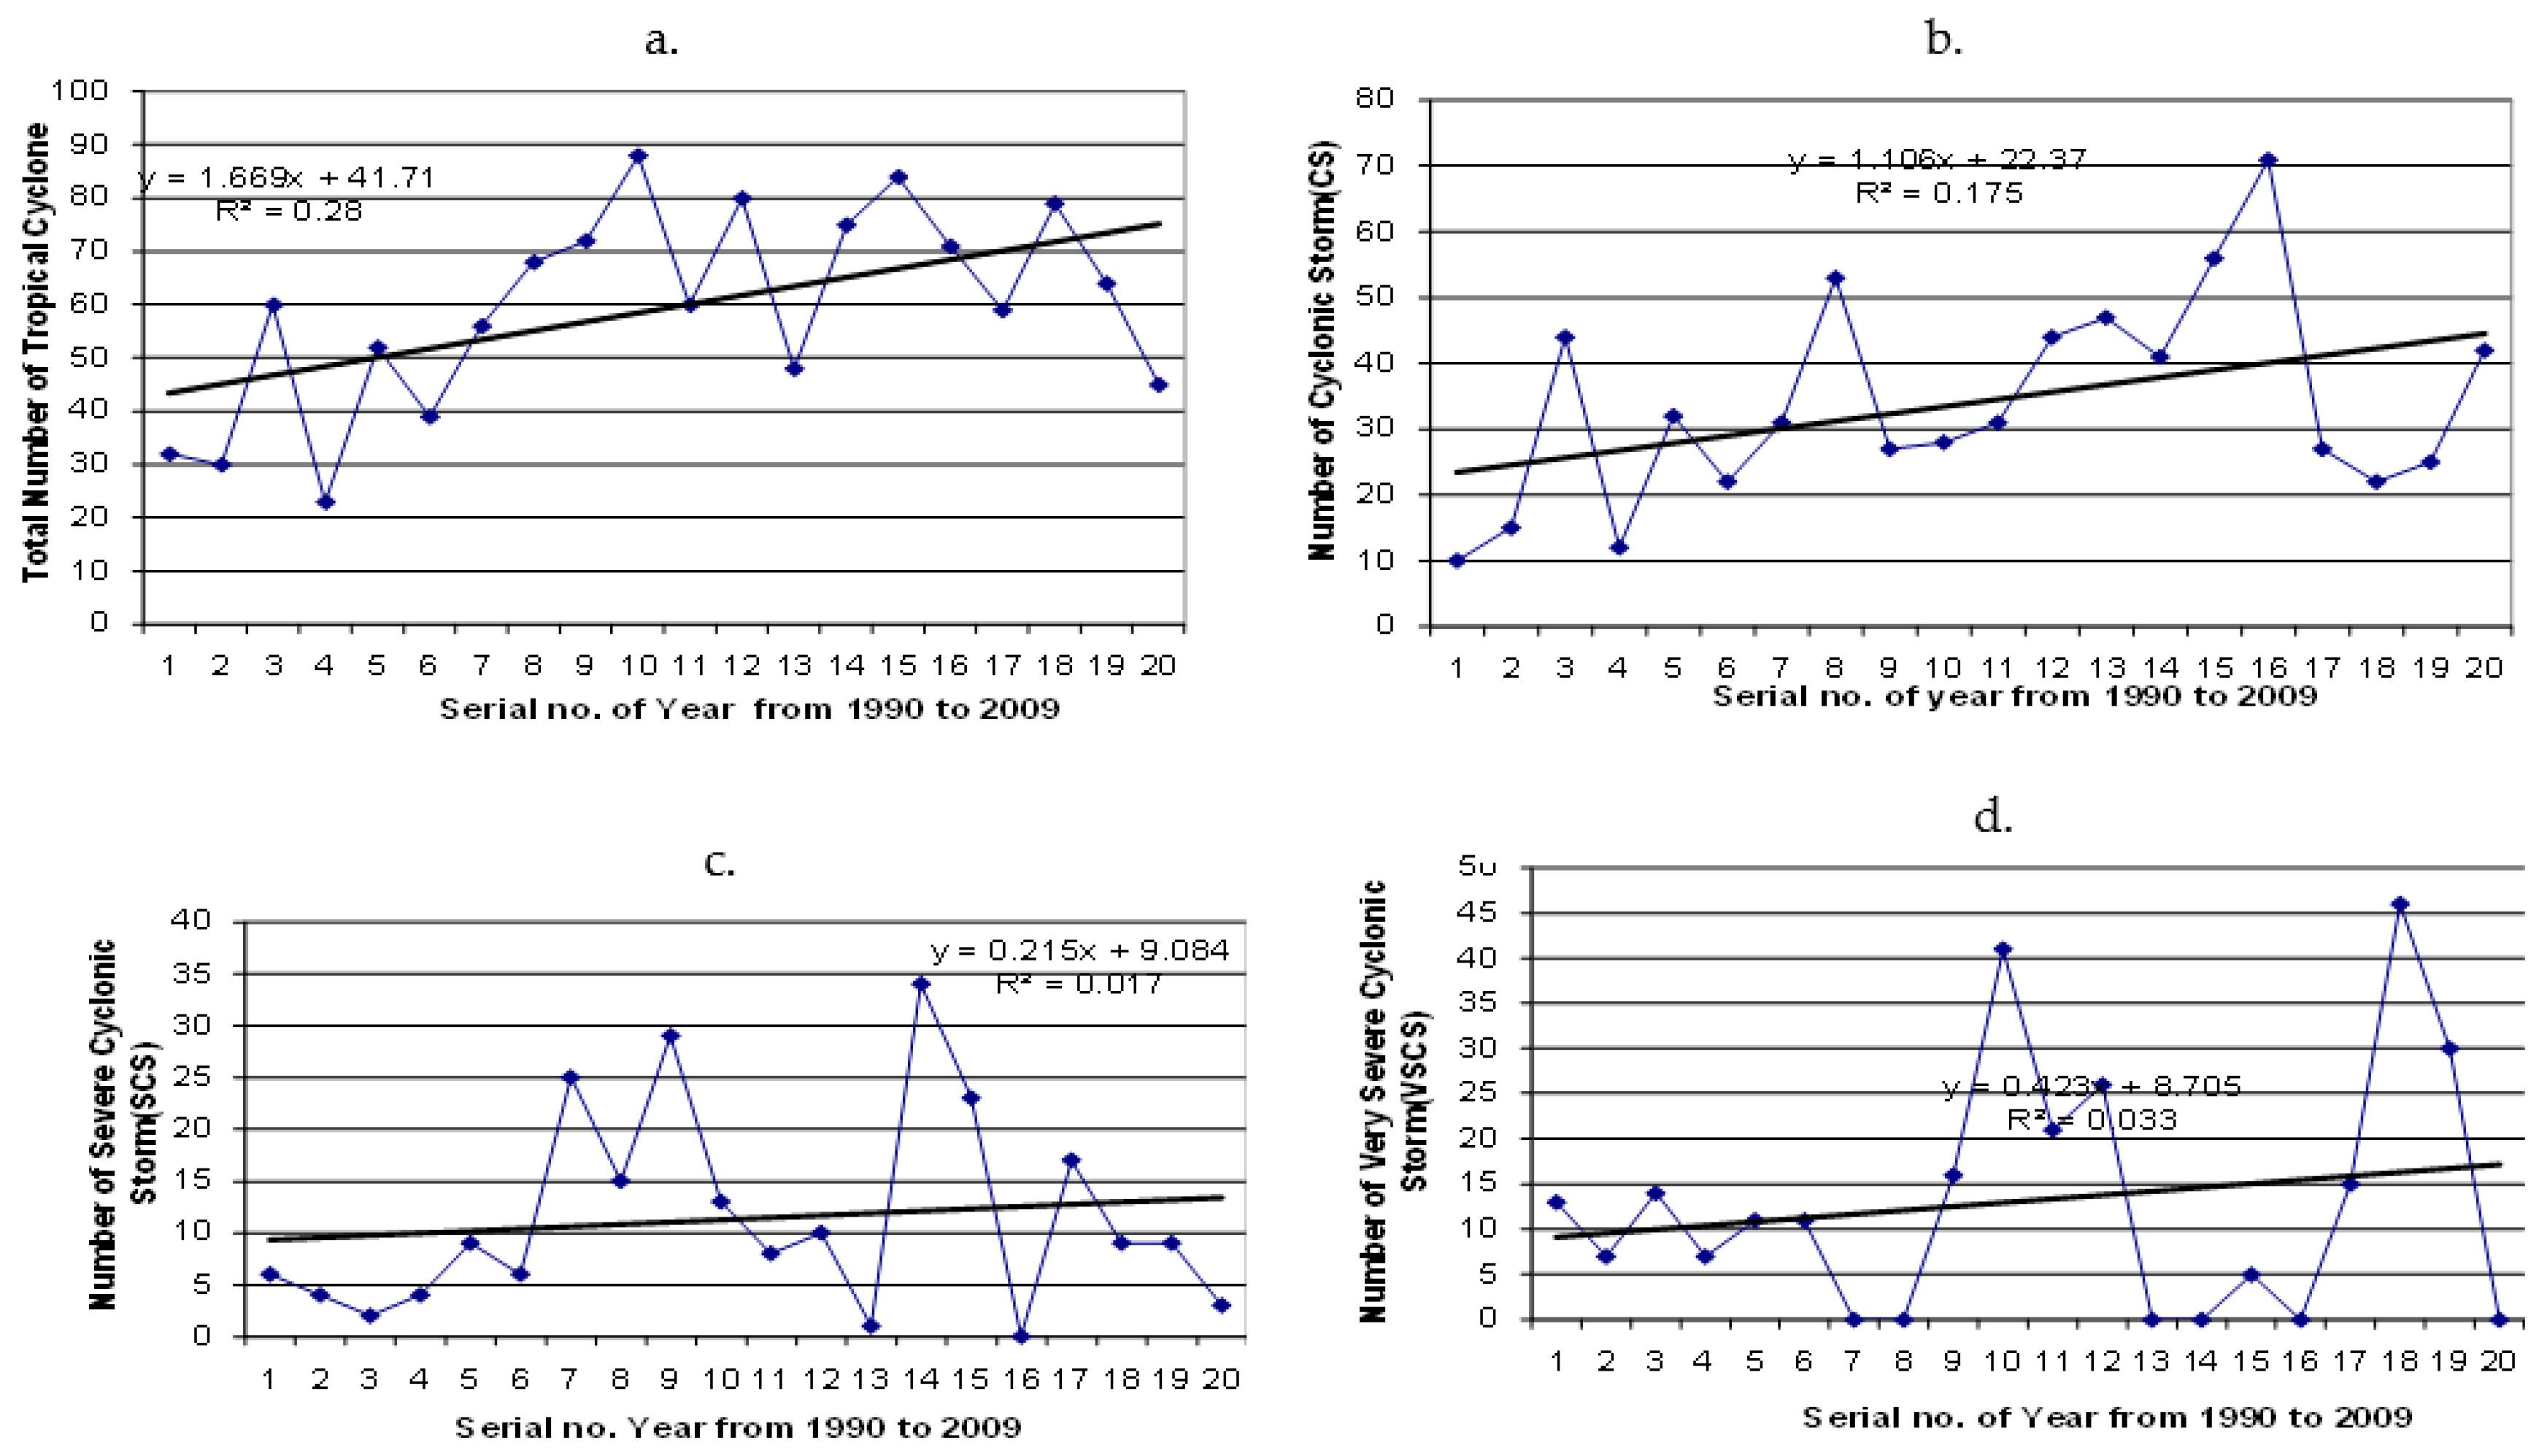
Figure 1. Temporal variation in number of different types of cyclones during 1990–2009. (a). Variation of Total no. of Tropical Cyclone During 1990–2009; (b). Variation of Cyclonic Storm (CS) (1990–2009); (c). Variation of Severe Cyclonic Storm (SCS) (1990–2009); (d). Variation of Very Severe Cyclonic Storm (SCS) (1990–2009).
Environsciproc 27 00037 g001
Figure 2. Moving average of different cyclonic storms. (a). 3 Years moving average of total no. of Tropical Cyclone during 1990 to 2009. (b). 3 Years moving average of cyclonic storm (CS) during 1990 to 2009. (c). 3 Years moving average of Severe Cyclonic Storm (SCS) (1990–2009); (d). 3 Years moving average of Very Severe Cyclonic Storm (SCS) (1990–2009).
Environsciproc 27 00037 g002
Figure 3. Variation of Sea Surface Temperature with time from 1990 to 2009. sea surface temperature (SST), cyclonic storms in BOB and ARS, and variation in TCs and sunspot number (SSN).
Environsciproc 27 00037 g003
Figure 4. Comparison of total no. of cyclonis storm (TCS) in BOB and ARS. sea surface temperature (SST), cyclonic storms in BOB and ARS, and variation in TCs and sunspot number (SSN).
Environsciproc 27 00037 g004
Figure 5. Variation of no. of Tropical cyclonic storm and Sun Spot Number during 1990 to 2009. Sea surface temperature (SST), cyclonic storms in BOB and ARS, and variation in TCs and sunspot number (SSN).
Environsciproc 27 00037 g005
Table 1. India Meteorological Department’s classification of the various low-pressure systems forming over the North Indian Ocean.
Sr. No.Types of DisturbancesAssociated Wind Speed
1.Low-pressure area<17 knots<32 km/h
2.Depression17–27 knots32–50 km/h
3.Deep depression28–33 knots51–59 km/h
4.Cyclonic storm34–47 knots60–90 km/h
5.Severe cyclonic storm48–63 knots90–119 km/h
6.Very severe cyclonic storm64–119 knots119–220 km/h
7.Super cyclonic storm>119 knots>220 km/h
Table 2. Monthly frequency distribution of cyclonic storms over BOB and ARS.
MonthsBOBARSMonthsBOBARS
Jan230July00
Feb120August00
March110September4318
April990October10540
May153132November26268
June1884December11427
Table 3. Analysis of seasonal variation in cyclonic storms.
RegionSeasonNo. per Year
BOBPre-monsoon15
Monsoon3
Post-monsoon24
ARSPre-monsoon6.6
Monsoon5
Post-monsoon6.7
Table 4. Temporal trend of different categories of cyclonic storm.
CategoryAverage No.Rate/GradientCor. CoeffFigure no.
CSs341.10.42Figure 1b
SCSs11.350.220.13Figure 1c
VSCSs13.150.420.18Figure 1d
SuCSs0.75-----------
Total CSs59.251.670.53Figure 1
Table 5. Cyclonic storm distribution in solar max. and min.
SSNCSSCSVSCSSuCSTotal
Solar maximum19911461547430
20021044710048
Total2506257478
Average1253133.5239
Solar minimum19968.631250056
20082.925930064
Total11.55634300120
Average5.75281715060
Disclaimer/Publisher’s Note: The statements, opinions and data contained in all publications are solely those of the individual author(s) and contributor(s) and not of MDPI and/or the editor(s). MDPI and/or the editor(s) disclaim responsibility for any injury to people or property resulting from any ideas, methods, instructions or products referred to in the content.