Proceeding Paper

Association between Ambient Air Pollution by Particulate Matter (PM2.5) and Vehicular Traffic in Downtown Port City of Tampico, Mexico †

by
Mariela Estefania Nava-Velez
,
Bárbara A. Macías-Hernández
*,
Edgar Tello-Leal
and
René Ventura-Houle
Faculty of Engineering and Science, Autonomous University of Tamaulipas, Victoria 87000, Mexico
*
Author to whom correspondence should be addressed.
Presented at the 6th International Electronic Conference on Atmospheric Sciences, 15–30 October 2023; Available online: https://ecas2023.sciforum.net/.
Environ. Sci. Proc. 2023, 27(1), 32; https://doi.org/10.3390/ecas2023-16348
Published: 27 October 2023
(This article belongs to the Proceedings of The 6th International Electronic Conference on Atmospheric Sciences)

Abstract

:
The objective of this study was to statistically analyze the concentration of pollution in the air by PM2.5 particulate matter and vehicular traffic using a methodology based on quadrants, considering the periods of “working” and “holiday” activities in the downtown area from the port city of Tampico, Mexico. The vehicular traffic count was carried out in three hourly ranges per day for a week in each period. Moreover, an analysis of the correlation coefficient based on the Spearman method was carried out, both in the working and vacation periods, between the variables of PM2.5 concentration and total vehicular traffic by the hourly range and by day in each quadrant. A strong to very strong correlation (0.828 ≥ r ≤ 0.960) was identified between pollutant concentration and vehicular traffic on several days and quadrants in the work period. On the other hand, in the holiday period, a weak to moderate correlation was observed on most of the days considered in this study.

1. Introduction

The presence of harmful substances or matter in the atmosphere in concentrations that cause damage to the population and ecosystems is identified as air pollution [1]. Various factors that contribute to the increase in air pollution concentration levels have been identified, including meteorological conditions, sociodemographic characteristics, and various activities carried out by humans, among which motorized vehicles stand out [2]. Vehicular traffic has been identified as one of the main sources of air pollution [3]. In this sense, fine particulate matter is identified among criterion-type air pollutants, with diameters of 1.0 to 2.5 μm (μm), known as PM2.5 [4]. This pollutant is estimated to come from 20% of fixed sources, while the remaining 80% is contributed by mobile sources [5]. In previous studies, vehicle exhaust represents an important anthropogenic source of fine airborne particles in urban areas [6]. Furthermore, the friction of automobile tire generates with the pavement during the braking process or with successive rapid braking events contributes 34% to the total emission of particles in the air [7,8].
The importance of studying pollution by particulate matter is that it produces adverse health effects, such as premature death, ischemic heart disease, stroke, lung cancer, chronic obstructive pulmonary disease, and respiratory infections [1]. The authors in [9] report that an increase of 2 μg/m3 in the concentration of PM2.5 and its exposure over a long period is related to a reduction in seven months of life. Furthermore, with the increase in the contaminant’s concentration, mortality risk increases by 3.7% [9]. Therefore, particulate matter pollution impacts air quality, human health, and meteorological conditions [10]. In Mexico, the Ministry of Health issued a maximum permissible annual exposure limit of 12 µg/m3 and 45 µg/m3 in 24 h for PM2.5 to protect the health of the population [11].
Therefore, in this study, the relationship between vehicular traffic and PM2.5 concentration levels recorded in the central area of the City of Tampico, Tamaulipas, in the northeastern region of Mexico, was evaluated. This study considers the vehicular flow of three quadrants surrounding the location of the air quality monitoring station, considering two periods of work and vacation activities. On the one hand, we analyze the relationship between variables considered in this study, using Spearman’s correlation coefficient to measure the effect of vehicular traffic on the concentration of pollutants in the port area.

2. Materials and Methods

2.1. Area of Study

The present study was carried out in the city of Tampico, Tamaulipas, in the north-east of Mexico, which is characterized by a predominantly tropical, subhumid, and warm climate, with an average annual temperature of 25 °C, with a maximum temperature of 34 °C daily average in the months of July and August 2022. The Pánuco and Tamesí rivers stand out in their hydrography, which flow into the Gulf of Mexico. In addition, it is the principal commercial maritime port on the east coast of Mexico, with an extension of 44 km [12]. Furthermore, the city of Tampico is part of a metropolitan area comprising the cities of Altamira, Madero, and Tampico, located in Tamaulipas state, Mexico [13]. According to official public data, the city has a registered vehicle fleet of 121,077 units in circulation [14].

2.2. Data Collection and Analysis

The data on pollution concentration were obtained through an air quality monitoring system installed on the roof of a building with an approximate height of 15 m. The incidence of vehicle flow was obtained by counting all types of combustion cars circulating in three quadrants. The first quadrant is made up of the four avenues surrounding the monitoring station building with an approximate distance of 100 m. The second and third quadrants comprise the following avenues with an approximate distance of 200 and 300 m. Vehicle count was carried out using a manual counting methodology established by the Ministry of Communications and Transportation in Mexico [15], which consists of carrying out a visual count with the help of a manual counter every 15 min with a duration of 5 min. The sampling was performed between 09:00 and 11:00 (morning), 12:00 and 14:00 (noon), 15:00 and 17:00 (afternoon). In a preliminary study using the Google Maps tool, these three-time ranges with the most significant presence of vehicular traffic (peak hours) were identified. Vehicle counting was carried out for seven days (Monday to Sunday) in the month of January 2022 (identified as a work period) and in the second week of April 2022, identified as a vacation period (holiday Easter week). Concentration levels of pollutants in the air and meteorological factors were statistically analyzed using the Kolmogorov–Smirnov Lilliefors test to determine the normality of the data. Moreover, a descriptive analysis was performed by calculating the median, interquartile range (IQR), and minimum and maximum values for the continuous variables of concentrations of air pollutants. The datasets were identified as non-parametric distribution, for which it was determined to apply a Spearman correlation analysis.

3. Results and Discussion

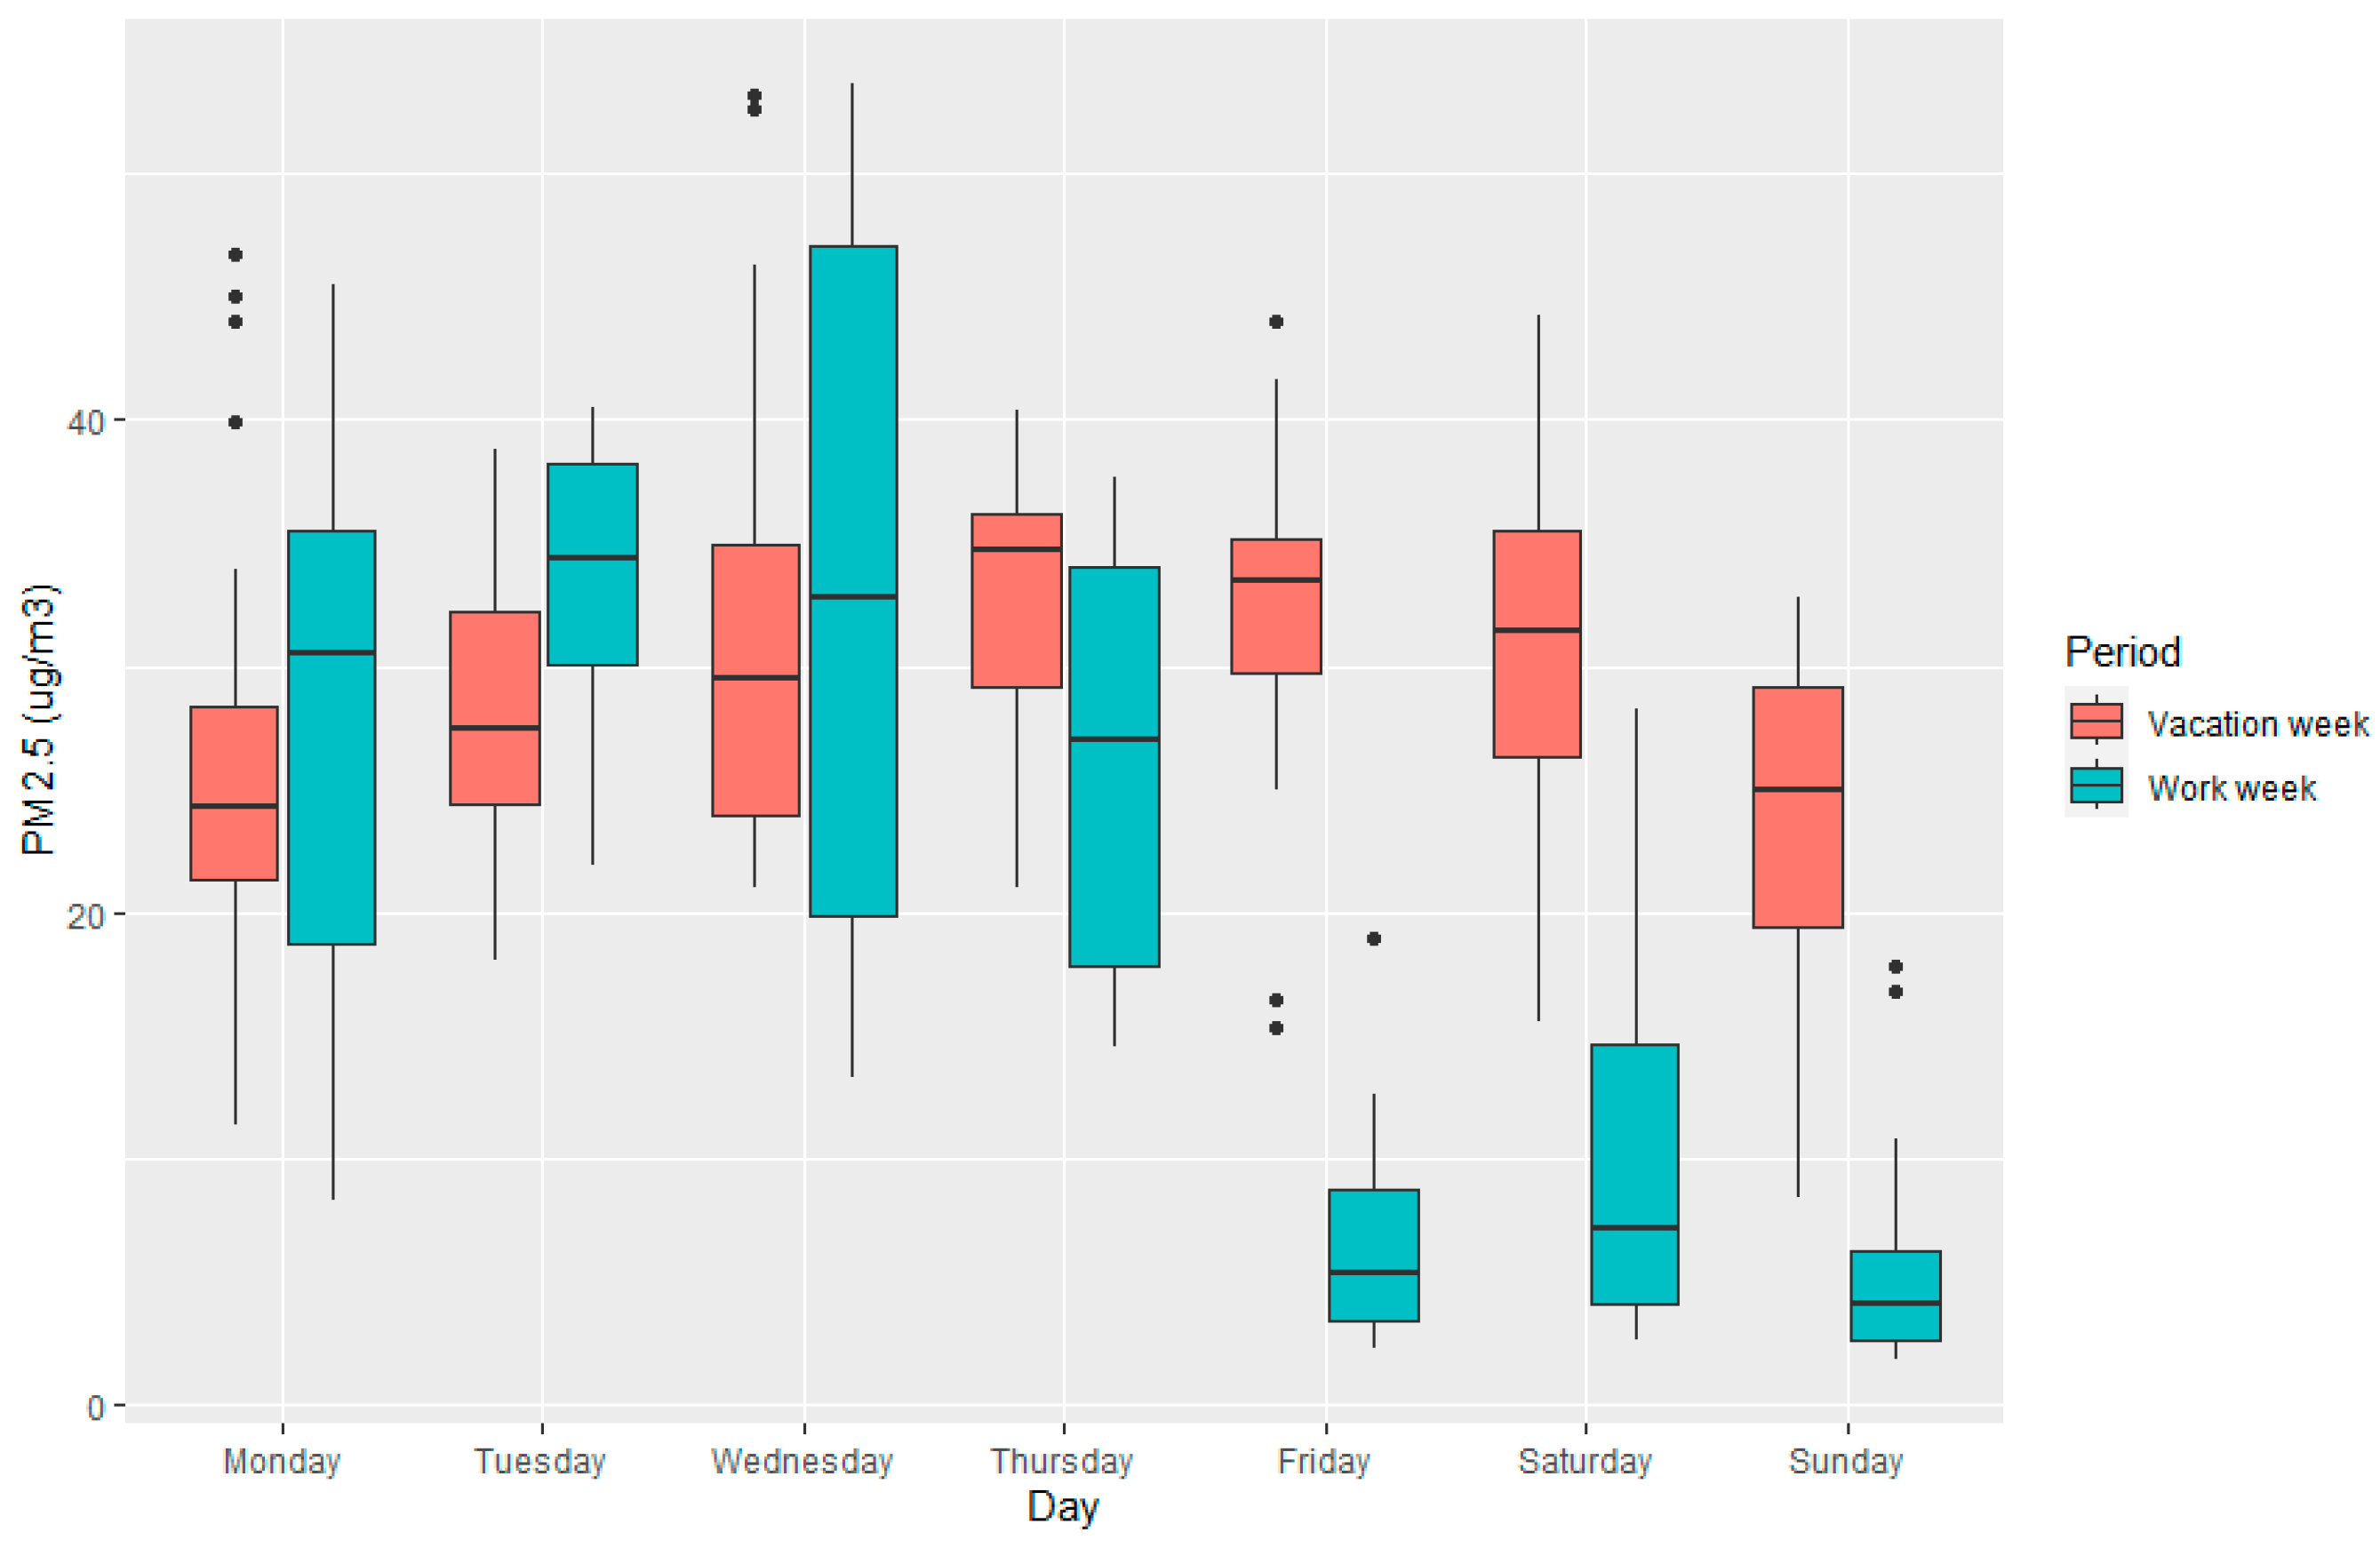
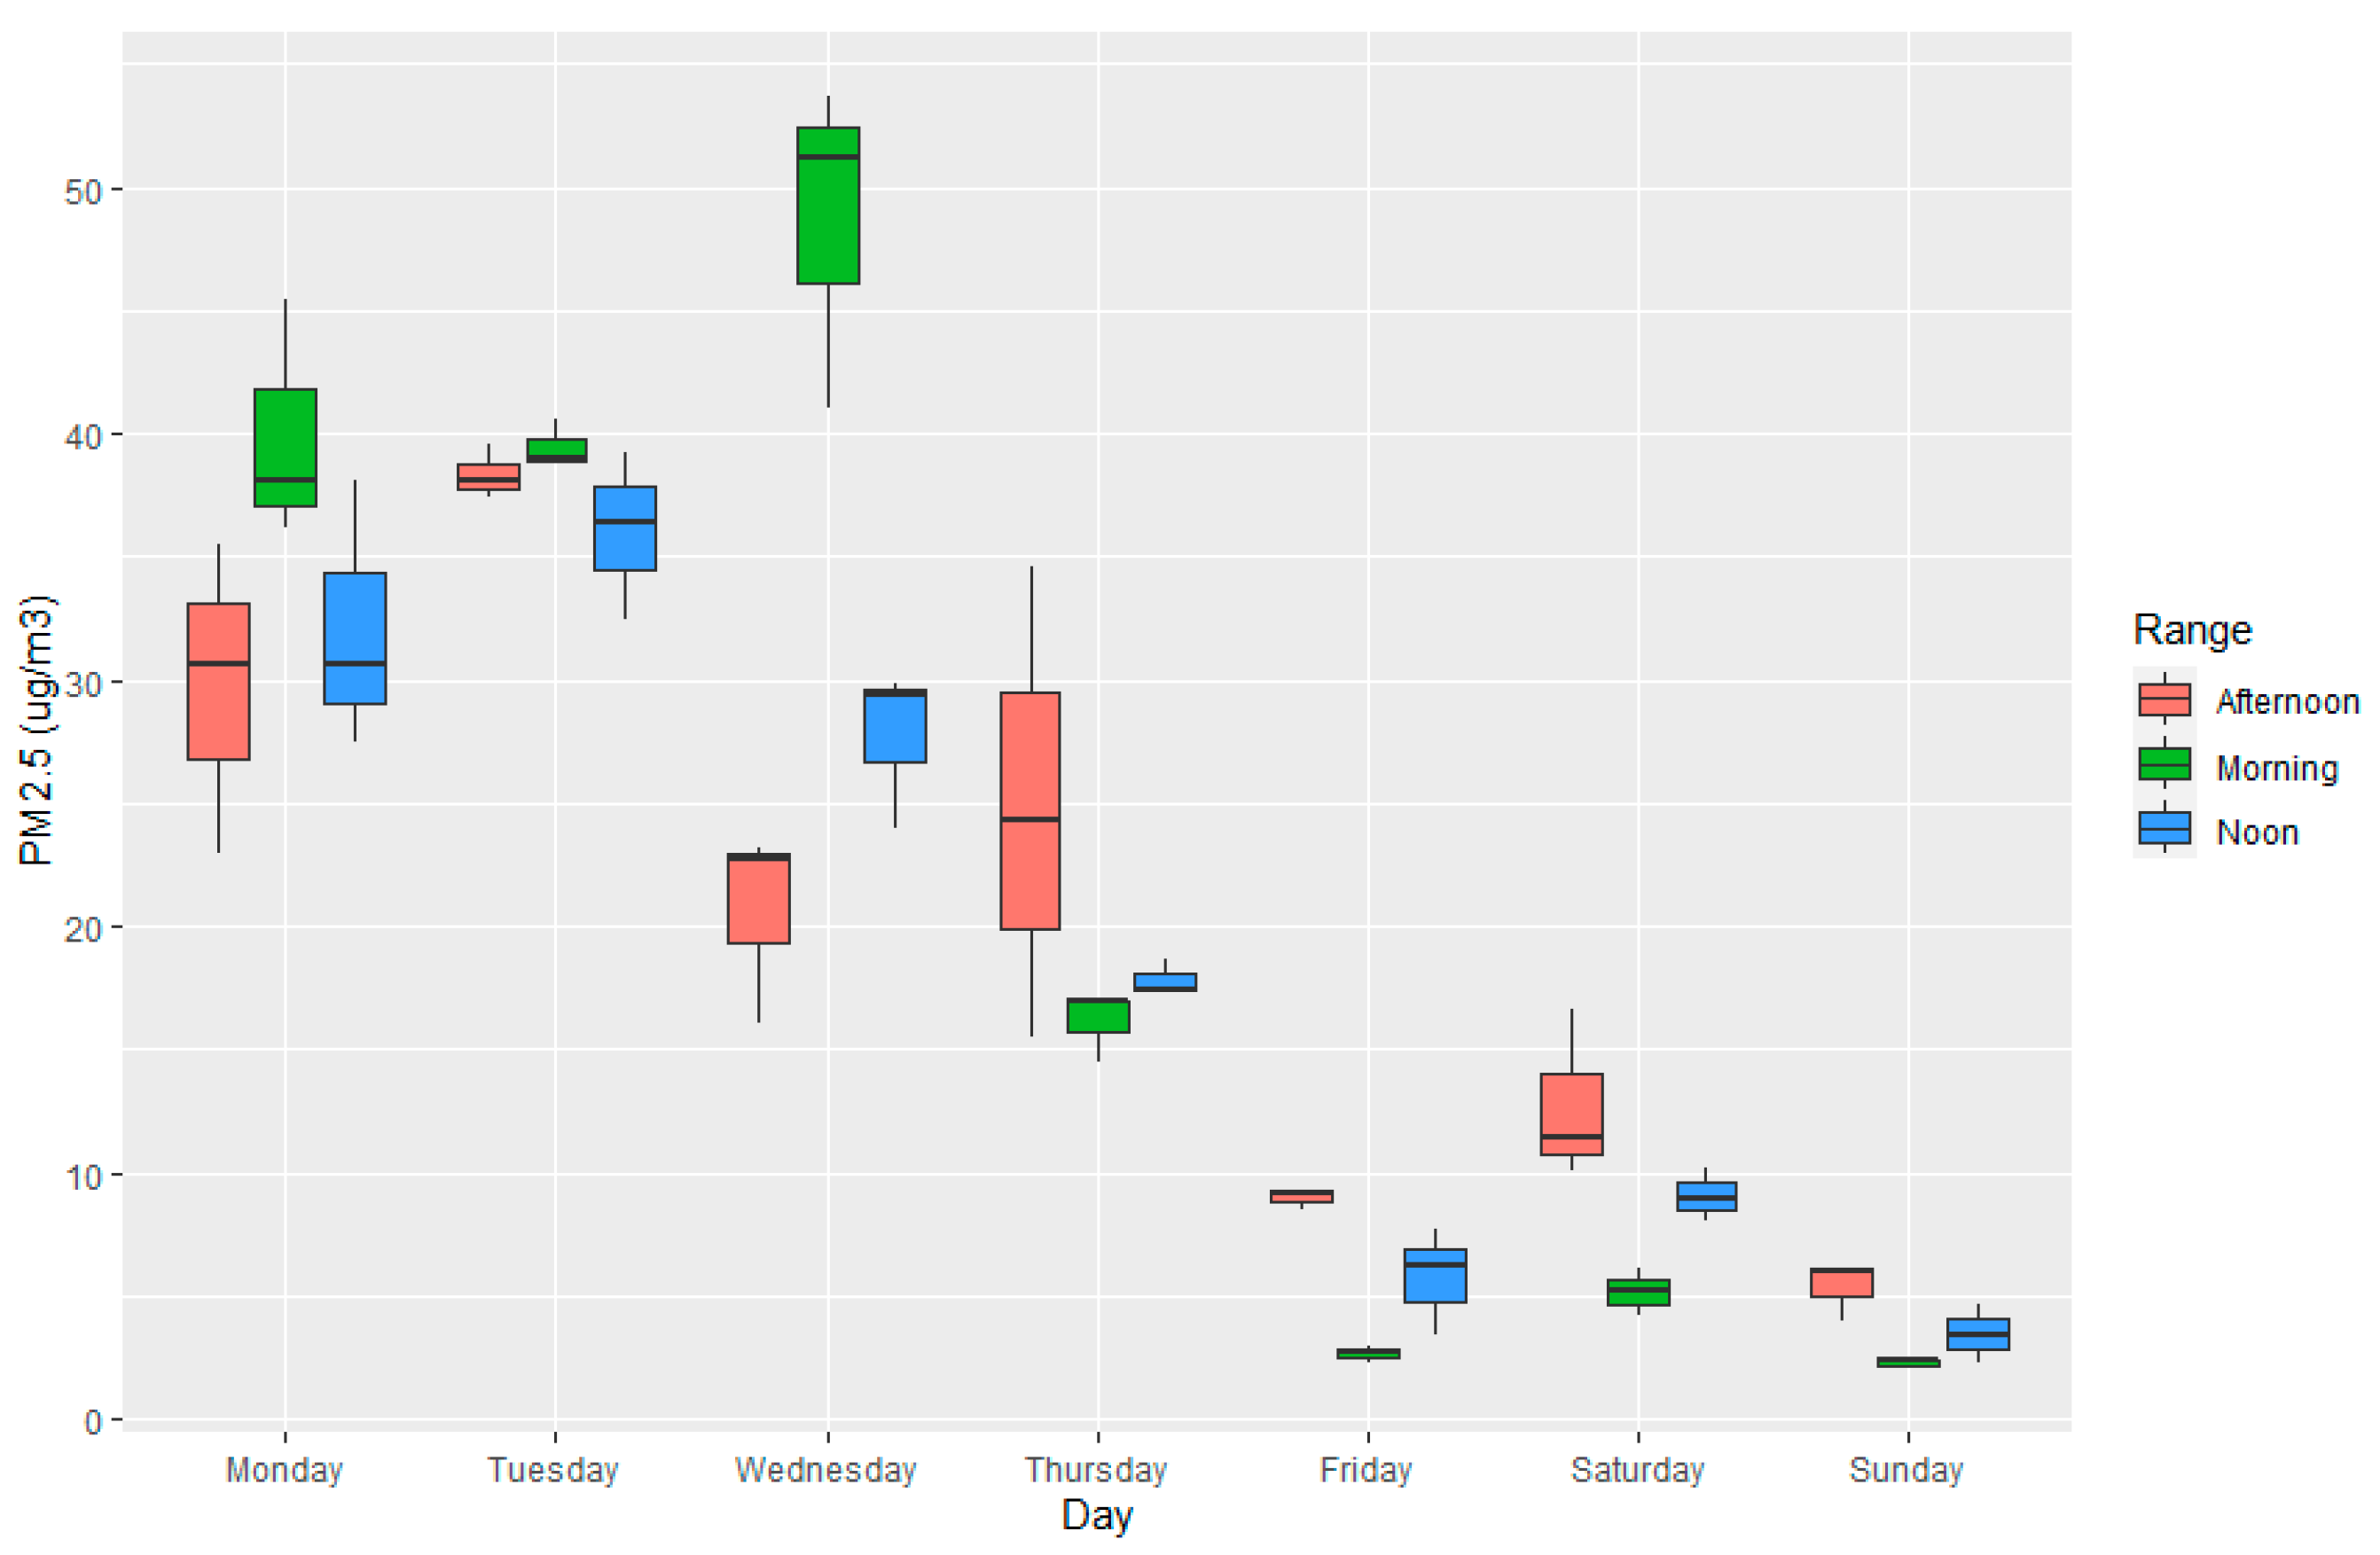
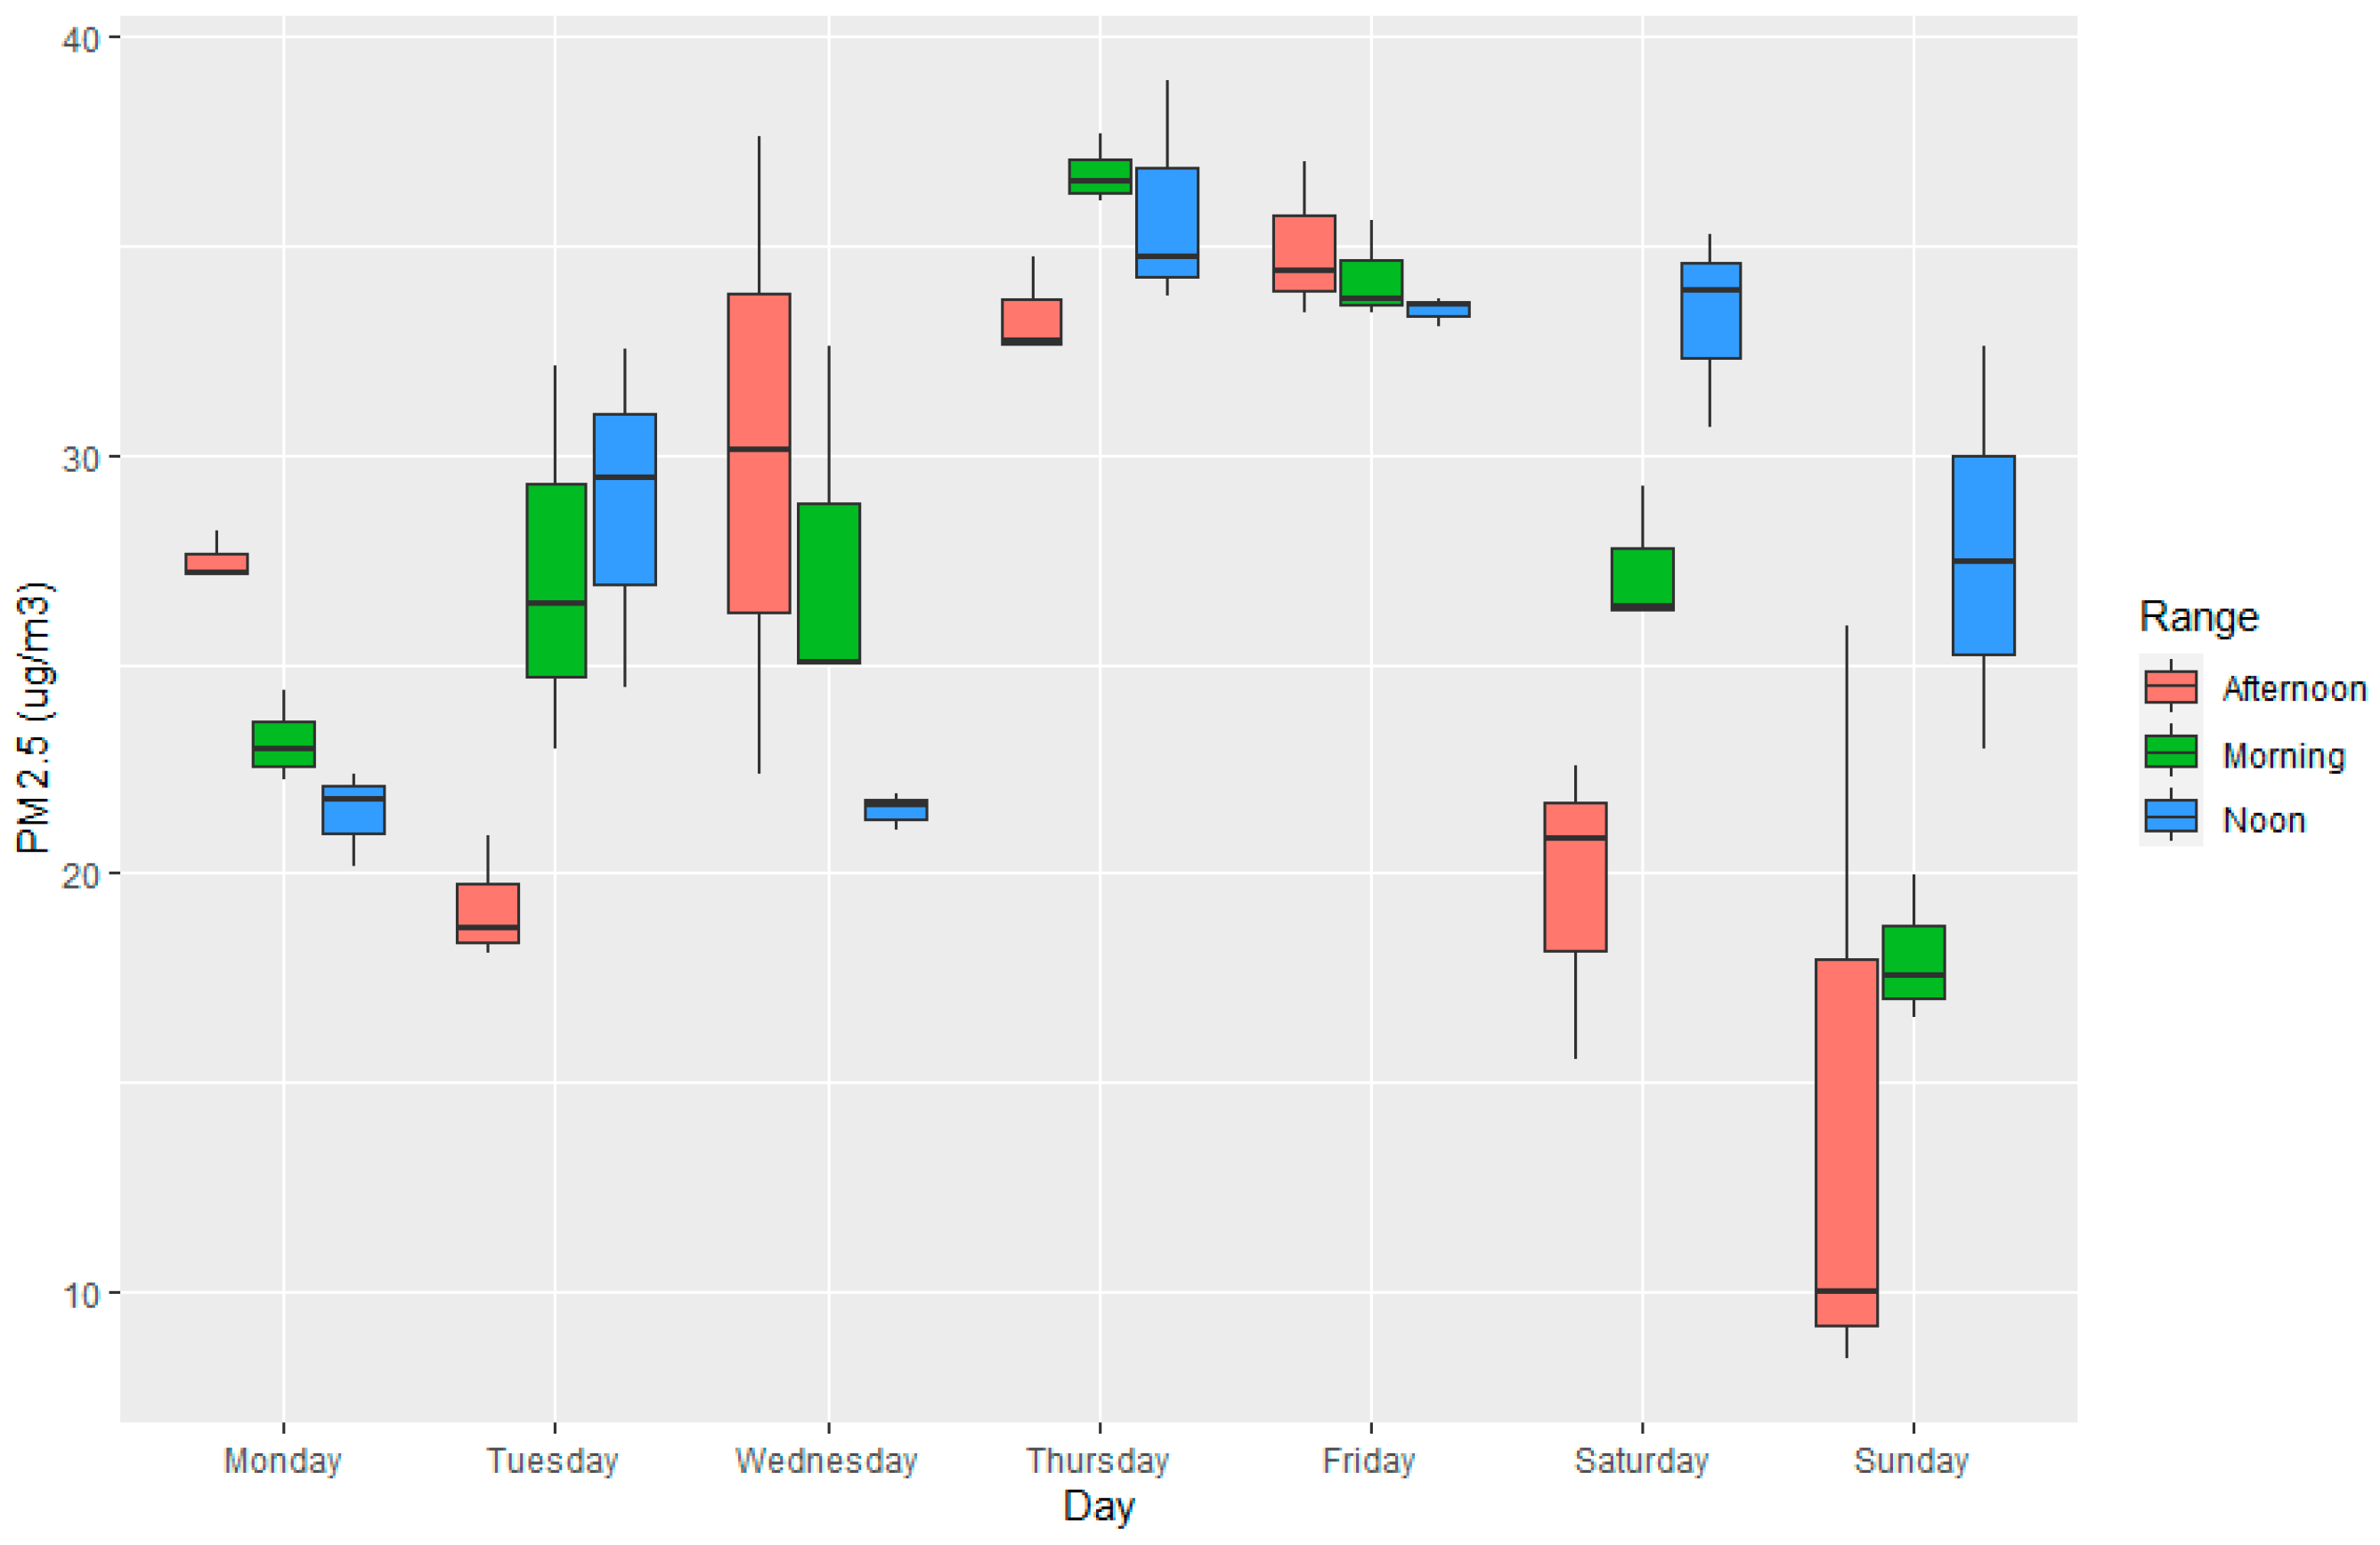
3.1. Descriptive Analysis

A non-parametric distribution was observed to evaluate the normality of the data of the average concentration of PM2.5 for each period (Kolmogorov–Smirnov Lilliefors test, p-value < 0.05). Figure 1 shows that the highest average concentration of PM2.5 was recorded on a Tuesday, with a median (interquartile range) of 38.4 (38.9) µg/m3, and on Wednesday, an average concentration of 29.6 was recorded, with an IQR value of 45.8µg/m3.. These values were recorded during a workweek. On Wednesday, the concentration levels of PM2.5 were very variable compared to the rest of the week, as seen in the box plot in Figure 1. Furthermore, it was identified that the average concentration of PM2.5 decreases on the days of the weekend during the work period. On the other hand, during the holiday period, an increase in PM2.5 concentration levels was observed during the weekend, with medians of 35.3 (36.4), 33.5 (34.1), and 27.7 (30.3) µg/m3 on Thursday, Friday, and Saturday, respectively. This increase is possibly because these days coincided with the Catholic holiday of Holy Week. In this sense, Ref. [16] report the influence of human activities on air quality on short time scales caused by changes in usual activities due to the lifestyle and culture of the region.
Figure 2 shows the PM2.5 concentration levels, classifying the recorded values in the morning, noon, and afternoon range for the work week. This period was defined according to the time ranges in which the vehicular traffic count was carried out in each quadrant. Based on the median concentrations of PM2.5, it is shown that in the work week, the highest pollution level occurred on Wednesday morning, with a value of 52.4 (53.0) µg/m3. On Thursday morning and noon in the holiday period (vacation week), values of 36.2 (36.4) and 36.3 (37.6) µg/m3 were observed, respectively (see Figure 3). The above agrees with the results obtained by [17], which mention that PM2.5 pollution levels are high on workdays. However, they are even higher during the holiday period, as shown by our research results (see Figure 3).

3.2. Correlation Analysis

The results of the correlation analysis between the number of vehicles per quadrant and the PM2.5 concentration levels, calculated using the Spearman correlation coefficient (see Table 1), show a strong negative association between quadrant 1 (Q1) and the concentration of the pollutant recorded on Wednesday and Friday (working period) of −0.943 (p-value < 0.01) and −0.895 (p-value < 0.01), respectively. It is important to consider that the degree of correlation can be influenced by the wind speed (gusts) that occurred on the mentioned days, as [18] reported, where wind currents drag or disperse the pollutant to other areas. Similarly, a moderate to strong positive relationship is identified between the PM2.5 concentration recorded on Sunday and the vehicular flow of C1 of 0.771 (p-value > 0.05). In quadrant 2 (Q3), a moderate to strong positive correlation coefficient of 0.543 and 0.648 was identified for Monday and Tuesday, respectively. Wednesday shows a strong relationship with a correlation coefficient of 0.829 (p-value < 0.05), unlike Friday and Saturday, where a strong negative relationship of −0.828 and −0.943 is observed, with p-value < 0.05 and p-value < 0.01, that is, the greater the number of vehicles, the concentration levels of PM2.5 increase. In quadrant (Q3), Friday shows a very strong (almost perfect) positive correlation coefficient of 0.960 (p-value < 0.01); this means that there is a strong relationship between vehicular traffic and the emission/generation of PM2.5 in this quadrant. In the correlation analysis on Saturday, quadrant 3 shows a negative relationship of −0.838 with a significance level of less than 0.05 (see Table 1).
The analysis of the Spearman correlation coefficient of the data collected on the days of a week of the vacation season is shown in Table 2. Important changes are identified between the coefficients of the work period versus the vacation period, with relationships being mainly weak to moderate in this last period. A moderate to strong negative correlation of −0.796 is perceived between the PM2.5 concentration recorded on Tuesday and the number of vehicles counted in C1. Furthermore, it is observed that a weak association remains between PM2.5 and Q2, as well as PM2.5 and Q3 on Sunday. Furthermore, a moderate correlation was identified in Q2 with PM2.5 concentrations on Monday, Wednesday, and Friday. On Friday, the highest correlation coefficient (0.857, p-value < 0.05) was registered in Q2 and PM2.5. This positive correlation between vehicular traffic and air pollution by PM2.5 during the holiday period is understood by the activities carried out in this area due to the Good Friday festivities, as mentioned by [19], that with greater vehicular traffic, a high concentration of PM2.5 occurs.
Finally, the correlation analysis considers the variables of the periods of the day (morning, noon, and afternoon) both on a workweek and on vacation. Moderate correlation coefficients of 0.580 and 0.534 between Q1 and midday and afternoon are identified in the work period, respectively. These correlation results are like those reported by [3], where they showed a moderate correlation, with a correlation coefficient of 0.496 in the work period. On the other hand, in the vacation period, a moderate positive correlation was identified between Q3 and the “morning” period, with a value of 0.571 and a p-value less than 0.05.

4. Conclusions

According to the data analyzed in this study, it is concluded that, during the work period, the highest PM2.5 concentration levels occurred on Tuesdays and Wednesdays. On the other hand, during the holiday period, the highest concentration levels of the pollutant were recorded on Thursdays and Fridays, possibly caused by the religious festivities celebrated in most locations in the country on the days. On the other hand, in the correlation analysis between vehicular traffic and PM2.5 pollution levels, there is a very strong correlation in Q3 on Friday during the work season. Furthermore, the negative correlation coefficients may be influenced by wind currents that carry the pollutant and may also be due to the type of traffic in Q1 during the work season. Finally, when analyzing the correlations between the variables considering the parts of the day during the holiday season, there is a permanent moderate relationship between vehicular traffic and the concentration of PM2.5 in Q1. The above is because, on vacation, people use their vehicles at any time of the day and week, not only to travel to their work activities as they usually do during the work period.

Author Contributions

Conceptualization, B.A.M.-H. and E.T.-L.; methodology, B.A.M.-H.; software, M.E.N.-V. and E.T.-L.; validation, B.A.M.-H. and E.T.-L.; formal analysis, E.T.-L.; investigation, M.E.N.-V., B.A.M.-H. and E.T.-L.; resources, E.T.-L.; data curation, E.T.-L.; writing—original draft preparation, M.E.N.-V. and E.T.-L.; writing—review and editing, B.A.M.-H.; visualization, R.V.-H.; supervision, B.A.M.-H.; project administration, E.T.-L.; funding acquisition, E.T.-L. All authors have read and agreed to the published version of the manuscript.

Funding

This research received no external funding.

Institutional Review Board Statement

Not applicable.

Informed Consent Statement

Not applicable.

Data Availability Statement

Data are contained within the article.

Acknowledgments

The authors are grateful to the Autonomous University of Tamaulipas, Mexico, and the Municipal Government of Tampico (Mexico) for supporting this work.

Conflicts of Interest

The authors declare no conflicts of interest.

References

  1. Asha, P.; Natrayan, L.; Geetha, B.T.; Rene, J.; Sumathy, B.R.; Varalakshmi, G.; Neelakandan, S. IoT enabled environmental toxicology for air pollution monitoring using AI techniques. Environ. Res. 2022, 205, 112574. [Google Scholar] [CrossRef] [PubMed]
  2. Huang, Y.; Surawski, N.C.; Yam, Y.; Lee, C.K.C.; Zhou, J.L.; Organ, B.; Chan, E.F.C. Re-evaluating effectiveness of vehicle emission control programmers targeting high-emitters. Nat. Sustain. 2020, 3, 904–907. [Google Scholar] [CrossRef]
  3. Wang, Q.; Feng, H.; Feng, H.; Yu, Y.; Li, J.; Ning, E. The impacts of road traffic on urban air quality in Jinan based GWR and remote sensing. Sci. Rep. 2021, 11, 15512. [Google Scholar] [CrossRef] [PubMed]
  4. Manisalidis, I.; Stavropoulou, E.; Stavropoulos, A.; Bezirtzoglou, E. Environmental and health impacts of air pollution: A review. Public Health 2020, 8, 14. [Google Scholar] [CrossRef] [PubMed]
  5. Préndez, M.; Araya, M.; Criollo, C.; Egas, C.; Farías, I.; Fuentealba, R.; González, E.; Henríquez, C.; Romero, H. Urban Trees and Their Relationship with Air Pollution by Particulate Matter and Ozone in Santiago, Chile. Urban Clim. Lat. Am. 2019, 167–206. [Google Scholar] [CrossRef]
  6. Wong, Y.K.; Huang, X.H.H.; Cheng, Y.Y.; Peter, L.K.K.; Yu, A.L.C.; Tangm, W.Y.; Chan, D.H.L.; Zhen, J.Y. Estimating contributions of vehicular emissions to PM2.5 in a roadsite environment: A multiple approach study. Sci. Total Environ. 2019, 672, 776–788. [Google Scholar] [CrossRef] [PubMed]
  7. Farwick, H.F.H.; Marcel, M.; Tomasz, G.; Tim, H.; Marc, R.; Jaroslaw, G.; Rainer, V.; Thorsten, B. On-road vehicle measurements of brake wear particle emissions. Atmos. Environ. 2019, 217, 116943. [Google Scholar] [CrossRef]
  8. Mamakos, A.; Arndt, M.; Hesse, D.; Augsburg, K. Physical Characterization of Brake Wear Particles in a PM10 Dilution Tunnel. Atmosphere 2019, 10, 639. [Google Scholar] [CrossRef]
  9. De Keijzer, C.; Agis, D.; Ambrós, A.; Arévalo, G.; Baldasano, J.M.; Bande, S.; Barrera-Gómez, J.; Benach, J.; Cirach, M.; Dadvand, P.; et al. The association of air pollution and greenness with mortality and life expectancy in Spain: A small-area study. Environ. Int. 2017, 99, 170–179. [Google Scholar] [CrossRef] [PubMed]
  10. Gireesh, P.K.; Lekhana, P.; Tejaswi, M.; Chandrakala, S. Effects of vehicular emissions on the urban environment—A state of the art. Mater. Today Proc. 2021, 45, 6314–6320. [Google Scholar] [CrossRef]
  11. Diario Oficial de la Federación (DOF). Salud Ambiental. Criterio para Evaluar la Calidad del Aire Ambiente, con Respecto a las Partículas Suspendidas PM10 y PM2.5. Valores Normados para la Concentración de Partículas Suspendidas PM10 y PM2.5 en el aire Ambiente, Como Medidas de Protección a la Salud de la Población. NOM-025-SSA1-2021. 2021. Available online: https://www.gob.mx/salud/documentos/norma-oficial-mexicana-nom-025-ssa2-2014-secretariado-tecnico-del-consejo-nacional-de-salud-mental (accessed on 27 June 2023).
  12. Secretaría General del Gobierno del Estado de Tamaulipas (Segob-Tam). Programa Municipal de Ordenamiento Territorial y Desarrollo Urbano del Municipio de Tampico. Available online: http://www.imeplansurdetamaulipas.gob.mx/proyectos/pot-tampico/ (accessed on 24 May 2023).
  13. Secretaría de Desarrollo Agrario, Territorial y Urbano (SEDATU). Zonas Metropolitanas SUN. 2018. Available online: https://dof.gob.mx/nota_detalle_popup.php?codigo=5551585 (accessed on 27 June 2023).
  14. Instituto Nacional de Estadística y Geografía (INEGI). Parque Vehicular. Tampico, Tamaulipas. 2020. Available online: https://www.inegi.org.mx/app/buscador/default.html?q=parque+vehicular+tampico#tabMCcollapse-Indicadores (accessed on 24 April 2023).
  15. Secretaría de Comunicaciones y Transportes. Manual para Obtener los Volúmenes de Tránsito en Carreteras. SCT. 2016. Available online: https://www.sct.gob.mx/fileadmin/DireccionesGrales/DGST/Manuales/manual_volumen_de_transito/Manual_volumenes__2016_v2.pdf (accessed on 24 May 2023).
  16. Hua, J.; Zhang, Y.; de Foy, B.; Xiaodong, M.; Jing, S.; Chuan, F. Competing PM2.5 and NO2 holiday effects in the Beijing area vary locally due to differences in residential coal burning and traffic patterns. Sci. Total Environ. 2021, 750, 141575. [Google Scholar] [CrossRef] [PubMed]
  17. Zhao, S.; Tian, H.; Luo, L.; Liu, H.; Wu, B.; Liu, S.; Bai, X.; Xiangyang, B.; Wei, L.; Liu, X.; et al. Temporal variation characteristics and source apportionment of metal elements in PM2.5 in urban Beijing during 2018–2019. Environ. Pollut. 2021, 268, 115856. [Google Scholar] [CrossRef] [PubMed]
  18. He, K.; Wang, Y.; Su, W.; Yang, H.A. Varying-coefficient regression approach to modeling the effects of wind speed on the dispersion of pollutants. Environ. Ecol. Stat. 2022, 29, 433–452. [Google Scholar] [CrossRef]
  19. Beleño, M.L.; Colegial, G.; Juan, D.; Barrera, P.; Martha, L. Correlación entre el flujo vehicular, el PM2.5 y variables meteorológicas, un estudio de caso al oriente de Bucaramanga (Colombia). Bistua Rev. De La Fac. De Cienc. Básicas 2020, 18, 15–25. [Google Scholar] [CrossRef]
Figure 1. PM2.5 concentration level during work period versus holiday period.
Environsciproc 27 00032 g001
Figure 2. Analysis of the concentration of PM2.5 in ranges per day during a week of work activities.
Environsciproc 27 00032 g002
Figure 3. PM2.5 level recorded in ranges per day during a holiday week.
Environsciproc 27 00032 g003
Table 1. Analysis of the Spearman correlation coefficient considering all variables in a workweek.
MondayTuesdayWednesdayThursdayFridaySaturdaySunday
Q10.486−0.437−0.943 **−0.257−0.895 **0.2900.771
Q20.5430.6480.829 *−0.371−0.828 *−0.914 *−0.371
Q3−0.543−0.5610.0290.3710.960 **0.838 *0.371
** p-value < 0.01, * p-value < 0.05.
Table 2. Analysis of the Spearman correlation coefficient during the vacation period.
MondayTuesdayWednesdayThursdayFridaySaturdaySunday
Q10.331−0.796 *−0.657−0.504−0.5510.261−0.257
Q2−0.591−0.1070.6000.6310.857 *0.4860.314
Q30.444−0.097−0.2570.454−0.442−0.4860.257
* p-value < 0.05.
Disclaimer/Publisher’s Note: The statements, opinions and data contained in all publications are solely those of the individual author(s) and contributor(s) and not of MDPI and/or the editor(s). MDPI and/or the editor(s) disclaim responsibility for any injury to people or property resulting from any ideas, methods, instructions or products referred to in the content.

