Proceeding Paper

Optimal Water Quality Simulation of the Proposed Water Distribution System for the University of Kashmir Using EPANET 2.2 and Leakage Modelling of the Network Using EPANET Extension—WaterNetGen †

1
M-TECH (Water Resources Engineering), National Institute of Technology, Srinagar 190006, India
2
Department of Civil Engineering, National Institute of Technology, Srinagar 190006, India
*
Author to whom correspondence should be addressed.
Presented at the 7th International Electronic Conference on Water Sciences, 15–30 March 2023; Available online: https://ecws-7.sciforum.net.
Environ. Sci. Proc. 2023, 25(1), 27; https://doi.org/10.3390/ECWS-7-14251
Published: 16 March 2023
(This article belongs to the Proceedings of The 7th International Electronic Conference on Water Sciences)

Abstract

:
Water quality is the most important parameter of portable water. Therefore, water quality simulation is of the utmost importance, along with carrying out the hydraulic analysis of a water distribution network. In the current study, it has been attempted to carry out the water quality simulation of the proposed distribution network for the University of Kashmir using EPANET 2.2 software. The study also aims to obtain the optimal performance of the designed network in terms of water quality parameters. Furthermore, the leakage modelling for the network has been carried out using the EPANET extension—WaterNetGen. It was found that important water quality parameters, like residual chlorine at nodes and water age, were within the standard ranges throughout the simulation period. The minimum concentration of chlorine up to the 11th hour of the simulation was 0.2 mg/L, and the maximum age of water in the storage tank was 12.5 h throughout the simulation period. The total leakage discharge obtained was negligible, equal to 0.1% and 0.15% of the design discharge for WDS part I and part II, respectively. The objective function of maximum efficiency of performance, with respect to water quality of the proposed network, was achieved.

1. Introduction

The quality of water is representative of its suitability for domestic and institutional use. Water quality analysis and modelling is an important aspect of the water distribution system (WDS) design, along with the efficient hydraulic performance of the network [1,2]. A water quality model has to be an optimal solution, like that of the hydraulic model, to achieve the maximum efficiency of the performance of a WDS [3]. Important water quality parameters like concentration of chlorine, decay of chlorine in the system [4,5] and water age [6] have to be modelled, so as to ascertain that the quality of the water is as per the standards [7]. Standard values of these parameters are vital for the optimality of the water quality model, indicating that these parameters are the decision variables for the optimal model, with the standard ranges of these variables as constraints. Leakage modelling is another important requisite of an optimal WDS model. Estimation of the amount of leakage discharge is vital for the efficient performance, with respect to hydraulics, as well as water quality of a WDS [8]. EPANET extension—WaterNetGen is an effective tool for modelling the leakage with a fair degree of accuracy and ease of use [9].
An optimal solution of the hydraulic design of WDS for the University of Kashmir (UOK) was proposed by using EPANET 2.0 in the earlier study. The WDS consists of two separate networks for two different divisions of the study area. Current work is an extension of the work done earlier, such that an optimal water quality model for the proposed WDS is formulated using the pressure driven analysis (PDA) approach of EPANET 2.2. The leakage modelling of the proposed network has been done by WaterNetGen.

2. Methodological Approach and Analysis

A quantitative pressure driven analysis approach (PDA) was used to produce an optimal water quality model of the proposed water distribution system (WDS) for the University of Kashmir (UOK) by using EPANET 2.2. Study of the literature was conducted and the most important water quality parameters, like chlorine concentration, decay of chlorine and water age, were taken as the decision variables for optimal modelling. Standard codes and books were consulted to set out the constraints for the decision variables. Finally, the leakage modelling of the network was carried out by using EPANET extension—WaterNetGen—to access the amount of leakage discharge at the nodes.

2.1. PDA of Water Quality of the Network Using EPANET 2.2

A more realistic PDA approach was used to carry out the water quality modelling, such that the variables were a function of the available pressure head at the nodes. Water quality parameters like chlorine concentration, decay of chlorine and water age were modelled using a PDA approach of the EPANET 2.2 [10]. Various input parameters, like reaction order, reaction coefficient for the bulk and wall reactions of chlorine and limiting concentration of chlorine equal to 0.2 mg/L [7], were provided to run the software successfully. The initial concentration of chlorine added to the supply tank was equal to 2 mg/L (optimum dosage of chlorine, as per the ground water quality test data provided by UOK).

2.2. Leakage Modeling by EPANET Extension—WaterNetGen

The background leakage discharge Qk leak in any pipe (k) of length (Lk) was estimated after entering the values of background leakage coefficient per unit pipe length (βk) and background leakage exponent (αk) for each pipe, as per the following equation [11,12]: Qk leak = βk Lk (Pk)αk; βk = 10−7, αk = 1.18. The nodal leakage flow at any node ‘i’ due to the background leakage of the pipes connected at the node was estimated after running the software, as per the following equation [11]: Qi leak = ½ Σ Qk leak, where ‘k’ iterates over all the pipes connected at ‘i’
Finally, the emitter discharge at the nodes was obtained after providing the value of emitter coefficient ‘βi’ to each node, which was calculated from the following equation [11,12,13]: Qi leak = βi (Pi)0.5, where (Pi) is the node pressure.

2.3. Optimization of the Water Quality Model

An optimal solution of the water quality model was obtained by selecting the following objective function subject to the decision variables and constraints, as given below:
Objective function: maximization of efficiency of performance, with respect to the water quality of the proposed WDS, without affecting the hydraulic performance.
Decision variables: the following water quality parameters were taken as the decision variables; chlorine concentration, water age.
Constraints: chlorine concentration ≥ 0.2 mg/L [7], average water age ≤ 1.3 days and maximum water age ≤ 3 days [6].

3. Results and Discussion

3.1. Chlorine Concentration at the Nodes

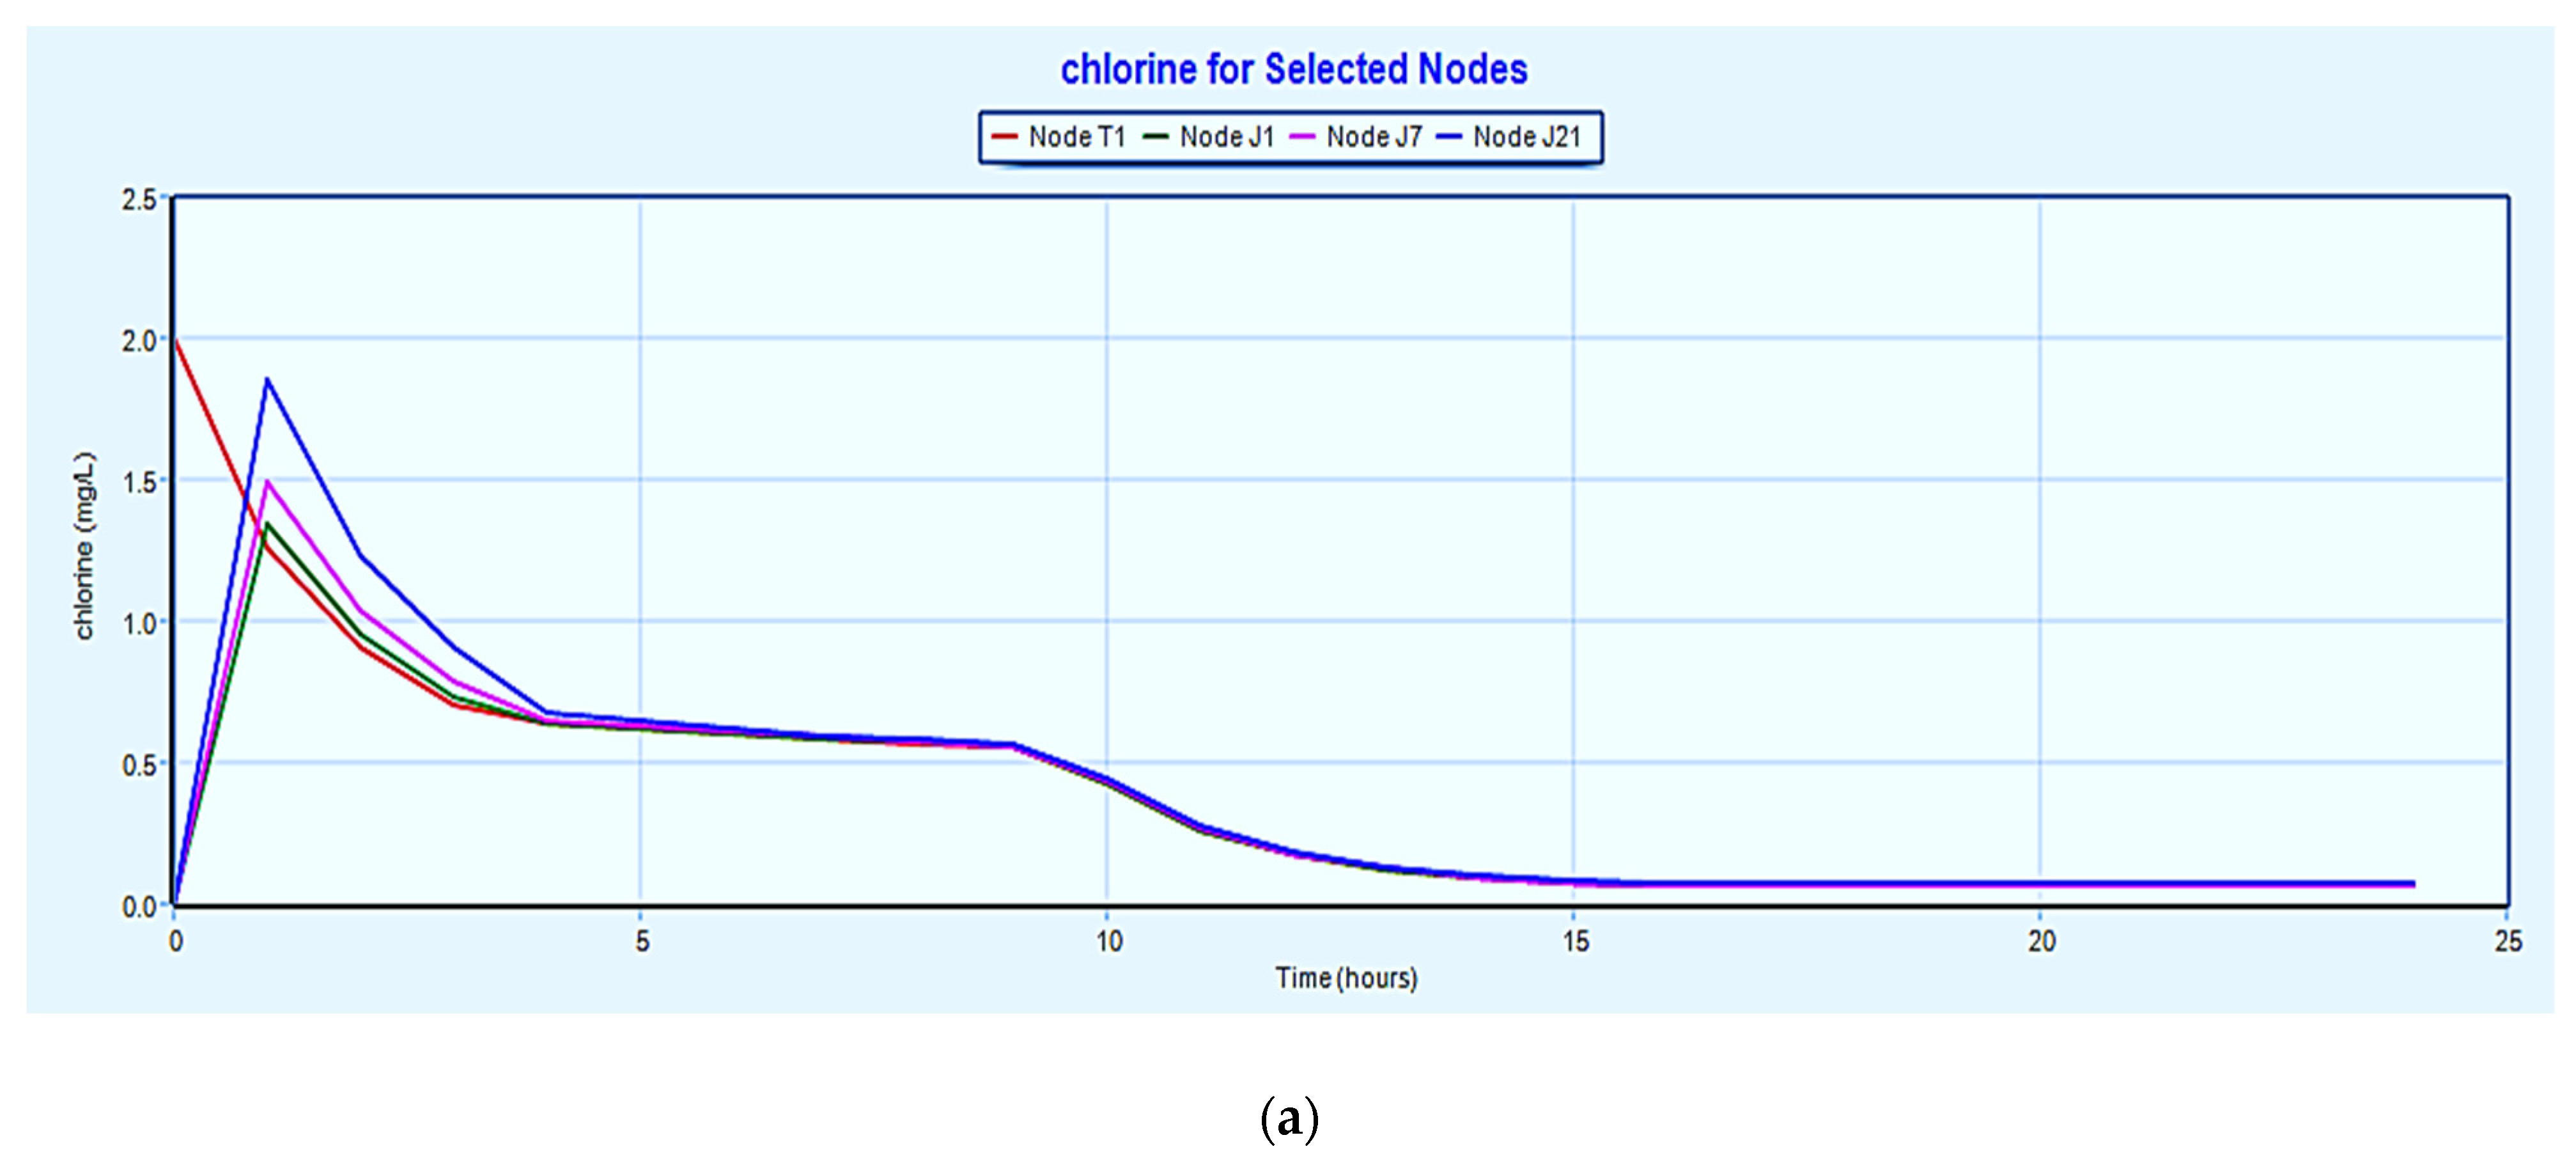
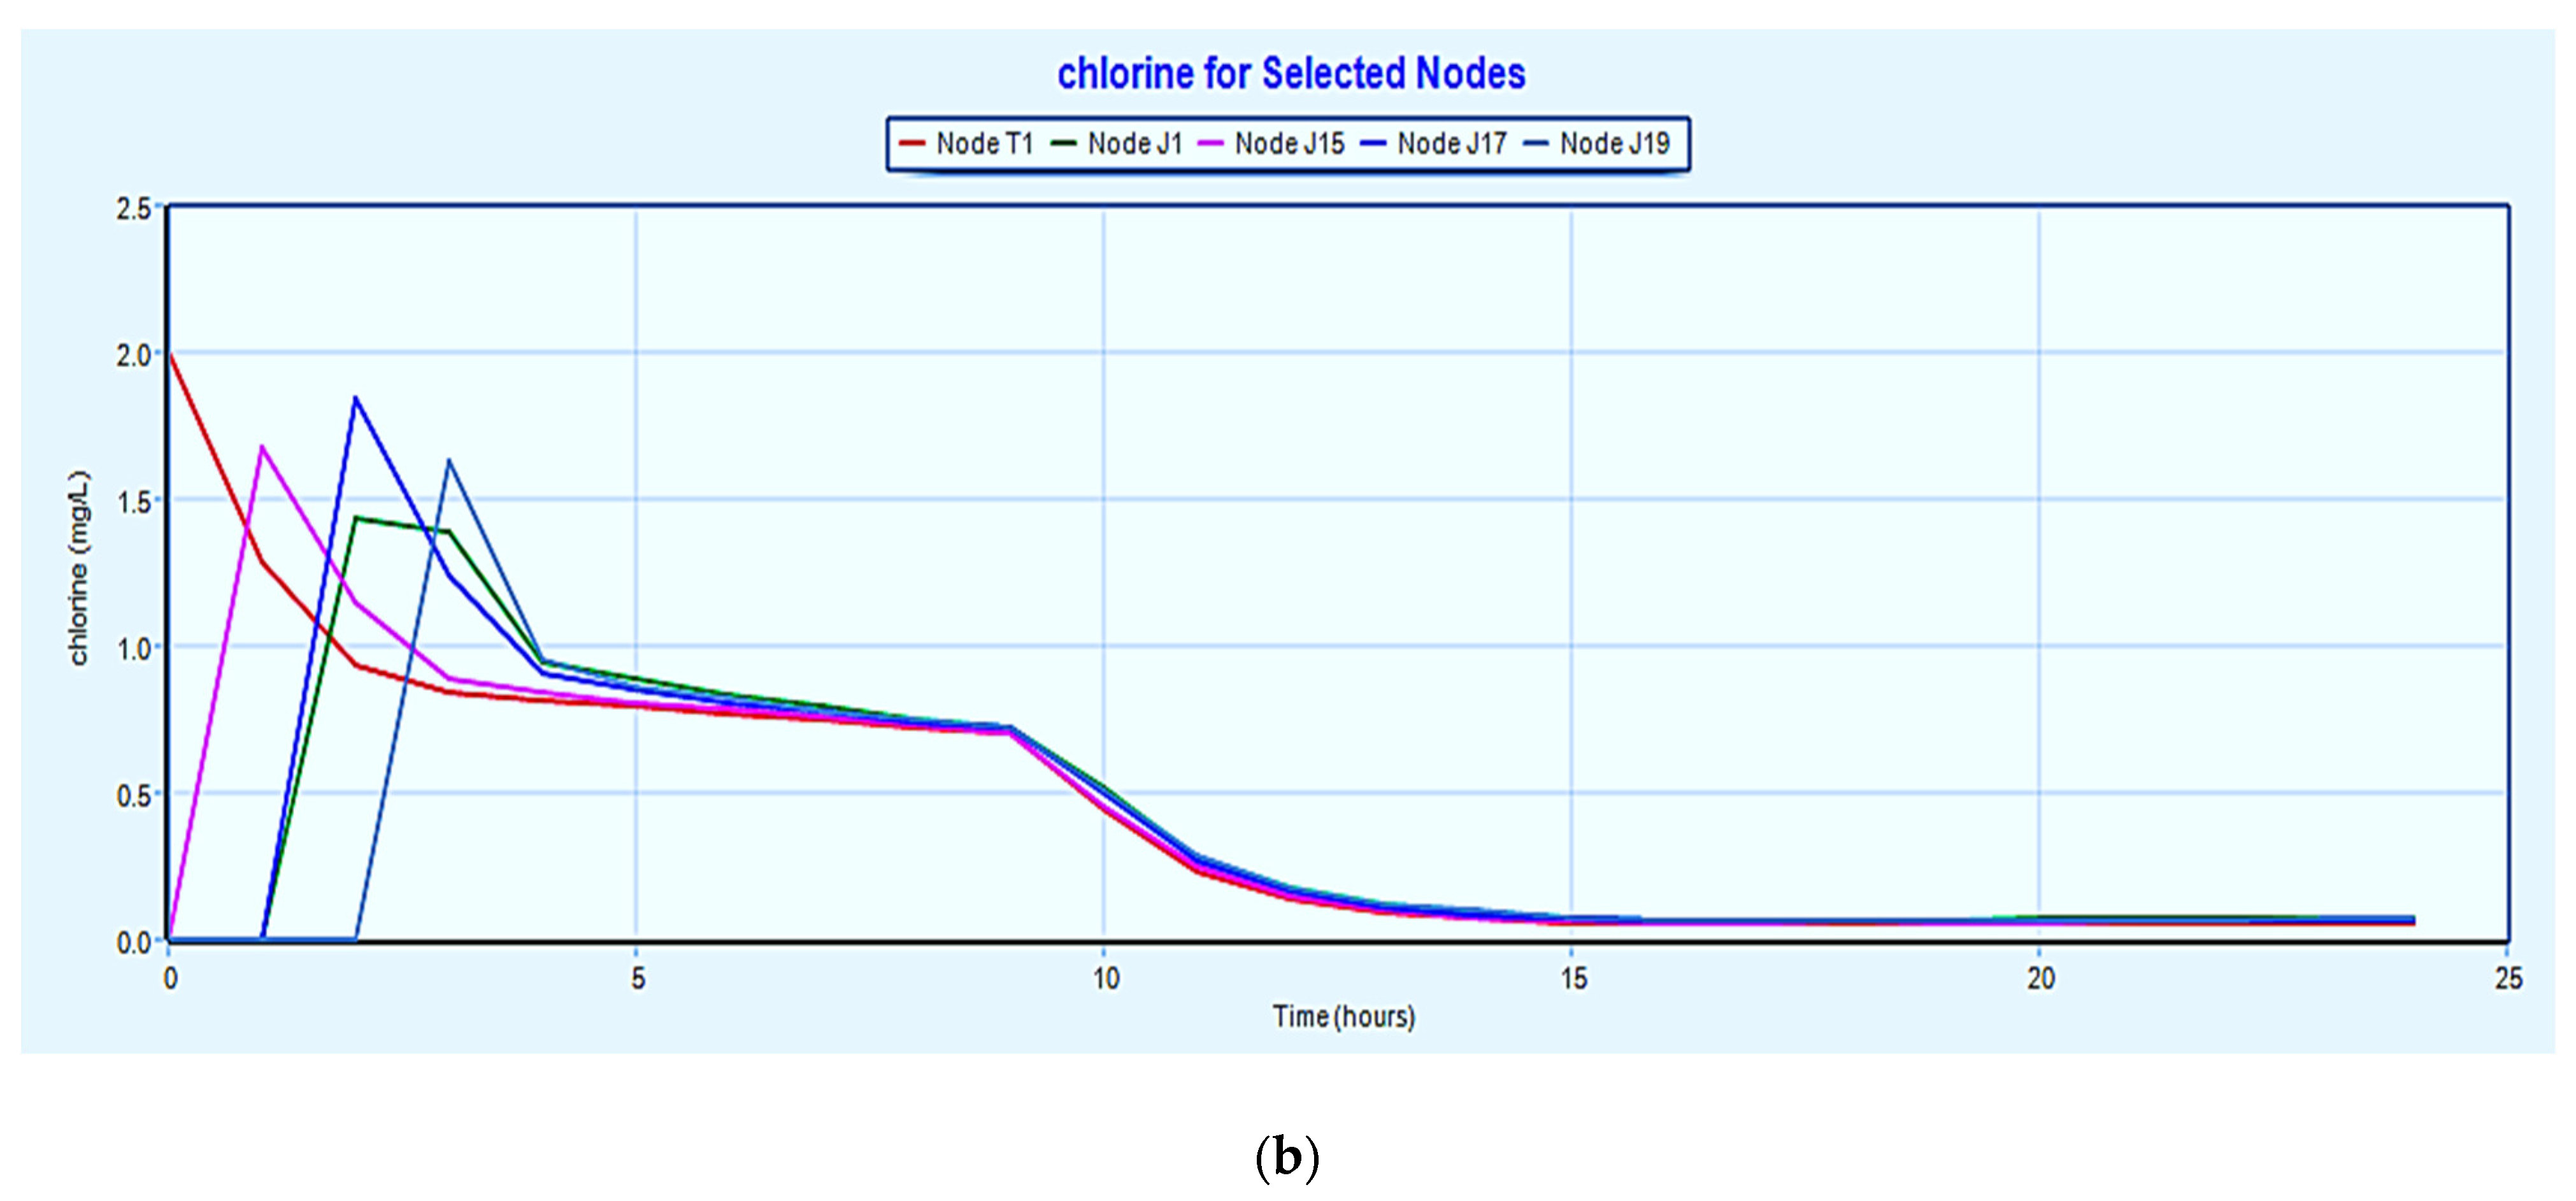
The minimum required concentration of residual chlorine at any point in a WDS is 0.2 mg/L. Figure 1a,b indicates that the chlorine concentration at all the nodes of WDS, part I and part II, at the hour of peak demand is above 0.2 mg/L. From the analysis, 0% of the nodes have a chlorine concentration below 0.58 mg/L at the hour of peak demand in WDS part I, 0% nodes have a chlorine concentration below 0.735 mg/L in WDS part II. Figure 2a,b indicates that there is a drop in the concentration of chlorine, below 0.2mg/L, at the peak demand nodes and the storage tank at 12 pm and onwards. Thus, there is a need to re-add the chlorine at the source node (storage tank) at 12 pm.

3.2. Decay of Chlorine in the System

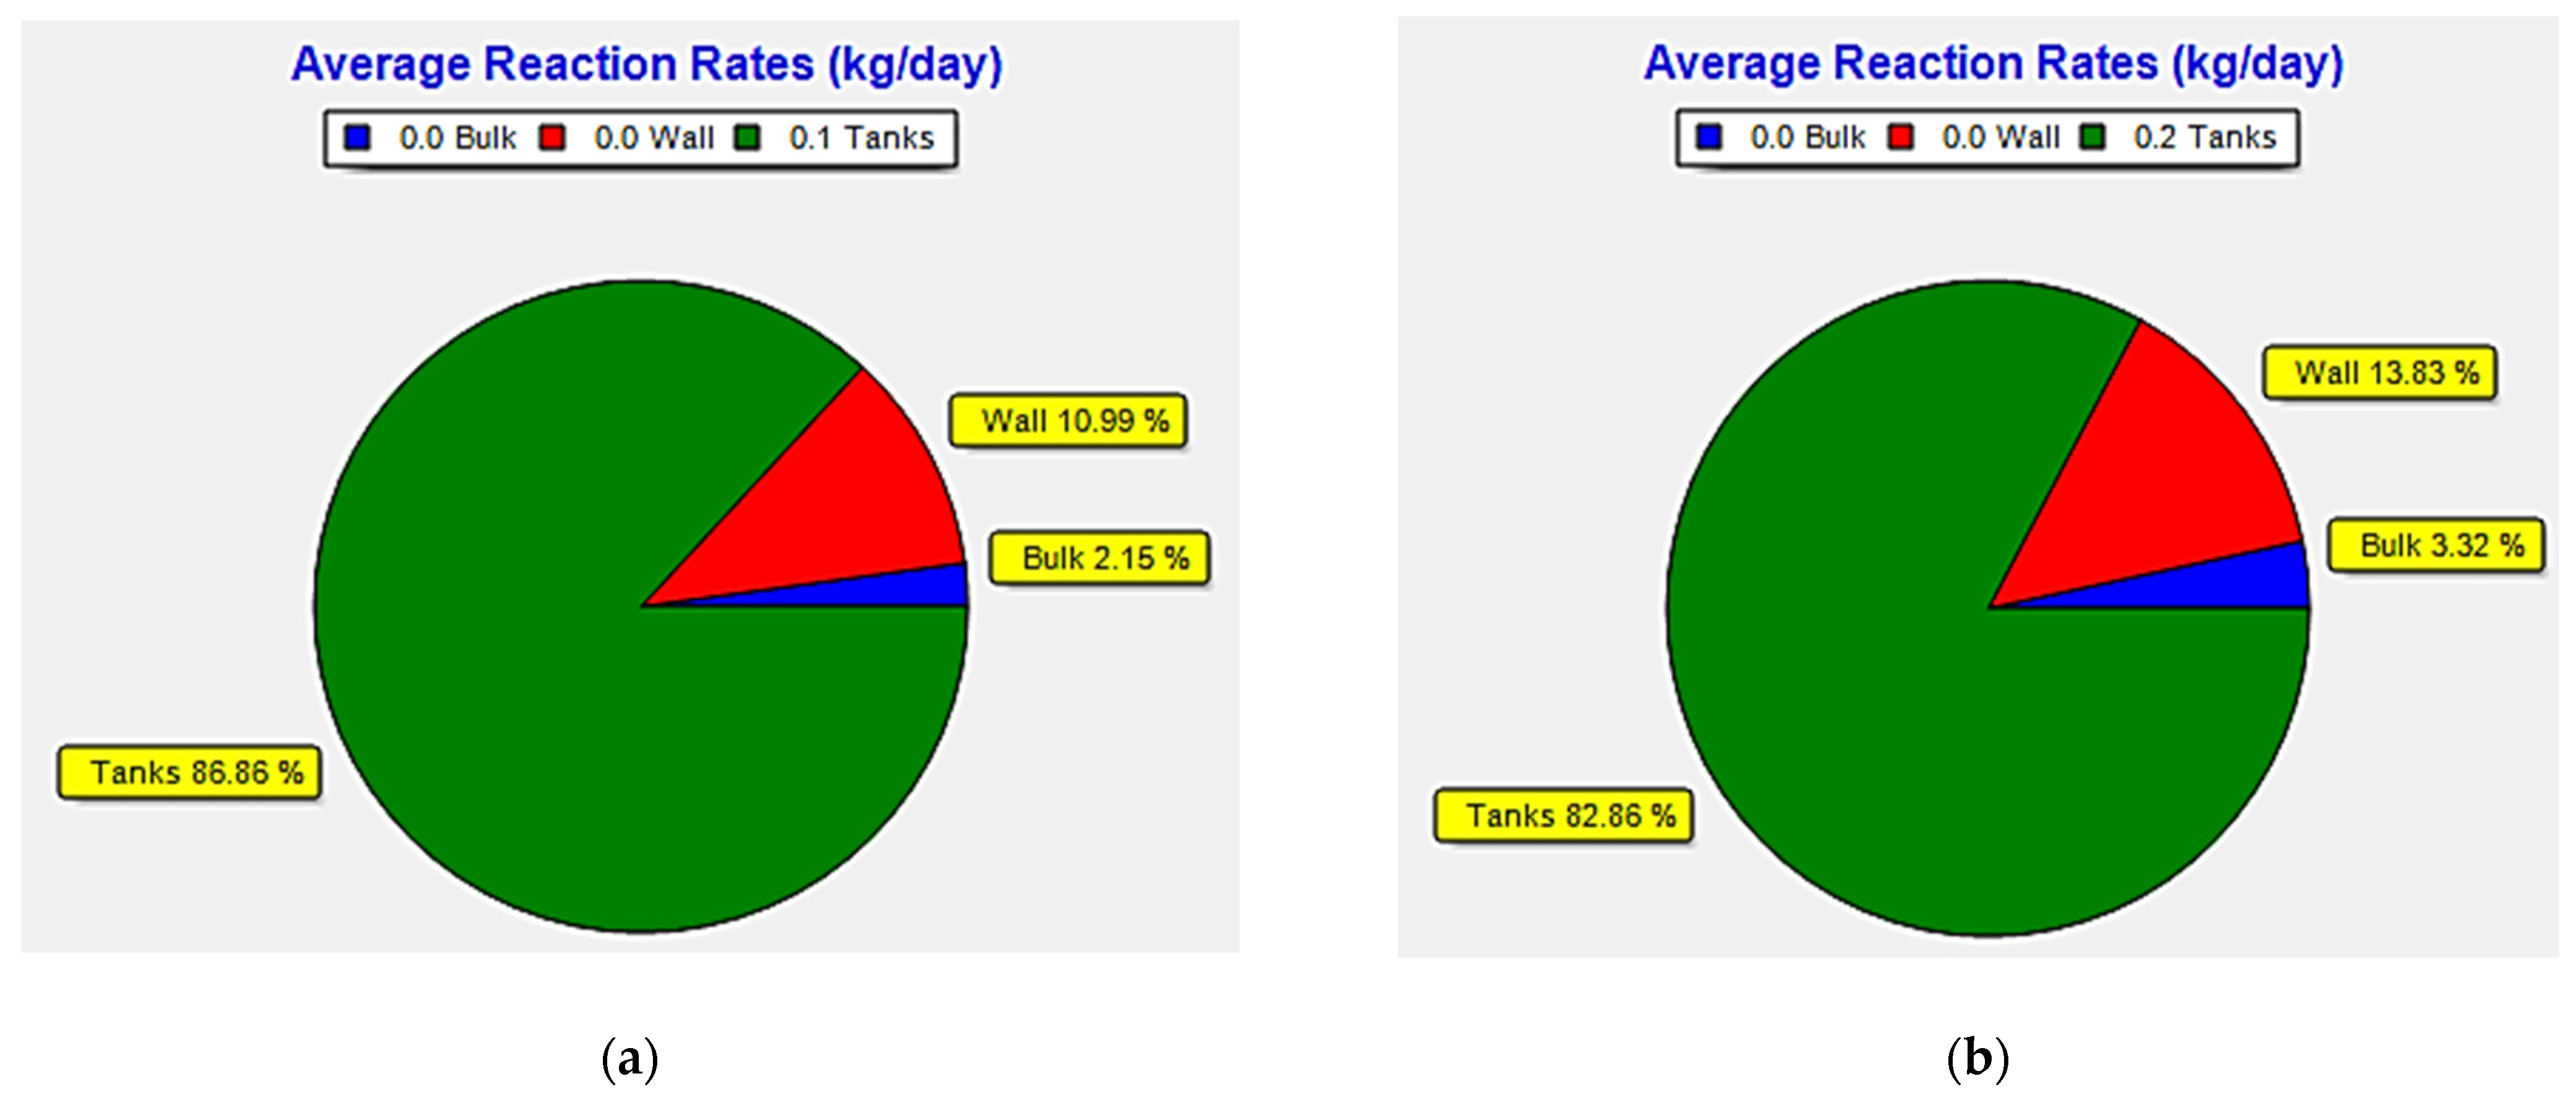
As indicated in Figure 3a,b, the maximum percentage decay of chlorine is taking place in the storage reservoir in both parts of the WDS, due to the reaction within the bulk of the fluid in the storage tank. The decay, due to wall reactions, is lower due to the assumption of the use of lined G.I pipes. The decay percentage is due to the reaction of chlorine in the bulk of the water in pipes.

3.3. Time Series Graph for Age of Water in the Storage Tank

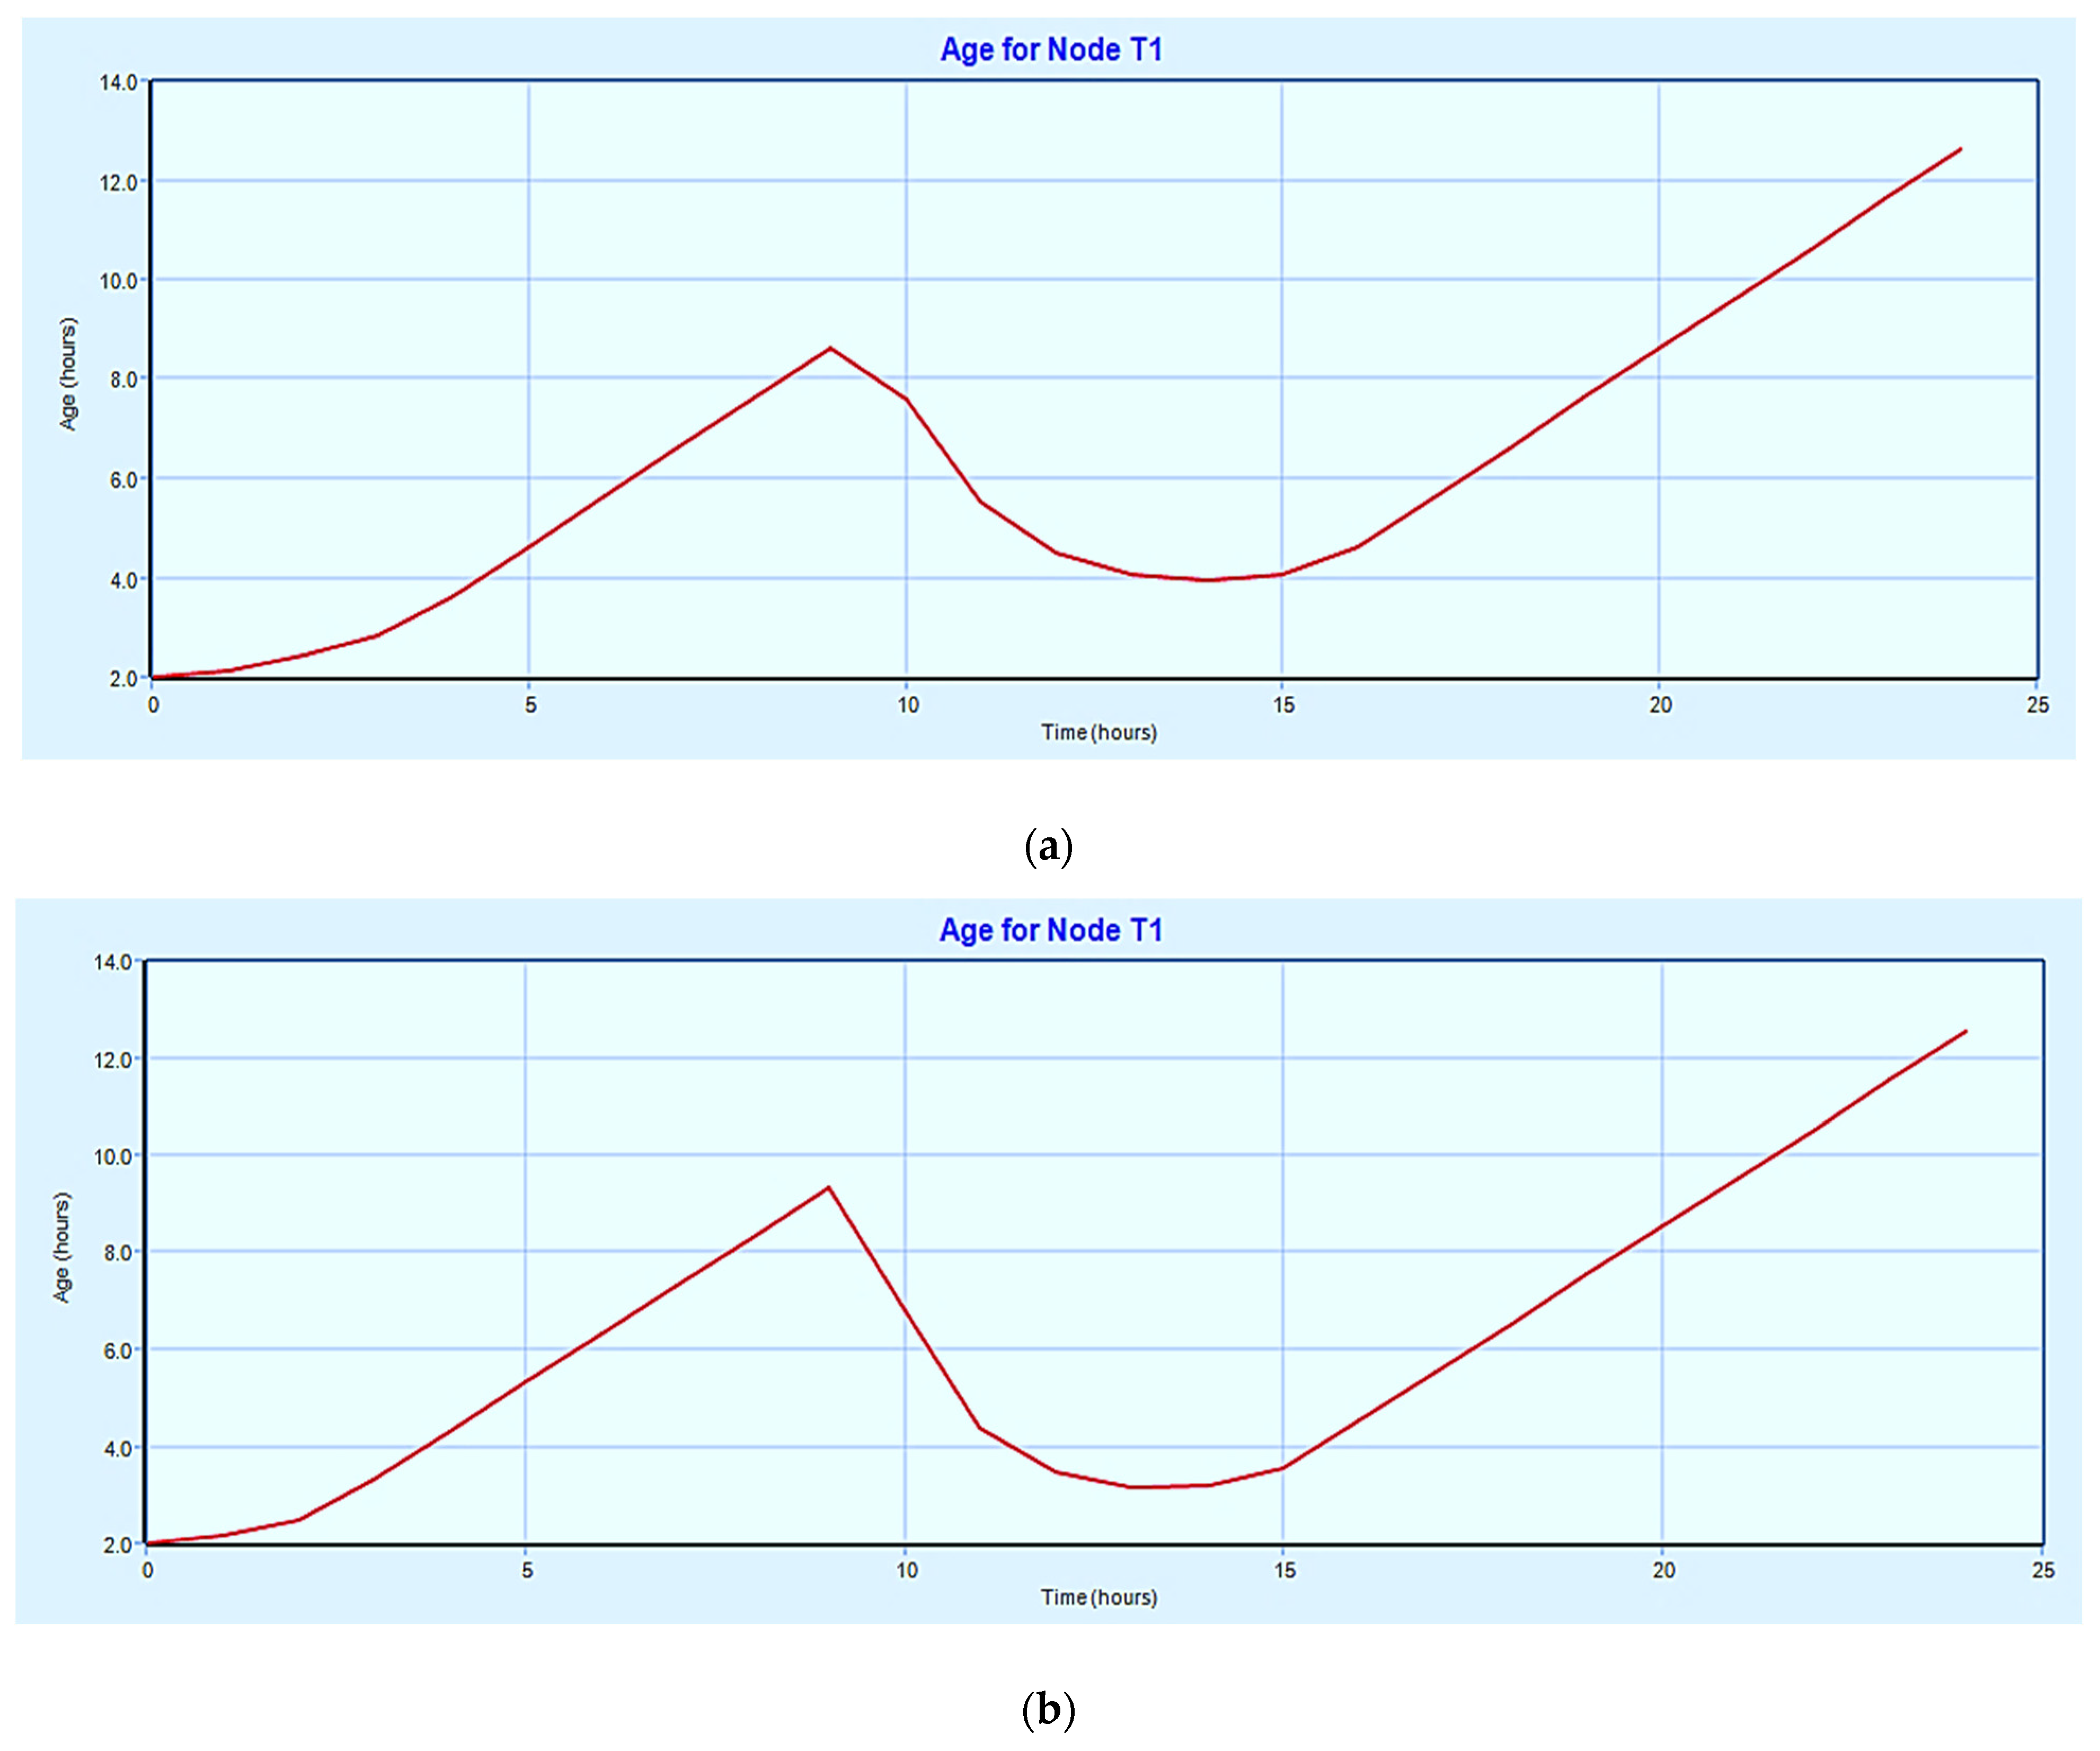
The increased age of water in a WDS is related to the growth of disinfection by products like trihalomethanes, microbial growth, etc. The maximum age of water in a WDS is limited to about 3 days [6]. In both the WDS, part I and part II, the maximum age of water in the storage tank is 12.5 h (Figure 4a,b).

3.4. Leakage Modelling of the Network by EPANET Extension—WaterNetGen

The emitter discharge at the nodes, which is contributed to the background leakage of the pipes connected at a node, was modelled. The emitter coefficient for each node was evaluated, as explained in Section 2.3. The emitter coefficient corresponding to the time of occurrence of the maximum background leakage and pressure head at the node was taken as the design value. For WDS part I, the emitter coefficient corresponding to 4 h, and for WDS part II, that corresponding to 3 h, was entered for each node. The values of emitter discharge at the nodes at the hour of peak demand were obtained, as in Table 1 and Table 2, indicating negligible leakage discharge in the WDS—0.1% for WDS part I and 0.15% for WDS part II.

4. Conclusions and Future Scope

In this work, an optimal solution of water quality modelling of the proposed WDS for the University of Kashmir has been provided. Chlorine concentration and water age were taken as the decision variables for optimal design. Water quality modelling was carried out by the PDA approach of the EPANET 2.2, and the leakage modelling of the network was done by EPANET extension—WaterNetGen. The objective function of maximum efficiency of water quality performance was achieved, subject to the standard values of the decision variables and minimum percentage of leakage discharge, which was verified without affecting the optimality of the hydraulic design of the network. The main highlights of the work include the following:
The standard minimum chlorine concentration of 0.2 mg/L was maintained at each node up to 11 h of the simulation. However, a re-addition of chlorine to the water in the storage reservoir at 12 h was required to maintain the standard residual chlorine at every point in the WDS. The maximum percentage decay of chlorine took place in the storage reservoir in both parts of the WDS, and a negligible decay was observed in the bulk and at the boundary of the pipes, indicating negligible reaction between pipe material and the water and hence, longer life of the pipes of the network. The age of the water in the storage tank was limited to 12.5 h, indicating prevention of the growth of disinfection by-products and microbial growth. From the hydraulic analysis of the network, it was seen that the water age in the storage tank is inversely related to the pressure head of the tank. The leakage modelling for the network has been completed using WaterNetGen and leakage discharge obtained at the peak demand hour. The total leakage discharge obtained for WDS part I is 0.013 L/s and is 0.029 L/s for WDS part II, respectively, which is 0.1% and 0.15% of the design discharge, respectively, and thus negligible. The very small magnitude of leakage discharge indicates the optimality of the overall design of the network.
The extensions available to the EPANET can be used for water security modelling, real time modelling and fire flow analysis of the designed WDS. EPANET-MSX (multi-species extension), the interaction of multiple chemical agents between each other, with the material of walls of the pipes and the bulk of the fluid, can be modelled. Additionally, the auto decomposition of chloramines to ammonia, formation of disinfection by products and biological regrowth can be modelled. EPANET-RTX (real-time extension) allows for the connection of the operational data with a network model, and the resultant model can be calibrated, verified and tested for precision using the operational data. WaterNetGen can be used for the fire flow analysis of the network model.

Author Contributions

Both authors contributed equally to this work. All authors have read and agreed to the published version of the manuscript.

Funding

This research received no external funding.

Institutional Review Board Statement

Not applicable.

Informed Consent Statement

The study did not involve any humans.

Data Availability Statement

All the data required was obtained from the Engineering wing of the University of Kashmir.

Conflicts of Interest

The authors declare no conflict of interest.

References

  1. Grayman, W.M. History of water quality modeling in distribution systems. In Proceedings of the 1st International WDSA/CCWI Joint Conference, Kingston, ON, Canada, 23–25 July 2018. [Google Scholar]
  2. Lipiwattanakarn, S.; Kaewsang, S.; Makpiboon, C.; Changklom, J.; Pornprommin, A. Water quality audit in drinking water distribution networks. J. Water Resour. Plan. Manag. 2021, 147, 04020113. [Google Scholar] [CrossRef]
  3. Siew, C.; Tanyimboh, T.T.; Seyoum, A.G. Penalty-Free Multi-Objective Evolutionary Approach to Optimization of Anytown Water Distribution Network. Water Resour. Manag. 2016, 30, 3671–3688. [Google Scholar] [CrossRef] [Green Version]
  4. Nono, D.; Odirile, P.T.; Basupi, I.; Parida, B.P. Assessment of probable causes of chlorine decay in water distribution systems of Gaborone city, Botswana. Water SA 2019, 45, 190–198. [Google Scholar] [CrossRef] [Green Version]
  5. Mostafa, N.G.; Matta, M.E.; Halim, H.A. Simulation of chlorine decay in water distribution networks using watercad—Case study. J. Eng. Appl. Sci. 2013, 60, 25–42. [Google Scholar]
  6. Kourbasis, N.; Patelis, M.; Tsitsifli, S.; Kanakoudis, V. Optimizing Water Age and Pressure in Drinking Water Distribution Networks. Environ. Sci. Proc. 2020, 2, 51. [Google Scholar] [CrossRef]
  7. IS 10500. Indian Standard Drinking Water Specification. Bureau of Indian Standards: New Delhi, India, 2012.
  8. Cobacho, R.; Arregui, F.; Soriano, J.; Cabrera, E. Including leakage in network models: An application to calibrate leak valves in EPANET. J. Water Supply Res. Technol.—AQUA 2015, 64, 130–138. [Google Scholar] [CrossRef] [Green Version]
  9. Muranho, J.; Ferreira, A.; Sousa, J.; Gomes, A.; Sá Marques, A. WaterNetGen: An EPANET extension for automatic water distribution network models generation and pipe sizing João Muranho, Ana Ferreira, Joaquim Sousa, Abel Gomes. Water Sci. Technol. Water Supply 2012, 12, 117–123. [Google Scholar] [CrossRef]
  10. Rossman, L. EPANET 2.2 User Manual; United States Environmental Protection Agency: Washington, DC, USA, 2020. [Google Scholar]
  11. Muranho, J.; Ferreira, A.; Sousa, J.; Gomes, A.; Marques, A.S. Pressure dependent demand and leakage modelling with an EPANET Extension—WaterNetGen. Procedia Eng. 2014, 89, 632–639. [Google Scholar] [CrossRef] [Green Version]
  12. Avile, A.; Garcı, F. Pressure management for leakage reduction using pressure reducing valves. Case study in an Andean city. Alexendria Eng. J. 2019, 58, 1313–1326. [Google Scholar]
  13. Walski, T.; Researcher, I.; Weir, M.H. Modeling leakage reduction. Am. Water Work. Assoc. 2006, 98, 147–155. [Google Scholar] [CrossRef]
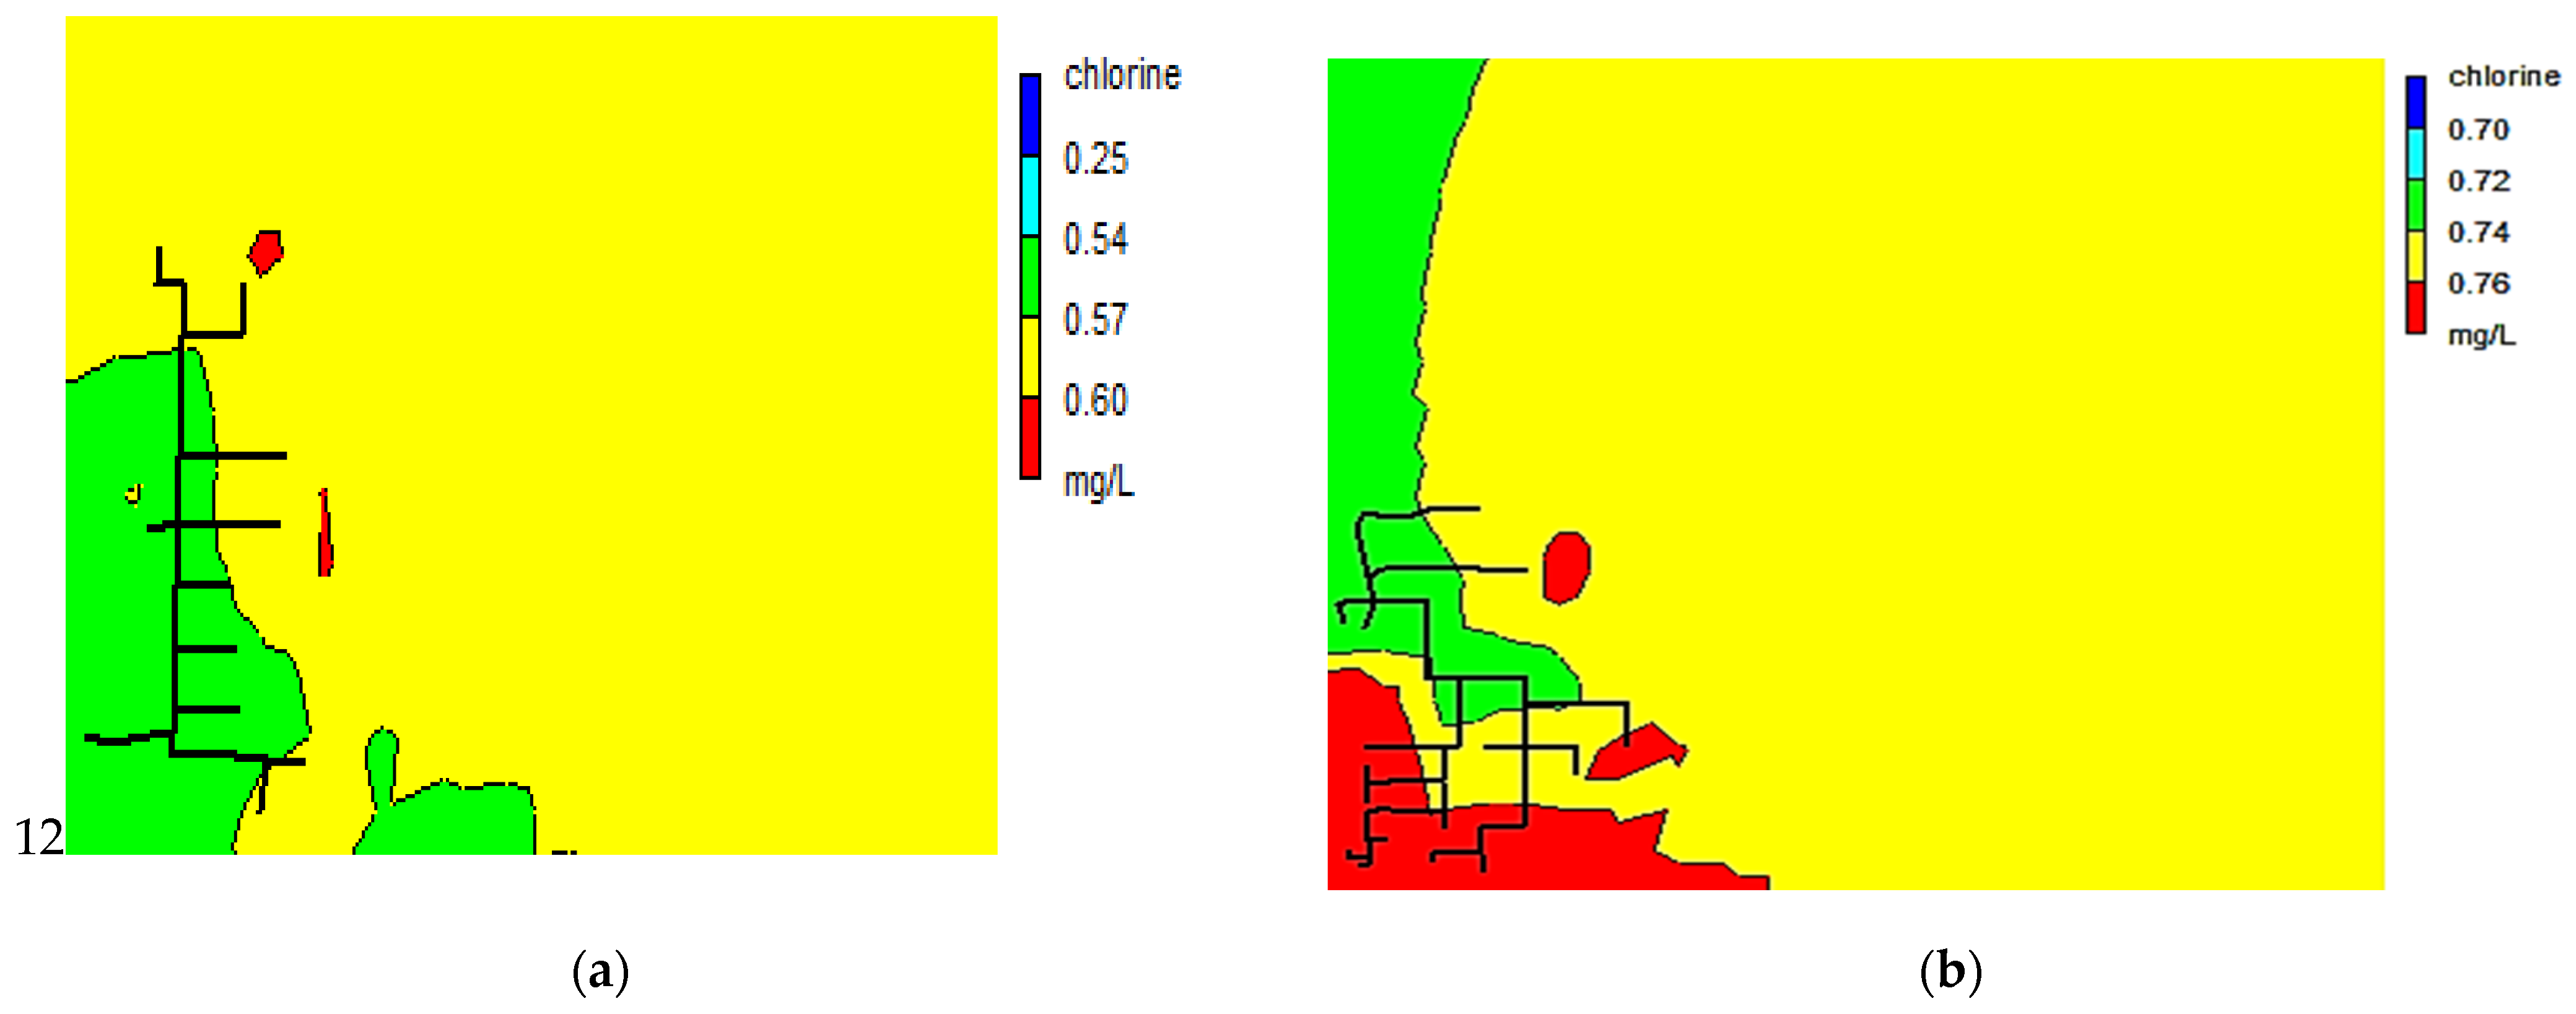
Figure 1. (a) Contour plot of chlorine concentration at nodes at 9:00 am for WDS part I; (b) contour plot of chlorine concentration at nodes at 9:00 am for WDS part II.
Environsciproc 25 00027 g001
Figure 2. (a) Time series plot of chlorine (mg/L) at the storage tank and peak demand nodes for WDS I; (b) time series plot of chlorine (mg/L) at the storage tank and peak demand nodes for WDS II.
Environsciproc 25 00027 g002aEnvironsciproc 25 00027 g002b
Figure 3. (a) Pie chart for chlorine decay, WDS part I; (b) pie chart for chlorine decay, WDS part II.
Environsciproc 25 00027 g003
Figure 4. (a) Age of water in the storage tank, WDS part I; (b) age of water in the storage tank, WDS part II.
Environsciproc 25 00027 g004
Table 1. Emitter flow at nodes for WDS part I.
NodePressure
(m)
Emitter Flow (lps)NodePressure
(m)
Emitter Flow (lps)NodePressure
(m)
Emitter Flow (lps)
Junc J134.390.00038Junc J1124.790.00069Junc J2128.640.00055
Junc J229.660.00033Junc J1224.580.0002Junc J2227.170.00018
Junc J327.410.00016Junc J1325.360.00036Junc J2327.780.00019
Junc J431.620.00041Junc J1425.430.0005Junc J2425.070.00015
Junc J529.430.0004Junc J1525.020.00039Junc J2526.270.00049
Junc J632.830.00036Junc J1625.870.00011Junc J2624.140.00014
Junc J731.280.00026Junc J1725.550.00042Junc J2723.930.00036
Junc J828.750.00073Junc J1825.810.00041Junc J2834.090.00041
Junc J925.860.00024Junc J1925.440.00037Junc J2927.40.00073
Junc J1026.50.00113Junc J2025.360.00005Junc J3030.190.00031
total0.013
Table 2. Emitter flow at nodes for WDS part II.
NodePressure (m)Emitter Flow (lps)NodePressure (m)Emitter Flow (lps)NodePressure (m)Emitter Flow (lps)
Junc J127.730.00012Junc J1923.570.00043Junc J3724.610.00036
Junc J227.990.00039Junc J2023.650.00084Junc J3824.050.00014
Junc J328.660.00021Junc J2124.650.00023Junc J3924.770.0001
Junc J429.070.00017Junc J2225.40.00021Junc J4023.90.00031
Junc J534.610.00025Junc J2325.010.0002Junc J4123.690.00031
Junc J634.840.00067Junc J2424.760.00011Junc J4225.040.00097
Junc J734.610.00088Junc J2524.290.00019Junc J4324.780.0001
Junc J833.360.00072Junc J2624.040.00019Junc J4431.080.00037
Junc J931.970.00021Junc J2723.860.0002Junc J4530.870.00029
Junc J1031.530.00027Junc J2823.530.00031Junc J4625.260.00014
Junc J1130.750.0002Junc J2923.490.0001Junc J4725.390.00008
Junc J1231.570.00065Junc J3025.150.00058Junc J4824.630.00022
Junc J1330.980.00057Junc J3124.810.00035Junc J4927.280.00052
Junc J1431.620.00028Junc J3224.740.00017Junc J5029.220.00131
Junc J1529.130.00089Junc J3324.650.00024Junc J5127.770.0009
Junc J1623.890.00036Junc J3423.480.00011Junc J5226.070.00094
Junc J1723.640.00048Junc J3524.530.00035Junc J5325.780.00111
Junc J1823.520.0004Junc J3625.430.00009Junc J5425.080.0001
total0.029
Disclaimer/Publisher’s Note: The statements, opinions and data contained in all publications are solely those of the individual author(s) and contributor(s) and not of MDPI and/or the editor(s). MDPI and/or the editor(s) disclaim responsibility for any injury to people or property resulting from any ideas, methods, instructions or products referred to in the content.