Proceeding Paper

Rainwater Harvesting during the COVID Outbreak: A Case Study in Brazil †

by
Igor Catão Martins Vaz
* and
Enedir Ghisi
Department of Civil Engineering, Federal University of Santa Catarina, Florianópolis 88040-900, Brazil
*
Author to whom correspondence should be addressed.
Presented at the 7th International Electronic Conference on Water Sciences, 15–30 March 2023; Available online: https://ecws-7.sciforum.net/.
Environ. Sci. Proc. 2023, 25(1), 16; https://doi.org/10.3390/ECWS-7-14172
Published: 14 March 2023
(This article belongs to the Proceedings of The 7th International Electronic Conference on Water Sciences)

Abstract

:
This work assessed the potable water savings potential for different scenarios in a flat in Florianópolis, Brazil. An uncertainty analysis was also performed to understand which parameters most influenced the results. First, it was necessary to evaluate the water consumption and calculate the water end-uses during a home-office period due to the coronavirus pandemic. The water end-uses were obtained by monitoring the users’ consumptions for sixteen days and comparing them with the water meter on a daily basis. The results were very close to those measured using the water meter, with an average absolute error of 5.6%. The base consumption was, on average, 249.2 litres per capita per day. With a home-office regime and an uninterrupted occupation, the coronavirus pandemic could be postulated to justify the more intense consumption patterns. Regarding the percentage of non-potable end-uses, an average of 25.8% was obtained. Potable water savings were simulated using the computer program Netuno, version 4. Seventy scenarios were evaluated, including different rainwater catchment areas and water and rainwater demands. The main results were that rainwater harvesting through a reduced area, 17.5% of the roof, obtained significant results, compared to the simulation with the whole roof, with a potable water savings potential of 16%.

1. Introduction

One of the simplest methods to optimise water consumption is to return to the ancient knowledge of rainwater harvesting systems and use rainwater for non-potable purposes in buildings. Rainwater harvesting is a technique that has been widely known and disseminated in society for thousands of years [1]. According to Gnadlinger [1], there is no single reason why rainwater is no longer the focus of water harvesting techniques. However, the author comments that some factors were climate change, with droughts generating local inefficiency of systems, the desire for a centralised water management system, and the focus on large water supply projects, such as dams and wells.
Studies on the potable water savings potential through the implementation of rainwater harvesting systems are abundant in the literature. Examples of residential buildings [2], industries and agriculture [3,4], schools and universities [5,6], and offices [7] are found in the literature. Local rainwater harvesting can decrease the number of distribution pipes and reservoirs, thus decreasing leakage losses. Lower volumes of water are also withdrawn from rivers and aquifers, which benefits the environment. Finally, using rainwater for non-potable purposes decreases the amount of water treatment chemicals. Studies on life cycle analysis (LCA) have also demonstrated the potential to decrease the environmental impacts of water supply through rainwater harvesting systems [8].
Recently, with the coronavirus pandemic, the discussion has focused on optimised water systems and management. This necessity also includes the reports of the Intergovernmental Panel on Climate Change (IPCC) and the world’s focus on water safety projects [9]. Water is a crucial asset toward sustainable and resilient cities and vital toward health and society equity. According to the sixth Sustainable Development Goal (SDG) of the United Nations (UN), one of the global goals is to sustainably ensure water and sanitation.
All of this information, the workplace change, fewer commuting schemes, and less intranational and international travel have caused modifications in many water flows. Not only have the consumption patterns been changing, but the efficiencies of optimisation systems, such as rainwater harvesting and water-saving appliances, have also changed.
Kalbusch et al. [10] evaluated the water consumption changes in Joinville, Brazil, with the outbreak of the coronavirus pandemic. According to statistical tests, changes were observed in the consumption patterns of commerce, industry, and public activities, with significant modifications. An increase of 11% in residential water consumption was also observed but without statistical relevance. Balacco et al. [11] also observed modifications in water consumption in five different Italian cities during the pandemic outbreak. The authors found that users changed to a late wake-up (10:00 a.m.) as a new habit during COVID. This modification, alongside the modification in commuting schemes, influenced the total water demand of the cities.
Thus, this study aims to evaluate one case study with the water end-uses and simulate the potential of potable water savings of a rainwater harvesting system during the pandemic in southern Brazil. An uncertainty analysis was also performed to understand which parameters most influenced the results.

2. Method

The case study consisted of two parts. The first was the water consumption analysis, which measured the use frequencies and flow rates of the appliances while monitoring the water meter of one flat. The measurements were made during the pandemic period, with the social isolation of the users. The second part consisted of simulating the potential for potable water savings through the theoretical implementation of a rainwater harvesting system.

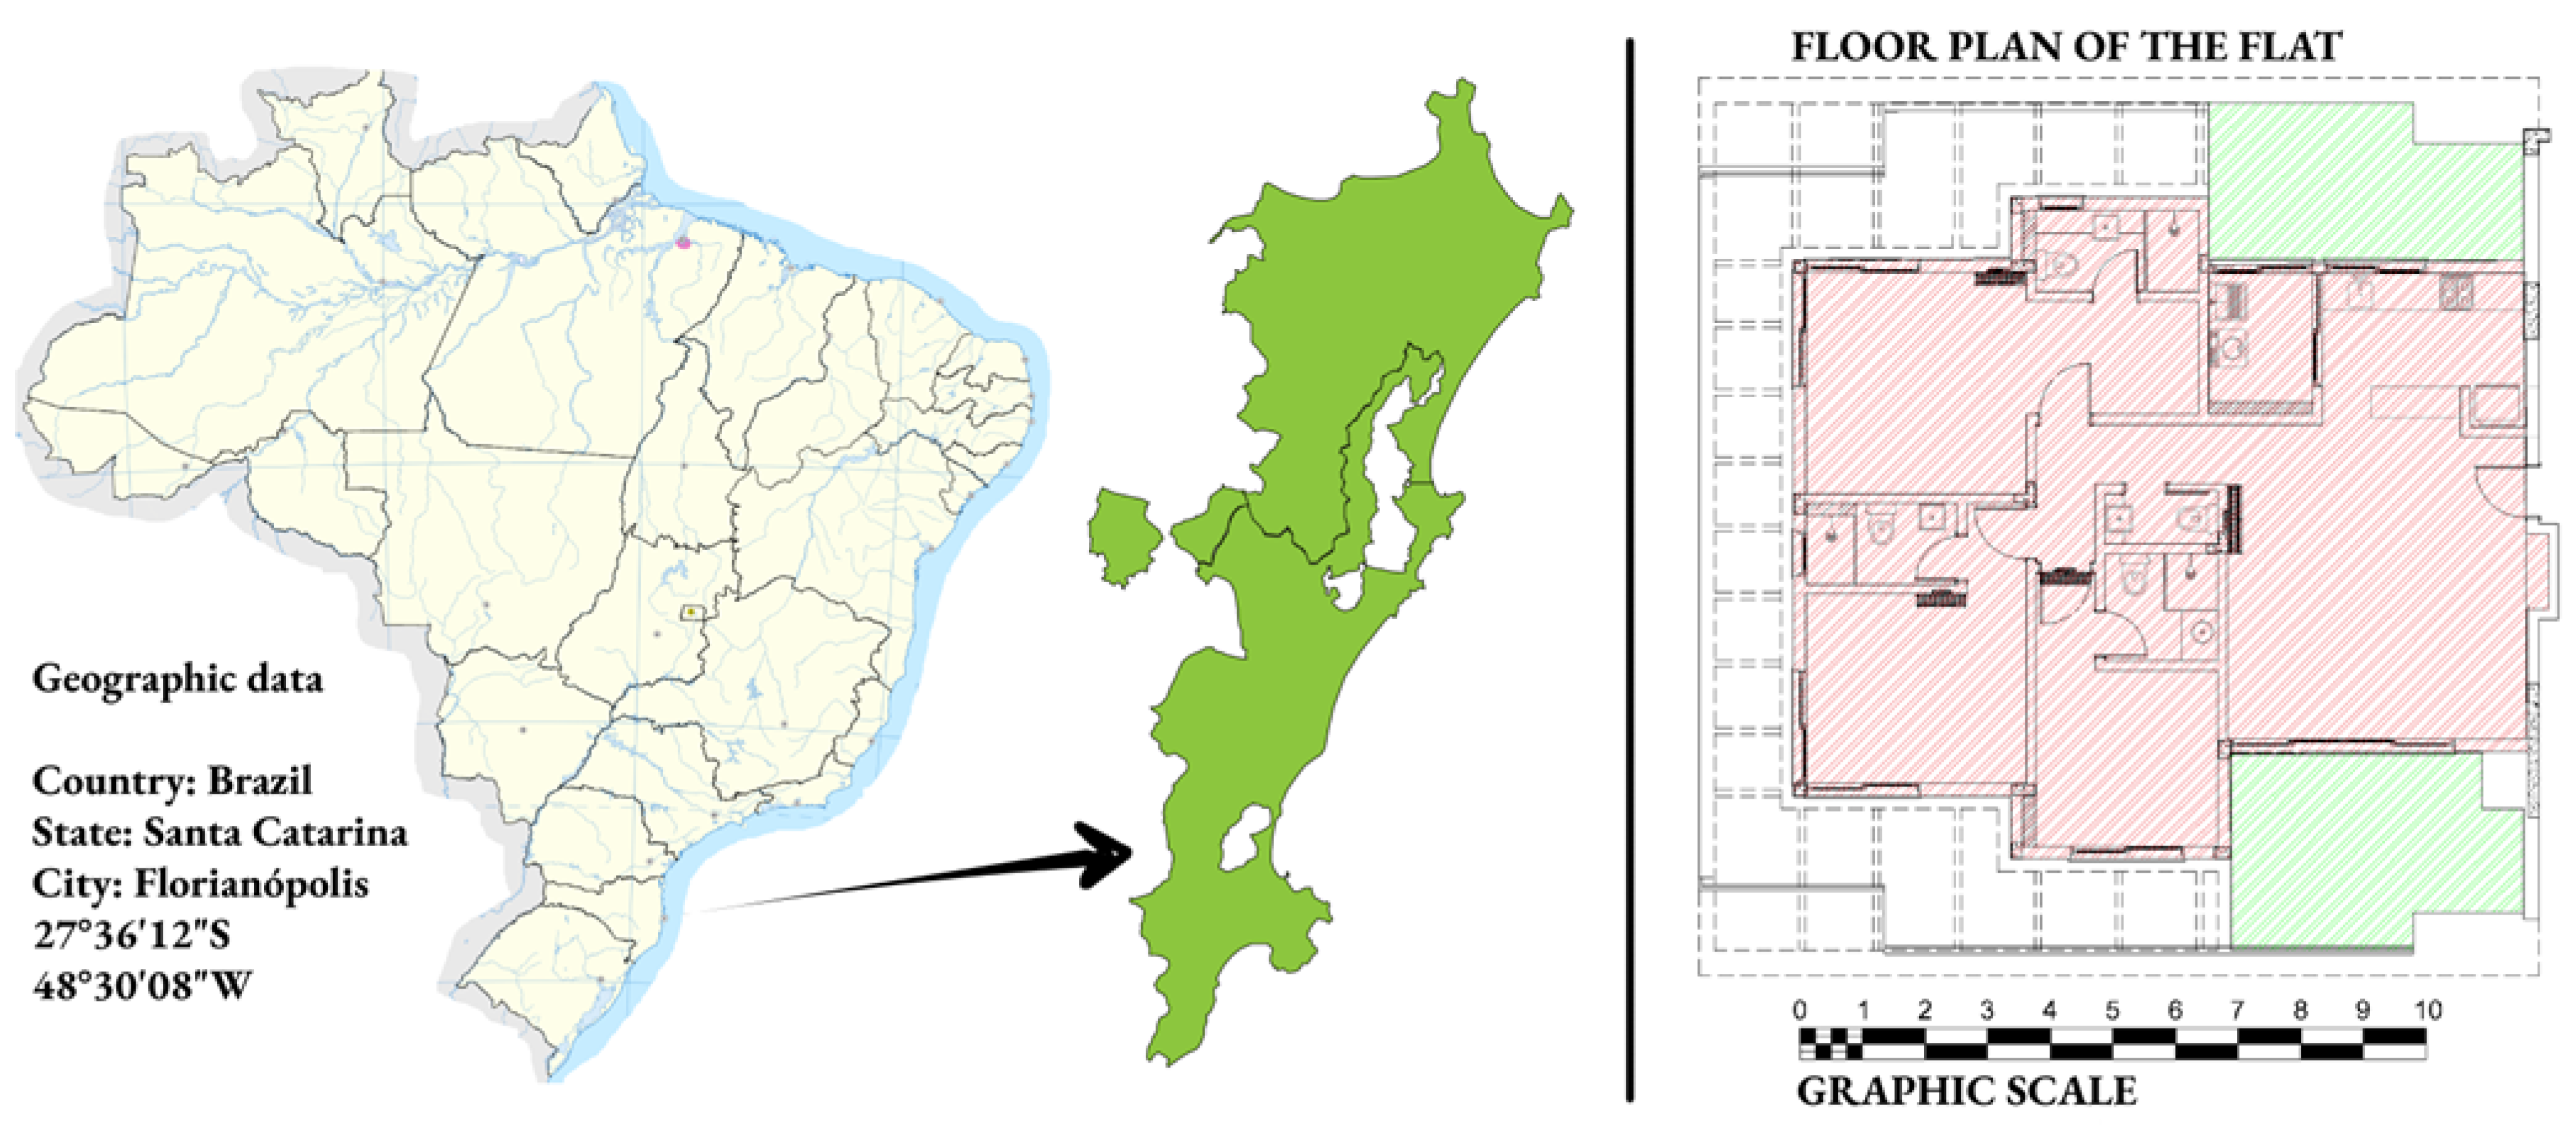
2.1. Object of Study and Water Monitoring

A flat in a multi-family residential building in Florianópolis, Brazil, was chosen to be evaluated for the design of a rainwater harvesting system. The definition considered estimating the water end-uses by monitoring the two residents for sixteen days. Figure 1 shows the location and floor plan of the flat. The green area shows the roof area owned solely by the flat owners, and the red area shows the part of the roof shared with the building and its residents. The flat is located at longitude 48°30′08″ west and latitude 27°36′12″ south.
The monitoring of water consumption was carried out through questionnaires on the uses of the water appliances. Both residents filled out forms for sixteen days. The specific questionnaires for each room presented items regarding the environment, water appliance, frequency of use in the day, and the flow rate (litres/s, litres/cycle, litres/discharge, or litres), which were counted between 00:00 and 23:59 each day.
The volume of water consumed in each water appliance was measured to calculate the water flow. A pre-established volume was measured for showers, taps, and sinks, and the filling time was recorded. For these appliances, an average of three measurements was taken. Regarding bowl-and-tank toilets, the volume of water in each flushing was measured for half and full flush.
For appliances with cycles, such as the washing machine and dishwasher, the consumptions indicated in the appliances’ manuals were used. For the drinking water consumption, we used the consumptions indicated by the users at the end of the day, considering the average number of glasses of water drunk and the glass volumes.

2.2. Rainwater Harvesting System

The rainwater harvesting system was modelled based on similar works and using the computer program Netuno, version 4. The program, created by Ghisi and Cordova [14], was based on a deterministic water balance similar to the yield-before-spillage and yield-after-spillage approaches. As for the simulation parameters, the program required local pluviometry data, water consumption characteristics, technical definitions (such as first flush volume and the runoff coefficient of the roof), and upper and lower tank volume definitions.
The goal was to analyse the potential for potable water savings under the consumption found during the pandemic times. However, there is much variability within some of the parameters. To include the uncertainty analysis in the simulation result, 70 different scenarios were modelled based on the range of three parameters. Two values were used for the harvesting area, combined with seven water demands and five rainwater demands. Table 1 shows the data used in the simulations.
The two harvesting areas were modelled to represent the whole roof and the private part of the roof, including the shared and individual parts. This division occurred because one part was owned solely by the flat owners while the other was shared with other building residents. To simplify the results, the private roof is stated as PR and was 22 m2. Shared plus the private roof is stated as SPR and was 126 m2. Figure 1 shows the shared part in red, while the external boundaries in green show the private area.

3. Results and Discussion

3.1. Water Consumption and End-Uses

Water consumption was gathered and analysed in comparison to the water metering. The results were similar, with an absolute mean error of 5.6%. This similarity meant that, on average, daily estimates of water consumption varied by ±5.6% compared to the values registered on the water meter. Daily average water consumption via water meters was 249 litres/capita/day, and the average non-potable water use was estimated to be 25.8%. We considered rainwater could be used only for the washing machine and toilets as a non-potable source.
Table 2 shows the water flow for each of the water appliances. M (millilitres) and T (seconds) stand for the measurement and timing, according to the method shown in Section 2.1.
For the different scenarios of potable water demand (range between −15 and +15%), the minimum and maximum daily water consumption ranged between 250 and 750 litres/day. This range showed how much variability was found within the measurements of daily water demand. Additionally, the daily average water consumption obtained was higher than in previous literature, which states an average figure of 150 litres/capita/day as the Brazilian pattern.
The distributions of the water consumption within rooms and water devices are shown in Figure 2a,b. Figure 2c shows the measured versus metered water consumption. One can see that most of the water consumption occurred in bathroom 1, bathroom 2, and the kitchen, with little demand in the other rooms. Regarding water appliances, consumption was higher for showers, kitchen taps, and toilets.
Comparing the results to those of Freitas and Ghisi [16], one can see that this case study flat had a higher water consumption per capita than other studies in the same region. Additionally, they obtained a non-potable water consumption of 42.2% of the daily water demand.

3.2. Rainwater Harvesting System

The comparison between the PR and the SPR was the first assessment, resulting in a difference of approximately 8% in potable water savings. This assessment was performed with the baseline consumption and the 25% non-potable water end-uses, presented in Section 3.1. By harvesting rainwater with the 126 m2 roof, 24% of potable water savings were obtained, while with the 22 m2 alternative, 16% savings were obtained. Both results were obtained with a lower tank of 3000 litres, which was indicated as the optimal technical solution.
The second assessment was the uncertainty analysis within the results obtained in the water metering. In order to do so, the water demand was ranged, according to Table 1. The results were then checked for PR and SPR. The main conclusion was that the PR, a smaller roof area for harvesting, presented more sensitivity to the total water demand. In this scenario, rainwater was scarcer, and the potable water savings potential dropped when higher water demand was included. For the SPR, almost all demands were met by the rainwater harvesting systems.
The third assessment was the range of the parameter “rainwater demand”, which ranged around the figure of 25%. The main result was the opposite of the second assessment, with less impact on PR and more on SPR. Such a result can be explained by the analysis that SPR provided more rainwater. In this scenario, when non-potable water was needed, rainwater would be available in response to a larger harvesting area. The PR area, on the contrary, did not present extra rainwater for the system, being less affected by the parameter.
Both assessments were engaging, showing that PR harvesting proved to be a good alternative. However, if more non-potable (more than 25%) water is needed, the SPR alternative would become more attractive, requiring the approval of the remaining building users. Nevertheless, by dividing the potable water savings potential of the PR by the SPR results, a referential percentage of 65% was obtained. This result means that even with only 17.5% of the total roof area, the users might benefit from more than half of the potable water savings potential. It is easier to install and start a sustainable water practice within the flat. Comparing the results to Freitas and Ghisi’s [16], one can see that this study had a much lower potable water savings potential, mainly due to the lower non-potable water demand. One can obtain higher figures in houses with gardens and patio cleanings.

4. Conclusions

The potable water savings potential ranged from 15.80% to 24.43% when considering both roof area possibilities. The results were higher than those obtained in the literature for multi-family buildings and lower than those found for single-family buildings. Additionally, it was found that even the smaller roof area proved to be an exciting approach for the users, starting a sustainable water practice in the flat.
The flat presented higher consumption than the region’s average water consumption, and one can postulate that the continuous stay of users due to pandemic isolation might have influenced the results. The non-potable water demand percentage for the flat was similar to previous literature. Further studies can better understand the effects of different user patterns, helping to improve rainwater harvesting dynamics.

Author Contributions

Conceptualization, I.C.M.V. and E.G.; methodology, I.C.M.V.; software, I.C.M.V.; writing—original draft preparation, I.C.M.V.; writing—review and editing, I.C.M.V. and E.G.; supervision, E.G. All authors have read and agreed to the published version of the manuscript.

Funding

This research received no external funding.

Institutional Review Board Statement

Not applicable.

Informed Consent Statement

Informed consent was obtained from all subjects in the study.

Data Availability Statement

The data presented in this study are available on request from the corresponding author.

Acknowledgments

We would like to thank UFSC for their support and Coordenação de Aperfeiçoamento de Pessoal de Nível Superior (CAPES) for the first author’s scholarship during this research.

Conflicts of Interest

The authors declare no conflict of interest.

References

  1. Gnadlinger, J. Rainwater in the Integrated Management of Water Resources in Semi-Arid Locations: Historical, Biophysical, Technical, Economic, and Socio-Political Aspects. In Rainwater Harvesting, Manage and Use; Instituto Nacional do Semiárido: Campina Grande, Brazil, 2015. (In Portuguese) [Google Scholar]
  2. Kuntz Maykot, J.; Ghisi, E. Assessment of A Rainwater Harvesting System in A Multi-Storey Residential Building in Brazil. Water 2020, 12, 546. [Google Scholar] [CrossRef]
  3. Bertuzzi, G.; Ghisi, E. Potential for Potable Water Savings Due to Rainwater Use in a Precast Concrete Factory. Water 2021, 13, 448. [Google Scholar] [CrossRef]
  4. Bafdal, N.; Dwiratna, S. Water Harvesting System as an Alternative Appropriate Technology to Supply Irrigation on Red Oval Cherry Tomato Production. Int. J. Adv. Sci. Eng. Inf. Technol. 2018, 8, 561. [Google Scholar] [CrossRef]
  5. Ghisi, E.; Rupp, R.F.; Triska, Y. Comparing Indicators to Rank Strategies to Save Potable Water in Buildings. Resour. Conserv. Recycl. 2014, 87, 137–144. [Google Scholar] [CrossRef]
  6. Martins Vaz, I.C.; Ghisi, E.; Thives, L.P. Stormwater Harvested from Permeable Pavements as a Means to Save Potable Water in Buildings. Water 2021, 13, 1896. [Google Scholar] [CrossRef]
  7. Proença, L.C.; Ghisi, E. Assessment of Potable Water Savings in Office Buildings Considering Embodied Energy. Water Resour. Manag. 2013, 27, 581–599. [Google Scholar] [CrossRef]
  8. Marinoski, A.K.; Ghisi, E. Environmental Performance of Hybrid Rainwater-Greywater Systems in Residential Buildings. Resour. Conserv. Recycl. 2019, 144, 100–114. [Google Scholar] [CrossRef]
  9. IPCC. Summary for Policymakers. In Climate Change 2022: Impacts, Adaptation and Vulnerability; Cambridge University Press: Cambridge, UK, 2022; pp. 3–33. [Google Scholar]
  10. Kalbusch, A.; Henning, E.; Brikalski, M.P.; de Luca, F.V.; Konrath, A.C. Impact of Coronavirus (COVID-19) Spread-Prevention Actions on Urban Water Consumption. Resour. Conserv. Recycl. 2020, 163, 105098. [Google Scholar] [CrossRef] [PubMed]
  11. Balacco, G.; Totaro, V.; Iacobellis, V.; Manni, A.; Spagnoletta, M.; Piccinni, A.F. Influence of COVID-19 Spread on Water Drinking Demand: The Case of Puglia Region (Southern Italy). Sustainability 2020, 12, 5919. [Google Scholar] [CrossRef]
  12. Wikipedia. Map File of Brazil. Author: NordNordWest. Licenced under Creative Commons 4.0. Available online: https://pt.m.wikipedia.org/wiki/Ficheiro:Brazil_location_map.svg (accessed on 15 January 2023).
  13. Wikipedia. Map File of Florianópolis. Author: Franzisquin. Licenced under Creative Commons 3.0. Available online: https://pt.wikipedia.org/wiki/Ficheiro:Floripa_2020.svg (accessed on 15 January 2023).
  14. Ghisi, E.; Cordova, M.M. Netuno 4. Computer Programme. Universidade Federal de Santa Catarina, Departamento de Engenharia Civil. 2014. Available online: http://www.labeee.ufsc.br/ (accessed on 25 November 2022).
  15. INMET. Meteorologic Database for Research and Teaching (Banco de Dados Meteorológicos para Ensino e Pesquisa—BDMEP, in Portuguese). BDMEP. 2021. Available online: https://bdmep.inmet.gov.br/ (accessed on 10 January 2021).
  16. Freitas, D.A.; Ghisi, E. Economic feasibility analysis of rainwater harvesting: A case study in Imbituba, Brazil. Urban Water J. 2020, 17, 905–911. [Google Scholar] [CrossRef]
Figure 1. Location of the study and floor plan of the flat [12,13].
Environsciproc 25 00016 g001
Figure 2. Results of the water monitoring. (a) water distribution in water appliances; (b) water distribution in rooms; (c) measured versus metered water consumption.
Environsciproc 25 00016 g002
Table 1. Parameters used for rainwater harvesting simulation.
ParameterValue
Pluviometry dataObtained via INMET [15]
First flush disposal2 mm
Harvesting area22 m2 private roof (PR)/126 m2 shared and private roof (SPR)
Total water demand−15%/−10%/−5%/Water demand/+5%/+10%/+15%
Rainwater demand (% of the total water demand)15%/20%/25%/30%/35% *
Roof runoff coefficient0.80
Upper tank sizeEqual to the average daily rainwater consumption
Lower tank sizeRange between 1000 and 6000 litres (step of 250 litres)
* These results were found during the first part of the research and are presented in Section 3.1.
Table 2. Water flow for the water appliances.
Water ApplianceRoomM1T1M2T2M3T3Average FlowUnit
Kitchen tapKitchen12257.1316508.42170010.270.178litres/s
DishwasherAccording to the manual8litres/cycle
Washing machineAccording to the manual9.4litres/cycle
Drinking waterAccording to the user’s measurements-litres/day
Washing tank15005.8818006.9716006.280.256litres/s
ShowerBathroom 1220011.33232511.05234010.890.206litres/s
Bathroom 2500024.68230010.17240010.840.217
Bathroom for guestsAverage of other showers0.212
TapBathroom 14704.314504.264303.430.113litres/s
Bathroom 22752.023902.774503.550.135
Bathroom 34003.554503.845003.630.123
Bathroom for guests5004.325004.124503.870.118
Toilet—One flushBathroom 1Length (34.5)/Width (13.3)/Depth (17.5) 18.030litres/use
Bathroom 2Length (35.2)/Width (14.0)/Depth (19.2) 19.462
Bathroom for guestsAverage of other one-flush devices8.746
Toilet—Half flushBathroom 1Length (34.5)/Width (13.3)/Depth (10.0) 14.589
Bathroom 2Length (35.2)/Width (14.0)/Depth (16.2) 17.983
Bathroom for guestsAverage of other half-flush devices6.286
1 Dimensions of the bowl-and-tank water volume used in each type of flush in cm.
Disclaimer/Publisher’s Note: The statements, opinions and data contained in all publications are solely those of the individual author(s) and contributor(s) and not of MDPI and/or the editor(s). MDPI and/or the editor(s) disclaim responsibility for any injury to people or property resulting from any ideas, methods, instructions or products referred to in the content.

