
Source Apportionment and Diurnal Variability of Autumn-Time Black Carbon in a Coastal City of Salé, Morocco †

 , , ,
, , ,
Abstract
:1. Introduction
2. Materials and Methods
2.1. Sampling Site
2.2. Data Collection
3. Results and Discussion
3.1. Characteristics of eBC and NO2 Concentrations and Sources
3.2. eBC Source Apportionment
4. Conclusion
Author Contributions
Funding
Institutional Review Board Statement
Informed Consent Statement
Data Availability Statement
Conflicts of Interest
References
- Wyche, K.; Cordell, R.L.; Smith M, L.; Smallbone, K.L.; Lyons, P.; Hama, S.M.L.; Monks, P.S.; Staelens, J.; Hofman, J.; Stroobants, C.; et al. The spatio-temporal evolution of black carbon in the North-West European ‘air pollution hotspot’. Atmospheric Environ. 2020, 243, 117874. [Google Scholar] [CrossRef]
- Alfoldy, B.; Mahfouz, M.M.; Gregorič, A.; Ivančič, M.; Ježek, I.; Rigler, M. Atmospheric concentrations and emission ratios of black carbon and nitrogen oxides in the Arabian/Persian Gulf region. Atmospheric Environ. 2021, 256, 118451. [Google Scholar] [CrossRef]
- Isiugo, K.; Jandarov, R.; Cox, J.; Chillrud, S.; Grinshpun, S.A.; Hyttinen, M.; Yermakov, M.; Wang, J.; Ross, J.; Reponen, T. Predicting indoor concentrations of black carbon in residential environments. Atmospheric Environ. 2019, 201, 223–230. [Google Scholar] [CrossRef] [PubMed]
- Reche, C.; Querol, X.; Alastuey, A.; Viana, M.; Pey, J.; Moreno, T.; Rodríguez, S.; González, Y.; Fernández-Camacho, R.; de la Rosa, J.; et al. New considerations for PM, Black Carbon and particle number concentration for air quality monitoring across different European cities. Atmospheric Chem. Phys. 2011, 11, 6207–6227. [Google Scholar] [CrossRef]
- Deng, J.; Guo, H.; Zhang, H.; Zhu, J.; Wang, X.; Fu, P. Source apportionment of black carbon aerosols from light absorption observation and source-oriented modeling: An implication in a coastal city in China. Atmospheric Chem. Phys. 2020, 20, 14419–14435. [Google Scholar] [CrossRef]
- Mousavi, A.; Sowlat, M.H.; Lovett, C.; Rauber, M.; Szidat, S.; Boffi, R.; Borgini, A.; De Marco, C.; Ruprecht, A.A.; Sioutas, C. Source apportionment of black carbon (BC) from fossil fuel and biomass burning in metropolitan Milan, Italy. Atmospheric Environ. 2019, 203, 252–261. [Google Scholar] [CrossRef]
- R Core Team. R: A Language and Environment for Statistical Computing; R Foundation for Statistical Computing: Vienna, Austria, 2020; Available online: https://www.R-project.org/ (accessed on 1 March 2022).
- Yang, J.; Sakhvidi, M.J.Z.; de Hoogh, K.; Vienneau, D.; Siemiatyck, J.; Zins, M.; Goldberg, M.; Chen, J.; Lequy, E.; Jacquemin, B. Long-term exposure to black carbon and mortality: A 28-year follow-up of the GAZEL cohort. Environ. Int. 2021, 157, 106805. [Google Scholar] [CrossRef] [PubMed]
- Liu, B.; Ma, Y.; Gong, W.; Zhang, M.; Shi, Y. The relationship between black carbon and atmospheric boundary layer height. Atmospheric Pollut. Res. 2019, 10, 65–72. [Google Scholar] [CrossRef]
- Ezani, E.; Dhandapani, S.; Heal, M.; Praveena, S.; Khan, F.; Ramly, Z. Characteristics and Source Apportionment of Black Carbon (BC) in a Suburban Area of Klang Valley, Malaysia. Atmosphere 2021, 12, 784. [Google Scholar] [CrossRef]
- Invernizzi, G.; Ruprecht, A.; Mazza, R.; De Marco, C.; Močnik, G.; Sioutas, C.; Westerdahl, D. Measurement of black carbon concentration as an indicator of air quality benefits of traffic restriction policies within the ecopass zone in Milan, Italy. Atmospheric Environ. 2011, 45, 3522–3527. [Google Scholar] [CrossRef]
- Xulu, N.A.; Piketh, S.J.; Feig, G.T.; Lack, D.A.; Garland, R.M. Characterizing Light-absorbing Aerosols in a Low-income Settlement in South Africa. Aerosol Air Qual. Res. 2020, 20, 1812–1832. [Google Scholar] [CrossRef]
- Healy, R.M.; Wang, J.M.; Sofowote, U.; Su, Y.; Debosz, J.; Noble, M.; Munoz, A.; Jeong, C.-H.; Hilker, N.; Evans, G.J.; et al. Black carbon in the Lower Fraser Valley, British Columbia: Impact of 2017 wildfires on local air quality and aerosol optical properties. Atmospheric Environ. 2019, 217, 116976. [Google Scholar] [CrossRef]
- Cheng, Y.-H.; Huang, Y.-C.; Pipal, A.S.; Jian, M.-Y.; Liu, Z.-S. Source apportionment of black carbon using light absorption measurement and impact of biomass burning smoke on air quality over rural central Taiwan: A yearlong study. Atmospheric Pollut. Res. 2022, 13, 101264. [Google Scholar] [CrossRef]
- Helin, A.; Niemi, J.V.; Virkkula, A.; Pirjola, L.; Teinilä, K.; Backman, J.; Aurela, M.; Saarikoski, S.; Rönkkö, T.; Asmi, E.; et al. Characteristics and source apportionment of black carbon in the Helsinki metropolitan area, Finland. Atmospheric Environ. 2018, 190, 87–98. [Google Scholar] [CrossRef]
- Gatari, M.J.; Kinney, P.L.; Yan, B.; Sclar, E.; Volavka-Close, N.; Ngo, N.S.; Gaita, S.M.; Law, A.; Ndiba, P.K.; Gachanja, A.; et al. High airborne black carbon concentrations measured near roadways in Nairobi, Kenya. Transp. Res. Part D: Transp. Environ. 2019, 68, 99–109. [Google Scholar] [CrossRef]
- Shirmohammadi, F.; Sowlat, M.H.; Hasheminassab, S.; Saffari, A.; Ban-Weiss, G.; Sioutas, C. Emission rates of particle number, mass and black carbon by the Los Angeles International Airport (LAX) and its impact on air quality in Los Angeles. Atmospheric Environ. 2017, 151, 82–93. [Google Scholar] [CrossRef]


| Location | Type of Location | Study Period | Measurement Techniques/Methods | Mass Concentration Range (µg/m3) of eBC, BCff, BCwb, and NO2 | Reference |
|---|---|---|---|---|---|
| British Columbia, Canada | Lower Fraser Valley | September 2016 to August 2017 | Aethalometer AE22 | BC: 0.3–0.8, BCff: 70–84% | [13] |
| Dacheng Township, Taiwan | Rural site | 1 January to 31 December 2019 | Aethalometer AE31 | BC: 0.793 ± 0.638, BCff: 0.709 ± 0.567 (89.4%), BCff: 0.084 ± 0.196 (10.6%) | [14] |
| London, England | Suburban background | 1 January 2013 to 1 April 2015 | Magee Aethalometer AE22 | BC: 1.0–2.4, R2 (BC and NO2) = 0.88 | [1] |
| Helsinki, Finland | Suburban | October 2015 to May 2017 | Aethalometer AE33 | BC: 1.04 ± 2.13, BCwb: 46 ± 15% | [15] |
| Kwadela, South Africa | Kwadela low-income settlement | 18 February to 13 April 2015 | Aethalometer AE-22 (winter) | BC: 1.89 ± 0.5 | [12] |
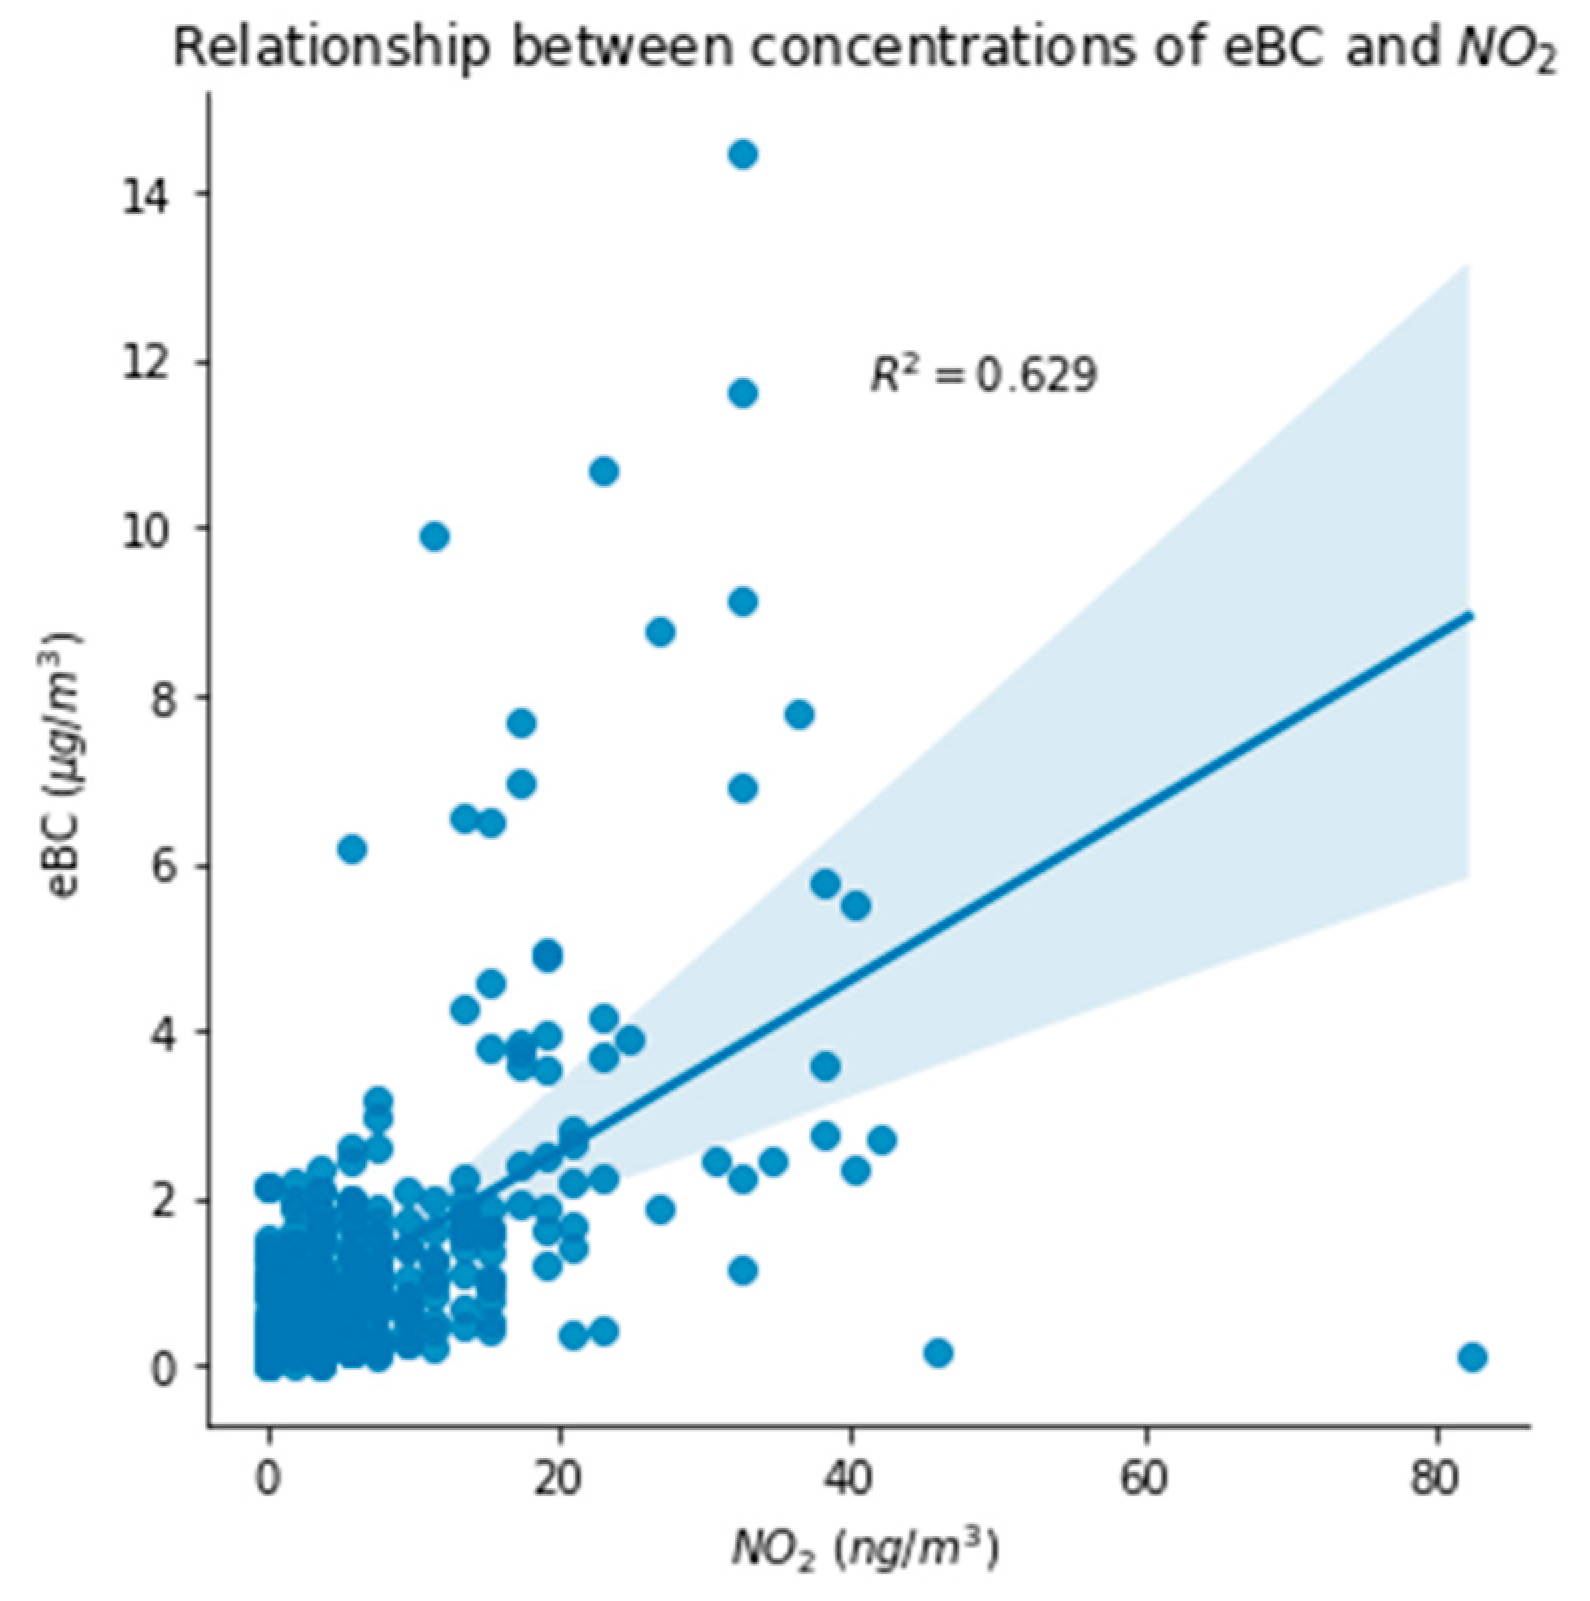
| Salé, Morocco | Urban | 14 October to 27 November 2020 | BC1054 | eBC: 1.9 ± 2.2, BCff: 1.6 ± 2.5, BCwb 0.25 ± 0.72, R2 (BC and NO2) ≈ 0.63 | This study |
| Milan, Italy | Main roads | July 2008 | Aethalometer AE51 | 1.92 ± 0.88 | [11] |
| Klang Valley, Malaysia | Suburban location | 1 January to 31 May 2020 | Aethalometer AE33 | BC: 2.34, BCff = 79%, R2(BC and NO2) = 0.71 | [10] |
| Nairobi, Kenya | Rural background | July 2009 | Teflon filters at LDEO | BC: 3.2 ± 1.1 | [16] |
Publisher’s Note: MDPI stays neutral with regard to jurisdictional claims in published maps and institutional affiliations. |
© 2022 by the authors. Licensee MDPI, Basel, Switzerland. This article is an open access article distributed under the terms and conditions of the Creative Commons Attribution (CC BY) license (https://creativecommons.org/licenses/by/4.0/).
Share and Cite
Otmani, A.; Benchrif, A.; Lachhab, A.; Tahri, M.; Baghdad, B.; El Bouch, M.; Chakir, E.M. Source Apportionment and Diurnal Variability of Autumn-Time Black Carbon in a Coastal City of Salé, Morocco. Environ. Sci. Proc. 2022, 19, 8. https://doi.org/10.3390/ecas2022-12832
Otmani A, Benchrif A, Lachhab A, Tahri M, Baghdad B, El Bouch M, Chakir EM. Source Apportionment and Diurnal Variability of Autumn-Time Black Carbon in a Coastal City of Salé, Morocco. Environmental Sciences Proceedings. 2022; 19(1):8. https://doi.org/10.3390/ecas2022-12832
Chicago/Turabian StyleOtmani, Anas, Abdelfettah Benchrif, Abdeslam Lachhab, Mounia Tahri, Bouamar Baghdad, Mohammed El Bouch, and El Mahjoub Chakir. 2022. "Source Apportionment and Diurnal Variability of Autumn-Time Black Carbon in a Coastal City of Salé, Morocco" Environmental Sciences Proceedings 19, no. 1: 8. https://doi.org/10.3390/ecas2022-12832
APA StyleOtmani, A., Benchrif, A., Lachhab, A., Tahri, M., Baghdad, B., El Bouch, M., & Chakir, E. M. (2022). Source Apportionment and Diurnal Variability of Autumn-Time Black Carbon in a Coastal City of Salé, Morocco. Environmental Sciences Proceedings, 19(1), 8. https://doi.org/10.3390/ecas2022-12832