Abstract
Tropical cyclones are extreme hydrometeorological events whose impact can cause human, material and economic losses. The inaccuracies in the forecast of the trajectory of these phenomena often lead to inefficient decisions, such as unnecessary evacuation. This study proposes a combination of three forecasting tools NTHF, SisPI and SPNOA in the generation of ensemble prediction systems, with the aim of improving the tracking forecasts of tropical cyclones. Three variants were used for the construction of time-lagged ensembles, and for their evaluation the best track and historical errors (2016–2020) of the National Hurricane Center (NHC) were used. The ensembles led to an improvement in tropical cyclone track forecasts. Position errors vary from case to case, but ensembles generally tend to be more accurate than independent forecasts. Compared to the historical errors of the NHC, the results obtained are promising because they are superior in some cases.
1. Introduction
Cuba is hit by extreme weather events, with tropical cyclones (TCs) being the most closely watched due to their frequency and destructive potential. That is why the forecast of TCs constitutes an important task and are carried out on the basis of operational numerical models [1].
Despite the improvement achieved, numerical weather prediction models are still far from perfect and continue to fail in some important weather situations. In recent decades, new techniques have been incorporated to reduce the limitations and uncertainties of the models. Ensemble Prediction Systems (EPSs) are a very powerful tool that allow overcoming some of these. EPSs attempt to sample the most important sources of error that deterministic numerical prediction models may suffer. By simulating these errors, they offer explicit and detailed information on the uncertainty of a weather forecast and the most likely outcome of the predicted process [2].
Several simulations have been completed by authors who have carried out studies at the international level to improve the tracking forecasts of TCs from EPSs. Zhang and Krishnamurti [3,4] used a perturbation method based on empirical orthogonal functions and applied this technique to a global spectral model. Goerss [5] and Lee and Leung [6] evaluated the performance of the multi-model technique; the sets proposed in both investigations were determined simply by averaging the forecast positions of the models used. Other investigations carried out showed superior results to the simple multi-model technique. For example, Kotal and Roy [7] and Jun [8] presented an unequal weighting technique applying the multiple linear regression and partial least squares regression techniques, respectively. Nishimura and Yamaguchi [9] applied a selective ensemble mean technique that excluded from the set of eleven models those that presented large position errors in short times. These investigations have shown that the resulting forecasts are, on average, significantly better than the individual forecasts of the models.
In Cuba this topic has not been addressed. Hence, it is considered necessary to propose the following research to achieve a forecast that is capable of reflecting reality as much as possible. The generation of EPSs is proposed from the combination of TC track forecasts from the Numerical Tools for Hurricane Forecast (NTHF), Short range Prediction System (SisPI) and Numeric Ocean-Atmosphere Forecasting System (SPNOA) systems. Three variants were used for the construction of time-lagged ensembles, and for their evaluation the best track and historical errors (2016–2020) of the National Hurricane Center (NHC) were used.
2. Methods
2.1. Operating Systems in Cuba for Forecasting Tropical Cyclones
At the Institute of Meteorology (INSMET), the numerical prediction of TCs is carried out through two configurations derived from the Weather Research and Forecasting-Advanced Research Weather (WRF-ARW) model named SisPI and SPNOA. The SisPI’s main objectives are the numerical forecast of meteorological events on a local scale and the quantitative forecast of precipitation. It has four daily initializations (0000, 0600, 1200 and 1800 UTC) of its forecast with a three-hourly update of lateral boundary conditions [10]. The SPNOA’s fundamental objectives are the numerical forecast of TCs and the forecast of the state of the ocean in the inter-American seas and Cuban waters. It has two daily initializations (0000 and 1200 UTC) of its forecast with a three-hour update of lateral boundary conditions [11,12].
Another forecasting system used in the prediction of these meteorological phenomena in Cuba is NTHF, which has been implemented and is operational in the Department of Meteorology of the Higher Institute of Applied Technologies and Sciences (InSTEC) of the University of Havana. It has two daily initializations (0000 and 1200 UTC) of its forecast with an update of lateral boundary conditions every 6 h [13,14,15].
2.2. Ensemble Members
It is intended to use all available initializations of the forecast tools NTHF, SisPI and SPNOA. The three systems are obtained from configurations derived from the WRF model, but each one of them presents different physics, domains, resolutions and parameterizations, which indicates that multi-physics and multi-parameter techniques are applied to combine the members.
In order to increase the number of members of the set, the time-lagged technique is also applied. The time-lagged technique is nothing more than a combination of the current forecast with previous forecasts [16].
A schematic representation is shown in Figure 1, where four daily runs with initialization 0000, 0600, 1200 and 1800 UTC can be viewed, with the 0000 UTC run being the most updated. If m00, m06, m12 and m18 are denoted as the members of a set defined by the runs of 0000, 0600, 1200 and 1800 UTC, respectively, then given the scheme, for the first 54 h of forecast of m00, it is also counted with the forecast of the 60, 66 and 72 h of the members m18, m12 and m06, that is, the set is made up of four members for that range of hours.
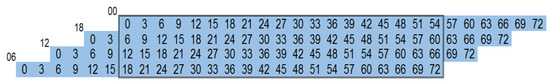
Figure 1.
Scheme that exemplifies the ensemble prediction method based on initializations with different runs.
Once the members were defined, three variants were used to combine them and obtain the ensembles: mean, weighted mean and selective mean.
2.3. Study Cases
The case studies selected for this research are presented in Table 1. For the evaluation of the three tools, all the available initializations of the seven TCs were used, but for the construction of the EPSs only the Irma and Eta systems were chosen by two aspects: they are TCs that affected Cuban territory in recent years and existence of sufficient information from the three forecast systems for the construction of the EPSs.

Table 1.
Case studies used in the research.
3. Results and Discussion
3.1. Evaluation of the Forecasting Tools NTHF, SisPI and SPNOA
To carry out a general evaluation of the performance of the three systems in the track forecast, all the available initializations of the TCs represented in Table 1 were used. The distances (in km) at which the predicted trajectories are found with respect to the NHC best track were calculated for different time periods.
Table 2 shows a comparison between the results obtained from the evaluations of the three systems and the mean forecast errors of the NHC for the years 2016–2020. It can be seen that the ability of NTHF is high, especially for periods of up to 48 h; however, discrete results are obtained for longer periods. In the case of the SisPI, the forecasts are effective in the first 12 h, while for other periods the errors grow notably. This is due to, among other reasons, the fact that this system was not properly designed for this type of forecast. In the results of these two tools, it is possible to observe the tendency of forecast errors to grow with time periods, a situation that does not occur with the SPNOA, since it shows a decrease after 36 h. The cause of this behavior is not known, but it is consistent with other evaluations carried out by the developers of the SPNOA [12]. In summary, for the first 12 h the best results are reported by the NTHF and SisPI, between 24 and 48 h the forecasts of the NTHF and SPNOA are more precise and for longer periods those of SPNOA are the most effective. The superior performance of the NTHF is to be expected since it was built especially for TC forecasting and tracking. In addition, it incorporates the vortex tracking technique, which guarantees that the interior domain is always centered on the TC in such a way that it better reproduces its movement and physical-dynamic characteristics.
Table 2.
Position errors (km) in the track forecast of the NTHF, SisPI and SPNOA systems.
For the construction of the weighted mean ensemble, it was necessary to generate different weights to be assigned to each of the members and for this the general evaluation carried out was used.
In Table 3 it can be seen that the weights vary according to the performance of each tool in the trajectory forecast. Initially NTHF and SisPI are the ones with the greatest weight and this is due to the fact that in the first 12 h they report more accurate forecasts, for time periods between 24 and 48 h the NTHF and SPNOA predictions have greater value and finally the SPNOA forecasts are the most effective for that reason are attributed greater weights.
Table 3.
Weights for the corresponding members of the NTHF, SisPI and SPNOA.
A more specific evaluation was also carried out by initializing the forecast systems used. The tables show the results obtained.
From Table 4 it can be seen that NTHF 0000 UTC initializations tend to be more effective than 1200 UTC. For the first 12 hours the initializations at 1200 and 1800 UTC present fewer errors, but the same does not happen for longer periods where 0000 and 0600 UTC stand out. The SPNOA 0000 UTC initializations are much more accurate than those of 1200 UTC. In general, it can be summarized that for the initialization of 0000 UTC, the NTHF presents a superior behavior to the other two tools in the first 12 hours, but in longer periods, the SPNOA presents fewer errors. On the other hand, in the first 48 hours of the initialization of 1200 UTC, the NTHF forecasts with less error, and again for the other timeframes the SPNOA has more accuracy.
Table 4.
Position errors (km) in the track forecast of the initializations of NTHF, SisPI and SPNOA.
This evaluation was carried out with the aim of obtaining the members used in the construction of the third ensemble. A schematic representation is shown in Figure 2, where the elements that make up the members can be viewed when the NTHF, SisPI and SPNOA initializations are available. Members m06 and m18 will be those of the SisPI as it is the only tool that has runs at these times and members m00 and m12 will be a combination depending on the behavior of the systems by section.
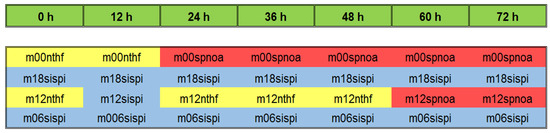
Figure 2.
Members used in the construction of the selective set when the initializations of the NTHF, SisPI and SPNOA are available.
3.2. Performance of the Proposed Ensemble Prediction Systems
3.2.1. Tropical Cyclone Irma
Irma affected Cuba as a hurricane on 8 and 9 September 2017. The three ensembles proposed for 9 September at 0000 UTC were built. According to the best track, on 9 September at 0000 UTC, Hurricane Irma was at north of Nuevitas and then moved west–northwest, bordering the north coast from Camagüey to Matanzas, throughout the 9th. The following day, the system began to move north, in the direction of the Florida peninsula.
In Figure 3a it can be seen that in the first 24 h of the forecast, most of the employed members had a very similar behavior among themselves and even closely resembled the best track. After 24 h, the trajectories began to diverge. Most predicted a slower moving hurricane, but it stayed on the same track, moving first west–northwest and then north.
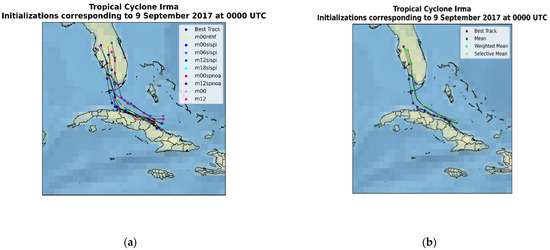
Figure 3.
Tropical Cyclone Irma: initializations corresponding to 9 September 2017 at 0000 UTC. (a) Employed members; (b) obtained ensembles.
Figure 3b represents a comparison between the three ensemble forecasts obtained and the best track. It can be seen that in the first 18 h of the forecast, the behavior of the groups is very similar to the official trajectory of Irma, but for longer periods they move away a little. Again, the results incorrectly predicted Irma’s translational speed, but matched the system’s heading.
In order to have a better representation of the results obtained, the distances (km) at which the trajectories obtained are found with respect to the best track were calculated. Table 5 shows the ensemble errors and historical NHC error over the years 2016–2020 and the official NHC errors for the Irma forecast. It can be seen that all three ensembles were accurate, although in the first 36 h the second and first ensembles reported smaller errors and then the results of the third ensemble were more effective. This situation is due to the fact that initially the employed members have a greater consensus and that is why the mean and the weighted mean report more accurate forecasts, but later the members begin to disagree and it is then that the selective mean excels in the forecast. Compared to the NHC, it can be seen that the mean and weighted mean ensembles were accurate throughout the forecast period, while the selective mean ensemble initially forecasts with less accuracy but after 12 h reports significantly lower errors. This is explained because, in this case, the members used in the ensembles had greater skill than the NHC forecasts, hence the decrease in errors in the ensembles.
Table 5.
Position errors (km) in the track forecast of the sets obtained for 9 September 2017 at 0000 UTC.
3.2.2. Tropical Cyclone Eta
Eta affected Cuba as a tropical storm on 8 and 10 November 2020. The three ensembles proposed for 9 November at 1200 UTC were built. According to the best track, on 9 November at 1200 UTC, tropical storm Eta was located west of the Florida peninsula. It then moved southwest until 0600 UTC on 10 November. That same day, the system made a cyclonic loop and, on the 11th, it began to move towards the north.
Note, in Figure 4a, that not all members predicted the cyclonic loop and some of those who did predict it elsewhere. After the loop, all members forecast a slower movement of the cyclone. Another detail was that many members failed to forecast the northerly course that the system assumed when the loop ended, most forecasting a northwestward motion. In general, it can be said that, in the case of Eta, in this section of its life cycle, the consensus among the members was lower, compared to the case previously studied.
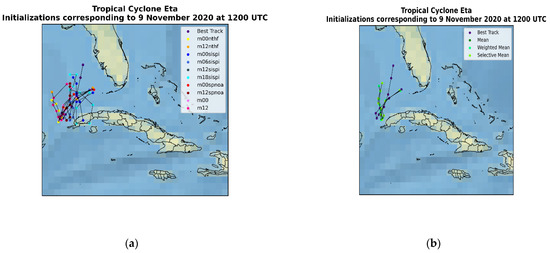
Figure 4.
Tropical Cyclone Irma: initializations corresponding to 9 November 2020 at 1200 UTC. (a) Employed members; (b) obtained ensembles.
In Figure 4b it can be seen that in the first 6 h, the ensemble forecasts resemble the best track. The three trace the cyclonic loop, although not exactly in the same place, they are a little closer to Pinar del Río. After the loop, all three ensembles forecast a slow northward movement of the cyclone.
From Table 6 it can be identified that the weighted mean and the mean performed very well up to 36 h, but in longer terms the errors grew considerably. Compared to the historical errors of the NHC, it can be seen that in the first 36 h the sets performed very well and were more effective.
Table 6.
Position errors (km) in the track forecast of the sets obtained for 9 November 2020 at 1200 UTC.
4. Conclusions
In the present investigation, three alternatives were implemented to improve the forecast of the trajectory of TCs from a combination of the NTHF, SisPI and SPNOA tools. The analysis of the results led to the following conclusions:
- The evaluation of the NTHF, the SisPI and the SPNOA, for the cases studied, showed that in the first 48 h the NTHF tends to be more precise, but in longer periods the SPNOA stands out as the most precise option.
- The mean and weighted mean variants were the ones that reported the least errors in the initial terms and in the last forecast hours, the selective mean stands out. This is due to that in the first hours there was a greater consensus among the employed members, and for this reason the mean and weighted mean are more effective. With increasing uncertainty over time, members begin to disagree, and so the selective mean is more accurate.
- The degree of improvement of ensembles varies from case to case, but in general they tend to be more accurate than independent forecasts. Regarding the historical errors of the NHC, it can be concluded that the results are promising because they are better in some cases.
Author Contributions
Conceptualization, L.F.-J. and M.S.-L.; methodology, L.F.-J. and M.S.-L.; software, L.F.-J. and M.S.-L.; validation, L.F.-J. and M.S.-L.; formal analysis, L.F.-J. and M.S.-L.; investigation, L.F.-J.; resources, L.F.-J. and M.S.-L.; data curation, M.S.-L.; writing—original draft preparation, L.F.-J.; writing—review and editing, L.F.-J. and M.S.-L.; visualization, L.F.-J. and M.S.-L.; supervision, M.S.-L. All authors have read and agreed to the published version of the manuscript.
Funding
This research received no external funding.
Institutional Review Board Statement
Not applicable.
Informed Consent Statement
Not applicable.
Data Availability Statement
Not applicable.
Conflicts of Interest
The authors declare no conflict of interest.
References
- Rubiera, J.; González, C.; Ballester, M.; Llanes, M.; Caymares, A.; Gimeno, Y.; Mojena, E. Curso Sobre Ciclones Tropicales; Academia: Havana, Cuba, 2006. [Google Scholar]
- García-Moya, J.A.; Callado, A.; Escribá, P.; Santos, C.; Santos-Muñoz, D.; Simarro, J. Predictability of short-range forecasting: A multimodel approach. Tellus A Dyn. Meteorol. Oceanogr. 2011, 63, 550–563. [Google Scholar] [CrossRef][Green Version]
- Zhang, Z.; Krishnamurti, T.N. Ensemble forecasting of hurricanes tracks. Bull. Am. Meteorol. Soc. 1997, 78, 2785–2796. [Google Scholar] [CrossRef]
- Zhang, Z.; Krishnamurti, T.N. A perturbation method for hurricane ensemble predictions. Mon. Weather Rev. 1999, 127, 447–469. [Google Scholar] [CrossRef]
- Goerss, J.S. Tropical cyclone track forecasts using an ensemble of dynamical models. Mon. Weather Rev. 2000, 128, 1187–1193. [Google Scholar] [CrossRef]
- Lee, T.C.; Leung, W.M. Performance of multiple-model ensemble techniques in tropical cyclone track prediction. In Proceedings of the 35th Session of the Typhoon Committee, Chiang Mai, Thailand, 19–25 November 2002. [Google Scholar]
- Kotal, S.D.; Roy, S.K. A multimodel ensemble (MME) technique for cyclone track prediction over the North Indian Sea. Geofizika 2011, 28, 275–291. [Google Scholar]
- Jun, S.; Kang, N.; Lee, W.; Chun, Y. An alternative multi-model ensemble forecast for tropical cyclone tracks in the western North Pacific. Atmosphere 2017, 8, 174. [Google Scholar] [CrossRef]
- Nishimura, M.; Yamaguchi, M. Selective ensemble mean technique for tropical cyclone track forecasts using multi-model ensembles. Trop. Cyclone Res. Rev. 2015, 4, 71–78. [Google Scholar]
- Sierra, M.; Morfa, Y.; Fuentes, A.; Ramos, N.; Carnesoltas, M. Herramientas tipo MOS Para la Mejora de las Salidas Numéricas de SisPI, en Particular Para la Precipitación; Instituto de Meteorología: Havana, Cuba, 2019. [Google Scholar]
- Pérez, B.; Mitrani, I.; Díaz, O.O. Sistema de Predicción Numérica Océano-Atmósfera; Technical Report; Atmosphere Physics Center, Institute of Meteorology: Havana, Cuba, 2014. [Google Scholar]
- Mitrani, I.; Pérez, A.; Cabrales, J.; Pove, Y.; Hernández, M.; Díaz, O.O. Coastal flood forecast in Cuba, due to hurricanes, using a combination of numerical models. Rev. Cuba. Meteorol. 2019, 25, 121–138. [Google Scholar]
- Alarcón, A. Artist, Sistema de Pronóstico Numérico de la Intensidad y Trayectoria de los Ciclones Tropicales en Cuba. [Art]; Instituto Superior de Tecnologías y Ciencias Aplicadas: Havana, Cuba, 2019. [Google Scholar]
- Fernández, J.C.; Alarcón, A.; Batista, A.J.; Díaz, O.O. Evaluation of Precipitation Forecast of System: Numerical Tools for Hurricanes Forecast. Adv. Meteorol. 2020, 2000, 8815949. [Google Scholar] [CrossRef]
- Pérez-Alarcón, A.; Fernández-Alvarez, J.C.; Díaz-Rodríguez, O.; Batista-Leyva, A.J.; Pérez-Suarez, R. System for numerical forecast of intensity and trajectory of tropical cyclones in the North Atlantic basin. Rev. Cuba. Meteorol. 2021, 27, 1–14. [Google Scholar]
- Du, J.; Berner, J.; Buizza, R.; Charron, M.; Houtekamer, P.L.; Hou, D.; Jankov, I.; Mu, M.; Wang, X.; Wei, M.; et al. Ensemble Methods for Meteorological Predictions; National Centers for Environmental Prediction (NCEP): Silver Spring, ML, USA, 2018.


Publisher’s Note: MDPI stays neutral with regard to jurisdictional claims in published maps and institutional affiliations. |
© 2022 by the authors. Licensee MDPI, Basel, Switzerland. This article is an open access article distributed under the terms and conditions of the Creative Commons Attribution (CC BY) license (https://creativecommons.org/licenses/by/4.0/).