Proceeding Paper

Air Quality and Climate Comfort INDICES over the Eastern Mediterranean: The Case of Rhodes City during the Summer of 2021 †

by
Ioannis Logothetis
*,
Christina Antonopoulou
,
Georgios Zisopoulos
,
Adamantios Mitsotakis
and
Panagiotis Grammelis
Centre for Research and Technology Hellas, Chemical Process and Energy Resources Institute, Thermi, GR 57001 Thessaloniki, Greece
*
Author to whom correspondence should be addressed.
Presented at the 5th International Electronic Conference on Atmospheric Sciences, 16–31 July 2022; Available online: https://ecas2022.sciforum.net/.
Environ. Sci. Proc. 2022, 19(1), 1; https://doi.org/10.3390/ecas2022-12833
Published: 14 July 2022
(This article belongs to the Proceedings of The 5th International Electronic Conference on Atmospheric Sciences)

Abstract

:
Climate and weather conditions have a profound influence on humans’ sense of comfort and discomfort. In addition, the impact of emissions and human activities on air quality seems to be scientifically indisputable. The maintenance of low levels of environmental nuisance in areas of high environmental and cultural interest, such as some Greek islands, is becoming increasingly important. Thus, exploring the combination of the effect of air quality and climate comfort in a high-traffic area falls within the scope of the principles and practices of sustainable development in such areas. The current study aims to shed some light on this field, for the case of Rhodes city, which is located in the eastern Mediterranean, during the summer of 2021. For the analysis, measurements of the concentration of pollutants ( P M 2.5 , N O Χ and O 3 ) and meteorological recordings (wind speed, wind direction and temperature) from a mobile air quality system located in the center of Rhodes city were conducted. Furthermore, meteorological data from the ERA5 reanalysis (wind speed, temperature, relative humidity, precipitation, cloud cover and height of boundary layer) over a geographical domain around Rhodes Island were included in the study. Results show that climate conditions and emissions are closely linked to traffic and tourism activities, which in turn affect the variability of pollutant concentrations. The calculation of the discomfort index shows that during periods of higher levels of air pollution, the population of Rhodes city feels partially comfortable, while the holiday climate index values show that the climatic conditions are suitable for tourist activities. In conclusion, this study could enhance our understanding of climate comfort and air quality by providing some evidence of the benefits of implementing a sustainable development policy in such tourist areas.

1. Introduction

Tourism is a contributing factor to global economic growth. The World Travel & Tourism Council showed that before the COVID-19 pandemic crisis, the economic footprint was growing due to tourism, providing a huge potential for the economic sector (about 10.5% of GDP) [1,2]. Even though tourism was heavily influenced by COVID-19 restrictions, 2021 showed a slow recovery, and tourism still remains lower than the pre-pandemic period [3]. The Mediterranean region is one of the most significant tourist destination due to the temperate climate, the mild weather and the sandy beaches as well as the rich cultural heritage. In particular, the region of the medieval and modern city of Rhodes in the southeast Aegean Sea in the eastern Mediterranean attracts a large number of people every year. The old city of Rhodes has been registered as a UNESCO World Heritage Site [4]. Moreover, the port of the city is an important passenger and trade center for the eastern Mediterranean.
The Mediterranean region is an area that is at risk due to impending climate change [5]. Global warming over the Mediterranean could negatively influence the economic sector and tourism [6]. Additionally, high levels of pollution can affect climate change and vice versa [7]. In general, atmospheric circulation patterns and climate conditions significantly affect the air quality of coastal regions [5,8,9]. Previous studies have shown that higher wind speeds and precipitation contribute to the reduction in particulate matter and gaseous pollutants in the troposphere [5,6]. In addition, the boundary layer height (BLH) affects the mixing ratio over the atmosphere. In particular, the BLH impacts the concentration of pollutants because the pollutants are diluted over the near surface layer [10]. Another important factor that influences air quality, especially in the summer months, is the meteorological conditions that affect the likelihood of wildfire events [9,11]. In particular, in the summer of 2021, the wildfires in the southeast Mediterranean region significantly deteriorated the air quality over the city center of Rhodes. Synchronously, high traffic emissions due to tourism activity seem to be associated with the fluctuations in the concentration of particle matter (PM2.5 and PM10) [9].
Environmental conditions (climate and weather) influence the sense of comfort and human health. The bad air quality and adverse comfort conditions negatively affect the urban population and enhance the urban heat island phenomenon [12]. In general, climate indices are a simplified way to quantify the impact of climate conditions on human health and the average person’s sense of comfort [2,12]. Discomfort is associated with a high incidence of disease and the mortality rate [12,13]. Previous studies have shown that human discomfort can be quantified using climate parameters such as temperature, humidity, wind speed, etc. [2,12,14]. In order to study the climate sustainability in tourist regions, the holiday climate index (HCI) has been developed as an indicator, especially for the tourism climate comfort [2,15].
This work follows up the analysis of Logothetis et al. [9] by providing elements of the air quality and climate comfort indices for the case of Rhodes Island during the summer of 2021. The study goes beyond emphasizing the impact of emissions and climate features on the air quality and human comfort in the city of Rhodes.

2. Data and Methods

For the analysis, hourly recordings of the concentration of P M 2.5 , N O Χ ( N O + N O 2 ) and O 3 from a mobile air quality monitoring system (AQMS, Haz-Scanner™ model HIM-6000) [9], as well as climate factors (boundary layer height, BHL; precipitation, pr; wind speed, WS; wind direction, WDir; cloud cover, cv; temperature at 2 m, T; and relative humidity, HR) derived from ERA5 reanalysis, were used. The AQMS is located in the center of the Rhodes city [9] (Figure 1). In order to study the impact of climate conditions on the variation in the concentration of pollutants, composite difference maps between high touristic (from 13 July to 31 August 2021; HP) and low touristic activity periods (from 22 September to 3 October 2021; LP) were implemented. HP and LP are considered representative to investigate the impact of anthropogenic emissions (traffic emissions and tourist activities) on air quality of Rhodes city. Τhe odds ratio (OR) shows the strength of the relation between two events indicating the odds for when an event occurs, given a particular influence (outcome) compared to the odds of the outcome occurring in the absence of the outcome [16]. Hours with low BLH/(concentration of pollutants) are those with BLH/(concentration of pollutants) less than or equal to the first quartile of its distribution. Therefore, low BLH/(concentration of pollutants) is defined as “exposure”/(“outcome”). The OR of the low height of BLH and the concentration of pollutants were calculated. The OR equal to 1.0 means that there is no association between “exposure” and “outcome”. OR less/(higher) than 1.0 (the null value) indicates increased/(decreased) likelihood for the occurrence of an hour with low concentration of pollutants during an hour with low BLH. The statistical significance was assessed by the confidence intervals (CI) at 95%.
The impact of climate conditions on human health and senses were quantified by the discomfort index (DI) and Humidex (HI) [2,12,13]. Holiday climate index (HCI), the impact of climate conditions on tourism, was also calculated during the period from 17 July to 5 September 2021. For the calculation of climate indices, the methodology of Poupkou et al. [12] and Demiroglu et al. [2] were followed using climate parameters from ERA5. The calculation of HCI takes into consideration the thermal comfort (which indicates how the average human feels about the humidity and temperature), the aesthetics, the precipitation and the wind speed [2,15]. Note that for the analysis of the ranking of aesthetics, this is calculated using cloud cover and the ranking of thermal comfort using the HI [2]. Finally, the regression coefficient between DI and pollutant concentration was calculated in order to investigate the combined effect of air quality and comfort conditions on the population. For the statistical test, a two-tailed t-test at a significance level of 95% was used to study the statistical significance [17].

3. Results

Figure 2 shows the daily evolution of the concentration of P M 2.5 , N O Χ and O 3 as well as meteorological parameters (T, WDir and O3) during the examined period from 17 July to 3 October 2021. During LP, where the traffic rates and tourist activities are lower compared to HP, the concentration of pollutants decreases. In particular, between LP and HP, the concentration of P M 2.5 reduces by ~9 μg/m3 and NOx by ~10 ppm, whereas the concentration of O 3 does not change significantly, possible due to the variation in seasonal solar activity and photochemical activity [5,9]. Furthermore, the temperature decreases from July to October (Figure 2d). Wind speed and direction changes between LP and HP are not statistically significant due to the high variation in WS and WDir (Figure 2e,f). According to Logothetis et al. [9], the Etesian regime is the dominant climatic pattern over the low troposphere for the studied region, explaining the WS and WDir pattern. Additionally, they showed that the wildfires and traffic emissions determined the variation in particle matter in Rhodes city during the summer of 2021.
In order to investigate the impact of climate factors (BLH, pr and WS) on the air quality of Rhodes, data from ERA5 and recordings from the AQMS were combined to calculate the maps of composite difference between HP and LP. The analysis shows that BLH presents a lower height during HP compared to LP, increasing the probability of a higher concentration of near-surface pollutants (Figure 3a). The differentiation of pr between HP and LP is insignificant around Rhodes Island (Figure 3b).
During HP the WS decreases over the central Aegean and over the region east of Crete Island, whereas the WS does not change significantly around Rhodes Island. To further investigate the relation between the low height of BLH and the high concentration of pollutants, the odds ratio (OR) was estimated. The analysis shows that the probability of the increased concentration of pollutants is higher in the presence of a low BLH, compared to the hours with a high BLH. In particular, the analysis shows that for the P M 2.5   the OR = 11/ C I 95 % :   7.6–15.9, for the N O X the OR = 17.8/ C I 95 % :   11.7–27.1 and for the O 3 the OR = 20.8/ C I 95 % :   13.6–31.7. The C I 95 % does not include the null value (OR = 1.0) and the results are statistically significant (p-value < 0.05). This analysis provides evidence for the association between low BHL and the increased concentration of pollutants over Rhodes city. Please note that the analysis is mainly focused on the period after wildfire events (from 27 July to 15 August 2021) because the impact of fires on the air quality of Rhodes city has already been studied in our previous work [9].
To investigate the influence of climate conditions on human health and tourism sustainability, the DI as well as the HCI were estimated for the summer of 2021. For the calculation of the climate indices, data from ERA5 were retrieved. During the period from 17 July to 5 September, the calculated values of the DI indicate that more than half of the population felt discomfort (Figure 4). During this period, the concentration of pollutants was increased as compared to the last period from 5 September to 3 October. In particular, the concentration of PM2.5 presented some daily exceedances of the threshold (25 μg/m3) due to traffic emissions and wildfire events (Figure 1a). Logothetis et al. [9] have already shown that during the period from 17 July to 5 September the CAQI was classified as moderate for ~33% of the days. The combination of a high DI with the increased concentration of pollutants (PM2.5) increases the risk to human health. Poupkou et al. [12] showed that there is a strong correlation between air quality degradation and the DI (a DI greater than or equal to 24 °C is associated with a high CAQI). The current analysis shows that the regression coefficient of the DI with the concentration of PM2.5, NOx and O3 is significantly positive (equal to 0.11, 0.12 and 0.1, respectively, with a p-value < 0.05). This relation indicates that during the days with a high concentration of pollutants, the discomfort index is also high. This result is evidence for the combined effect of climate conditions (in terms of the DI comfort index) and the air quality on the human sense of comfort and health in Rhodes city.
Figure 4b shows the HCI, which is indicative of the ability of tourism destinations to be sustained [2]. Results of the calculation of the HCI show that the climate conditions are classified as excellent and ideal for the region of Rhodes city.

4. Conclusions

This work shows the combined effect of climate conditions and traffic emissions on human’s sense of comfort and the air quality of Rhodes city during the summer of 2021. Findings show that the high tourist activity is related to poor air quality due to high traffic emissions and human activities. At the same time the air quality degrades and the feeling of discomfort is enhanced. This combined effect could have an impact on the sense of comfort and health risk of the population. The calculation of the holiday climate index (HCI) shows that Rhodes is classified as a sustainable tourist destination in terms of climate conditions. Finally, further investigation of air quality and climatic indices in touristic regions in combination with the promotion of green vehicle technologies could provide a resilience context for the sustainable development of the region of the southeast Aegean.

Author Contributions

Conceptualization, I.L., A.M. and P.G.; methodology, I.L.; software, I.L.; validation, I.L.; formal analysis, I.L.; investigation, I.L. and C.A.; resources, I.L.; data curation, I.L. and G.Z.; writing—original draft preparation, I.L.; writing—review and editing, I.L., C.A. and G.Z.; visualization, I.L.; supervision, A.M. and P.G.; project administration, A.M. and P.G.; funding acquisition, P.G. All authors have read and agreed to the published version of the manuscript.

Funding

Operational Programme “Competitiveness, Entrepreneurship and Innovation” (NSRF 2014–2020) and co-financed by Greece and the European Union (European Regional Development Fund).

Institutional Review Board Statement

Not applicable.

Informed Consent Statement

Not applicable.

Data Availability Statement

https://cds.climate.copernicus.eu/ (accessed on 25 January 2022).

Acknowledgments

We acknowledge the support of this work by the project “ELEKTRON” (MIS: 5047136), which is implemented under the Action “Reinforcement of the Research and Innovation Infrastructure”, funded by the Operational Programme “Competitiveness, Entrepreneurship and Innovation” (NSRF 2014–2020) and co-financed by Greece and the European Union (European Regional Development Fund). The authors would like to acknowledge Copernicus Climate Change Service that provided the ERA5 climate reanalysis data that were used in this work. Finally, the authors would like to thank Ourania Hassiltzoglou for English Language editing.

Conflicts of Interest

The authors declare no conflict of interest.

References

  1. World Travel & Tourism Council [WTTC]. Travel & Tourism Economic Impact 2018 Europe. Available online: https://wttc.org/Research/Economic-Impact (accessed on 24 February 2020).
  2. Demiroglu, O.; Saygili-Araci, F.; Pacal, A.; Hall, C.; Kurnaz, M. Future Holiday Climate Index (HCI) Performance of Urban and Beach Destinations in the Mediterranean. Atmosphere 2020, 11, 911. [Google Scholar] [CrossRef]
  3. International Tourism Consolidates Strong Recovery Amidst Growing Challenges. Available online: https://www.unwto.org/taxonomy/term/347 (accessed on 18 February 2022).
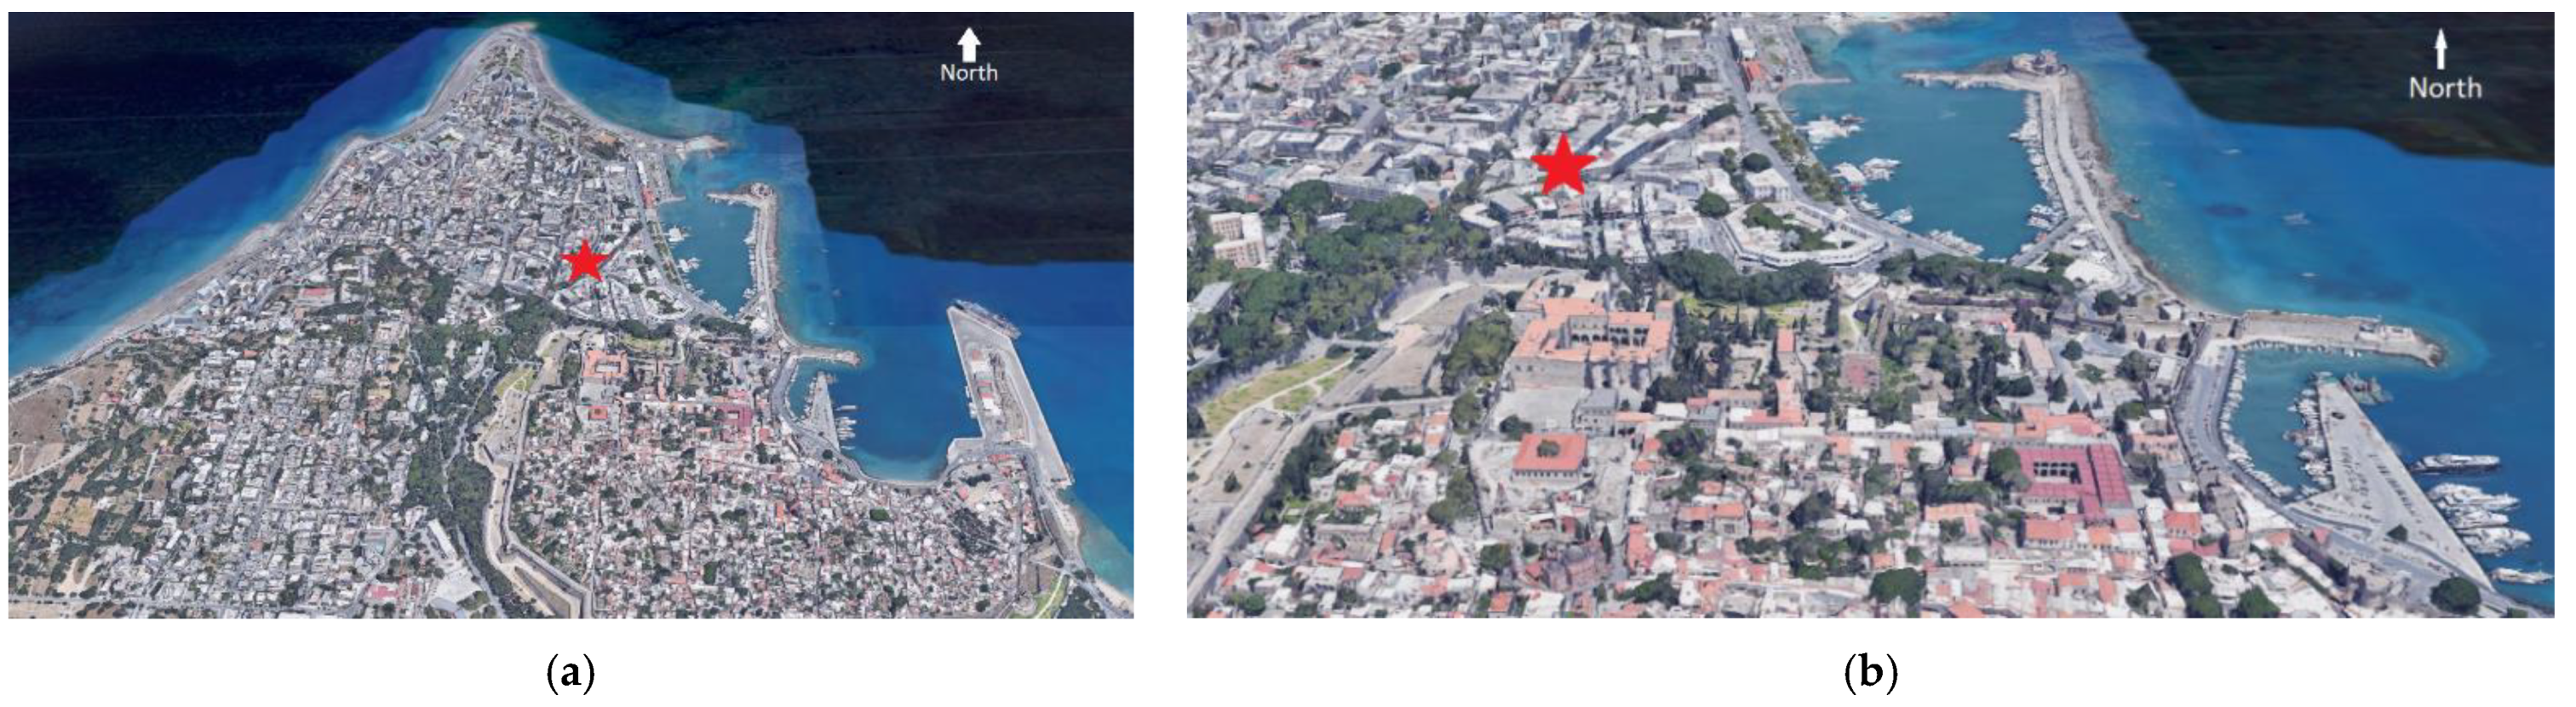
  4. Medieval City of Rhodes. Available online: https://whc.unesco.org/en/list/493/ (accessed on 25 February 2022).
  5. Logothetis, I.; Antonopoulou, C.; Sfetsioris, K.; Mitsotakis, A.; Grammelis, P. Comparison Analysis of the Effect of High and Low Port Activity Seasons on Air Quality in the Port of Heraklion. Environ. Sci. Proc. 2021, 8, 3. [Google Scholar] [CrossRef]
  6. Shukla, J.; Misra, A.; Sundar, S.; Naresh, R. Effect of rain on removal of a gaseous pollutant and two different particulate matters from the atmosphere of a city. Math. Comput. Model. 2008, 48, 832–844. [Google Scholar] [CrossRef]
  7. Amelung, B.; Viner, D. Mediterranean Tourism: Exploring the Future with the Tourism Climatic Index. J. Sustain. Tour. 2006, 14, 349–366. [Google Scholar] [CrossRef]
  8. Sillmann, J.; Aunan, K.; Emberson, L.; Bueker, P.; Van Oort, B.; O’Neill, C.; Otero, N.; Pandey, D.; Brisebois, A. Combined impacts of climate and air pollution on human health and agricultural productivity. Environ. Res. Lett. 2021, 16, 093004. [Google Scholar] [CrossRef]
  9. Logothetis, I.; Antonopoulou, C.; Zisopoulos, G.; Mitsotakis, A.; Grammelis, P. The Impact of Climate Conditions and Traffic Emissions on the Pms Variations in Rhodes City during the Summer of 2021. In Proceedings of the 7th World Congress on Civil, Structural, and Environmental Engineering, Virtual, 10–12 April 2022. [Google Scholar] [CrossRef]
  10. Su, T.; Li, Z.; Kahn, R. Relationships between the planetary boundary layer height and surface pollutants derived from lidar observations over China: Regional pattern and influencing factors. Atmospheric Chem. Phys. 2018, 18, 15921–15935. [Google Scholar] [CrossRef]
  11. Majdi, M.; Turquety, S.; Sartelet, K.; Legorgeu, C.; Menut, L.; Kim, Y. Impact of wildfires on particulate matter in the Euro-Mediterranean in 2007: Sensitivity to some parameterizations of emissions in air quality models. Atmospheric Chem. Phys. 2019, 19, 785–812. [Google Scholar] [CrossRef]
  12. Poupkou, A.; Nastos, P.; Melas, D.; Zerefos, C. Climatology of Discomfort Index and Air Quality Index in a Large Urban Mediterranean Agglomeration. Water Air Soil Pollut. 2011, 222, 163–183. [Google Scholar] [CrossRef]
  13. Nastos, T.P. Weather, ambient air pollution and bronchial asthma in Athens, Greece. In Seasonal Forecasts, Climatic Change and Human Health; Thomson, M.C., Ed.; Springer Science: New York, NY, USA, 2008; pp. 173–188. [Google Scholar]
  14. Government of Canada. Heat and Humidity. Available online: https://www.canada.ca/en/environmentclimate-change/services/seasonal-weather-hazards/warm-season-weather-hazards.html#toc7 (accessed on 25 February 2022).
  15. Hasanah, N.A.I.; Maryetnowati, D.; Edelweis, F.N.; Indriyani, F.; Nugrahayu, Q. The climate comfort assessment for tourism purposes in Borobudur Temple Indonesia. Heliyon 2020, 6, e05828. [Google Scholar] [CrossRef] [PubMed]
  16. Stephenson, D.B. Use of the “odds ratio” for diagnosing forecast skill. Weather. Forecast. 2000, 15, 221–232. [Google Scholar] [CrossRef]
  17. Wilks, D.S. Forecast Verification. Statistical Methods in the Atmospheric Sciences; Academic Press: New York, NY, USA, 1995. [Google Scholar]
Figure 1. The position of mobile monitoring station (red star): (a) in the city of Rhodes and (b) focusing in the area near the mobile monitoring station. (source: Rhodes city. Google Earth v9.159.0.0. 36°26′49″ N and 28°13′15″. (a) ~1700 m (b) ~800 m, assessed: 17 May 2022).
Environsciproc 19 00001 g001
Figure 2. Timeseries of (ac) the concentration of pollutants P M 2.5 , N O Χ and O 3 and (df) the metrological factors T, WDir and WS. The orange/(green) lines denote the high/(low) emissions period.
Environsciproc 19 00001 g002
Figure 3. Composite difference between HP and LP for the (a) boundary layer height, (b) precipitation, (c) wind speed. The dotted region represents the statistically significant difference at 95%, as estimated using a Student’s t-test.
Environsciproc 19 00001 g003
Figure 4. (a) Discomfort index and (b) holiday climate index for the city of Rhodes during the summer period of 2021.
Environsciproc 19 00001 g004
Publisher’s Note: MDPI stays neutral with regard to jurisdictional claims in published maps and institutional affiliations.

