Abstract
For better soil management in terms of salinization to ensure sustainable agriculture, a soil salinity mapping and prediction study based on the measurement of apparent electrical conductivity using an electromagnetic instrument (EM38) combined with geostatistical interpolation (kriging) is proposed herein for the soil of the semi-arid region of Beni Amir (2060 ha), Tadla, Morocco. This solution is efficient and quick to use, with the ability to provide reliable information for assessing the spatial distribution of soil salinity. The results of measurements through a spatial analysis offered us the possibility of identifying several classes of salinity that can be used for the sustainable management of land and water.
1. Introduction
Intensive agricultural development under irrigation in arid areas has improved agricultural production, but has led to degradation of soil quality, which poses a serious danger to the sustainability of the land use system [1,2]. In the Beni Amir irrigated sub-perimeter of Tadla (Morocco), where our study area is located, land irrigated with salt water from the Oum Er Rbia River is affected by salinization. The overall soil salinity varies between 0.35 and 13 dS/m. It is important to characterize the saline state of the land before any exploitation as well as a regular monitoring of its evolution, in order to arrive at strategies for its use. This study was carried out in agricultural soil, located upstream of the irrigated perimeter of Beni Amir. It consists of the prediction and mapping of soil salinity by implementing rapid, efficient, and economical methods; in particular, the technique of electromagnetic induction combined with spatial interpolation methods of soil properties allowed us to draw reliable maps for diverse soil types [3].
2. Material and Methods
2.1. Study Area
The study area is located upstream of the irrigated perimeter of Beni Amir, on the right bank of the irrigated perimeter of Tadla (Figure 1). It is 12 km far from Fkih Ben Salah. The irrigated area is 2060 ha. The topography is generally regular, with an altitude of 400 m. The climate is of the arid to semi-arid Mediterranean type, with an annual rainfall of 350 mm.
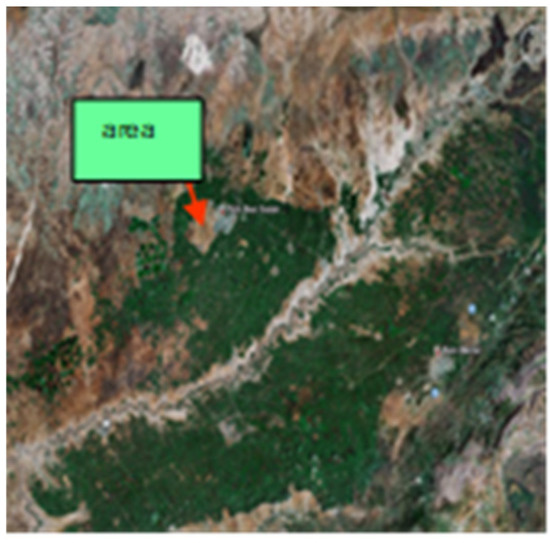
Figure 1.
Study area.
2.2. Soil Sampling and Laboratory Analysis
A dataset to be calibrated, made up of measurements of the apparent electrical conductivity (ECa) at 91 sites, was created using the EM38 electromagnetic induction technique in the vertical position [4] (Figure 2). The calibration dataset corresponds to 12 sites, chosen from among the 91 sites intended for the measurement of ECa. The points were taken with a manual auger at a depth of 90 cm for three horizons (0–30, 30–60, and 60–90 cm). At these 12 sites, electrical conductivity of the saturated past extract (ECe) was evaluated in the laboratory of the Environment and Natural Resources Unit (INRA, Rabat). The average ECe over the 3 depths is used in this study.
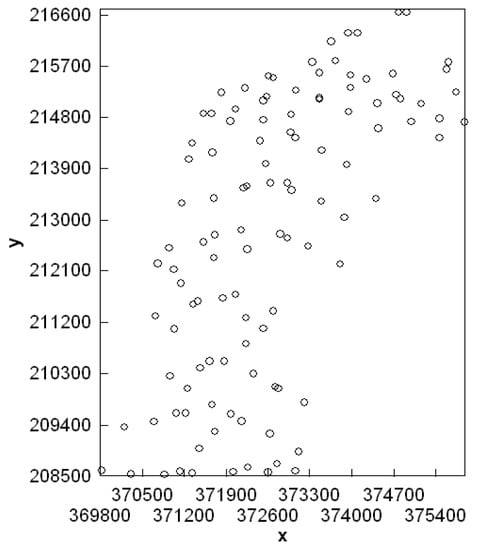
Figure 2.
Network of soil measurement points by EM38.
2.3. Calibration and Mapping
Soil apparent electrical conductivity (ECa) was converted to electrical conductivity of soil paste extract (ECe) using the calibration equation based on a simple linear regression. Afterwards, estimated soil salinity data were interpolated using a geostatistical method [5] to identify the spatial variations of the salts using the variogram and to map the different levels of soil salinity using kriging.
3. Results and Discussion
ECe and ECa are strongly correlated, as confirmed by the Pearson coefficient of determination, which is 0.88 with the equation of calibration as ECe = 0.58 + 4.22 * ECa. The histogram and some statistics about ECe are given in Figure 3.
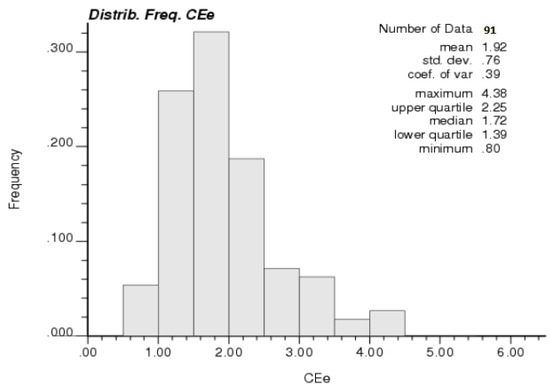
Figure 3.
Histogram and some descriptive statistics for ECe.
The data generally follows a normal distribution, with a few large values. The average value is 1.92 dS/m and values range between 0.8 and 4.38 dS/m, with a coefficient of variation of 39%.
The variogram of ECe is given in Figure 4 and its corresponding parameters are reported in Table 1. A spherical model was fitted to the experimental variogram with the following equation: γ(h) = Sph(h/a) = c0 + c1[(3/2) (h/a) − (1/2)(h/a)3], where h is spatial lag (separation distance), c0 is the variance of the nugget effect, c1 is the partial sill variance, and a is the range.
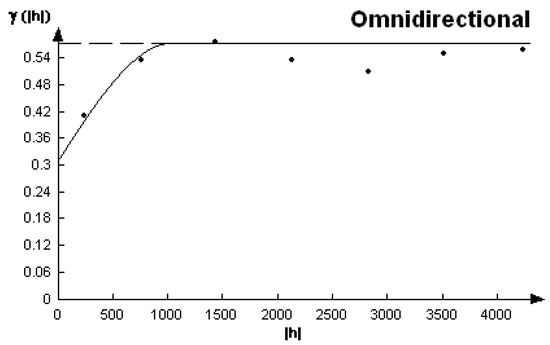
Figure 4.
Experimental (dots) and fitted (curve) variograms for ECe.

Table 1.
Parameters of the fitted model for the experimental variogram of ECe.
The range of the spatial dependence of ECe is 1030 m, with a relative nugget effect of 54%, meaning that more than half of the variation in ECe is not spatially structured, i.e., it is random.
Soil salinity (ECe) was predicted by kriging (Figure 5 left) using a regular 30 m × 30 m grid. The predicted values are between 1 and 3 dS/m. Compared to the observed values, the predicted minimum value is higher (0.8 dS/m) and the predicted maximum value is lower (4.38 dS/m); this property is known as the kriging smoothing effect. The map reflects the spatial distribution of ECe in the same way as the observed values (Figure 5). However, there is a complete spatial coverage of the study area, whereas the observed sampling was limited to only 91 locations.
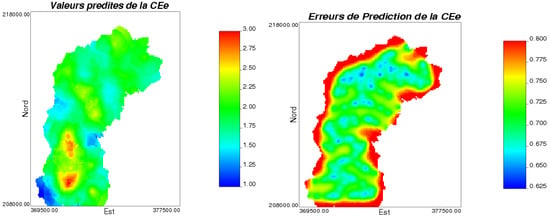
Figure 5.
Spatial interpolation (left) and prediction errors (right) of soil salinity (ECe).
Kriging prediction errors for soil salinity (ECe) are given in Figure 5 (right). This map has a model that is a function of sampling intensity. Normally, at sampled locations, these errors should be zero and will increase as we move further away from these sampled locations. On this map, the errors are between 0.6 and 0.8 dS/m, which means that, depending on the choice of the interpolation grid, none of the predicted locations coincided with the sampled ones.
4. Conclusions
Apparent electrical conductivity (ECa) measured in the field using electromagnetic induction appears to be a fast and reliable method to assess soil salinity efficiently and cost-effectively. Additionally, spatial interpolation by kriging contributes to the description and modeling of soil salinity to spatially predict at unsampled locations. This will map the entire study area. This work has shown the usefulness of using indirect and inexpensive measurements of soil salinity for more reliable mapping than conventional laboratory measurements which are laborious and expensive.
Author Contributions
Conceptualization, H.D., A.D., and A.G.; sampling and laboratory analyses, H.D., A.Z., and H.Y.; software, H.D.; original draft preparation, H.D.; writing—review and editing, H.D., H.C.D., A.D., H.I., R.M., and A.G. All authors have read and agreed to the published version of the manuscript.
Funding
This research was funded by INRA in the frame of the Agroecology mega-project, subsidized by the general budget of INRA. The APC was funded by the LAFOBA2 organizers.
Institutional Review Board Statement
Not applicable.
Informed Consent Statement
This study did not include humans.
Data Availability Statement
Data can be supplied if required.
Conflicts of Interest
The authors declare no conflict of interest.
References
- Huang, J.; Kilminster, T.; Barrett-Lennard, E.G.; Triantafilis, J. Characterization of field-scale dryland salinity with depth by quasi-3d inversion of DUALEM-1 data. Soil Use Manag. 1990, 33, 205–215. [Google Scholar] [CrossRef]
- Dakak, H.; Huang, J.; Zouahri, A.; Douaik, A.; Triantafilis, J. Mapping soil salinity in 3-dimensions using an EM38 and EM4 Soil inversion modelling at the reconnaissance scale in central Morocco. Soil Use Manag. 2017, 33, 553–567. [Google Scholar] [CrossRef]
- Douaik, A. Evaluation of the Space-Time Variability of Soil Salinity by Statistical, Geostatistical and Bayesian Maximum Entropy Methods. Ph.D. Thesis, Ghent University, Ghent, Belgium, 2005. [Google Scholar]
- McNeill, J.D. Electrical Conductivity of Soils and Rocks; Tech. Note TN-6; Geonics Ltd.: Mississauga, ON, Canada, 1980. [Google Scholar]
- Webster, R.; Oliver, M. Geostatistics for Environmental Scientists, 2nd ed.; Wiley: New York, NY, USA, 2007. [Google Scholar]
Disclaimer/Publisher’s Note: The statements, opinions and data contained in all publications are solely those of the individual author(s) and contributor(s) and not of MDPI and/or the editor(s). MDPI and/or the editor(s) disclaim responsibility for any injury to people or property resulting from any ideas, methods, instructions or products referred to in the content. |
© 2023 by the authors. Licensee MDPI, Basel, Switzerland. This article is an open access article distributed under the terms and conditions of the Creative Commons Attribution (CC BY) license (https://creativecommons.org/licenses/by/4.0/).