
Environmental, Economic, and Health-Related Impacts of Increasing Urban Greenery Cover †


Abstract
:1. Introduction
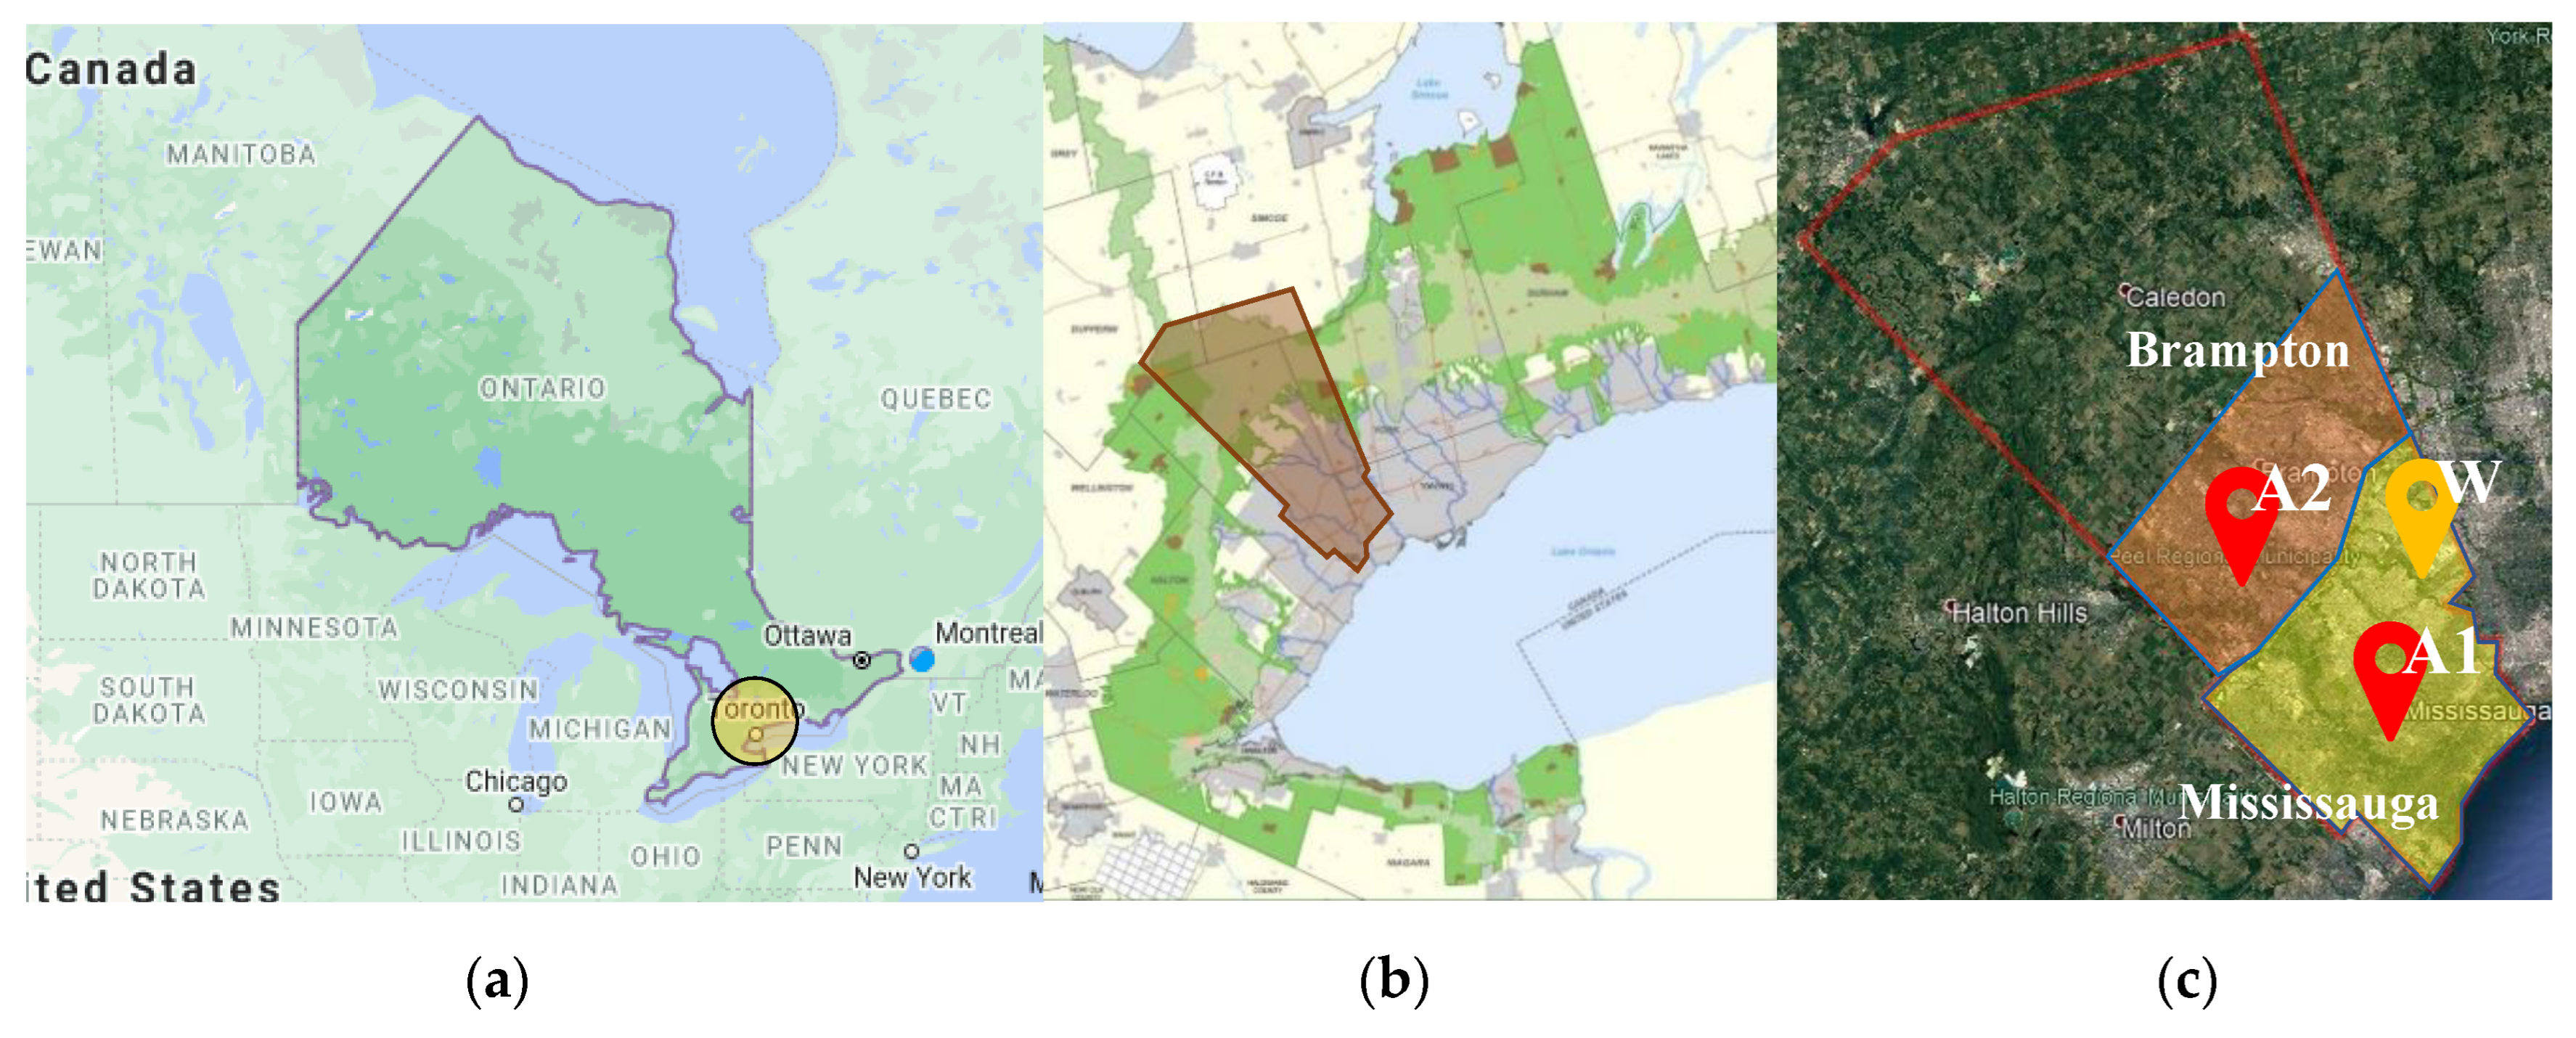
2. Materials and Methods
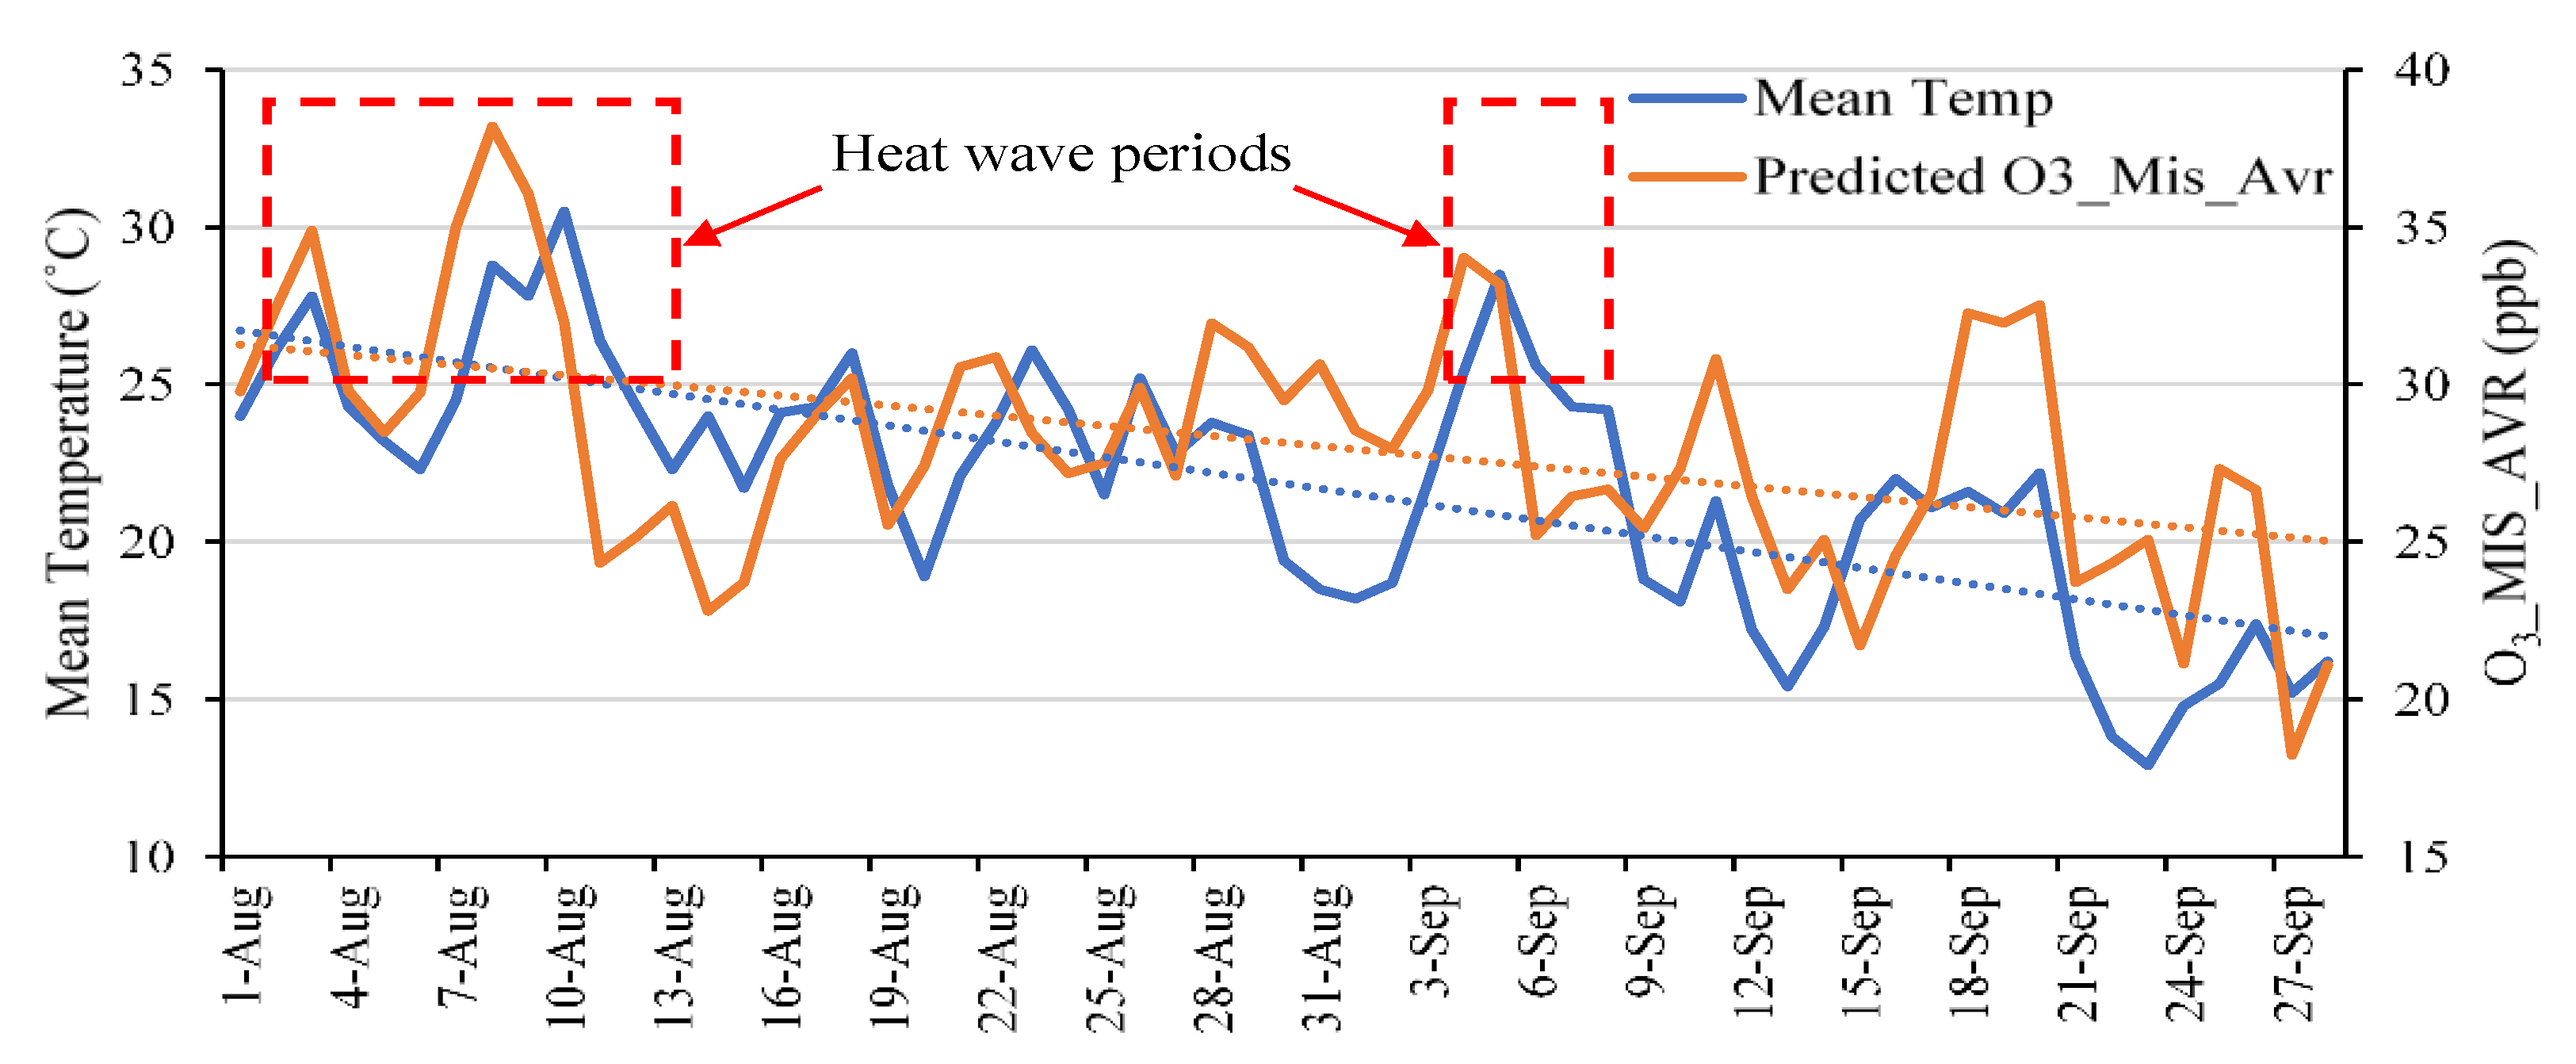
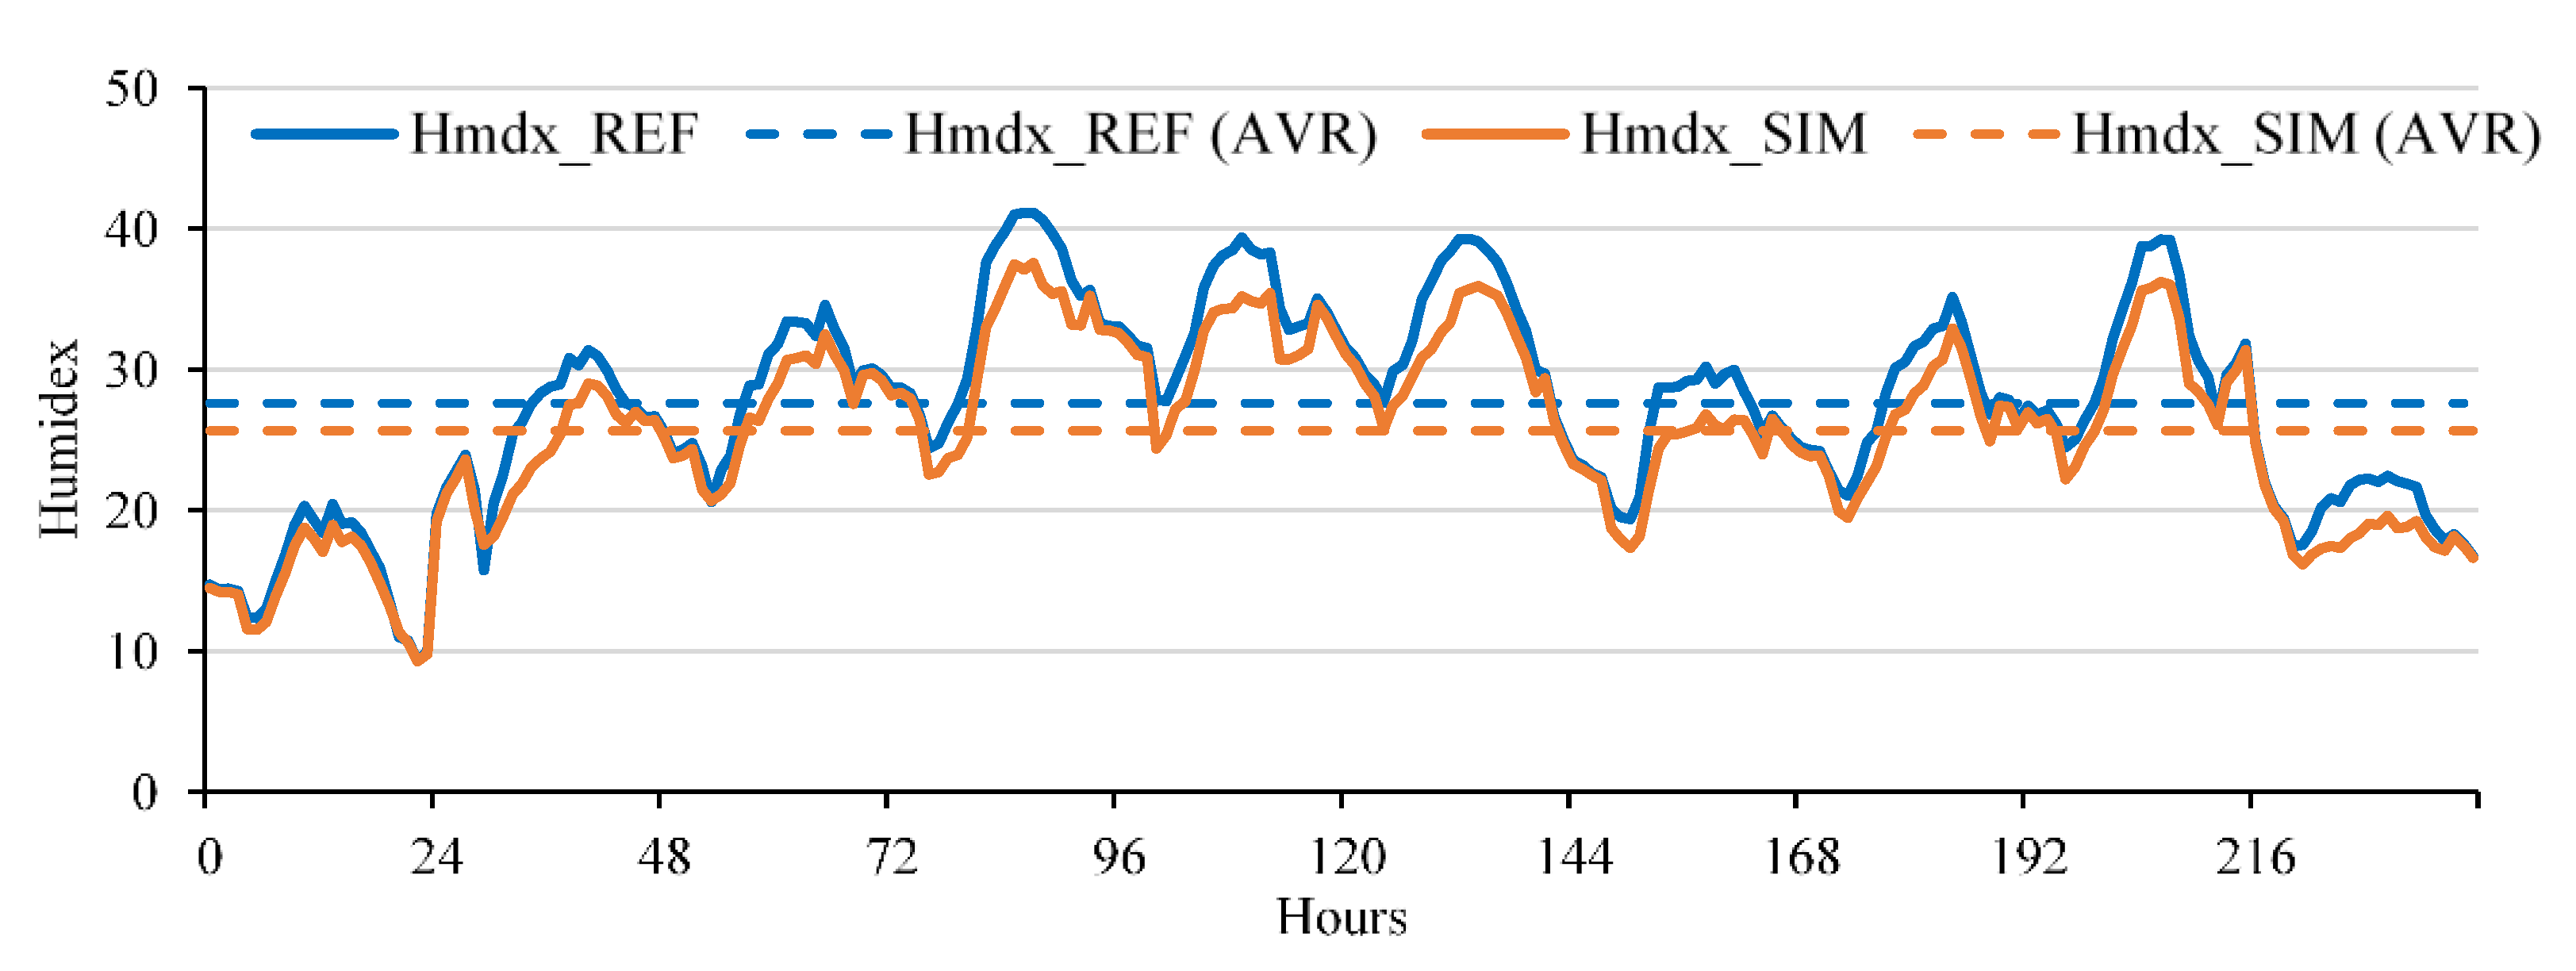
3. Impact of Meteorological Variations on Air Quality
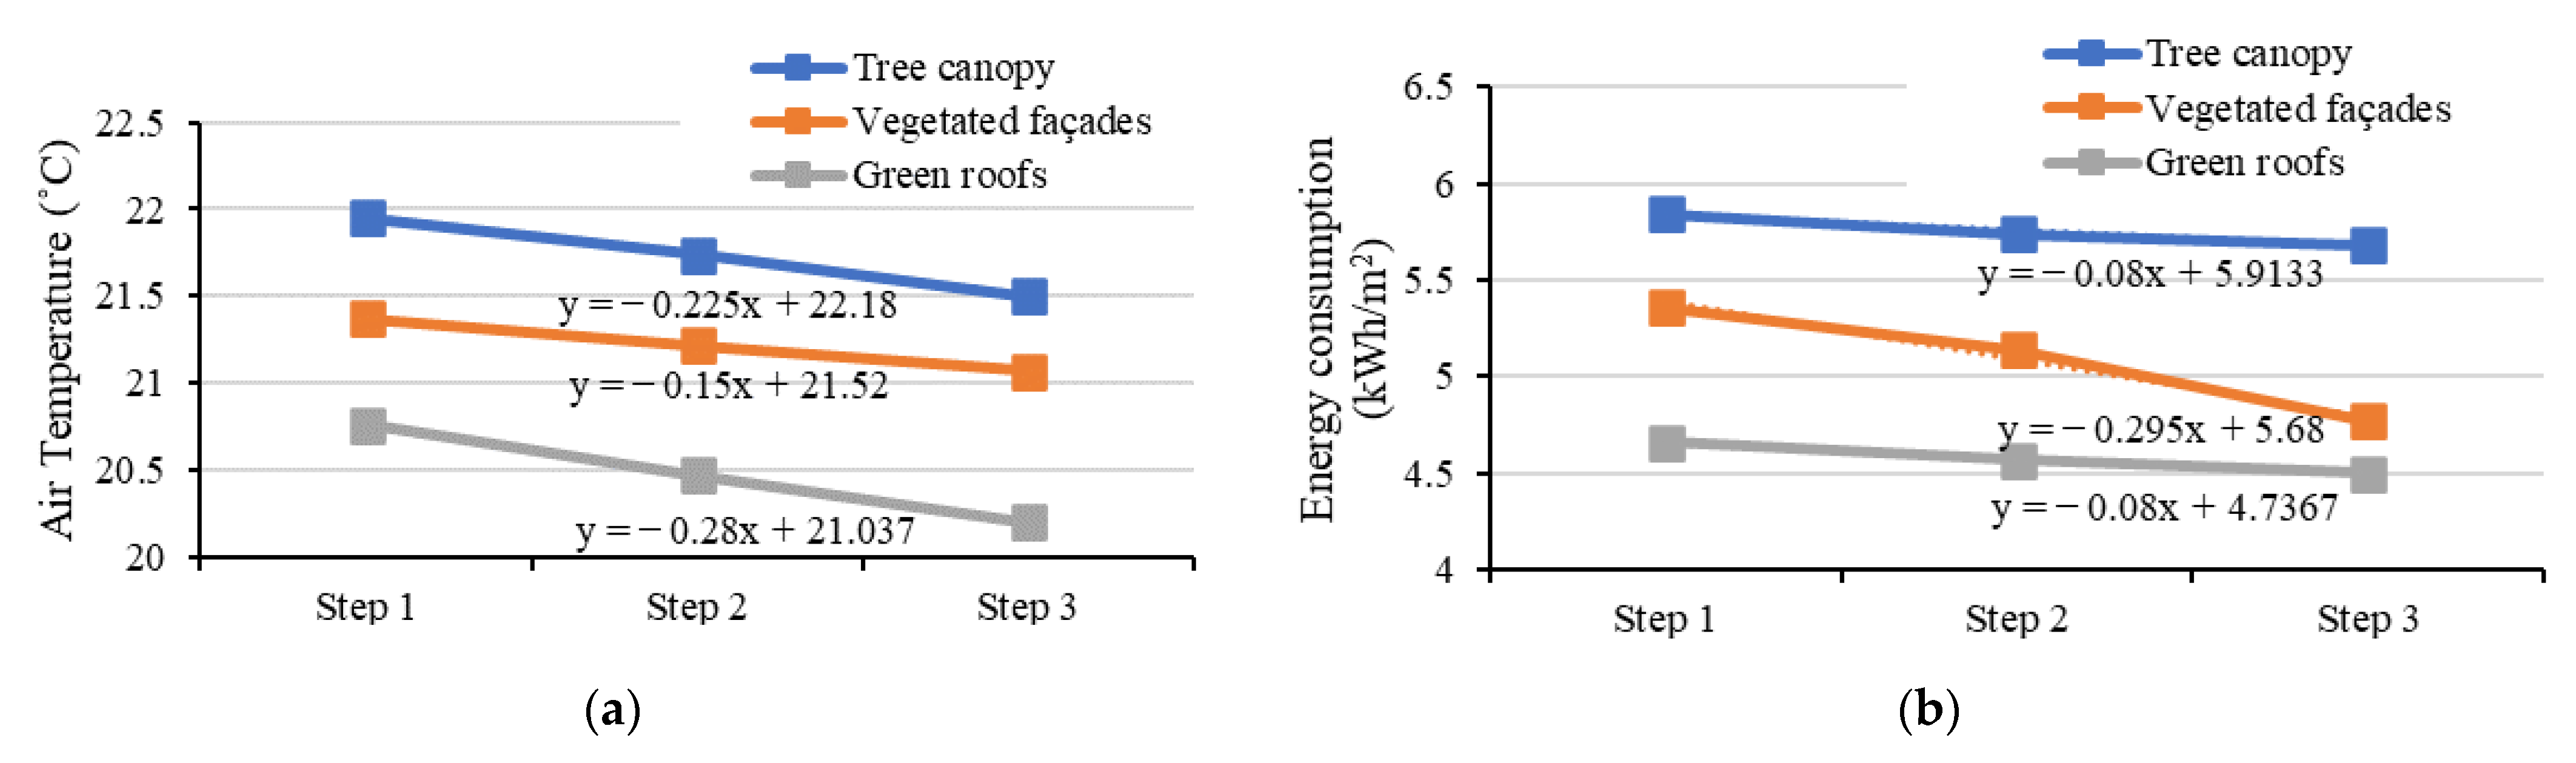
4. Effect of Increasing Urban Greenery Cover
5. Health and Economic Responses
6. Conclusions
Author Contributions
Funding
Institutional Review Board Statement
Informed Consent Statement
Data Availability Statement
Conflicts of Interest
References
- Santamouris, M. Recent progress on urban overheating and heat island research. Integrated assessment of the energy, environmental, vulnerability and health impact. Synergies with the global climate change. Energy Build. 2020, 207, 109482. [Google Scholar] [CrossRef]
- Jandaghian, Z.; Akbari, H. The effects of increasing surface reflectivity on heat-related mortality in Greater Montreal Area, Canada. Urban Clim. 2018, 25, 135–151. [Google Scholar] [CrossRef]
- Berardi, U. A cross-country comparison of the building energy consumptions and their trends. Resour. Conserv. Recycl. 2017, 123, 230–241. [Google Scholar] [CrossRef]
- Wang, Y.; Berardi, U.; Akbari, H. The Urban Heat Island Effect in the City of Toronto. Procedia Eng. 2015, 118, 137–144. [Google Scholar] [CrossRef]
- Pengelly, L.D.; Campbell, M.E.; Cheng, C.S.; Fu, C.; Gingrich, S.E.; Macfarlane, R. Anatomy of Heat Waves and Mortality in Toronto: Lessons for Public Health Protection. Canad. J. Public Health 2007, 98, 364–368. [Google Scholar] [CrossRef] [PubMed]
- Bae, S.; Lim, Y.-H.; Hong, Y.-C. Causal association between ambient ozone concentration and mortality in Seoul, Korea. Environ. Res. 2020, 182, 109098. [Google Scholar] [CrossRef] [PubMed]
- Tsekeri, E.; Kolokotsa, D.; Santamouris, M. On the association of ambient temperature and elderly mortality in a Mediterranean island—Crete. Sci. Total Environ. 2020, 738, 139843. [Google Scholar] [CrossRef] [PubMed]
- Borge, R.; Requia, W.; Yagüe, C.; Jhun, I.; Koutrakis, P. Impact of weather changes on air quality and related mortality in Spain over a 25 year period [1993–2017]. Environ. Int. 2019, 133, 105272. [Google Scholar] [CrossRef] [PubMed]
- Theoharatos, G.; Pantavou, K.; Mavrakis, A.; Spanou, A.; Katavoutas, G.; Efstathiou, P.; Mpekas, P.; Asimakopoulos, D. Heat waves observed in 2007 in Athens, Greece: Synoptic conditions, bioclimatological assessment, air quality levels and health effects. Environ. Res. 2010, 110, 152–161. [Google Scholar] [CrossRef] [PubMed]
- Jandaghian, Z.; Berardi, U. Analysis of the cooling effects of higher albedo surfaces during heat waves coupling the Weather Research and Forecasting model with building energy models. Energy Build. 2020, 207, 109627. [Google Scholar] [CrossRef]
- Berardi, U.; Jandaghian, Z.; Graham, J. Effects of greenery enhancements for the resilience to heat waves: A comparison of analysis performed through mesoscale (WRF) and microscale (Envi-met) modeling. Sci. Total Environ. 2020, 747, 141300. [Google Scholar] [CrossRef] [PubMed]
- Santamouris, M.; Osmond, P. Increasing Green Infrastructure in Cities: Impact on Ambient Temperature, Air Quality and Heat-Related Mortality and Morbidity. Buildings 2020, 10, 233. [Google Scholar] [CrossRef]
- Berardi, U.; Wang, Y. The Effect of a Denser City over the Urban Microclimate: The Case of Toronto. Sustainability 2016, 8, 822. [Google Scholar] [CrossRef]
- Bueno, B.; Norford, L.; Hidalgo, J.; Pigeon, G. The urban weather generator. J. Build. Perform. Simul. 2013, 6, 269–281. [Google Scholar] [CrossRef]
- Dardir, M.; Berardi, U. Development of microclimate modeling for enhancing neighborhood thermal performance through urban greenery cover. Energy Build. 2021, 252, 111428. [Google Scholar] [CrossRef]
- Stieb, D.M.; Judek, S.; Van Donkelaar, A.; Martin, R.V.; Brand, K.; Shin, H.H.; Burnett, R.T.; Smith-Doiron, M.H. Estimated public health impacts of changes in concentrations of fine particle air pollution in Canada, 2000 to 2011. Canad. J. Public Health 2015, 106, e362–e368. [Google Scholar] [CrossRef] [PubMed]
- Government of Ontario, Air Quality Ontario. Available online: http://www.airqualityontario.com/ (accessed on 11 July 2021).
- Weather Canada, Climate and Hazards. Available online: https://www.canada.ca/en/services/environment/weather.html (accessed on 11 July 2021).
- Gao, K.; Santamouris, M.; Feng, J. On the Efficiency of Using Transpiration Cooling to Mitigate Urban Heat. Climate 2020, 8, 69. [Google Scholar] [CrossRef]
- Jandaghian, Z.; Berardi, U. Comparing urban canopy models for microclimate simulations in Weather Research and Forecasting Models. Sustain. Cities Soc. 2020, 55, 102025. [Google Scholar] [CrossRef]
- Blazejczyk, K.; Epstein, Y.; Jendritzky, G.; Staiger, H.; Tinz, B. Comparison of UTCI to selected thermal indices. Int. J. Biometeorol. 2011, 56, 515–535. [Google Scholar] [CrossRef] [PubMed]
- Health Canada. Available online: https://www.canada.ca/en/services/health.html (accessed on 11 June 2020).
- Government of Canada. Available online: https://www150.statcan.gc.ca/t1/tbl1/en/tv.action?pid=1310071001 (accessed on 25 January 2021).
- Peel Data Centre. Available online: https://www.peelregion.ca/planning/pdc/data/health/mortality-rates.htm (accessed on 24 January 2021).
- Anderson, G.B.; Bell, M.L. Heat Waves in the United States: Mortality Risk during Heat Waves and Effect Modification by Heat Wave Characteristics in 43 U.S. Communities. Environ. Health Perspect. 2011, 119, 210–218. [Google Scholar] [CrossRef] [PubMed]
- Wilson, J. EcoHealth Economic Valuation Framework; Quantifying the Health Return on Investments in Greenspace; Case Study: Increasing Tree Canopy, Brampton, ON, Green Analytics Corp. Available online: https://www.ecohealthontario.ca/business-case-studies (accessed on 12 December 2020).


| Dependent Variable: O3_MIS_AVR | Dependent Variable: PM_MIS_AVR | ||||||
|---|---|---|---|---|---|---|---|
| Model | Coef. | t | p-Value | Model | Coef. | t | p-Value |
| (Intercept) | 32.411 | 26.356 | <0.001 | (Intercept) | −12.320 | −16.104 | <0.001 |
| RH_avr | −0.255 | −17.294 | <0.001 | RH_avr | 0.086 | 9.826 | <0.001 |
| PM_Mis_avr | 0.736 | 19.004 | <0.001 | O3_Mis_avr | 0.234 | 19.004 | <0.001 |
| Mean Temp | 0.338 | 7.670 | <0.001 | Mean Temp | 0.429 | 18.584 | <0.001 |
| Dependent Variable: O3_BRM_AVR | Dependent Variable: PM_BRM_AVR | ||||||
|---|---|---|---|---|---|---|---|
| Model | Coef. | t | p-Value | Model | Coef. | t | p-Value |
| (Intercept) | 34.036 | 28.474 | <0.001 | (Intercept) | −13.298 | −16.604 | <0.001 |
| RH_avr | −0.285 | −19.842 | <0.001 | RH_avr | 0.111 | 12.133 | <0.001 |
| PM_Mis_avr | 0.724 | 19.911 | <0.001 | O3_Mis_avr | 0.257 | 19.911 | <0.001 |
| Mean Temp | 0.518 | 12.561 | <0.001 | Mean Temp | 0.310 | 12.637 | <0.001 |
| Location | Brampton, ON | 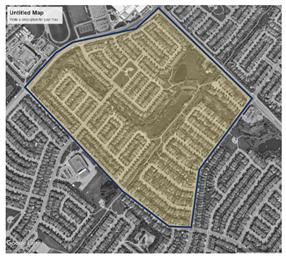 |
| Distance from rural | 35.5 km | |
| Site area | 528,000 m2 | |
| Building footprint | 24.6% (130,000 m2) | |
| Avr. building height | 6 m | |
| V-to-H1 ratio | 0.25 | |
| Road urban area | 33.5% (133,500 m2) | |
| Water surface area | 5.7% (22,500 m2) | |
| Tree canopy | 20% | |
| Vegetation cover | 60% | |
| Building types | 100% residential |
| Air Temp (°C) | RH (%) | E (kWh/m2) | ||
|---|---|---|---|---|
| Reference case | 22.19 | 71.88 | 6.05 | |
| Increasing tree canopy | 30% | 21.95 | 72.76 | 5.84 |
| 40% | 21.74 | 73.6 | 5.74 | |
| 50% | 21.5 | 74.45 | 5.68 | |
| Increasing green façade system 1 | 20% | 21.37 | 74.98 | 5.36 |
| 40% | 21.22 | 75.53 | 5.14 | |
| 60% | 21.07 | 76.09 | 4.77 | |
| Increasing green roofs 2 | 20% | 20.76 | 77.2 | 4.66 |
| 40% | 20.47 | 78.17 | 4.57 | |
| 60% | 20.2 | 79.06 | 4.5 | |
Publisher’s Note: MDPI stays neutral with regard to jurisdictional claims in published maps and institutional affiliations. |
© 2022 by the authors. Licensee MDPI, Basel, Switzerland. This article is an open access article distributed under the terms and conditions of the Creative Commons Attribution (CC BY) license (https://creativecommons.org/licenses/by/4.0/).
Share and Cite
Dardir, M.; Berardi, U. Environmental, Economic, and Health-Related Impacts of Increasing Urban Greenery Cover. Environ. Sci. Proc. 2022, 15, 60. https://doi.org/10.3390/environsciproc2022015060
Dardir M, Berardi U. Environmental, Economic, and Health-Related Impacts of Increasing Urban Greenery Cover. Environmental Sciences Proceedings. 2022; 15(1):60. https://doi.org/10.3390/environsciproc2022015060
Chicago/Turabian StyleDardir, Mohamed, and Umberto Berardi. 2022. "Environmental, Economic, and Health-Related Impacts of Increasing Urban Greenery Cover" Environmental Sciences Proceedings 15, no. 1: 60. https://doi.org/10.3390/environsciproc2022015060
APA StyleDardir, M., & Berardi, U. (2022). Environmental, Economic, and Health-Related Impacts of Increasing Urban Greenery Cover. Environmental Sciences Proceedings, 15(1), 60. https://doi.org/10.3390/environsciproc2022015060