
The Impact of ESG Performance on the Financial Performance of European Area Companies: An Empirical Examination †


Abstract
:1. Introduction
2. Background
3. Methodology
4. Results and Discussion
5. Conclusions
Author Contributions
Funding
Institutional Review Board Statement
Informed Consent Statement
Data Availability Statement
Conflicts of Interest
References
- Amel-Zadeh, A.; Serafeim, G. Why and How Investors Use ESG Information: Evidence from a Global Survey. Financ. Anal. J. 2018, 74, 87–103. [Google Scholar] [CrossRef] [Green Version]
- Wong, W.C.; Batten, J.A.; Ahmad, A.H.; Mohamed-Arshad, S.B.; Nordin, S.; Adzis, A.A. Does ESG certification add firm value? Financ. Res. Lett. 2021, 39, 101593. [Google Scholar] [CrossRef]
- Verheyden, T.; Eccles, R.G.; Feiner, A. ESG for All? The Impact of ESG Screening on Return, Risk, and Diversification. J. Appl. Corp. Financ. 2016, 28, 29. [Google Scholar] [CrossRef]
- Giese, G.; Lee, L.-E.; Melas, D.; Nagy, Z.; Nishikawa, L. Foundations of ESG Investing: How ESG Affects Equity Valuation, Risk, and Performance. J. Portf. Manag. 2019, 45, 69–83. [Google Scholar] [CrossRef]
- Khan, M.; Serafeim, G.; Yoon, A. Corporate Sustainability: First Evidence on Materiality. Account. Rev. 2016, 91, 1697–1724. [Google Scholar] [CrossRef] [Green Version]
- De Lucia, C.; Pazienza, P.; Bartlett, M. Does Good ESG Lead to Better Financial Performances by Firms? Machine Learning and Logistic Regression Models of Public Enterprises in Europe. Sustainability 2020, 12, 5317. [Google Scholar] [CrossRef]
- Lindkvist, L.; Saric, O. Sustainability Performance and Capital Structure An Analysis of the Relationship. Ph.D. Thesis, Department of Business Administration, Umeå School of Business, Economics and Statistics, Umeå, Sweden, 2020. [Google Scholar]
- Velte, P. Does ESG performance have an impact on financial performance? Evidence from Germany. J. Glob. Responsib. 2017, 8, 169–178. [Google Scholar] [CrossRef]


| # | Name | Supersector2 | Country | INDEX |
|---|---|---|---|---|
| 1 | ABB | Industrial Goods and Services | CH | STOXX Europe ESG Leaders 50 |
| 2 | ADIDAS | Consumer Products and Services | DE | STOXX Europe ESG Leaders 50 |
| 3 | ADYEN | Industrial Goods and Services | NL | EURO STOXX 50 |
| 4 | AHOLD DELHAIZE | Personal Care, Drug and Grocery Stores | NL | STOXX Europe ESG Leaders 50 |
| 5 | AIR LIQUIDE | Chemicals | FR | STOXX Europe ESG Leaders 50 |
| 6 | AIRBUS | Industrial Goods and Services | FR | EURO STOXX 50 |
| 7 | ALLIANZ | Financial Services | DE | STOXX Europe ESG Leaders 50 |
| 8 | AMADEUS IT GROUP | Technology | ES | EURO STOXX 50 |
| 9 | ANHEUSER-BUSCH INBEV | Food, Beverage and Tobacco | BE | EURO STOXX 50 |
| 10 | ASML HLDG | Technology | NL | STOXX Europe ESG Leaders 50 |
| 11 | AXA | Financial Services | FR | STOXX Europe ESG Leaders 50 |
| 12 | BASF | Chemicals | DE | STOXX Europe ESG Leaders 50 |
| 13 | BAYER | Health Care | DE | EURO STOXX 50 |
| 14 | BCO SANTANDER | Financial Services | ES | EURO STOXX 50 |
| 15 | BMW | Automobiles and Parts | DE | EURO STOXX 50 |
| 16 | BNP PARIBAS | Financial Services | FR | STOXX Europe ESG Leaders 50 |
| 17 | BP | Energy | GB | STOXX Europe ESG Leaders 50 |
| 18 | CIE FINANCIERE RICHEMONT | Consumer Products and Services | CH | STOXX Europe ESG Leaders 50 |
| 19 | CRH | Construction and Materials | IE | EURO STOXX 50 |
| 20 | DAIMLER | Automobiles and Parts | DE | STOXX Europe ESG Leaders 50 |
| 21 | DANONE | Food, Beverage and Tobacco | FR | STOXX Europe ESG Leaders 50 |
| 22 | DEUTSCHE BOERSE | Financial Services | DE | STOXX Europe ESG Leaders 50 |
| 23 | DEUTSCHE POST | Industrial Goods and Services | DE | STOXX Europe ESG Leaders 50 |
| 24 | DEUTSCHE TELEKOM | Telecommunications | DE | STOXX Europe ESG Leaders 50 |
| 25 | DIAGEO | Food, Beverage and Tobacco | GB | STOXX Europe ESG Leaders 50 |
| 26 | ENEL | Utilities | IT | STOXX Europe ESG Leaders 50 |
| 27 | ENGIE | Utilities | FR | EURO STOXX 50 |
| 28 | ENI | Energy | IT | EURO STOXX 50 |
| 29 | ERICSSON LM B | Telecommunications | SE | STOXX Europe ESG Leaders 50 |
| 30 | ESSILORLUXOTTICA | Health Care | FR | EURO STOXX 50 |
| 31 | FLUTTER ENTERTAINMENT | Travel and Leisure | IE | EURO STOXX 50 |
| 32 | GIVAUDAN | Chemicals | CH | STOXX Europe ESG Leaders 50 |
| 33 | GLAXOSMITHKLINE | Health Care | GB | STOXX Europe ESG Leaders 50 |
| 34 | HSBC | Financial Services | GB | STOXX Europe ESG Leaders 50 |
| 35 | IBERDROLA | Utilities | ES | STOXX Europe ESG Leaders 50 |
| 36 | Industria de Diseno Textil SA | Retail | ES | STOXX Europe ESG Leaders 50 |
| 37 | INFINEON TECHNOLOGIES | Technology | DE | STOXX Europe ESG Leaders 50 |
| 38 | ING GRP | Financial Services | NL | STOXX Europe ESG Leaders 50 |
| 39 | INTESA SANPAOLO | Financial Services | IT | STOXX Europe ESG Leaders 50 |
| 40 | Kering | Retail | FR | STOXX Europe ESG Leaders 50 |
| 41 | KONE B | Industrial Goods and Services | FI | STOXX Europe ESG Leaders 50 |
| 42 | LINDE | Chemicals | DE | EURO STOXX 50 |
| 43 | L’OREAL | Consumer Products and Services | FR | STOXX Europe ESG Leaders 50 |
| 44 | LVMH MOET HENNESSY | Consumer Products and Services | FR | EURO STOXX 50 |
| 45 | MUENCHENER RUECK | Financial Services | DE | STOXX Europe ESG Leaders 50 |
| 46 | NESTLE | Food, Beverage and Tobacco | CH | STOXX Europe ESG Leaders 50 |
| 47 | NOVARTIS | Health Care | CH | STOXX Europe ESG Leaders 50 |
| 48 | NOVO NORDISK B | Health Care | DK | STOXX Europe ESG Leaders 50 |
| 49 | PERNOD RICARD | Food, Beverage and Tobacco | FR | STOXX Europe ESG Leaders 50 |
| 50 | PHILIPS | Health Care | NL | STOXX Europe ESG Leaders 50 |
| 51 | Prosus | Technology | NL | EURO STOXX 50 |
| 52 | RECKITT BENCKISER GRP | Personal Care, Drug and Grocery Stores | GB | STOXX Europe ESG Leaders 50 |
| 53 | RELX PLC | Media | GB | STOXX Europe ESG Leaders 50 |
| 54 | ROCHE HLDG P | Health Care | CH | STOXX Europe ESG Leaders 50 |
| 55 | SAFRAN | Industrial Goods and Services | FR | EURO STOXX 50 |
| 56 | SANOFI | Health Care | FR | STOXX Europe ESG Leaders 50 |
| 57 | SAP | Technology | DE | STOXX Europe ESG Leaders 50 |
| 58 | SCHNEIDER ELECTRIC | Industrial Goods and Services | FR | STOXX Europe ESG Leaders 50 |
| 59 | SIEMENS | Industrial Goods and Services | DE | STOXX Europe ESG Leaders 50 |
| 60 | SIKA | Construction and Materials | CH | STOXX Europe ESG Leaders 50 |
| 61 | TOTALENERGIES | Energy | FR | STOXX Europe ESG Leaders 50 |
| 62 | UBS GROUP | Financial Services | CH | STOXX Europe ESG Leaders 50 |
| 63 | UNILEVER PLC | Personal Care, Drug and Grocery Stores | GB | STOXX Europe ESG Leaders 50 |
| 64 | VINCI | Construction and Materials | FR | EURO STOXX 50 |
| 65 | VIVENDI | Media | FR | EURO STOXX 50 |
| 66 | VODAFONE GRP | Telecommunications | GB | STOXX Europe ESG Leaders 50 |
| 67 | VOLKSWAGEN PREF | Automobiles and Parts | DE | EURO STOXX 50 |
| 68 | Vonovia SE | Real Estate | DE | STOXX Europe ESG Leaders 50 |
| 69 | ZURICH INSURANCE GROUP | Financial Services | CH | STOXX Europe ESG Leaders 50 |
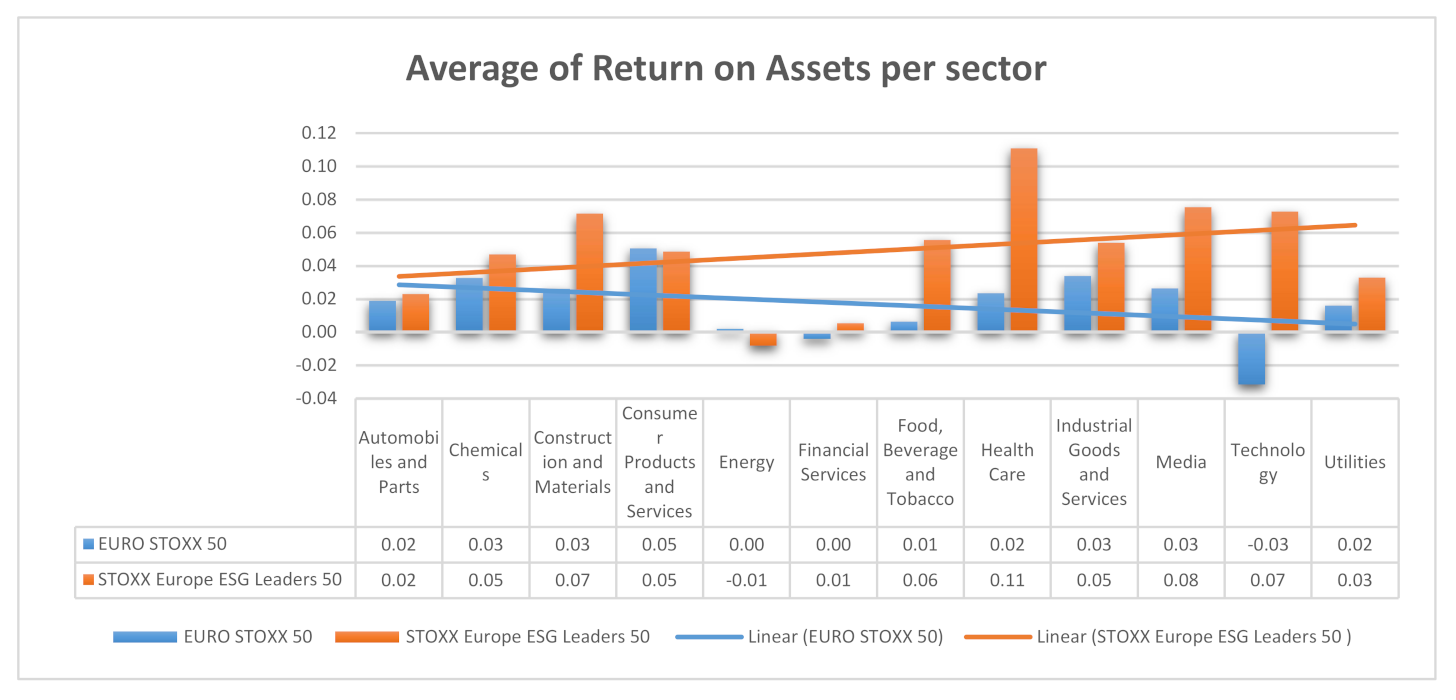
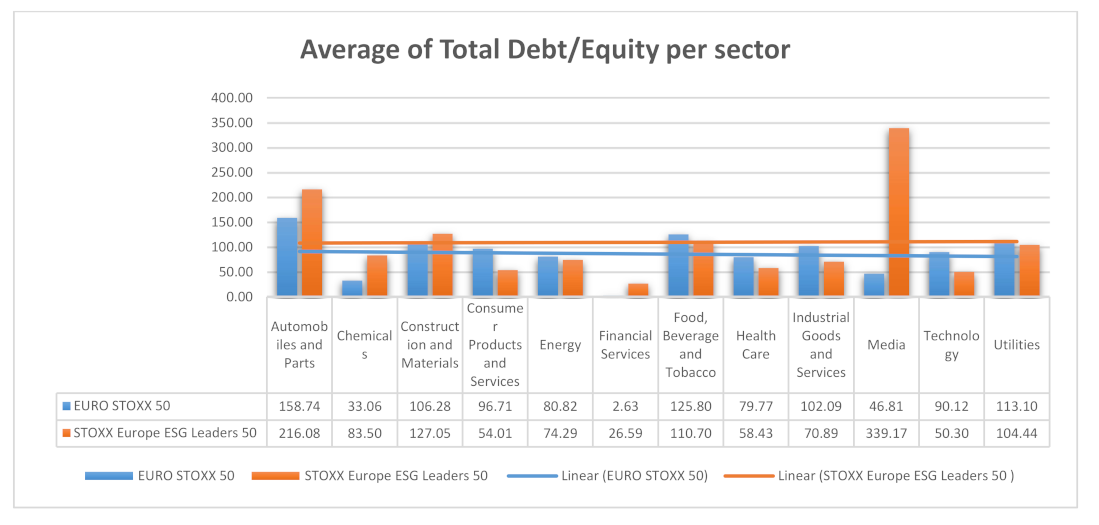
| Average of Beta (5Y Monthly) | Average of Total Debt/Equity (mrq) | Average of Profit Margin | Average of Return on Assets (ttm) | Average of Return on Equity (ttm) | |
|---|---|---|---|---|---|
| Automobiles and Parts | |||||
| EURO STOXX 50 | 1.37 | 158.74 | 5% | 2% | 9% |
| STOXX Europe ESG Leaders 50 | 1.64 | 216.08 | 5% | 2% | 13% |
| Chemicals | |||||
| EURO STOXX 50 | 0.79 | 33.06 | 10% | 3% | 6% |
| STOXX Europe ESG Leaders 50 | 0.77 | 83.50 | 8% | 5% | 11% |
| Construction and Materials | |||||
| EURO STOXX 50 | 0.99 | 106.28 | 3% | 3% | 5% |
| STOXX Europe ESG Leaders 50 | 0.64 | 127.05 | 10% | 7% | 26% |
| Consumer Products and Services | |||||
| EURO STOXX 50 | 0.96 | 96.71 | 11% | 5% | 13% |
| STOXX Europe ESG Leaders 50 | 0.89 | 54.01 | 9% | 5% | 11% |
| Energy | |||||
| EURO STOXX 50 | 1.26 | 80.82 | −11% | 0% | −11% |
| STOXX Europe ESG Leaders 50 | 1.00 | 74.29 | −5% | −1% | −8% |
| Financial Services | |||||
| EURO STOXX 50 | 1.75 | 2.63 | −23% | 0% | −6% |
| STOXX Europe ESG Leaders 50 | 1.28 | 26.59 | 14% | 1% | 8% |
| Food, Beverage and Tobacco | |||||
| EURO STOXX 50 | 1.40 | 125.80 | 9% | 1% | 4% |
| STOXX Europe ESG Leaders 50 | 0.48 | 110.70 | 9% | 6% | 13% |
| Health Care | |||||
| EURO STOXX 50 | 1.12 | 79.77 | −12% | 2% | −18% |
| STOXX Europe ESG Leaders 50 | 0.42 | 58.43 | 21% | 11% | 32% |
| Industrial Goods and Services | |||||
| EURO STOXX 50 | 1.44 | 102.09 | 3% | 3% | 7% |
| STOXX Europe ESG Leaders 50 | 0.91 | 70.89 | 11% | 5% | 18% |
| Media | |||||
| EURO STOXX 50 | 0.68 | 46.81 | 9% | 3% | 10% |
| STOXX Europe ESG Leaders 50 | 0.51 | 339.17 | 17% | 8% | 56% |
| Technology | |||||
| EURO STOXX 50 | 1.52 | 90.12 | 47% | −3% | −1% |
| STOXX Europe ESG Leaders 50 | 1.14 | 50.30 | 17% | 7% | 19% |
| Utilities | |||||
| EURO STOXX 50 | 1.25 | 113.10 | −3% | 2% | −2% |
| STOXX Europe ESG Leaders 50 | 0.64 | 104.44 | 7% | 3% | 8% |
Publisher’s Note: MDPI stays neutral with regard to jurisdictional claims in published maps and institutional affiliations. |
© 2022 by the authors. Licensee MDPI, Basel, Switzerland. This article is an open access article distributed under the terms and conditions of the Creative Commons Attribution (CC BY) license (https://creativecommons.org/licenses/by/4.0/).
Share and Cite
Koundouri, P.; Pittis, N.; Plataniotis, A. The Impact of ESG Performance on the Financial Performance of European Area Companies: An Empirical Examination. Environ. Sci. Proc. 2022, 15, 13. https://doi.org/10.3390/environsciproc2022015013
Koundouri P, Pittis N, Plataniotis A. The Impact of ESG Performance on the Financial Performance of European Area Companies: An Empirical Examination. Environmental Sciences Proceedings. 2022; 15(1):13. https://doi.org/10.3390/environsciproc2022015013
Chicago/Turabian StyleKoundouri, Phoebe, Nikitas Pittis, and Angelos Plataniotis. 2022. "The Impact of ESG Performance on the Financial Performance of European Area Companies: An Empirical Examination" Environmental Sciences Proceedings 15, no. 1: 13. https://doi.org/10.3390/environsciproc2022015013
APA StyleKoundouri, P., Pittis, N., & Plataniotis, A. (2022). The Impact of ESG Performance on the Financial Performance of European Area Companies: An Empirical Examination. Environmental Sciences Proceedings, 15(1), 13. https://doi.org/10.3390/environsciproc2022015013