Next Article in Journal
Application of Cost Benefits Analysis for the Implementation of Renewable Energy and Smart Solution Technologies: A Case Study of InteGRIDy Project
Previous Article in Journal
Workshop on Positive Energy Buildings—Definition
 
 
Please note that, as of 4 December 2024, Environmental Sciences Proceedings has been renamed to Environmental and Earth Sciences Proceedings and is now published here.
Proceeding Paper

The Impact of e-Mobility in Positive Energy Districts †

by
Tony Castillo-Calzadilla
*,
Ainhoa Alonso-Vicario
,
Cruz E. Borges
and
Cristina Martin
Instituto Tecnológico Deusto, Facultad de Ingeniería, Universidad de Deusto, Av. Universidades, 24, 48007 Bilbao, Spain
*
Author to whom correspondence should be addressed.
Presented at the Sustainable Places 2021, Rome, Italy, 29 September–1 October 2021.
Environ. Sci. Proc. 2021, 11(1), 24; https://doi.org/10.3390/environsciproc2021011024
Published: 3 December 2021
(This article belongs to the Proceedings of The 9th Annual Edition of Sustainable Places (SP 2021))

Abstract

:
This article presents preliminary results that assess the effect of electromobility in an archetype Positive Energy District (PED). We present a PED modelling approach that represents renewable energy generation, an energy storage system, the consumption of residential and non-residential buildings, smart lighting services, and the inclusion of electric mobility. We consider renewable energy generation from photovoltaic panels and annual irradiation patterns of the North of Spain to accomplish the electric demands of a synthetic PED. In this general case study, we build up four scenarios where we evaluate at which degree the consumption of EVs would be covered by local Renewable Energy Sources (RES). The simulation results show that the urban areas with great efficiency (in terms of buildings) may support the demand of EVs and even provide a relevant amount of green kms out of PED boundaries.

1. Introduction

Mobility is one of the most concerning problems to be tackled if we want to achieve sustainable places to live, since this sector produces 15% of the emissions worldwide just after the electricity and heat sectors [1], accounting for 8.26 Gt CO2 [2]. The inclusion of electric vehicles (EVs) is a clear EU strategy and a promising solution in view of climate change, since they can avoid the consumption of fossil fuels [3]. In the context of electricity infrastructure, the inclusion of EVs has a great impact on the energy grid as they considerably increase the requirements of renewable energy generation [4].
The current Positive Energy District (PED) definition, given by the Joint Programming Initiative Urban Europe, states that: “PEDs are energy-efficient and energy-flexible urban areas or groups of connected buildings which produce net zero greenhouse gas emissions and actively manage an annual local or regional surplus production of renewable energy. They require integration of different systems and infrastructures and interaction between buildings, the users and the regional energy, mobility and ICT systems, while securing the energy supply and a good life for all in line with social, economic and environmental sustainability” [5]. In general terms, roughly speaking, a PED is defined as a district that produces more energy than needed to meet the district’s demand, and this feature enables the district to export the energy surplus out of its boundaries [6].
On the other hand, some studies remark that smart charging systems of EVs could significantly reduce the cost of distribution networks in low-carbon transition pathways [7]. According to [8], EVs have a great impact on energy efficiency since they can also be used to store energy surpluses that would relieve the peak consumption hours. This technology is easy to be integrated in urban scenarios [9]. There is plenty of research that shows the importance of EVs for demand-side management so as to increase the flexibility of microgrids [10] and also relieve the fluctuations of renewable energy generation [11]. Recent communications [5,12] refer to the relevance of evaluating the impact of EVs on district energy balances, or in other words, on PED performance.
Energy modelling at PED scale is a new area of research where a limited number of publications are still available. Some simulation-based analyses [13] assess the self-sufficiency of an urban district with a varying percentage of PVs and different sizing of energy storage systems (ESSs). Simulation results of four scenarios show the relevance of implementing a local energy sharing scheme. Other model-based analyses [14] present a widely recognised simulation environment (Matlab-Simulink) to analyse monthly and annual energy balances in a PED scale. The effect of electro-mobility has not been evaluated in an urban context, at district or PED scale.

2. Material and Methods

This section presents all the aspects considered at the time of building the simulation. Firstly, we consider the data used for the simulation analysis. Inspired by the ATELIER innovation project, we define a synthetic PED that includes 6 buildings (3 new residential buildings, 3 retrofitted service buildings) [14], a smart grid with PV panels (monocrystalline technology), energy storage systems (ESSs) based on Li-ion batteries, electric vehicles (EVs), and smart poles (lightings and other services). The irradiation patterns were collected from a real station shared by the national weather service in a sensor coded as 1082, located at Bilbao, Spain.
Secondly, we consider data references for electricity consumption. The consumption daily patterns were obtained from Red Eléctrica Española (REE), adopting coefficients for four types of buildings (see [15] for more references). The energy efficiency of buildings is featured by a labelling system promoted by the Spanish IDAE Public Agency [16]. The electric mobility consumption is assessed by the curve of charge of Volkswagen ID3, which is considered an average European EV. The average trajectory of a car in Spain is about 12,947 km/year [17], and the average energy consumption of an EV is 13 kWh/100 km [18]. The analysis of simulation results is presented against these mean figures.
Thirdly, we consider the simulation model. The mathematical model is implemented in MATLAB-SIMULINK, release 2021a, which describes the consumption and generation energy profiles in the (synthetic) PED by simulating daily profiles using hourly data. Figure 1 shows each element of the PED elements: 6 buildings with 6 solar rooftops (PV), 1 electric vehicle charger, and 1 ancillary system or energy storage system (ESS). Each system of the PED (such as PV array, ESS, and EV) is connected through a 240 V/50 Hz bus. The loads are calculated using Ohm’s law (I = V2/R). As in this case, the consumption of EVs is calculated by (P = V/R), where P = power demanded by the EV, V = voltage provided by the utility grid, and R = resistance of the system.
Finally, we consider the methodology applied in the evaluation. The total energy demand of EVs and its effect upon the PED are assessed in four scenarios (see Table 1).

3. Results

The positivity of the PED is assessed in four scenarios, where we have renewable energy generation from PVs and varying energy requirements from: buildings of different efficiency rates (where A implies more efficient performance than B or C), the use of smart lighting systems (LEDs), and the inclusion of a varying number of electric vehicles. Table 2 shows the annual energy balances in terms of electricity surplus (positive values) or deficit (negative values), which should be provided by the general grid.
The first scenario shows the poorest energy efficiency profile in the buildings (C), which makes it impossible to cover the local energy demand with RES in the district. The latest three scenarios achieve positivity, thanks mainly to the higher energy performance of buildings (B or A). Scenario 3 includes the impact of a continuous charging system of EVs (around 400 EVs/year), which has an important effect on the annual energy balances. Note that Scenario 3 yields 87 kWh, while Scenario 2 (same PED without EVs) could be exporting around 7800 kWh/year. The last scenario features a highly efficient PED where all the buildings are A labelled In addition, no consumption from EVs is considered, the annual energy balance would provide 10,855 kWh to the general grid.
If using the energy surpluses for electro-mobility, we can reconsider the annual balances in Table 2. In this sense, Scenario 2 can deliver up to 5,007,708 green kilometres, which corresponds to the consumption of 398 EVs (Volkswagen ID3). The energy export of Scenario 4 could be offered as 6,851,752 green kilometres, which corresponds to the annual trajectories of 545 EVs (in Spain). The archetype of PED considered includes three residential buildings and three buildings of public use. If considering 330 families living in the PED and 1.2 EVs per family, then, we could think that 398 EVs are in the boundaries of the PED and we could export energy for 150 EVs that would travel outside of the PED boundaries.

4. Discussion of Results

The simulation results suggest the following conclusions:
  • Only scenarios where energy efficiency in buildings is reasonably good (labelling system A or B) achieve positive energy balance with a varying number of EVs.
  • Scenarios where buildings are labelled as B can generate up to 7899 kWh energy surplus when using LED lighting and no EVs. This energy could feed around 400 EVs (1 year under Spanish kms usage) and have a positive annual energy balance of 87 kWh.
  • Scenarios where (all six) buildings are labelled as A (new constructions) will generate around 10,855 kWh annual energy surplus, or in other words, can meet the mobility demands of 550 EVs, which represents more than 1.8 million green km.

5. Conclusions

We can conclude that it is possible to achieve positivity in the district, and as a consequence, these energy surpluses could be used to meet the mobility demands of local residents or even (under some scenarios) EVs that would be passing by. It is important to point out that this will only be feasible in city areas with a depth renovation where the buildings have high energy performance levels, local energy generation is possible by RES, and there are buildings of high efficiency consumption and/or LED lighting. In the end, the PED might provide as much as about 7 million green kilometres, which can be turned into 545 EVs in the best scenario of the PED.

Author Contributions

Conceptualization, A.A.-V.; mathematical modelling and simulation analysis, T.C.-C.; analysis of results, C.E.B.; methodology and discussion, C.M. All authors have read and agreed to the published version of the manuscript.

Conflicts of Interest

The authors declare no conflict of interest.

References

  1. C2ES. Global Emissions: Center for Climate and Energy Solutions. 2016. Available online: https://www.c2es.org/content/international-emissions/ (accessed on 14 July 2021).
  2. IEA. Global CO2 Emissions by Sector, 2018—Charts—Data & Statistics—IEA. 2020. Available online: https://www.iea.org/data-and-statistics/charts/global-co2-emissions-by-sector-2018 (accessed on 14 July 2021).
  3. Kristin, S.; Sverrisson, F. Renewables 2016 Global Status Report; REN21: Paris, France, 2016; ISBN 978-3-9818107-0-7. [Google Scholar]
  4. European Technology Platform SmartGrids. SmartGrids SRA 2035 Strategic Research Agenda Update of the SmartGrids SRA 2007 for the needs by the year 2035. In Smart Grids European Technology Platform; European Union: Mestreech, The Netherlands, 2012; p. 74. Available online: https://www.etip-snet.eu/wp-content/uploads/2017/04/sra2035.pdf (accessed on 19 July 2021).
  5. Bossi, S.; Gollner, C.; Theierling, S. Towards 100 positive energy districts in europe: Preliminary data analysis of 61 European cases. Energies 2020, 13, 6083. [Google Scholar] [CrossRef]
  6. Moreno, A.G.; Vélez, F.; Alpagut, B.; Hernández, P.; Montalvillo, C.S. How to Achieve Positive Energy Districts for Sustainable Cities: A Proposed Calculation Methodology. Sustainability 2021, 13, 710. [Google Scholar] [CrossRef]
  7. Pearson, P.J.G.; Foxon, T.J. A low carbon industrial revolution? Insights and challenges from past technological and economic transformations. Energy Policy 2012, 50, 117–127. [Google Scholar] [CrossRef] [Green Version]
  8. Fichera, A.; Pluchino, A.; Volpe, R. Modelling energy distribution in residential areas: A case study including energy storage systems in Catania, Southern Italy. Energies 2020, 13, 14. [Google Scholar] [CrossRef]
  9. Howell, S.; Rezgui, Y.; Hippolyte, J.L.; Jayan, B.; Li, H. Towards the next generation of smart grids: Semantic and holonic multi-agent management of distributed energy resources. Renew. Sustain. Energy Rev. 2017, 77, 193–214. [Google Scholar] [CrossRef]
  10. Uimonen, S.; Lehtonen, M. Simulation of Electric Vehicle Charging Stations Load Profiles in Office Buildings Based on Occupancy Data. Energies 2020, 13, 5700. [Google Scholar] [CrossRef]
  11. Rodríguez, L.R. Achieving Energy-Efficient Districts: Contributions through Large-Scale Characterization and Demand Side Management. Ph.D. Thesis, University of Seville, Seville, Spain, 2018. [Google Scholar]
  12. Towards 100 positive energy districts in Europe: Preliminary data analysis of 61 European cases.
  13. Fichera, A.; Pluchino, A.; Volpe, R. Local Production and Storage in Positive Energy Districts: The Energy Sharing Perspective. J. Front. Sustain. Cities 2021, 3, 1–11. [Google Scholar] [CrossRef]
  14. Castillo-Calzadilla, T.; Fessler, S.; Borges, C.E.; Andonegui, C.M. Urban district modelling simulation-based analysis: Under which scenarios can we achieve a Positive Energy District? In Proceedings of the 2021 18th International Multi-Conference on Systems, Signals & Devices (SSD), Sfax, Algeria, 22–25 March 2021; pp. 1107–1114. [Google Scholar]
  15. Ministerio para la transición ecológica y el reto demográfico. Boletín Oficial del Estado; Real Decreto 1183/2020; Ministerio Para la Transición Ecológica y el Reto Demográfico: Madrid, Spain, 2020; p. 124893.
  16. Instituto para la Diversificación y Ahorro de la Energía (IDAE). Calificación de Efficiencia Energética de Edificios; IDEA: Madrid, Spain, 2009. [Google Scholar]
  17. Instituto Nacional de Estadística. Km Medios Recorridos al año por los Vehículos para uso Personal, por Relación con la Actividad Económica de la Persona de Referencia y Antigüedad del Vehículo; Instituto Nacional de Estadística: Madrid, Spain, 2008. [Google Scholar]
  18. Instituto para la Diversificación y Ahorro de la Energía (IDAE). Consumo y Emisiones de CO2. Vehículos Nuevos. 2016. Available online: http://coches.idae.es/consumo-de-carburante-y-emisiones (accessed on 19 July 2021).
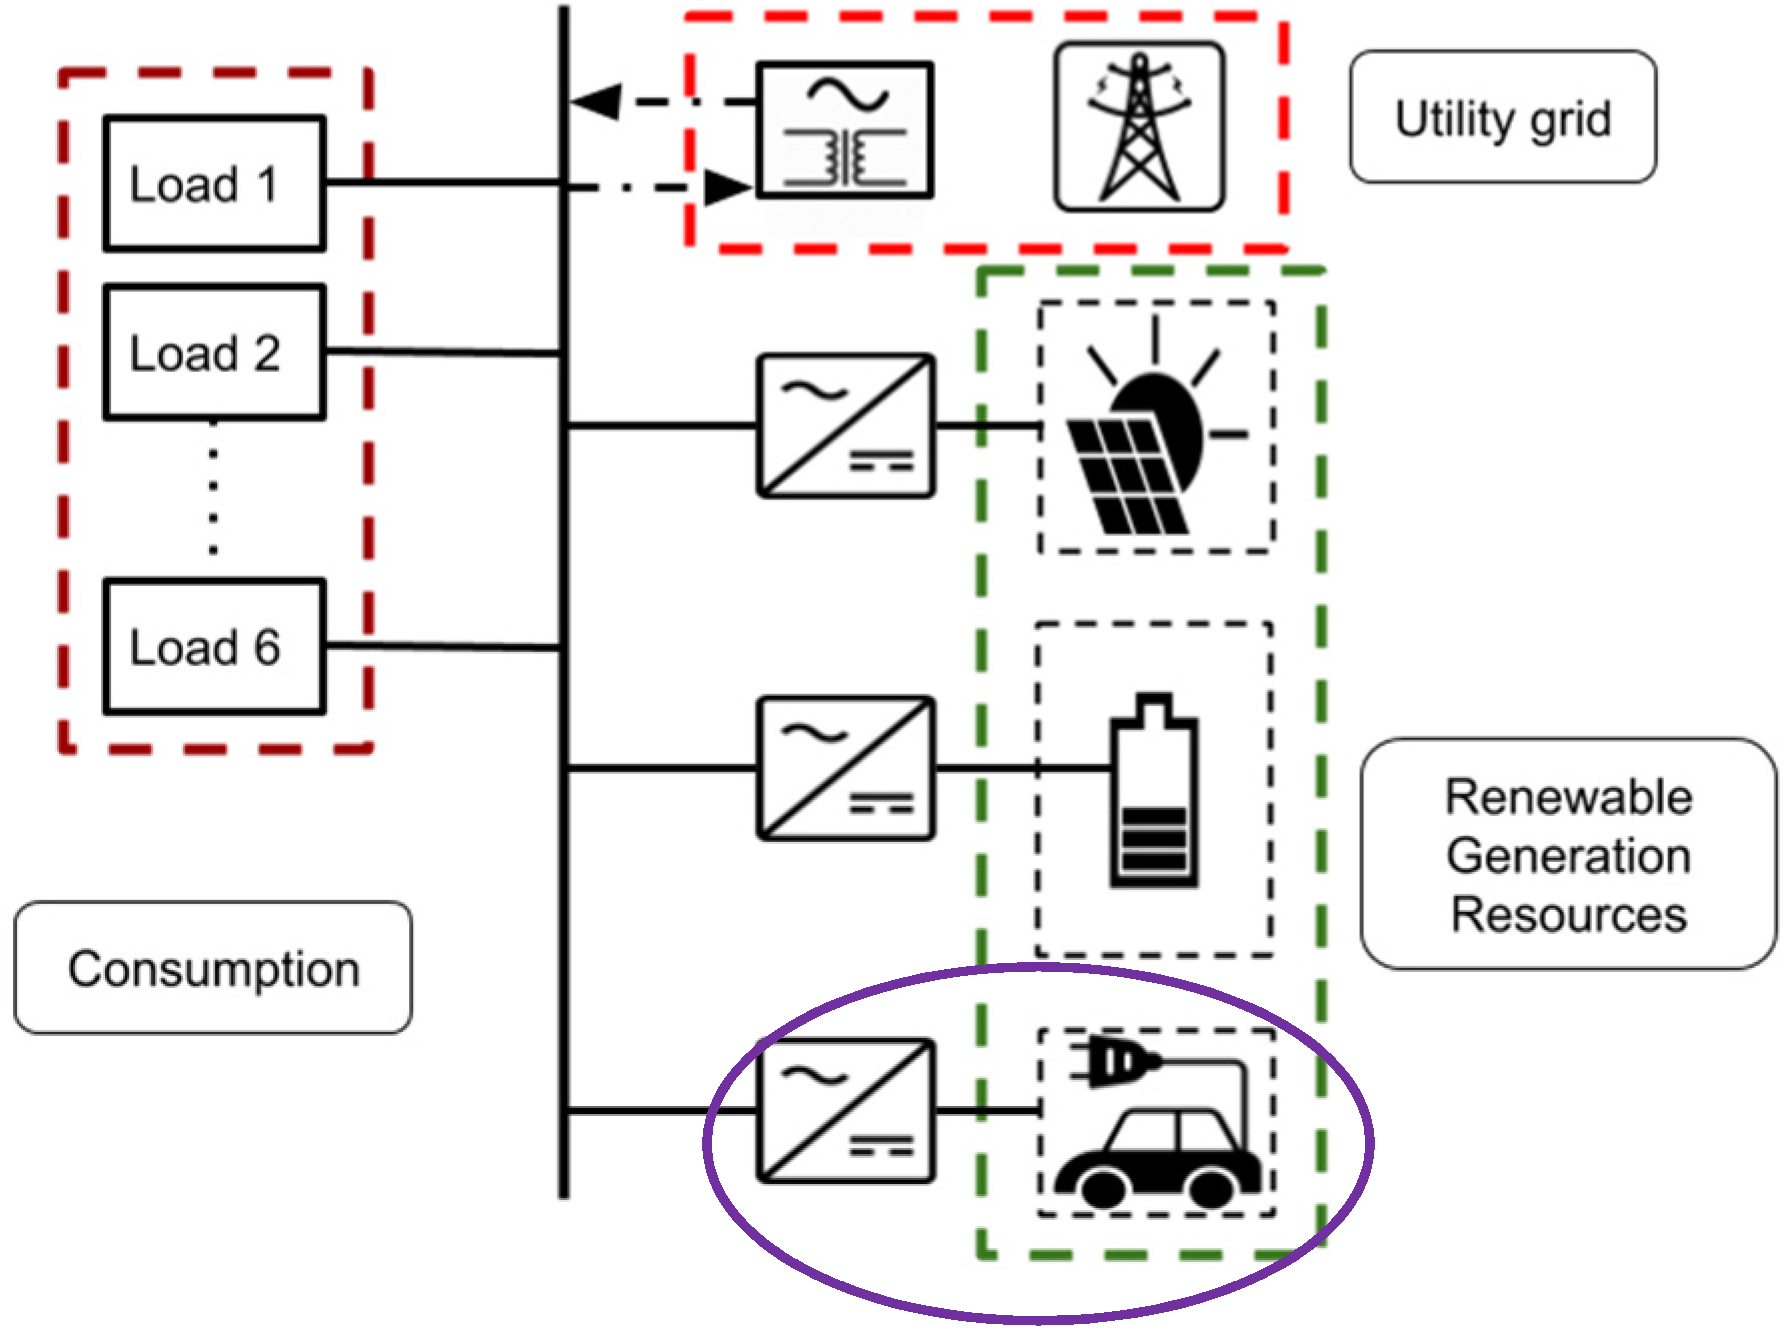
Figure 1. Simulation-based environment for Positive Energy Districts.
Environsciproc 11 00024 g001
Table 1. Scenarios experimented for this simulation approach.
ScenarioPV ESSLightingEVsEnergy Label
1YesYesLEDNoC
2YesYesLEDNoB
3YesYesLEDYesB
4YesYesLEDNoA
Table 2. Results of scenarios experimented for this synthetic PED.
ScenarioPV ESSLightingEnergy LabelEVsAnnual Balance (kWh)PED
1YesYesLEDCNo−2134No
2YesYesLEDBNo7899Yes
3YesYesLEDBYes87Yes
4YesYesLEDANo10,855Yes
Publisher’s Note: MDPI stays neutral with regard to jurisdictional claims in published maps and institutional affiliations.