1. Introduction
Driven by societal and technological changes (e.g., user empowerment, smart ICT (Information and Communication Technology) solutions, climate awareness), modern energy systems have seen a shift towards more decentralized, sustainable and smart systems. Given the heterogeneity of energy systems in terms of resources, infrastructure and stakeholders involved, it is important to understand the effect of such interventions on energy balance and the impact on sustainability goals. Energy models for estimating the performance of different energy interventions rely on data availability, which is often scarce. This becomes more challenging when modeling and simulating areas with a mixed topology, i.e., heterogeneous types of consumers and prosumers, and their energy interventions, as is the case with urban areas. Data on energy demand, production and savings has to be collected from different sources, on different aggregation levels.
This paper presents a data modeling approach to estimate the annual energy balance of different types of consumer categories in urban areas and proposes a methodology to extrapolate energy demands from specific building types to an aggregated level and vice versa. By dividing an urban area into clusters of different consumer categories, depending on parameters such as surface area, building type and energy interventions, energy demands are estimated. Furthermore, the effect of the proposed energy interventions is mapped to an aggregate cluster level, giving an insight into the effect of different energy interventions on a specific urban area.
The presented modeling approach is used to model and calculate the energy balance and CO2 emissions in two areas of the City of Groningen (Netherlands) proposed in the Smart City H2020 MAKING CITY project.
2. Estimating Energy Balance in Urban Districts—A Data-Driven Approach
In an energy system, the single most important characteristic is the maintained energy balance, meaning that at any instant the energy supply and demand have to be matched. Therefore, to understand the effect of (possible) energy interventions on an energy system balance (and other KPIs), knowledge of the energy supply and demand has to obtained. However, energy (demand) data is often scarce. This is due to a combination of factors such as privacy and data sharing concerns, insufficient knowledge of the consumption patterns of different consumer categories, a lack of technical specifications, etc. This can lead to energy models that incorrectly model the energy demand and supply, yielding answers that do not reflect the real impact of scenarios (for example, when modeling an energy transition pathway).
2.1. Development of a Data Modeling Methodology to Extrapolate Energy Data from Specific Building Types to an Aggregated Level
Therefore, to get more accurate models, energy demand and production have to be estimated so that they reflect the consumption and production patterns of different consumer and prosumer categories. This requires insight into data either on an aggregate or disaggregate level. By dividing an urban area into clusters of different consumer categories, depending on parameters such as surface area, building type and energy interventions, energy demands are estimated. Furthermore, the effect of proposed energy interventions is mapped to an aggregate cluster level, giving an insight into the effect of different energy interventions on a specific urban area. To model the energy data of different consumer and prosumer categories, and estimate the energy balance on an hourly level, this paper uses an open-source tool suite developed by TNO consisting of the following elements.
2.2. The ESDL Modeling Language and Map Editor
The Energy System Description Language (ESDL) is an open source modeling language created for modeling the components in an energy system and their relations towards each other. ESDL is capable of expressing the dynamic behavior of components in the energy system, for instance the power consumption of a neighborhood. The aggregation and composition principles of ESDL enable energy modelers to model a complex energy system in a generic way. The ESDL MapEditor is a map-based energy system editor and allows one to define the energy system on a map, thus placing assets in their real life location. These assets can be anything involving production, consumption, infrastructure (transport), conversion and storage for every imaginable energy carrier. The editor further supports configuring the assets in the system that are relevant for the further processing/simulating of the ESDL energy system. For a fully detailed description of ESDL, both technical and pragmatic, see the online gitbook [
1]. An open source version of the ESDL MapEditor can be found here [
2].
2.3. The ESSIM Simulator Tool
ESSIM (Energy System SIMulator) is a tool that simulates network balancing in an ESDL-defined energy system comprising interconnected multi-commodity energy networks. It takes into account energy system information, data profiles and control strategies configured by the user to simulate dynamics in the energy system over a user-defined time period (in user-defined time steps). ESSIM can also be used as a bridge to a loadflow calculation for the power system using Pandapower [REF]. The simulator generates a dashboard visualizing energy mixes in the networks, imbalances and emissions and, if selected, the loadflow calculation results. An open source version of ESSIM can be found at [
3].
3. Local to Global: Aggregation and Disaggregation of Energy Data (to PED Level)
Within many smart cities, one specifically considers urban areas which are so-called PEDs (Positive Energy Districts). These urban areas have clear boundaries, consisting of buildings of different typologies that actively manage the energy flow between them and the larger energy system to reach an annual positive energy balance (see [
3]).
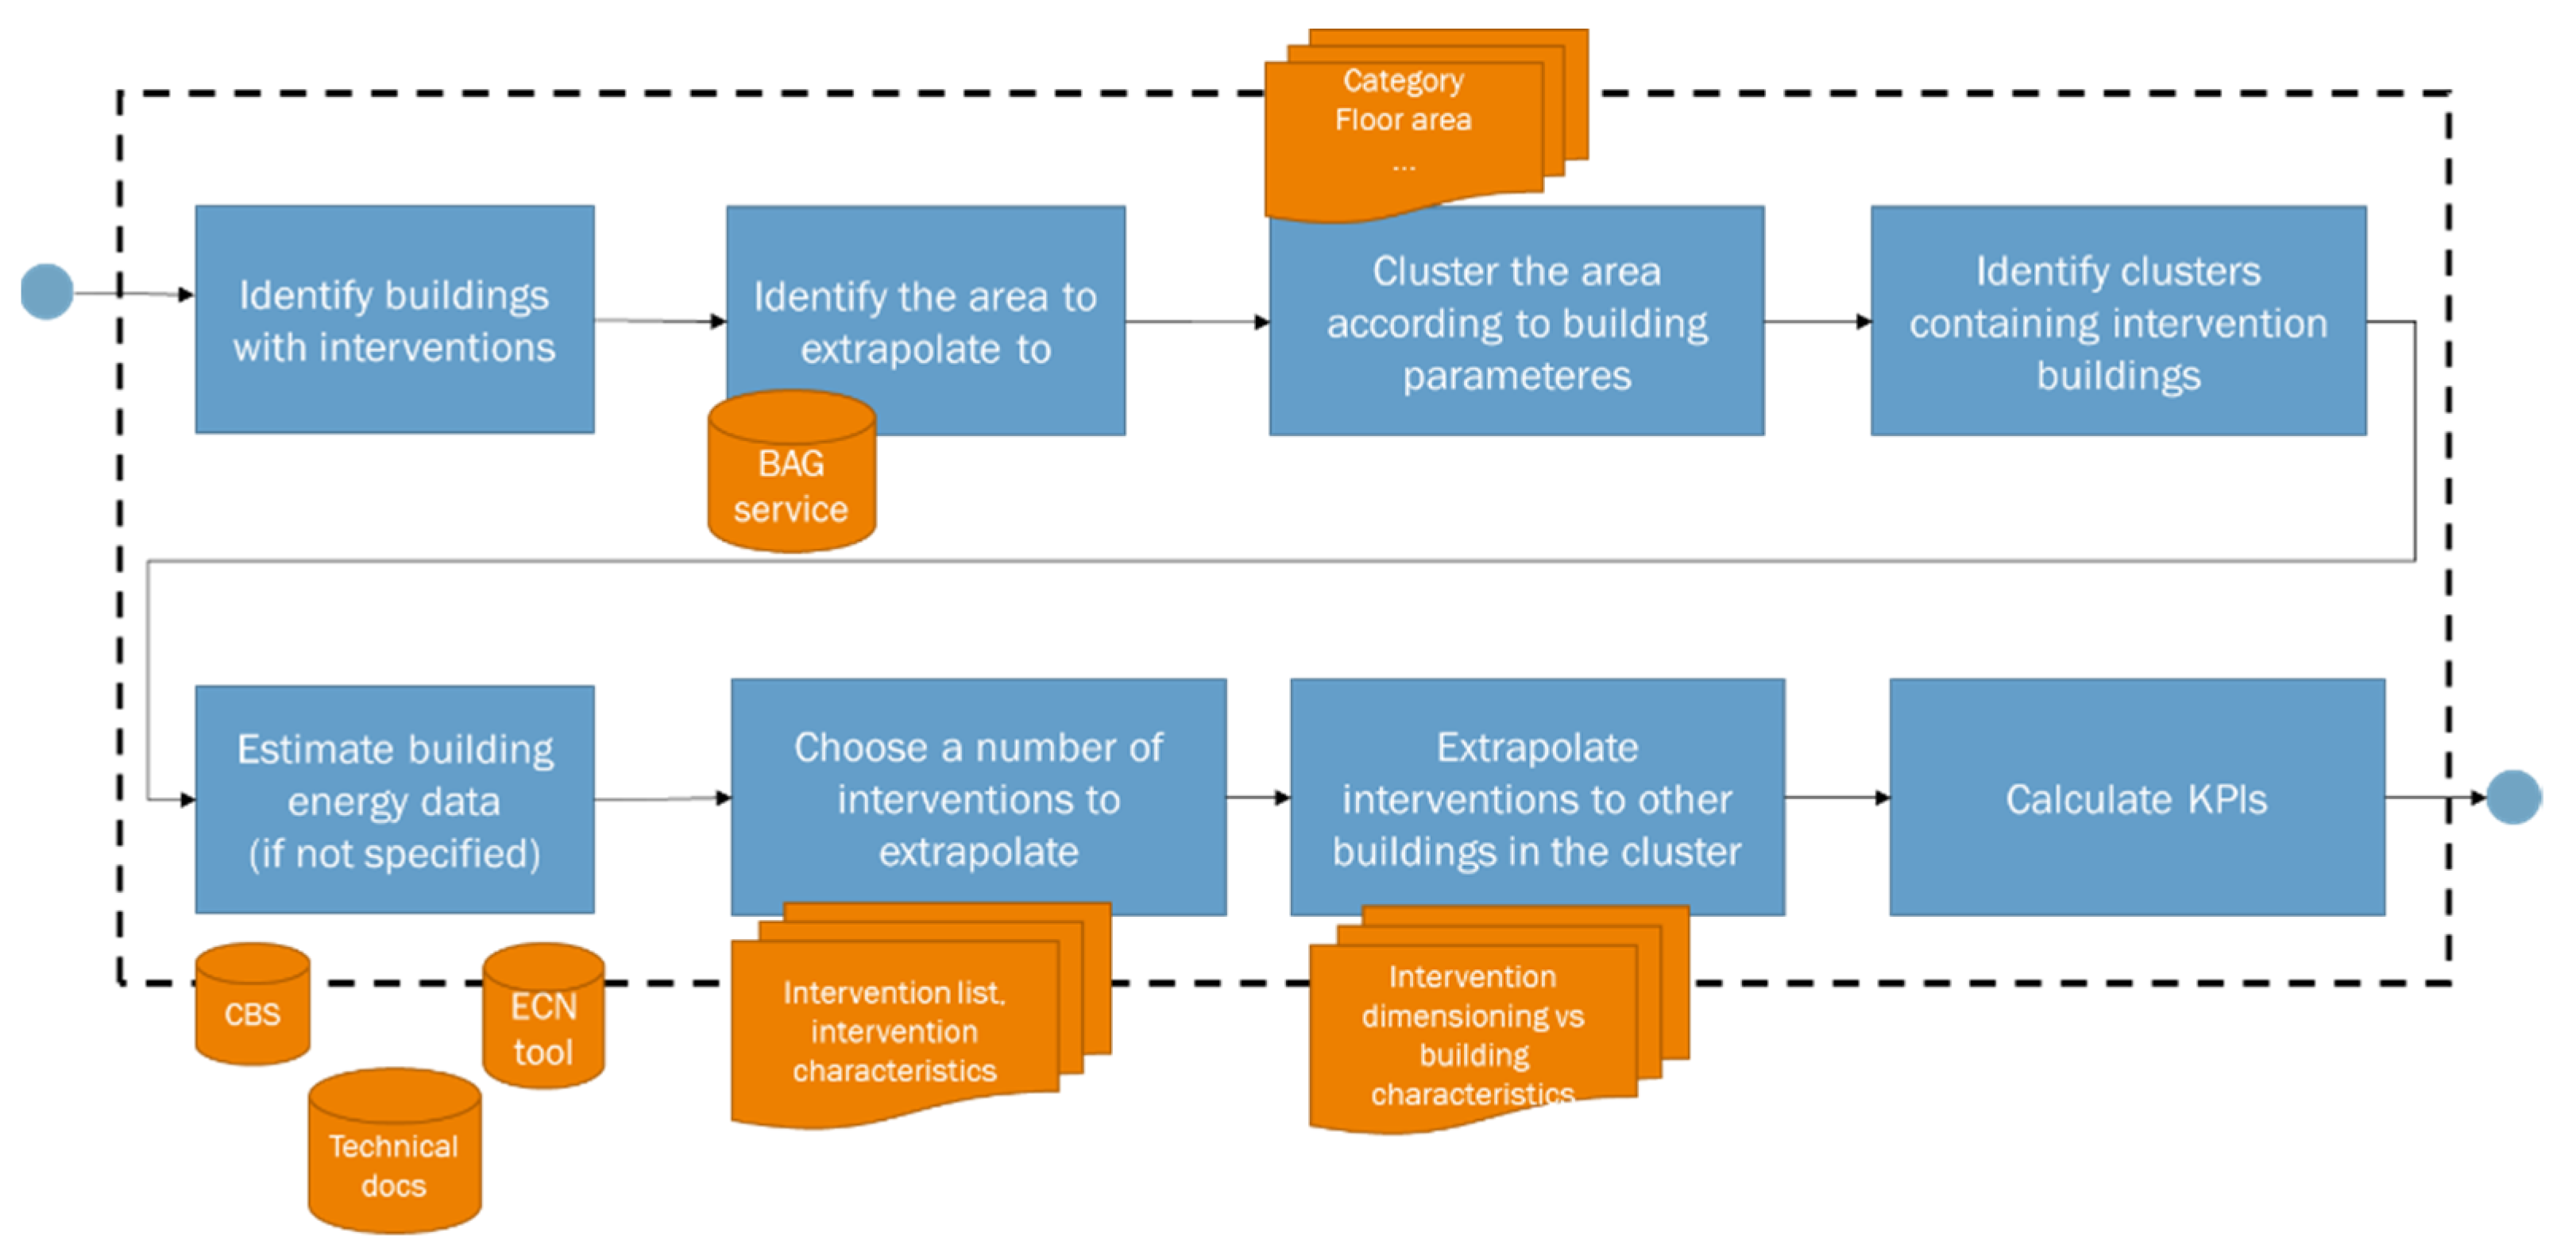
In this section, an initial version of a methodology is proposed to extrapolate building-level physical interventions to reach a PED. The proposed methodology groups buildings in a district into groups (clusters), depending on a number of characteristics. Within those clusters, interventions are extrapolated from intervention buildings to other buildings. Extrapolation entails proper intervention dimensioning, based on a number of identified building and intervention characteristics. Finally, KPIs are calculated for buildings, clusters and the district itself. The design of this methodology is complex, as it requires a number of considerations, such as: identifying building and intervention characteristics; identifying intervention criteria for buildings; identifying building grouping criteria; estimating the energy demand and dimensioning interventions to other buildings.
Figure 1 below shows the conceptual model of the proposed methodology. The process starts by identifying intervention buildings and the area to extrapolate the interventions to (e.g., district), including its buildings. In the case of Groningen, the area information (including buildings and their categories) can be obtained from public Dutch registers of addresses and buildings.
The next step is to group similar buildings and perform an extrapolation in those clusters. Clustering can be performed using different clustering methods and based on a number of characteristics, such as, e.g., category: residential/office/sports/education/prisons/hotel, etc. (ideally, these categories would correspond to those of the project intervention buildings); age; structural characteristics; volume; occupancy; energy consumption by occupants; inclination of roof; energy label; insulation; type of glazing, etc. Different clustering characteristics depend on the available data on buildings. Generated clusters should contain at least one intervention building.
Once the clusters with intervention buildings are identified, the energy data of the buildings within the clusters should be determined. Ideally, energy data should be obtained from existing monitoring/smart meter data, both for intervention buildings and the other ones in the district. However, in most of the cases, this data is scarce and has to be estimated. Estimating energy data depends on the available data sources on buildings and the energy consumption of the selected areas. If existing monitored data from intervention buildings is available, the energy data of other buildings in the cluster can be estimated using a simple linear approximation based on building characteristics. Otherwise, a number of external sources can be used.
After the energy data is estimated, interventions from intervention buildings should be extrapolated to other cluster buildings. Depending on the number of interventions, all or a selection of interventions can be made. Intervention extrapolation requires identifying a number of intervention characteristics, such as: intervention type; intervention scope: building/district/etc.; existing/planned interventions; energy carrier: electricity/heat/gas; intervention dimensions: e.g., capacity, peak production, energy demand, number of panels, etc.
Finally, interventions are extrapolated to other buildings in the district. Although this step is abstracted, it requires a complex analysis of the intervention choice and dimensioning with respect to building properties. The KPIs are calculated on the level of buildings, clusters and the area (district). Calculating KPIs for higher levels of aggregation requires aggregating the energy data (demand and production) of individual buildings.
4. Discussion and Conclusions
In this article, a data modeling methodology to extrapolate energy demands from specific building types to an aggregated level and vice versa has been described. This innovation is key in the case of estimating the annual energy balance of different types of consumer categories in urban areas and fills in the data gap that is usually encountered. Finally, the effect of proposed energy interventions is mapped to an aggregate cluster level, giving an insight into the effect of different energy interventions on a specific urban area.
The presented modeling approach is used to model and calculate the energy balance and CO
2 emissions in two PED areas of the City of Groningen (Netherlands) proposed in the Smart City H2020 MAKING CITY project (see
Appendix A), which addresses and demonstrates the urban energy system transformation towards smart and low-carbon cities, based on the PED concept [
4].
Based on this methodology, which determines different types of buildings and an estimation of intervention dimensioning, future work may include the creation of a catalogue of benchmark buildings for future reference as well as a generalized approach to determining a topology of a PED.


 ,
, 

