Article

Design and Techno-Economic Analysis of Hybrid Power Systems for Rural Areas: A Case Study of Bingöl

by
Ferhat Aydın
1,* and
Dursun Öztürk
2
1
Department of Renewable Energy Systems, Institute of Science, Bingöl University, Bingöl 12000, Türkiye
2
Department of Electrical-Electronics Engineering, Faculty of Engineering and Architecture, Bingöl University, Bingöl 12000, Türkiye
*
Author to whom correspondence should be addressed.
Electricity 2024, 5(3), 562-584; https://doi.org/10.3390/electricity5030028
Submission received: 26 June 2024 / Revised: 28 July 2024 / Accepted: 14 August 2024 / Published: 23 August 2024

Abstract

:
Today, many factors, especially the increasing world population and developing technology, increase the energy needs of people and societies day by day. The fact that fossil resources are both in danger of depletion and have negative environmental impacts has directed countries to new resources. The study focuses on the effective use of renewable energy sources (RES) and the evaluation of waste to meet the electricity and heat energy needs of Yiğit Harman Village, located in the Solhan district of Bingöl Province. For this purpose, a renewable-energy-based combined heat and power system (CHP) was designed using HOMER Pro software (version 3.14.2, Homer Energy LLC, Boulder, CO, USA). Solar, wind, biomass, and hydrogen energy sources were used, considering the resources of the region. Using the designed model, the entire electricity energy requirement and half of the heat energy were completely met by the region’s available RESs. In addition to the technical analysis, economic and environmental analyses were also conducted, and LCOE, NPC, and CO2 emission values were obtained as 0.271 USD/kWh, USD 739,772, and 37,958 kg/yr, respectively. These results indicate that with an investment of approximately USD 7000 per household, the electrical and thermal energy needs for 25 years can be met.

1. Introduction

The need for electrical energy by societies and individuals is continuously increasing. Although there are many reasons for this increase, the main reasons can be considered as the increase in the world population, the rapid development of the industrial sectors of countries, and the increase in the number of electrical devices used in homes due to developing technology. According to the 2022 report from the International Energy Agency (IEA), approximately 80% of the energy consumed in the world for decades has been met by fossil sources [1]. The use of fossil fuels leads to numerous harmful effects on both the environment and human health. Additionally, the depletion of these resources is anticipated soon. Therefore, the generation of electricity through alternative sources has become an inevitable necessity.
RESs, which harness clean and limitless energy from natural sources, have significant potential to meet today’s energy needs. RESs, compared to fossil fuels, cause less harm to the environment while enabling sustainable energy generation. Due to these advantages, interest in RESs continues to grow. According to IEA’s 2022 data, global investments in clean energy increased by 40% compared to 2020 [1].
In parallel with the global trend, there is also a growing inclination towards RESs in Türkiye. According to the data from the Turkish Electricity Transmission Corporation (TEİAŞ) [2], Türkiye’s installed power in 2000 was 27,264.1 megawatts (MW), the total power of RESs was 11,221.6 MW, and its rate was 41.2%. In 2022, the country’s total installed power capacity increased to 103,809.3 MW, the total power of RES increased to 53,234.1 MW, and its rate increased to 53.3% (Table 1).
As is seen in Table 1, in the year 2000, energy production from renewable energy sources other than hydraulic power plants was either zero or very close to zero. However, significant increases have been observed in subsequent years (geothermal energy production increased by 96 times, wind by 602 times, biomass by 192 times). Türkiye’s industrial production value, which was 59.08 billion dollars in 2002, rose to 201.65 billion dollars in 2020 [3]. This increase has led to a diversification of production sources due to the increased demand for energy, and the increased industrial waste has been utilized, resulting in a 192-fold increase in biomass energy production.
RESs, inherently unstable, cannot provide stable and regular energy generation. To overcome this problem, resources have begun to be used in a hybrid manner. Hybrid energy generation systems are systems that combine two or more energy sources to generate energy [4]. These systems aim for more efficient energy generation by working in interaction with each other. In these systems, the void resulting from the inactivity of one energy source can be compensated for by other sources. Thus, these systems offer a more reliable and continuous approach to energy generation. Depending on the characteristics of the geographical location, the energy needs of the region, and technological possibilities, it is possible to achieve maximum efficiency with different combinations such as solar–wind, hydroelectric–wind–solar, and solar–bioenergy–hydrogen.
Below are summarized the key points regarding the importance of renewable-energy-based hybrid systems:
  • Hybrid systems are crucial primarily for meeting the energy needs of rural areas that cannot be powered by the grid. Per capita energy consumption is considered a significant parameter reflecting the level of development of countries. For this reason, people in rural areas not being able to access energy will reduce the development level of countries and thus cause them to be included in the category of underdeveloped or developing countries in the international arena. This is an undesirable situation for these countries.
  • Hybrid systems are also of great importance in terms of environmental impact. The shift towards renewable-energy-based hybrid generation facilities has become a necessity to reduce CO2 emissions.
  • As can be seen from studies in the literature, renewable-energy-based hybrid systems can be used for many different purposes, from fish farms to meeting the energy needs of campuses. In areas beyond residential zones and where the grid does not reach, the necessary energy requirements for agricultural, commercial, and other activities can be reliably met with the help of hybrid systems.
  • In places where natural disasters, especially earthquakes, occur frequently, producing electrical energy using the region’s existing resources is of vital importance to meet the post-disaster energy demand.
  • Finally, generating electrical energy near consumption centers will reduce losses in transmission lines. The reduction in losses will enhance energy efficiency and decrease economic losses.

1.1. Literature Review

Researchers have conducted studies to enhance the efficiency and effectiveness of hybrid systems. Some of these studies are presented below.
Qiblawey et al. [5] provided a comprehensive techno-economic assessment for increasing the use of RESs in the Canary Islands, specifically Tenerife and Gran Canaria. They claimed that with the system designed with the help of HOMER Pro software, the cost of electricity generation would decrease by 23% and 25.3% for both islands, respectively, and there would be a decrease of up to 70% in CO2 emissions.
Ellabban and Alassi presented a hybrid microgrid design for mining applications with their study in 2021. In the study, three case studies in Australia were discussed, and optimizations of hybrid power plants were carried out using HOMER Pro software [6].
In a study presented by Demirören and Yılmaz [7], the authors investigated how electricity generation would be done with the help of RESs for Gökçeada, Türkiye’s largest island. The proposed system was composed of photovoltaic (PV) panels, wind turbines (WTs), and batteries (BSSs), designed using HOMER Pro software. The study revealed that, in terms of cost, wind energy systems were more suitable for Gökçeada.
Fikari et al. modeled and analyzed an independent hybrid power system for a rural area in Kenya with a population of 100. The microgrid, consisting of PV panels, a diesel generator (DG), BSSs, WT, basic loads, water pumping, and purification loads, was modeled with the help of MATLAB Simulink and simulated in terms of power management [8].
Hafez and Bhattacharya designed microgrids for four different scenarios—diesel-only, fully renewable-based, diesel–renewable hybrid, and externally grid-connected—to compare their economies, operational performances, and environmental emissions. HOMER Pro software was used for modeling hybrid renewable energy systems [9].
In their study, Islam et al. presented a case analysis for providing electricity to rural unelectrified areas in the northern region of Bangladesh through a hybrid mini-grid. Three different alternative models were developed for electricity generation with different combinations of solar energy, biomass generator, DG, and BSS storage resources. HOMER Pro software was used to perform techno-economic analysis and determine the optimum off-grid system configuration. It was found that the proposed hybrid system would produce 75% less CO2 than existing methods [10].
In their study, He et al. presented techno-economic analyses for various renewable-energy-based microgrid scenarios, both off-grid and grid-connected, in a residential area in Beijing. They used HOMER Pro software to evaluate the physical, operational, and economic performance of system components and to obtain the most cost-effective configuration model. The proposed renewable-energy-based microgrid was shown to meet at least 90% of the electricity demand [11].
Sigalo et al. designed a hybrid system consisting of PV, DG, and a backup grid for the Rivers State University Faculty of Engineering building using HOMER Pro software and performed its economic analysis [12].
In their study, by Shezan et al. designed the optimal quantity and size of a hybrid energy system comprising PV, WT, BSSs, and DG to meet load requirements. Various optimization techniques were developed and applied for this purpose. Additionally, a control method incorporating proportional-integral-derivative (PID) and fuzzy logic controllers (FLC) to manage voltage and frequency was implemented using MATLAB Simulink [13].
Odetoye et al. presented the design of a multi-source independent renewable-energy-based microgrid for a rapidly commercializing rural region in Nigeria. The design and techno-economic analyses of the proposed model were performed using HOMER Pro software. The results show that up to 7540 tons of CO2 can be saved per year thanks to the proposed system [14].
In their study, Mbasso et al. aimed to design an independent hybrid renewable energy system for Manoka Island, where fish farming is the primary activity. The daily electricity consumption of the considered residence averages 9.28 kWh, with a peak demand of 0.88 kW. HOMER Pro software was used to investigate the most suitable energy generation model to sustain the fish farming industry and meet the energy requirements of the selected building [15].
In the study conducted by Peláez-Peláez et al., a CHP system consisting of PV-FC was designed and analyzed. The analysis results indicated that while the system was not economically feasible, it was technically feasible [16].
In the study presented by Kalamaras et al. [17], an off-grid system based on RESs was designed and optimized using HOMER Pro to meet the heat and electricity needs of a household. The results indicated that a system consisting of a 3 kW WT, a 3.35 kW PV panel, a 2.9 kW FC, a 6 kW BSS, a 4.2 kW electrolyzer, and a 40 kg HTS can meet a household’s electricity and thermal energy demands throughout the year.
In their study, Jahangiri et al. designed a CHP system for a household in the Abadan region of Iran using HOMER Pro, incorporating WT, PV, BG, FC, and BSS components. It was stated that the most significant advantage of the proposed system is the ability to recover the heat energy generated in BG and FC. According to the analysis results, the LCOE value was calculated to be USD 1.16/kWh [18].
Studies in the literature, some of which are presented above, show that researchers are focusing on modeling renewable-energy-based hybrid systems for a wide range of different objectives for almost all rural areas around the world. This focus highlights the importance of hybrid systems in addressing diverse energy needs.

1.2. Aim of the Study

Since many parameters are considered in modeling hybrid systems, the process is complex and difficult. As mentioned above, RESs are inherently uncertain. For example, a sudden stop of the wind or the disappearance of the sun due to cloudiness will cause sudden generation decreases. During these transitional periods, the system must quickly decide which generation resources will be put into use. Another difficulty is balancing generation and consumption values. If the generation amount does not meet consumption, energy shortages will occur. If the generation value exceeds consumption, it may result in unnecessary excess energy. To overcome this problem, adding storage units to the system can be a good solution. Thus, when energy generation is high, the remaining energy will be stored and can be used when generation is insufficient. However, storage units both increase the cost of the system and cause losses.
System cost is one of the most critical parameters to consider when modeling. Two parameters are important in cost measurement: NPC and LCOE. NPC represents the value obtained by subtracting the present value of all expenditures for the installation and operation of system components over the project’s duration (25 years) from the present value of all earned revenues during this period. LCOE is the average cost of producing 1 kWh of useful energy in the system (excluding losses) over its lifetime.
The installation cost of the designed system depends on the resource selection made during system creation. Operating costs depend on which source will generate how much at any given time. All these issues make the design of hybrid systems difficult.
This study aims to design a hybrid generating system considering the mentioned difficulties and to evaluate the resources of the village of Yiğit Harman, consisting of 111 households, located in the Bingöl Province, to meet its energy needs. The resources available in the village are considered in the system design. The targeted benefits of this study are as follows:
  • Yiğit Harman Village has a fortunate location in terms of solar and wind potential. Therefore, all the needed electrical energy and half of the thermal energy will be met cleanly and reliably by using the RESs of the village.
  • Agriculture and livestock are the main livelihoods of the village. For this reason, agricultural and animal wastes are used in the production of electricity and heat energy, aiming to eliminate environmental waste and meet the energy needs of the village with its means.
  • When wind and solar energy are high, hydrogen is produced with these resources, and when production is low, electricity is produced with the help of fuel cells (FCs). Since fuel cells have a high operating temperature, heat energy is also generated while producing electrical energy. In the designed model, the heat energy generated by the fuel cells is used for heating homes. This way, both clean and reliable energy supply was ensured, and a highly efficient model was achieved.
  • On 6 February 2023, two major earthquakes with magnitudes of Mw7.7 and Mw7.6 occurred successively in the Pazarcık and Elbistan districts of Kahramanmaraş Province. According to the report titled the “2023 Kahramanmaraş and Hatay Earthquakes Report” by the Presidency of Strategy and Budget of the Republic of Turkey, the earthquakes resulted in the collapse of 11 towers connecting 1128 km of power transmission lines belonging to TEİAŞ, damage to transformer stations and equipment with a total capacity of 4088 MVA, and an economic loss amounting to USD 38 million. The report also states that the repairs to eliminate these damages took more than three days [19]. As demonstrated by this disaster, meeting the energy needs of earthquake-prone regions from local sources is of critical importance for minimizing economic losses and ensuring the safe continuation of post-earthquake search and rescue operations. Bingöl Province is one of the most important earthquake regions in Türkiye, and earthquakes of 7 and above on the Richter scale are frequently experienced.
Although this study was carried out for Yiğit Harman Village, it will be encouraging for settlements with similar characteristics. The optimization of the system was carried out using the software application known as HOMER, developed by the National Renewable Energy Laboratory (NREL) based in the United States.
The remaining part of the study is as follows: In Section 2, the “HOMER Pro” software is introduced, and the modeling of system components is explained. In Section 3, the analysis results are presented. In Section 4, the obtained results are evaluated, and suggestions for new studies are provided.
2. Materials and Methods

2.1. System Design

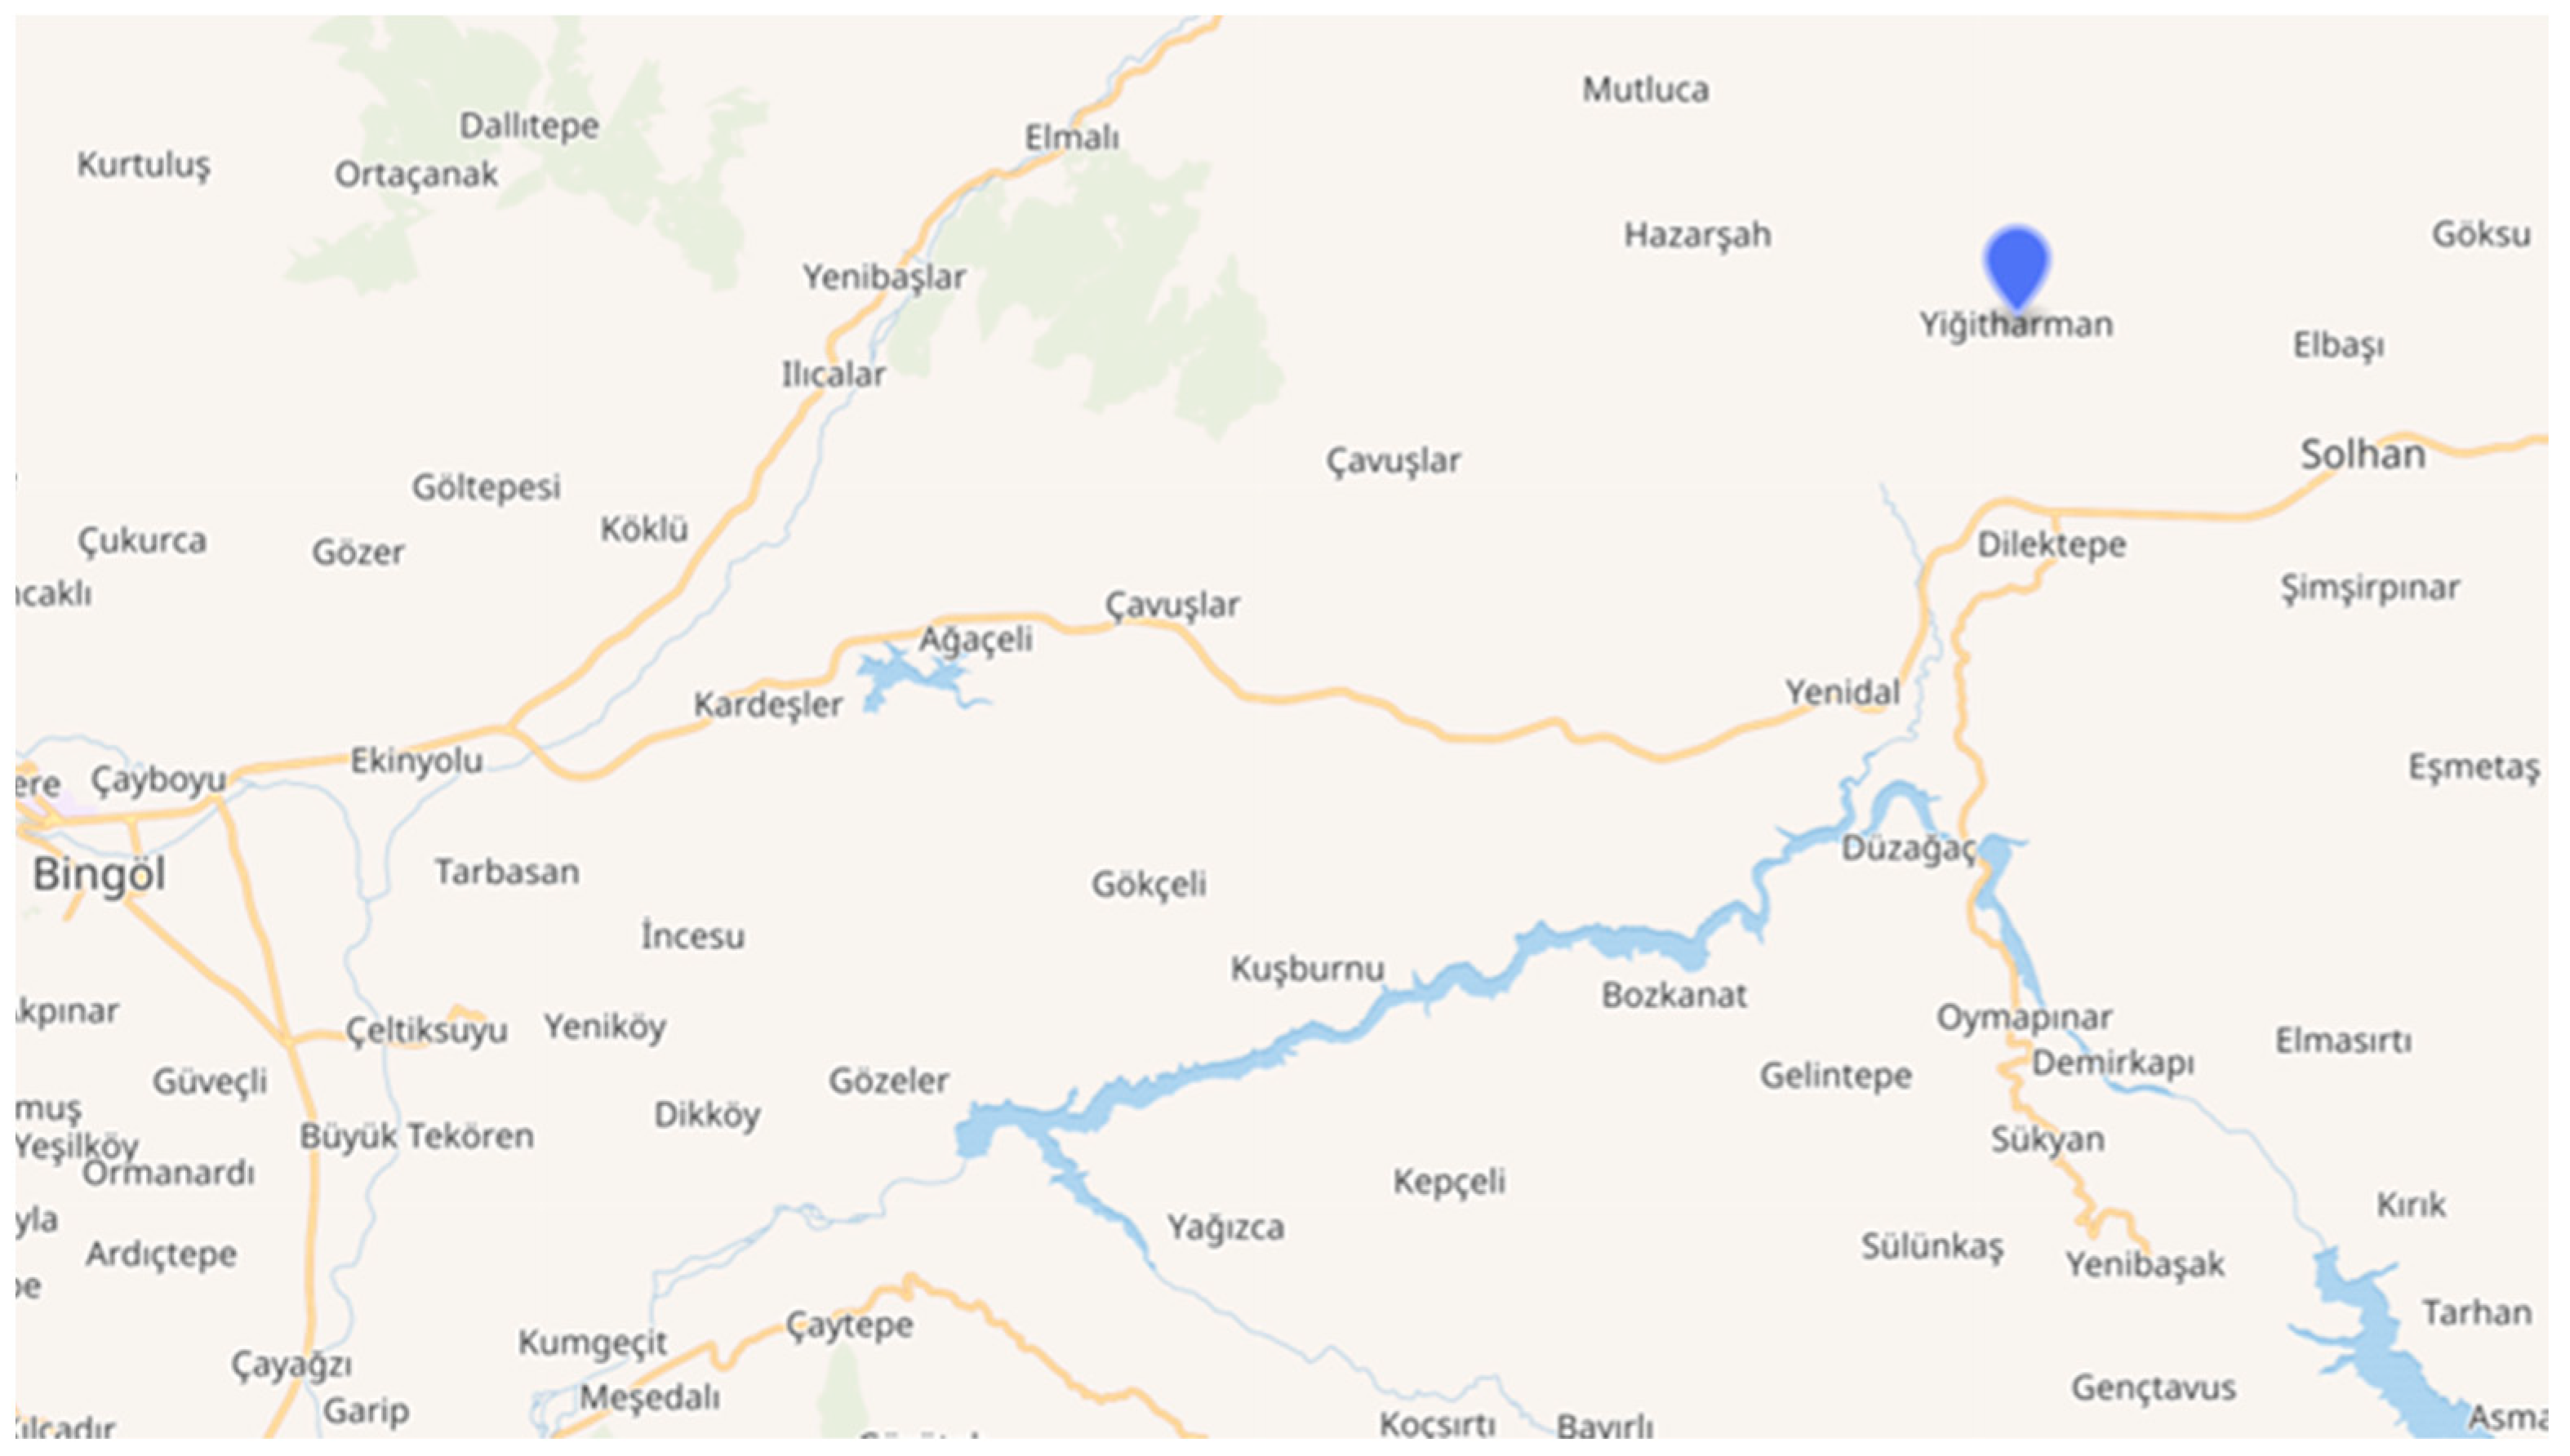
In this study, a renewable-energy-based microgrid was modeled to meet both the electricity and heat energy needs of Yiğit Harman Village, which is located 61 km away from Bingöl city center, as shown in Figure 1, with a population of 1052 [20].
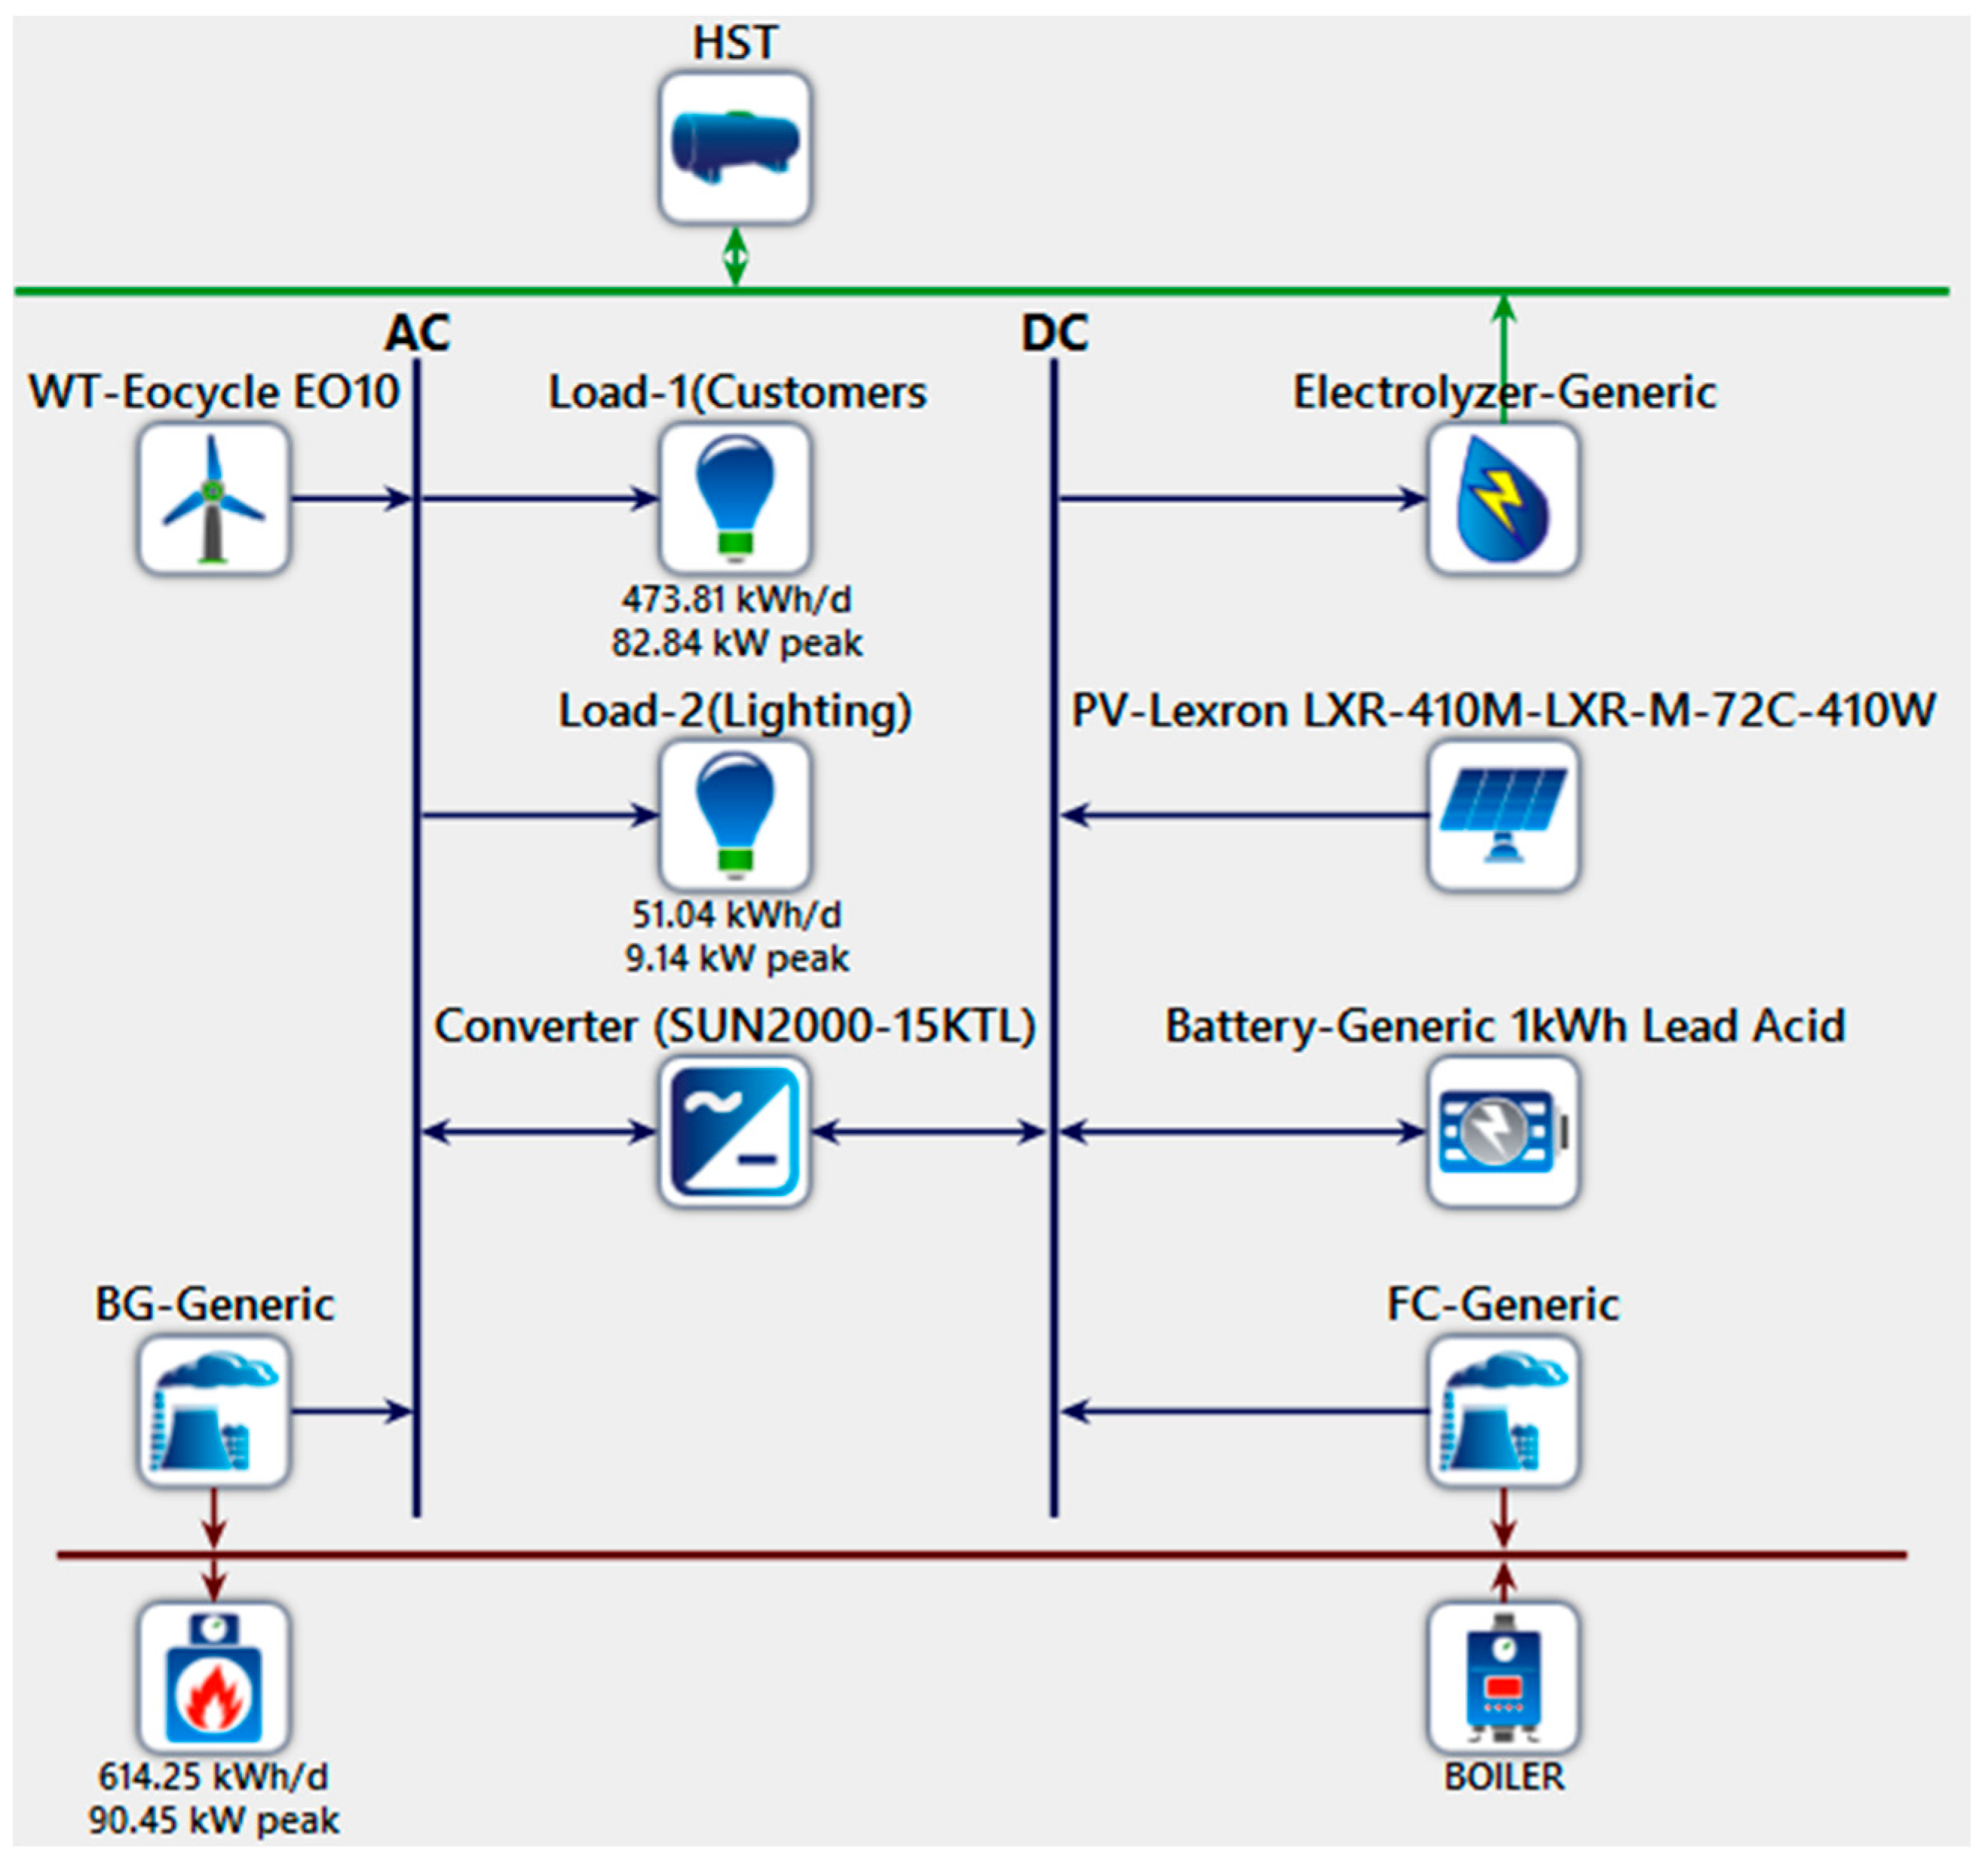
In the model shown in Figure 2, biomass, wind, solar, and hydrogen energy sources, along with FCs and storage systems, were utilized. Analyses for different scenarios were conducted using the HOMER software. Thanks to the proposed energy management model, the energy requirements of the loads were met most efficiently and economically. The direct current (DC) energy produced by the PV system and FC is converted to alternating current (AC) through an inverter to supply the loads. Additionally, some of the energy generated by these systems is stored in BSSs and, when needed, converted back to AC through the inverter and directed to the AC loads. AC energy generated from wind and biomass sources is directly transferred to AC loads. The surplus energy generated by the system is used in hydrogen production through an electrolyzer. The stored hydrogen in a tank is utilized for electricity generation with the help of FCs when needed. It is of great importance to perform feasibility analyses in the best possible way when designing hybrid systems. The heat energy generated during the operation of the biogas generator and the fuel cell is used for heating homes together with a boiler. HOMER software can simulate the most economically, environmentally, and technically appropriate systems [21].
Detailed information about Load-1 and Load-2 in Figure 2 is provided in Section 2.2.1, and detailed information for each component is provided in Section 2.3.
HOMER is a program developed by the NREL in the United States. This software provides an easy interface for the users to design and optimization of grid-connected or isolated hybrid energy systems. HOMER can model loads and energy units together, such as PV panels, WTs, FCs, hydroelectric power plants, biomass power sources, regenerative generators, BSSs, and gas tanks [22]. Using factors such as entered electrical load data, meteorological data, and unit cost prices for the system equipment to be used, HOMER classifies different configurations in order of suitability. The program also facilitates simulation, optimization, and sensitivity analysis for the user. Considering technical and economic factors such as maintenance and renewal processes, it assists in determining the best system through the optimization process. This software helps optimize the design process by providing convenience and efficiency to the user, despite the complexity of energy systems [23]. This software not only performs the complex calculations of the systems mentioned above but also performs a comprehensive analysis of environmental impacts such as greenhouse gas emissions [15].
In HOMER Pro software, two important dispatch strategies are used: Cycle Charging (CC) and Load Following (LF). In both strategies, the amount of energy generated from RES and the energy stored in batteries are considered first. If the load demand cannot be met by these sources, the diesel generator is activated. The difference between these two strategies is as follows: In the CC strategy, the generator is activated to meet the entire load, while the RES is used to charge the batteries. In the LF strategy, the generator does not operate at maximum power; it only generates power to meet the unmet portion of the load. The task of charging the batteries is assigned to the RES.

2.2. Data Used in the System

The first critical parameter for sizing a hybrid system that combines different storage systems with renewable energy sources is the daily load distribution data of the region where energy will be supplied. In addition, meteorological data such as solar radiation, wind speed, and temperature for the region, along with resource data such as hydraulic and biomass, are of vital importance in selecting the components to be used in the system.

2.2.1. Electrical Load Data of the Region

The 2023 monthly consumption data summary for Yiğit Harman Village, obtained from the Fırat Electricity Distribution Joint Stock Company (Bingöl, Türkiye) responsible for electricity distribution in Bingöl Province, is presented in Table 2. The Distribution Company recorded the energy consumption for the village’s lighting and the total energy consumed by consumers in their homes through two separate meters. Monthly consumption values for each group were divided by the number of days in that month to calculate the daily consumption average for that group. Daily consumption average values were divided by 24 to calculate the hourly consumption average values.
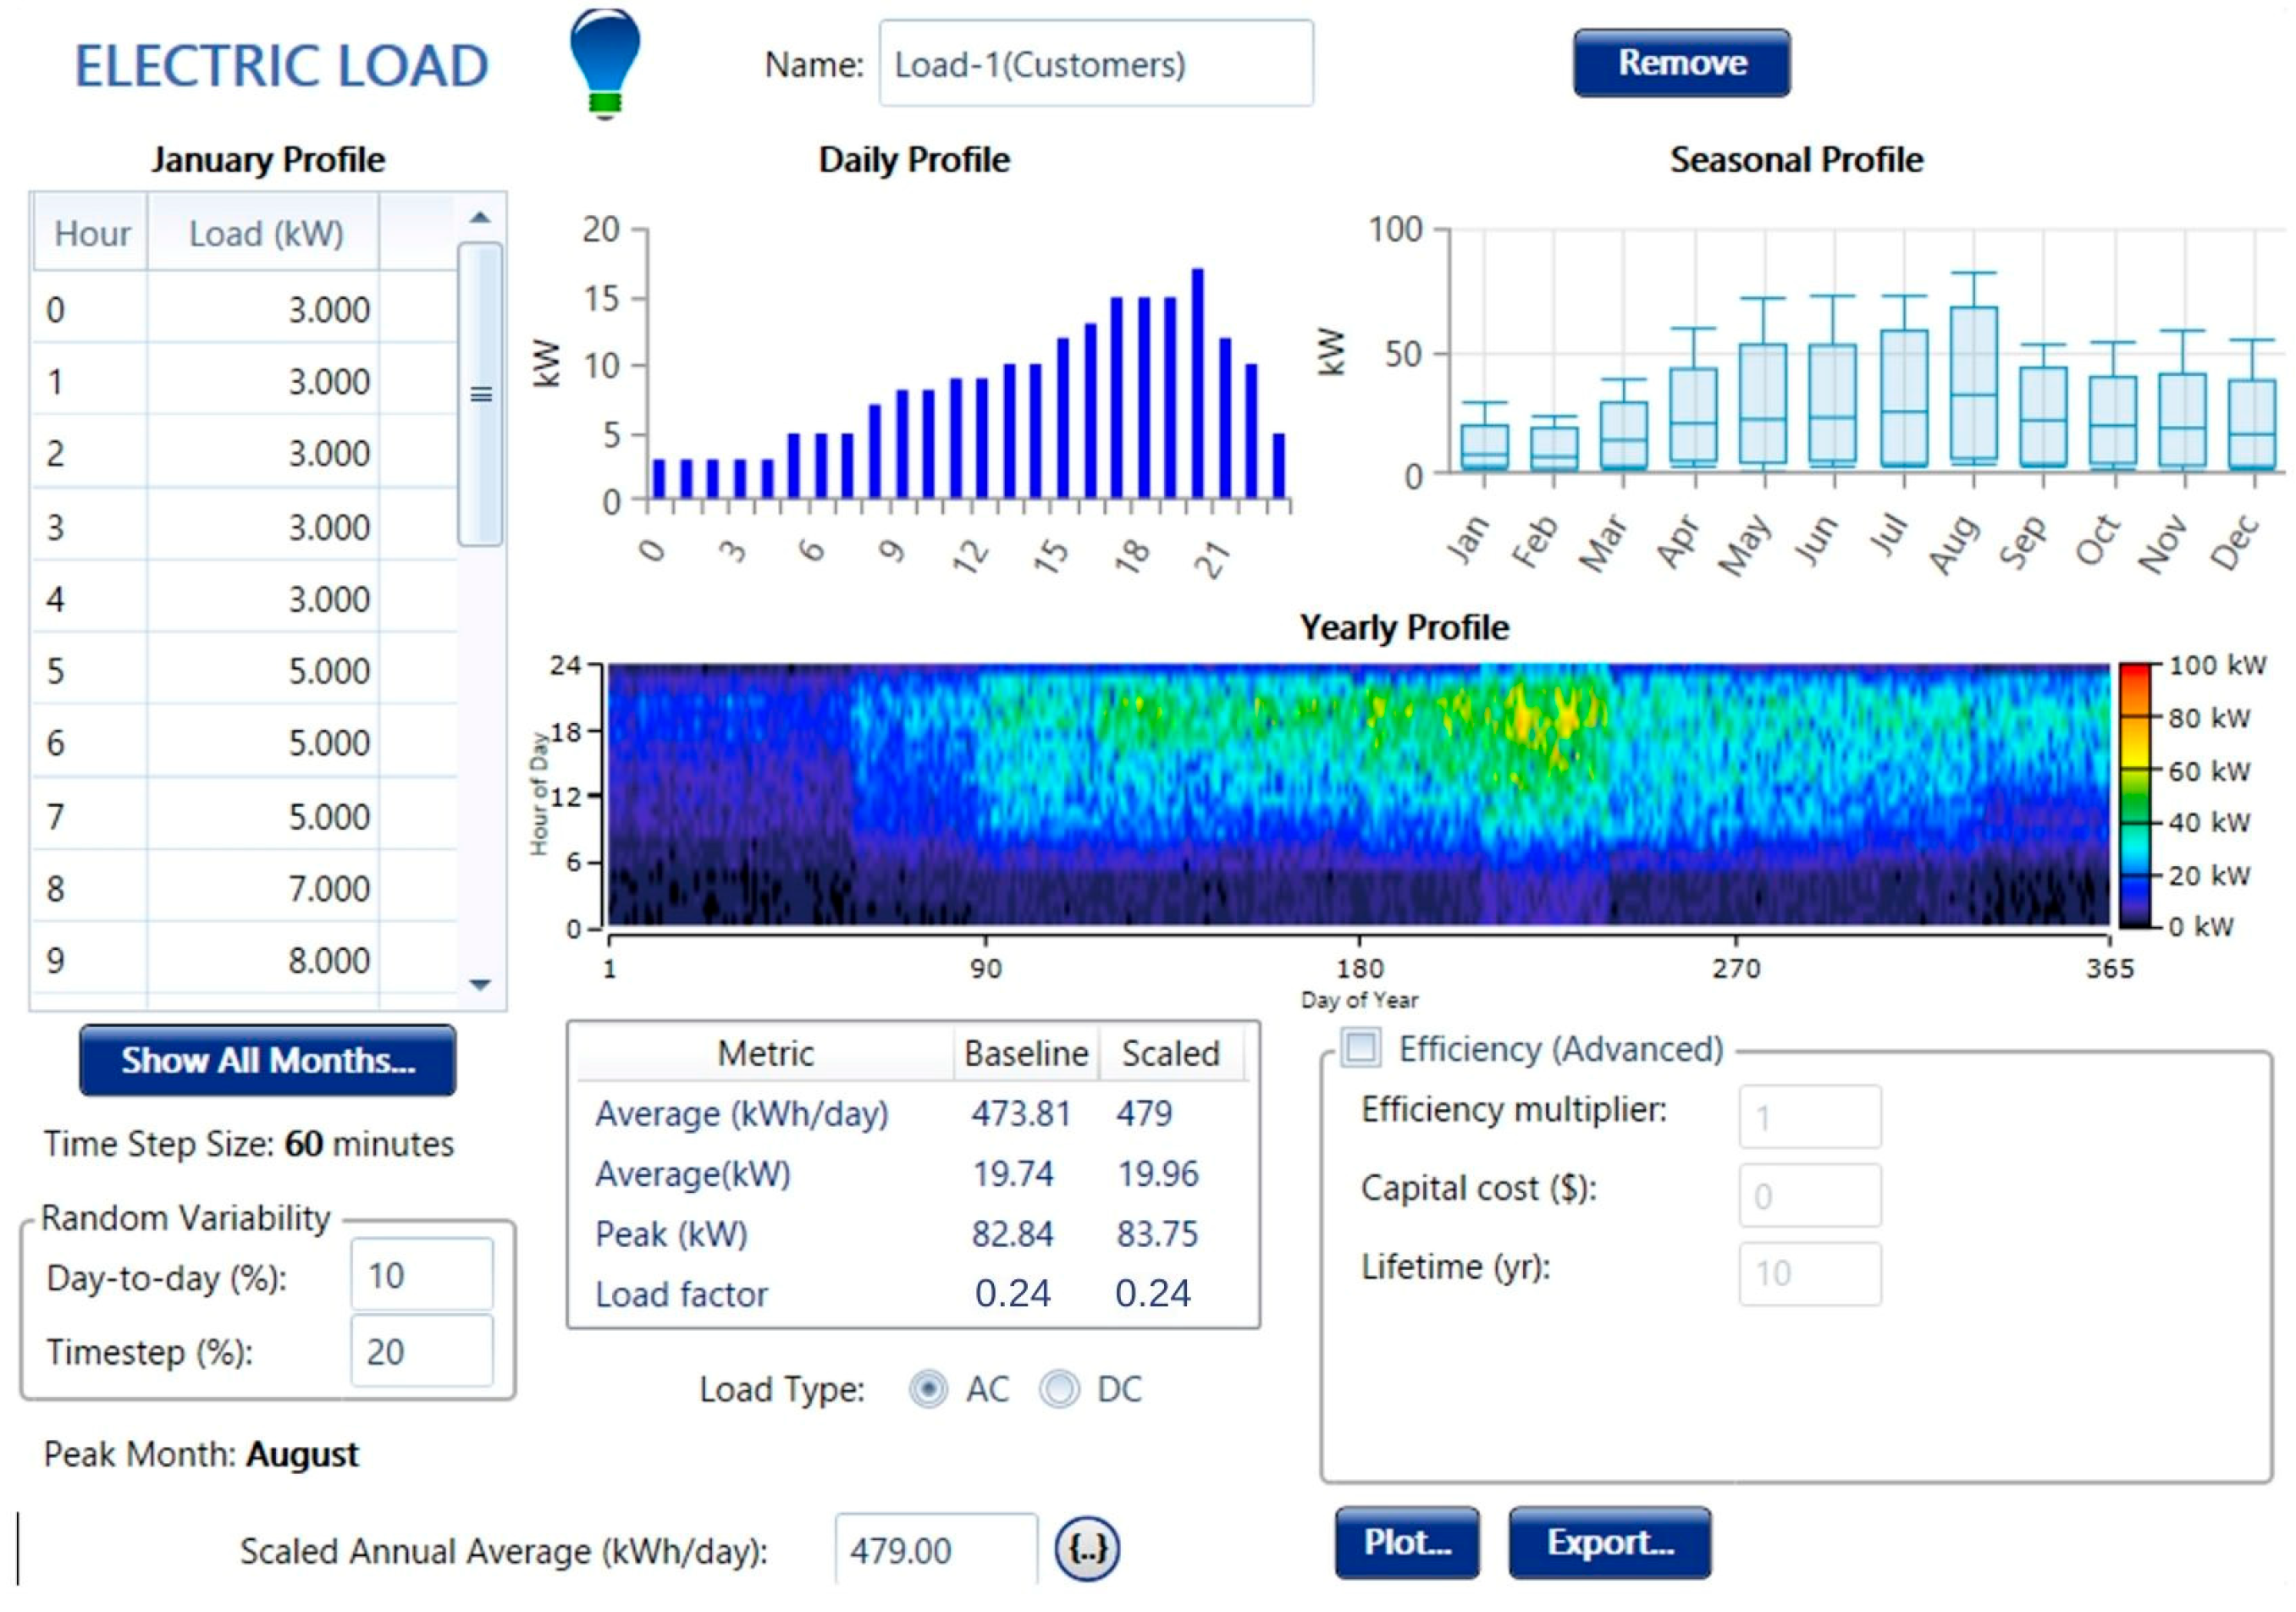
In accordance with the two separate consumption group records of the Distribution Company, the total load of the region was modeled as two different loads. The first load, identified as Load-1 in the system configuration in Figure 2, corresponds to the overall consumption in all houses in the region. The consumption for street lighting in the region is represented as Load-2. Real data obtained from the distribution company for both loads were entered into the HOMER program.
The electrical load profiles generated by HOMER for Load-1 and Load-2 based on the entered data are illustrated in Figure 3 and Figure 4, respectively. As evident from the data in Table 2, the consumption in the first load group reaches its highest values seasonally during the summer months. However, in the second load group, consumption during the summer months decreases to minimum values due to the longer daylight hours.

2.2.2. Thermal Load Data of the Region

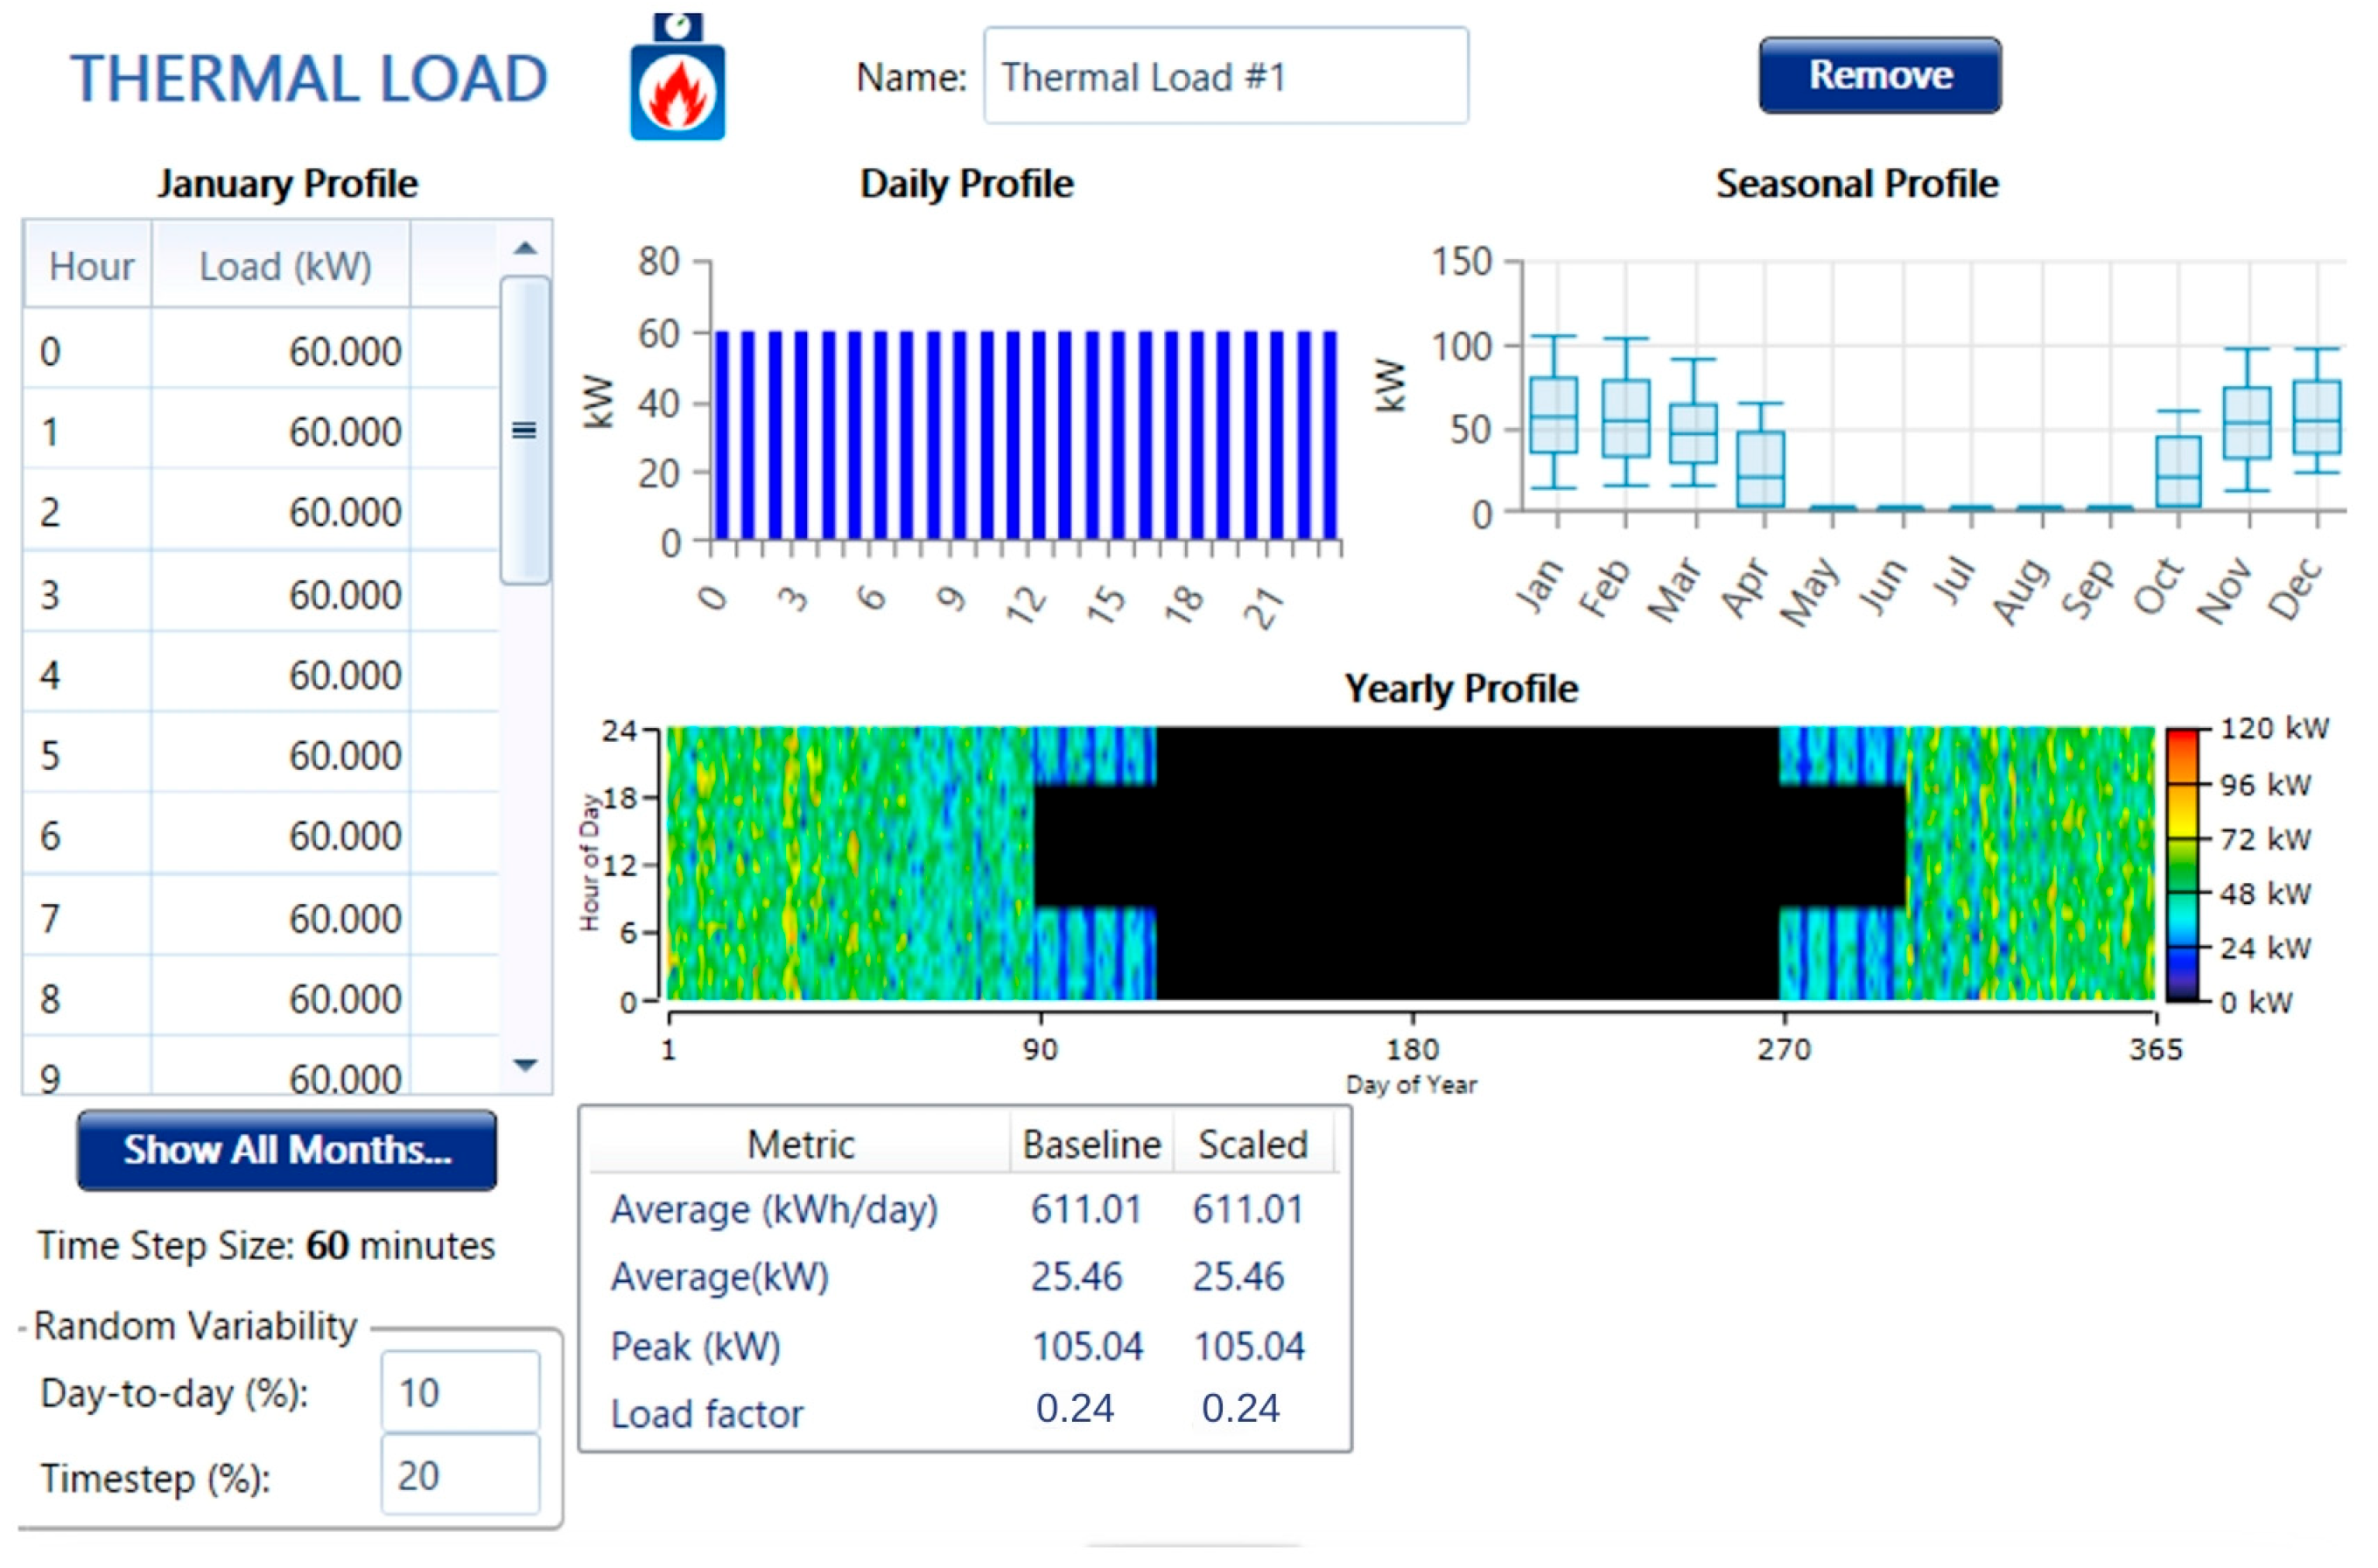
Since Bingöl Province has a severe continental climate, heating systems (radiators or stoves) are needed for approximately seven months of the year. Accordingly, the thermal load curves created for Yiğit Harman Village in the HOMER program are shown in Figure 5.
As shown in Table 2, the amount of energy used in households in August is 23,764 kWh, while this value drops to approximately a quarter of that amount, 5759 kWh, in February. This decrease indicates that the population in the village declines during the winter. In addition, due to seasonal conditions, the need for heat energy in households is considered to be zero from May to September. In April and October, it is assumed that heat energy consumption occurs only at night. Taking all these criteria into account, the thermal load profile shown in Figure 5 was created. In this load profile, 60 kWh of heat energy is consumed per hour in winter, while it decreases during seasonal transitions and becomes zero in summer.

2.2.3. Solar Radiation Data of the Region

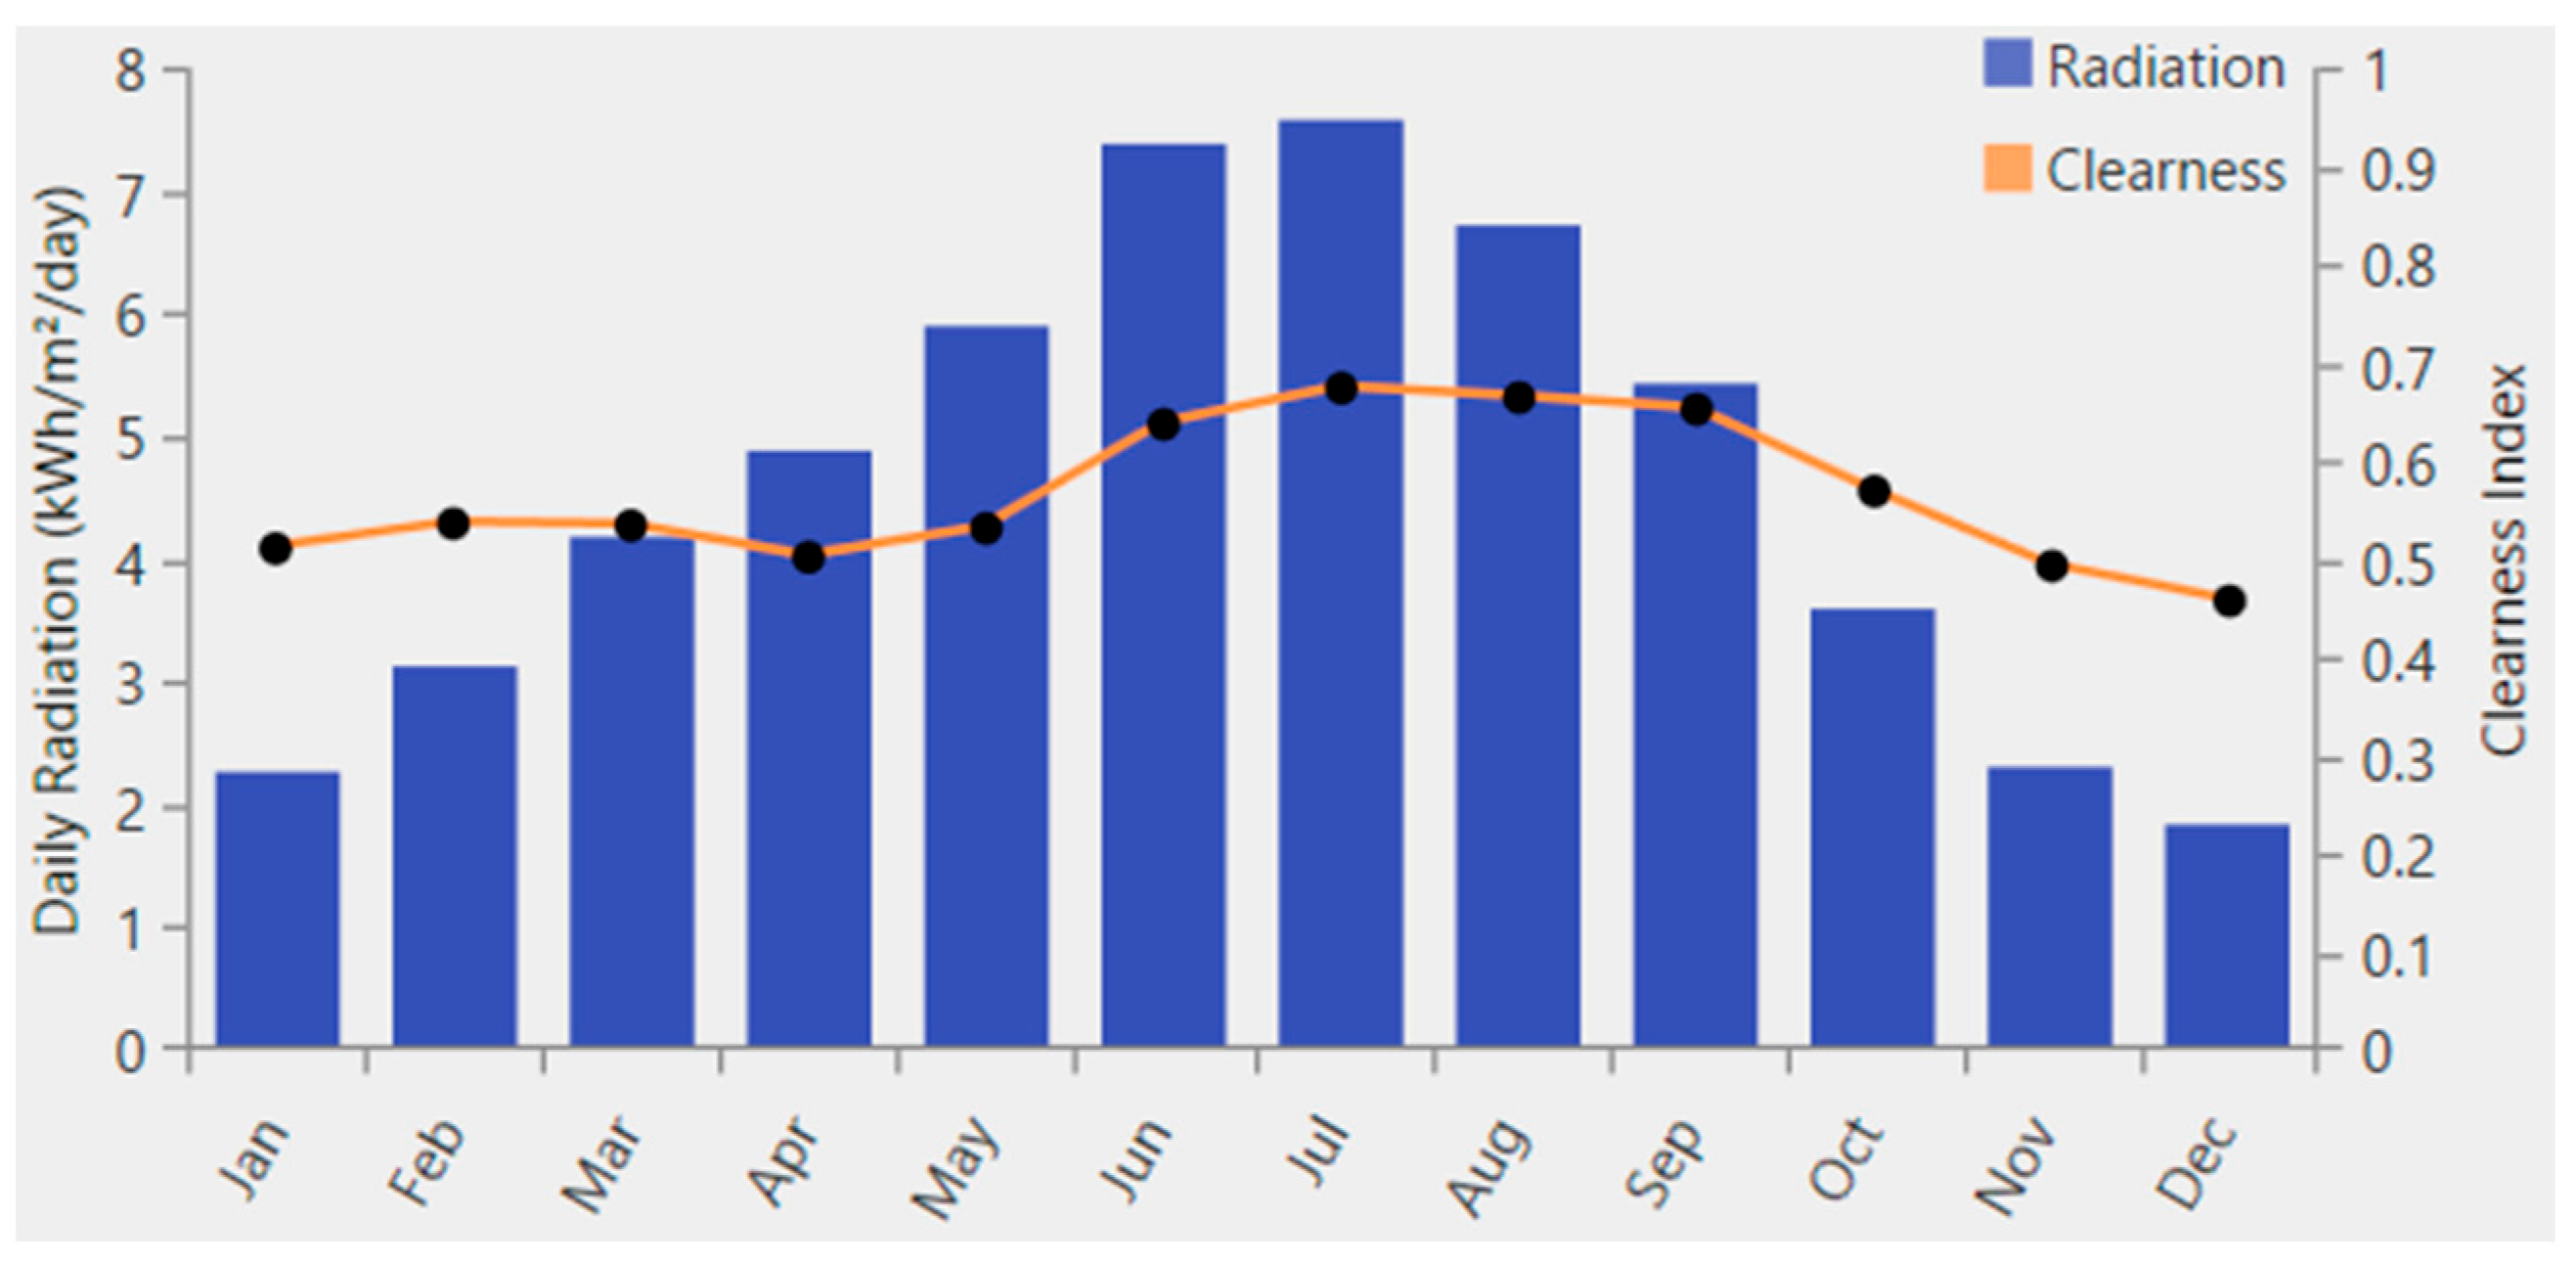
HOMER obtains meteorological data for the entered geographical location from NASA’s Surface Meteorology and Solar Energy database. To make a comparison, solar radiation data for Türkiye and Yiğit Harman Village are presented on a monthly basis in Table 3. Figure 6 displays the variation in solar radiation with the clarity index for Yiğit Harman Village, obtained by HOMER from NASA. As is evident in Table 3, the daily solar radiation value for Yiğit Harman Village is significantly higher than the Turkish average. The output power of PV panels varies in direct proportion to the amount of radiation received on the panel surface. Therefore, the radiation value of the selected region being higher than the average in Türkiye makes the region advantageous for PV systems.

2.2.4. Wind Speed Data of the Region

The monthly average wind speed data of Yiğit Harman Village, taken from the NASA database by HOMER, for 30 years (January 1984–December 2013) at an altitude of 50 m above the ground, are provided in Table 4. These data are shown graphically in Figure 7.

2.2.5. Biomass Resources of the Region

Livestock activities in Bingöl Province are predominantly focused on small ruminant farming. According to the data for the year 2021, there were 521,512 sheep, 174,619 goats, and 132,307 cattle in Bingöl Province [25,26].
Table 5 shows the daily amounts of waste that can be obtained from both small and large ruminants. As can be seen in the table, while 10–20 kg of wet waste can be obtained daily from large ruminants, this amount is approximately 2 kg/day for small ruminants.
Oak forests are common in Bingöl, which is also one of the provinces with rich forest areas. The total land area of Bingöl Province is 802,534 hectares, with nearly one-third of this area covered by forests. In the Solhan district, to which the selected region belongs, there is a total of 28,417 hectares of forested land [28].
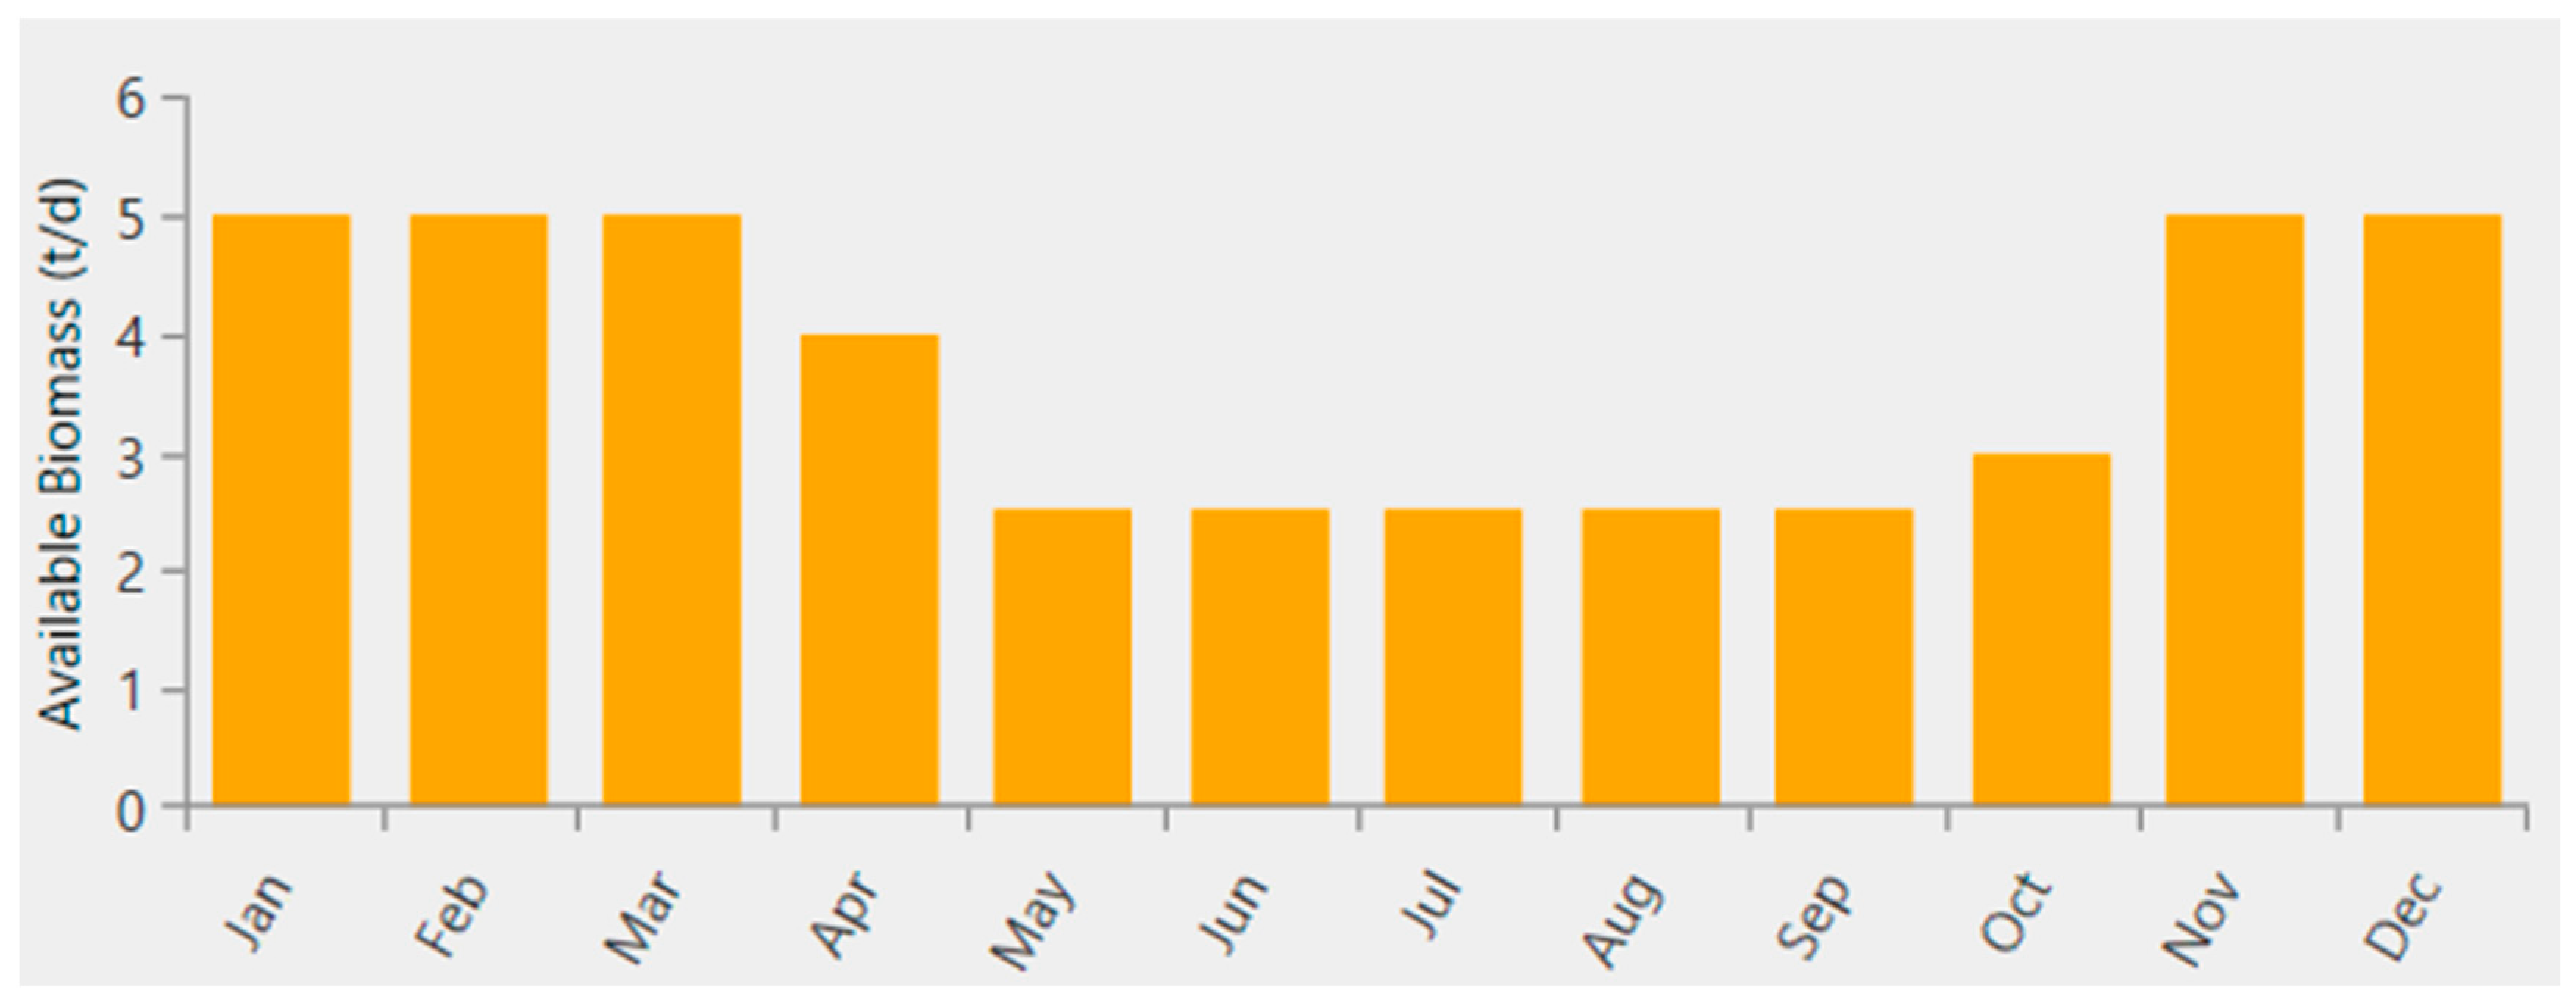
Considering all biomass sources, especially animal waste, in the region, biomass data entered into HOMER are presented in Figure 8. For Yiğit Harman Village with 111 households, the daily amount of five tons of biomass corresponds to approximately 5 cattle per household. This value is quite reasonable. Animals are generally fed in barns during the winter months and graze in meadows and pastures during the summer months. Considering this nutritional pattern, the biomass quantity entered into the system is usually recorded higher in winter months and lower in summer months.

2.3. Mathematical Models of System Components

In this section, explanations and mathematical models are presented regarding the implementation of each component of the designed hybrid microgrid in the HOMER program.

2.3.1. PV System

The HOMER software calculates the power output of the PV array according to Equation (1). Nominal capacity (ypv) includes the area and efficiency of the PV module. The attenuation factor (fpv) accounts for deviations in expected output under standard conditions by adjusting for factors such as dust on the panel and cable losses.
P P V = y p v × f p v × G T G T , S T C × 1 + α P × T C T C , S T C
Here, ypv represents the power output under test conditions (kW), fPV denotes the PV derating factor (%), GT indicates the solar irradiance on the PV array at the current time step (kW/m2), GT,STC refers to the solar irradiance under standard test conditions (1 kW/m2), αP is the temperature coefficient of power (%/°C), TC is the temperature of the PV cell at the current time step (°C), and Tc,STC is the PV cell temperature under standard test conditions (25 °C) [29].
The HOMER software dynamically calculates the PV cell temperature (TC) at each time step and utilizes it in determining the power output of the PV array. The clarity index, calculated by HOMER based on the average radiation value, month of the year, and latitude information, is a dimensionless number between 0 and 1 that indicates the ratio of solar radiation striking the upper atmosphere and reaching the Earth’s surface.
For the simulation, the Lexron LXR-410M LXR-M-72C-410W monocrystalline panel was preferred instead of the panels registered in HOMER.

2.3.2. Electrolyzer

An electrolyzer is a device that consumes electricity for the production of hydrogen through the electrolysis of water. In the HOMER software, the user determines the size of the electrolyzer, i.e., the maximum electrical input, as a decision variable. At the same time, the user specifies whether the electrolyzer consumes AC or DC power and the efficiency of this power in converting to hydrogen. HOMER Pro defines the electrolyzer efficiency by dividing the energy content of the produced hydrogen (based on higher heating value) by the consumed amount of electricity.
While 1.23 V voltage is sufficient under nominal conditions for the electrolysis of water, it is commonly applied at 2 V [30]. When electricity is applied to water, oxygen begins to accumulate at the anode, and hydrogen accumulates at the cathode. As seen in Equation (2), the volume of hydrogen will be twice the volume of oxygen. The chemical reaction taking place at the cathode is illustrated in Equation (3) [31].
2 H 2 O     2 H 2 + O 2
4 H + + 4 e   2 H 2

2.3.3. Hydrogen Storage Tank (HST)

A hydrogen storage tank (HST) is utilized to store the hydrogen generated by the electrolyzer. In the system modeled with HOMER software, the size of the tank is expressed as the mass of hydrogen it can store in kilograms.
Approximately 3.9–4.5 kWh of energy is consumed to produce one cubic meter of hydrogen [30]. Due to the power of the electrolysis we chose in the system being 50 kW, it will be able to produce approximately 11.5 cubic meters of hydrogen per hour. Considering that 1 kg of hydrogen is equivalent to 11.737 cubic meters, it is expected that the system will produce about one kilogram of hydrogen per hour. Taking all these values into account, the size of the HST for the designed system is determined to be 50 kg. Selecting an HST larger than necessary will increase the cost.

2.3.4. Fuel Cell (FC)

The FC takes hydrogen as fuel and directly converts it into electricity. During this transformation, water and heat also appear. Hydrogen is supplied to the anode pole, while either pure oxygen or air is supplied to the cathode pole. In the anode region, with the assistance of a catalyst, hydrogen molecules are split into protons and electrons (Equation (4)). The protons pass through a membrane, while the electrons travel through an external circuit, generating electricity. In the cathode region, the protons combine with oxygen, resulting in the release of water. At the cathode electrode, oxygen reacts with electrons and ions, producing water, as illustrated in Equations (5) and (6) [31].
2 H 2   4 H 2 + 4 e
O 2 + 4 e + 4 H +   2 H 2 O
O 2 + 2 H 2   2 H 2 O + heat + electricity
They are known for their cleanliness and high efficiency. For this study, a proton exchange membrane FC (PEMFC) was selected due to its reliable performance and its ability to perform well even under unstable hydrogen supply conditions. In HOMER, the user defines the size of the FC, i.e., the maximum electricity production, as a decision variable.

2.3.5. Batteries (BSSs)

In the designed hybrid system, when the generated energy exceeds the load demand, excess energy is stored in BSSs. When the demanded amount surpasses the generated amount, the stored energy in the BSSs is utilized. HOMER uses the Kinetic Battery Model to calculate the energy absorption or discharge capability of the storage bank at each time step. In the two-tank storage model, the first tank contains the available energy ready for conversion to DC electricity, and the second tank contains the energy that is chemically bound and therefore cannot be withdrawn immediately. HOMER utilizes Equations (7) and (8) to determine the charge or discharge power. Subsequently, it employs Equations (9) and (10) to calculate the available and bound energy at the end of the charging period [29].
P ch = k · Q 1 · e k · t + Q · k · c · ( 1 e k · t ) 1 e k · t + c · ( k · t 1 + e k · t )
P disch = k · c · Q max + k · Q 1 · e k · t + Q · k · c · ( 1 e k · t ) 1 e k · t + c · ( k · t 1 + e k · t )
Q 1 , end =   Q 1 · e k · t + ( Q · k · c P ) · ( 1 e k · t ) k + P · c · ( k · t 1 + e k · t ) k
Q 2 , end =   Q 2 · e k · t + Q ( 1 c ) ( 1 e k · t ) + P · ( 1 c ) · ( k · t 1 + e k · t ) k
In this context, Qmax represents the total storage capacity, Q1 denotes the amount of energy available in the batteries (kWh), Q indicates the total amount of energy (kWh), c is the storage capacity ratio, k is the storage rate constant, and ∆t refers to the time interval (h).

2.3.6. Converter

Converters are used both to convert the DC power generated by the solar power plant to AC power and to convert the AC power generated by the wind power plant to DC power to charge the BSS.

2.3.7. Wind Turbine (WT)

HOMER calculates the power output of the WT at each time step. This process first involves calculating the wind speed at the hub height of the WT. Subsequently, it calculates the power that the WT would generate at this speed, considering the standard air density, and finally adjusts this power output value based on the actual air density.
HOMER calculates the wind speed at the hub height of the WT at each time step. For this calculation, it uses two different equations depending on the user’s choice (Equations (11) and (12)).
U hub =   U anem Z hub Z anem α
U hub = U anem ln ( Z hub Z 0 ) ln ( Z anem Z 0 )
Here, Uhub represents the wind speed at the wind turbine’s hub height (m/s), Uanem represents the wind speed at the anemometer height (m/s), zhub denotes the hub height of the wind turbine (m), zanem represents the anemometer height (m), Z0 denotes the surface roughness length (m), and α represents the power law exponent.
After calculating the wind speed at hub height, HOMER moves to the second stage and refers to the power curve of the WT to determine the power value that would be generated at the calculated speed. The power curve for the Eocycle EO10 model WT selected in HOMER for this study is shown in Figure 9. The power value identified on this curve represents the value achievable under standard temperature and pressure conditions.
As mentioned above, power curves indicate the turbine performance under standard temperature and pressure conditions. To obtain the value in real conditions, HOMER multiplies the power value obtained from the power curve by the air density ratio using Equation (13).
P WTG   = ρ ρ 0 · P WTG , STP
Here, PWTG represents the WT power output (kW), PWTG,STP represents the WT power output under standard temperature and pressure (kW), ρ0 denotes air density at standard temperature and pressure (1.225 kg/m3), and a ρ represents actual air density (kg/m3).

2.3.8. Biogas Generator (BG) System

The biogas generator (BG) utilizes biogas to generate electricity, and the biogas is produced by the gasification of biomass materials fed into the gasifier. During this process, the power output of the BG can be determined through Equation (14) [32,33].
P BG   = B · Q LHV · η · η biogas 3600
where B represents the consumed biomass materials in kg, QLHV denotes the low heating value of biogas in kilojoules per cubic meter, η represents the efficiency of the BG, and ηbiogas indicates the gasification efficiency of the gasifier. The parameters η and ηbiogas are determined by the models of the BG and the gasifier, respectively.
Unit cost values of the system components are provided in Table 6.

3. Results and Discussion

3.1. Optimization Results

In this study, a microgrid system was designed to meet the thermal and electrical energy needs of Yiğit Harman Village in Bingöl Province using its existing resources with HOMER Pro software. The chosen components for the microgrid design, considering the available resources in the region, include PV panels, BGs, WTs, FCs, electrolyzers, HSTs, BSSs, converters, and a boiler. The HOMER software carries out multiple optimizations with different combinations of components for the designed microgrid and ranks them economically in an increasing manner. Some of the optimization results obtained for this study are shown in Figure 10.
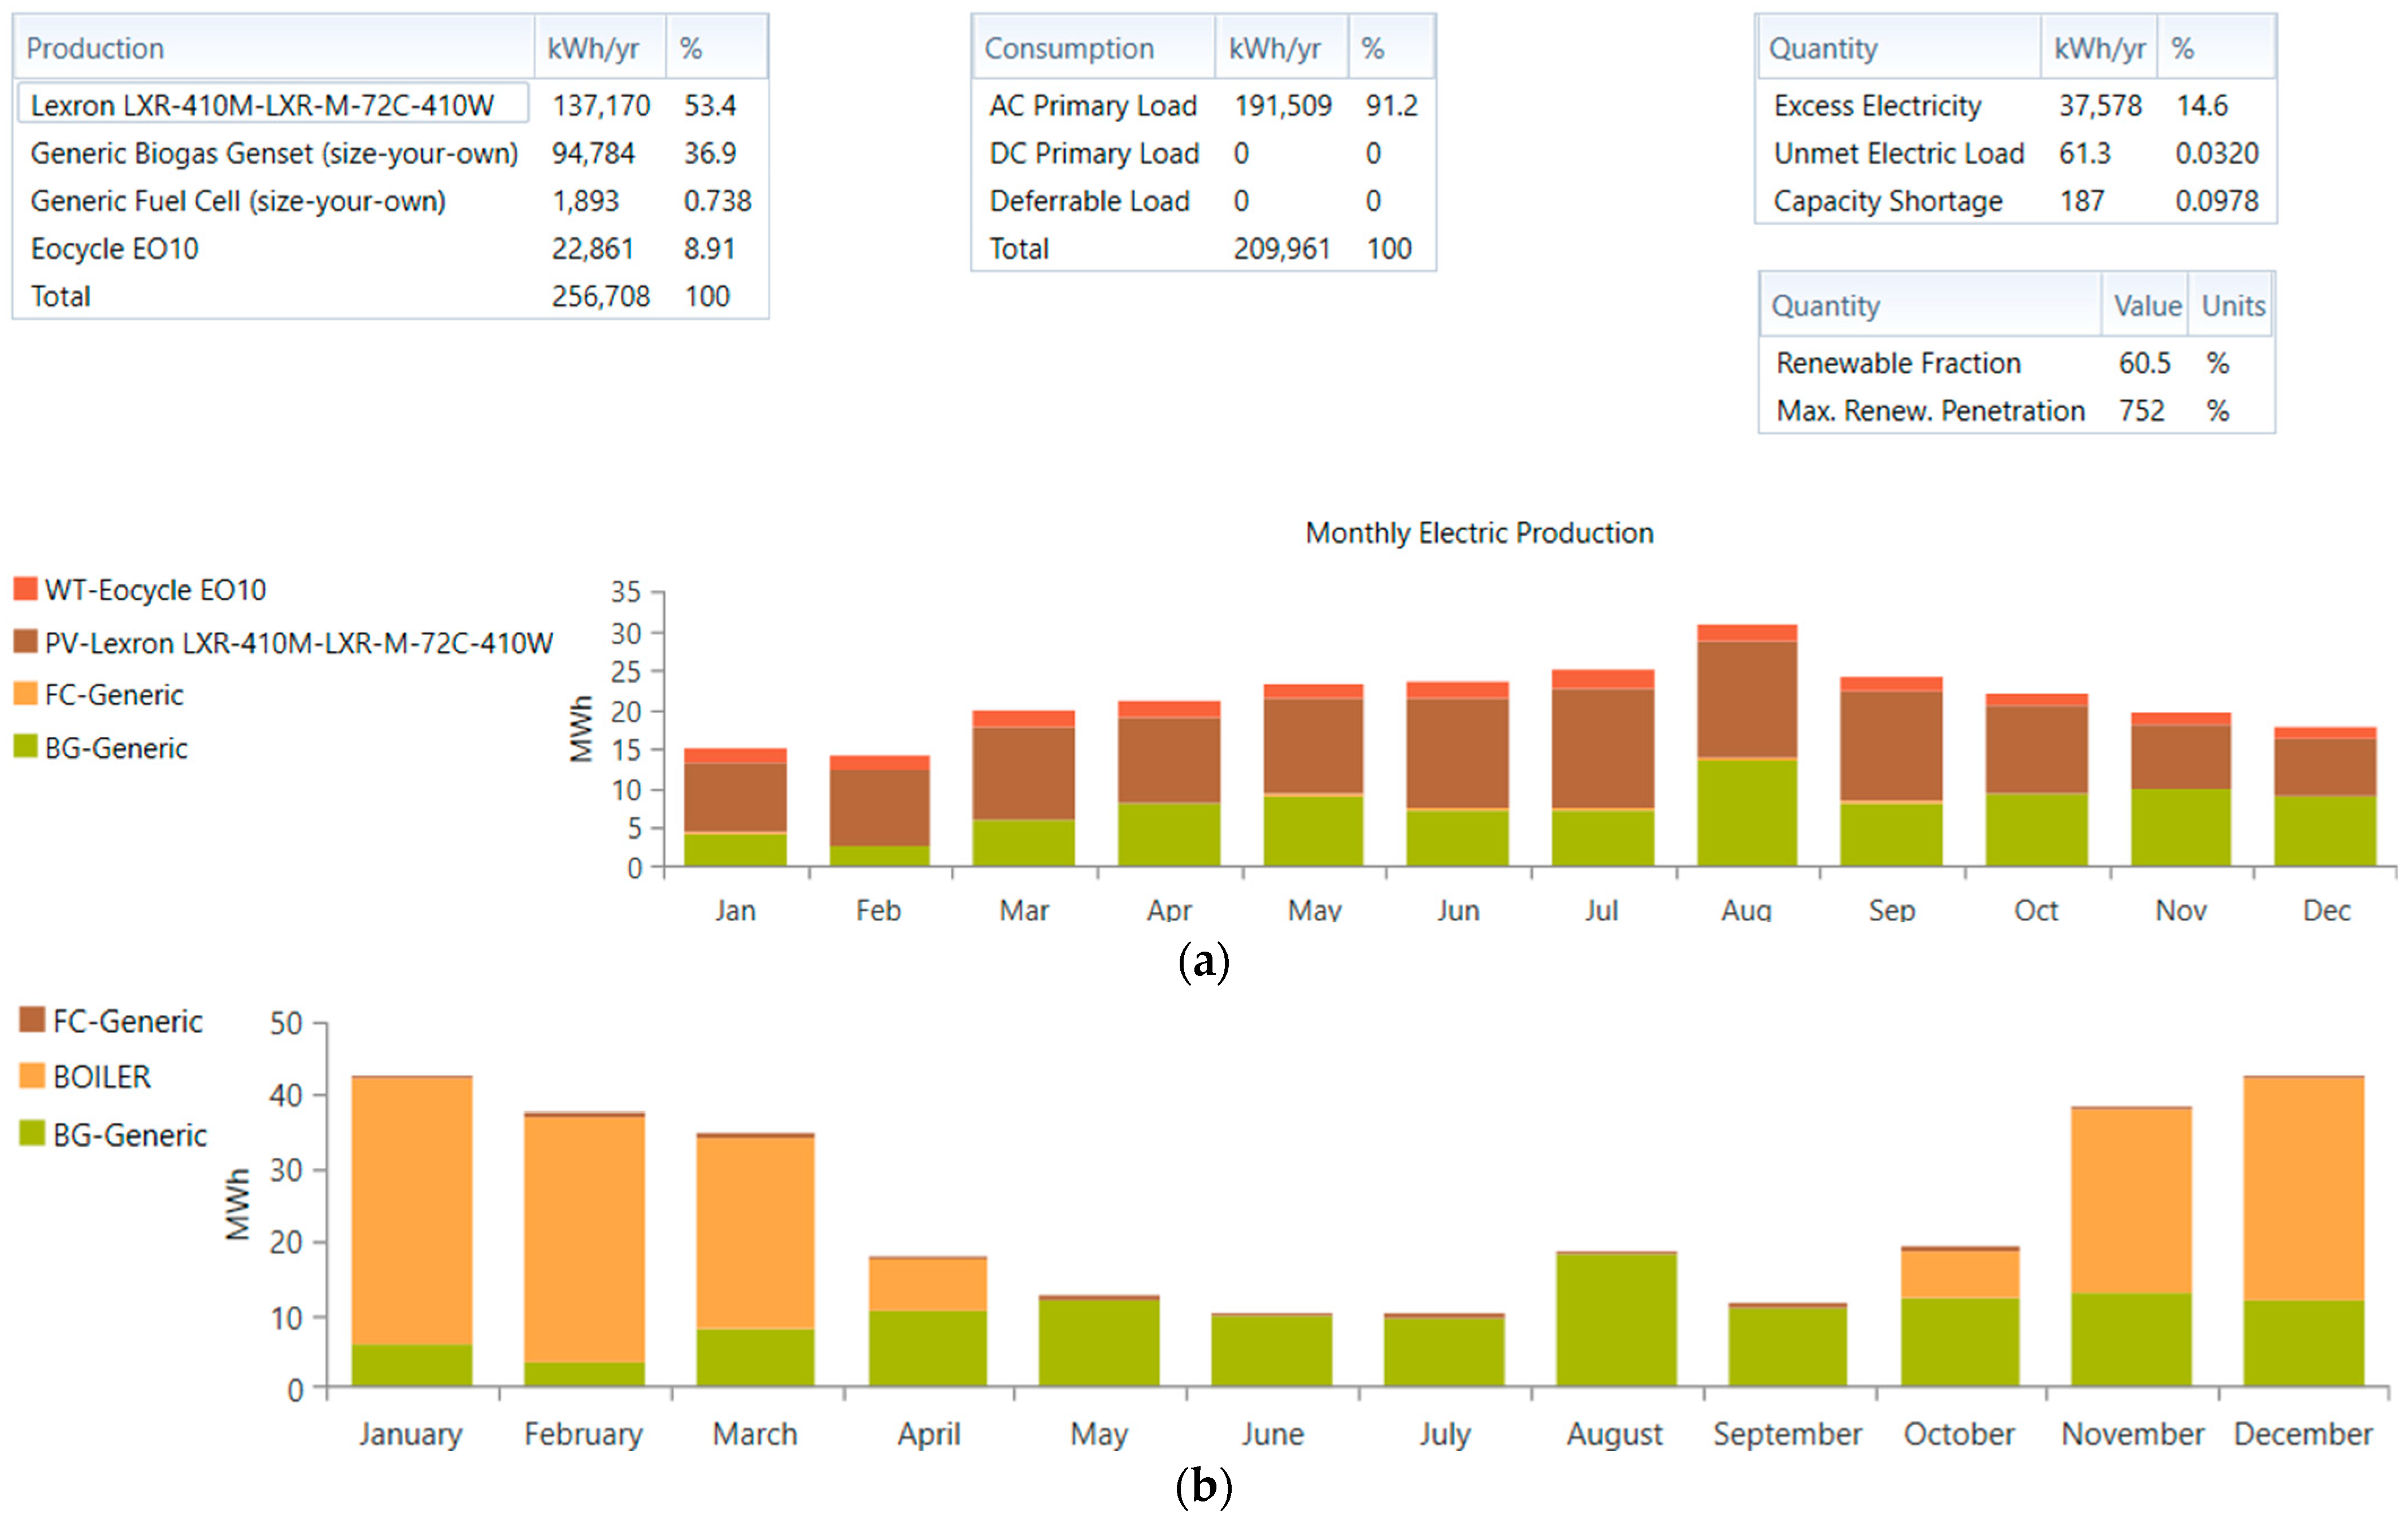
The production amounts and rates of resources for the model that includes all components are presented in Table 7, and the NPC analysis of the system is presented in Table 8. The production graph according to resources can be seen in Figure 11.
According to the values provided in Table 7, 53.4% of the electrical energy was generated from PV panels, 36.9% from the BG, and 8.91% from WTs. The amount generated by the FC was the lowest rate at 0.738%. While 55.2% of thermal energy was obtained from the boiler, the generation shares of BG and FC were 42.5% and 2.29%, respectively. As seen in Figure 11a, the amount of unmet electricity demand throughout the year was only 61.3 kWh. This indicates that the system consistently produced enough to meet the load at all times. It is understood that during periods when unpredictable and intermittent sources like wind and solar are not generating, the energy shortfall is compensated by FC and BG.
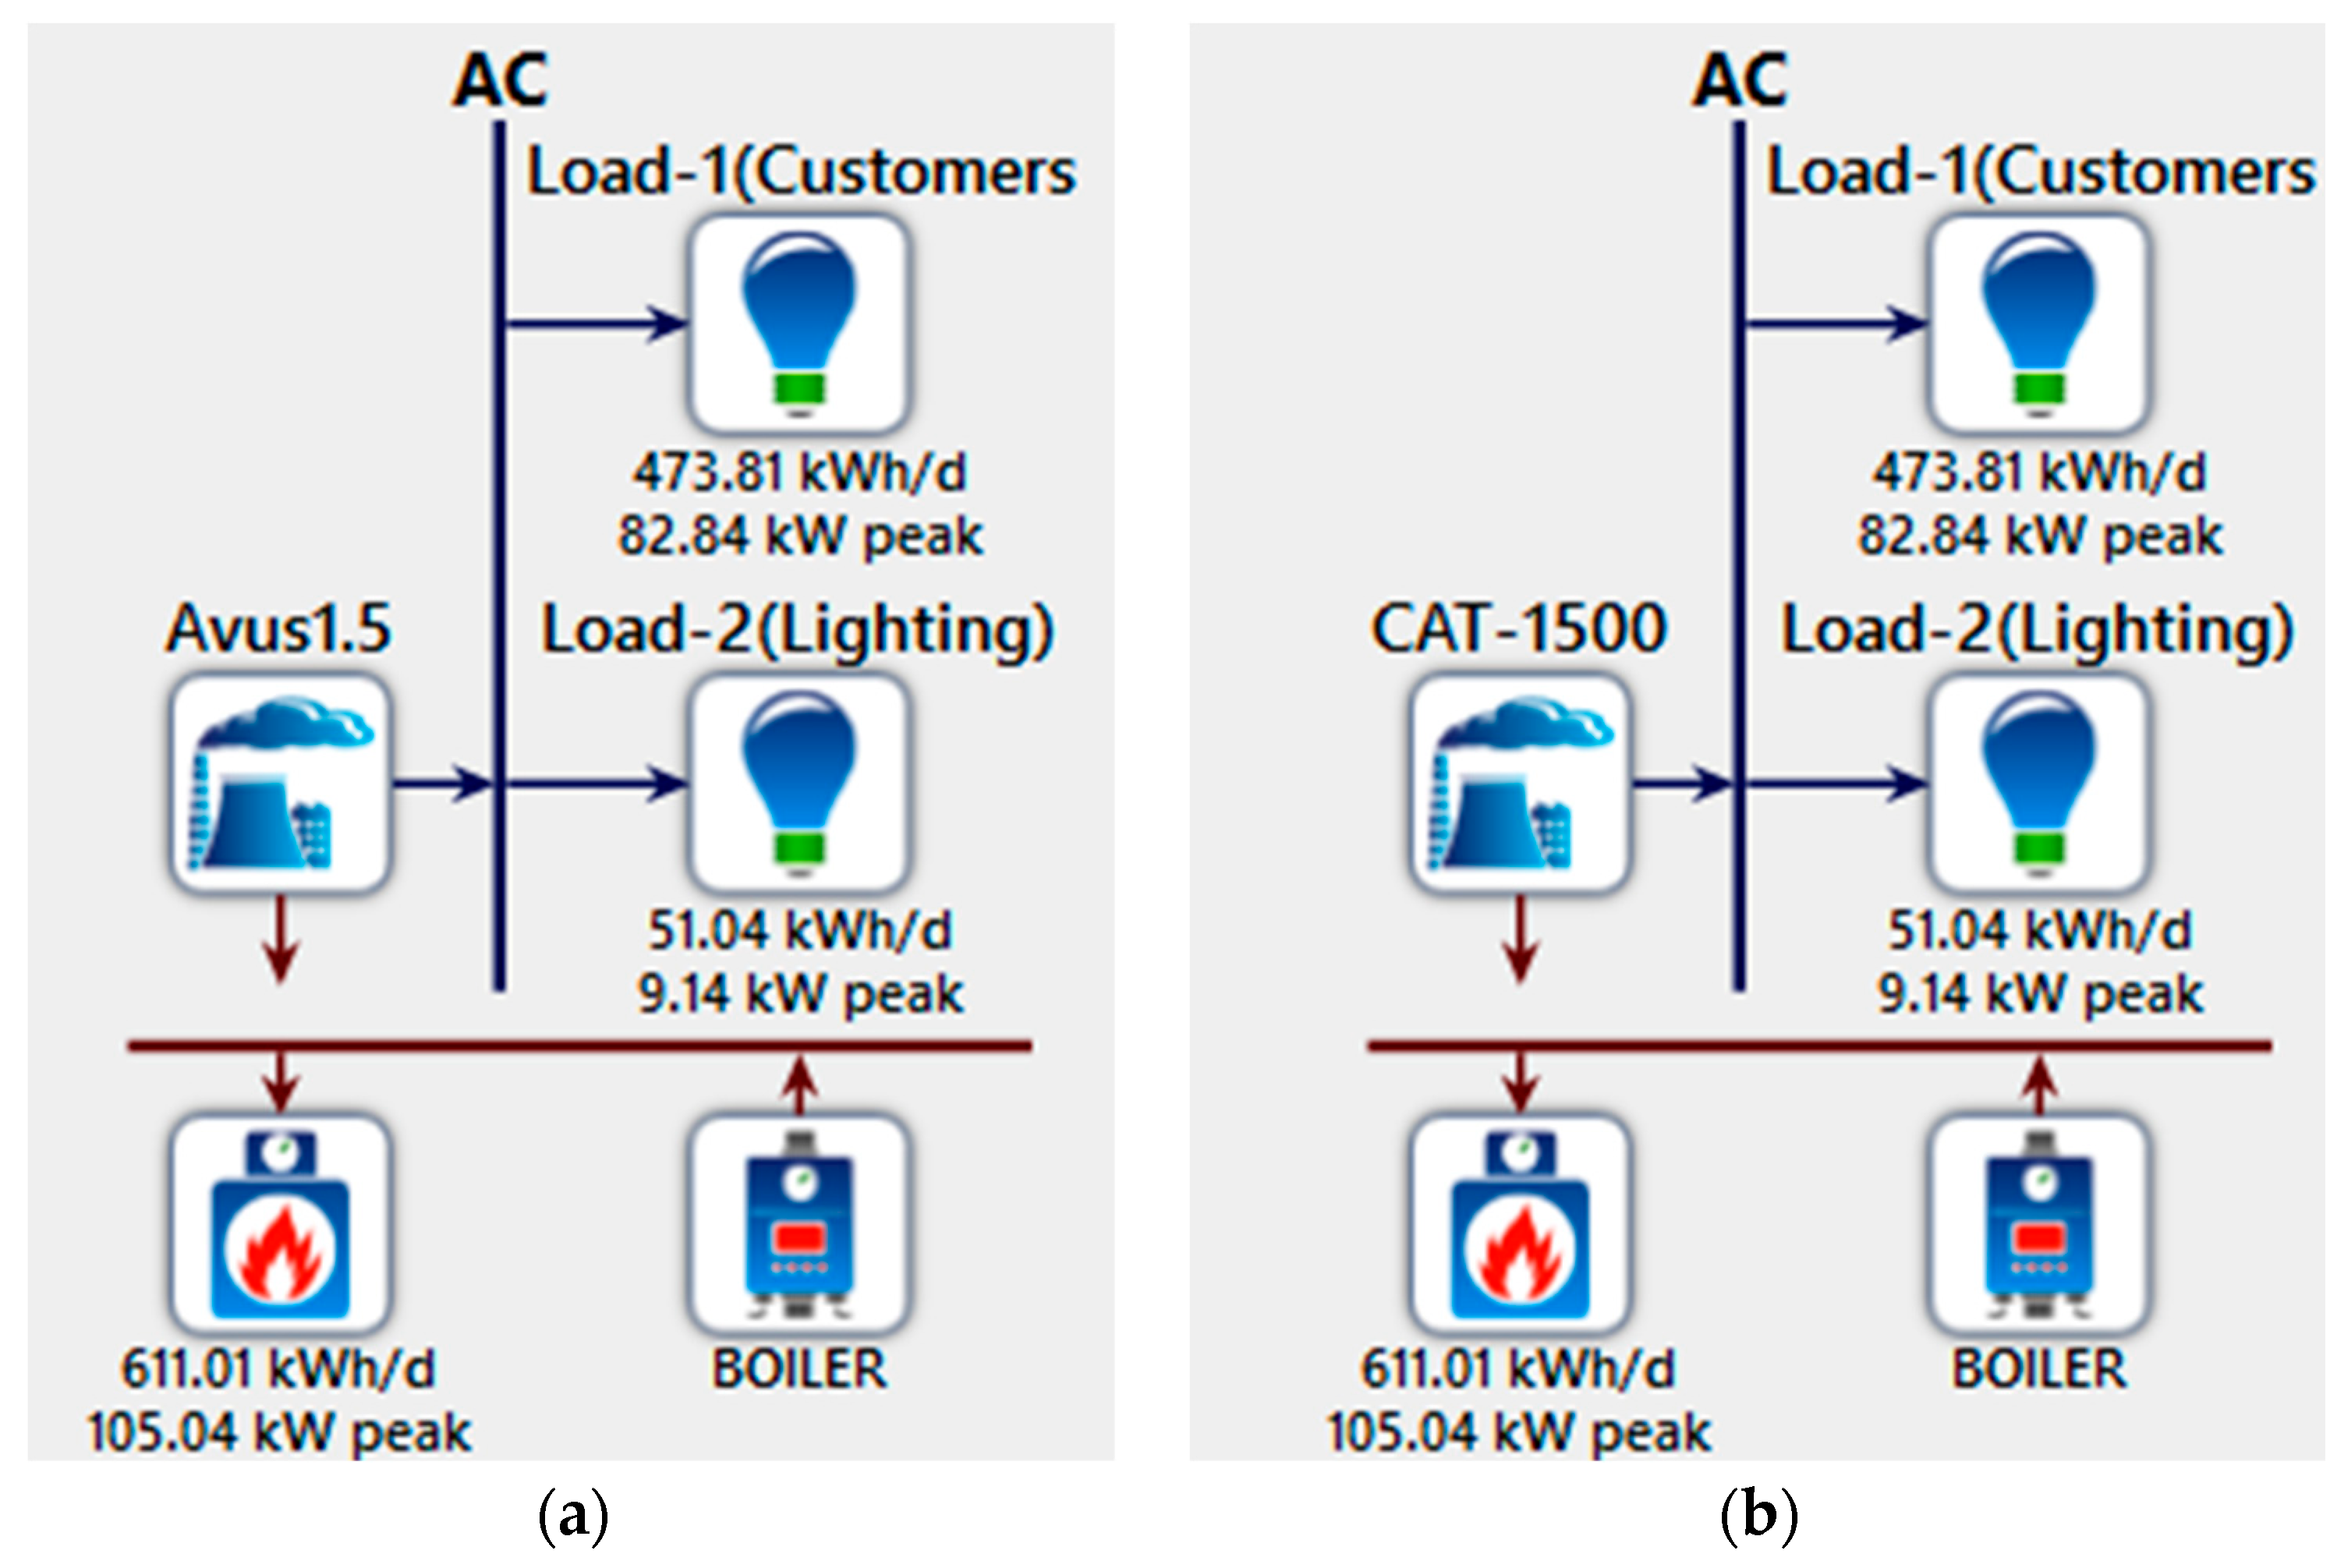
To analyze the environmental effects of the system, it is necessary to examine emission values. To see the environmental superiority of the designed system, two separate simulations, as shown in Figure 12, were made. In these simulations, the same loads were powered solely by natural gas and diesel generators, respectively, and the resulting emission values were obtained. The emission values for all models are presented in Table 9.
If the natural gas generator feeds the existing loads, the amount of CO2 emitted in a year would be 61 times higher compared to the proposed model. This value increases to 117 times for the diesel generator. These results indicate that the proposed system for energy production would be an excellent solution from an environmental perspective.

3.2. Effects of PV Panels on the System

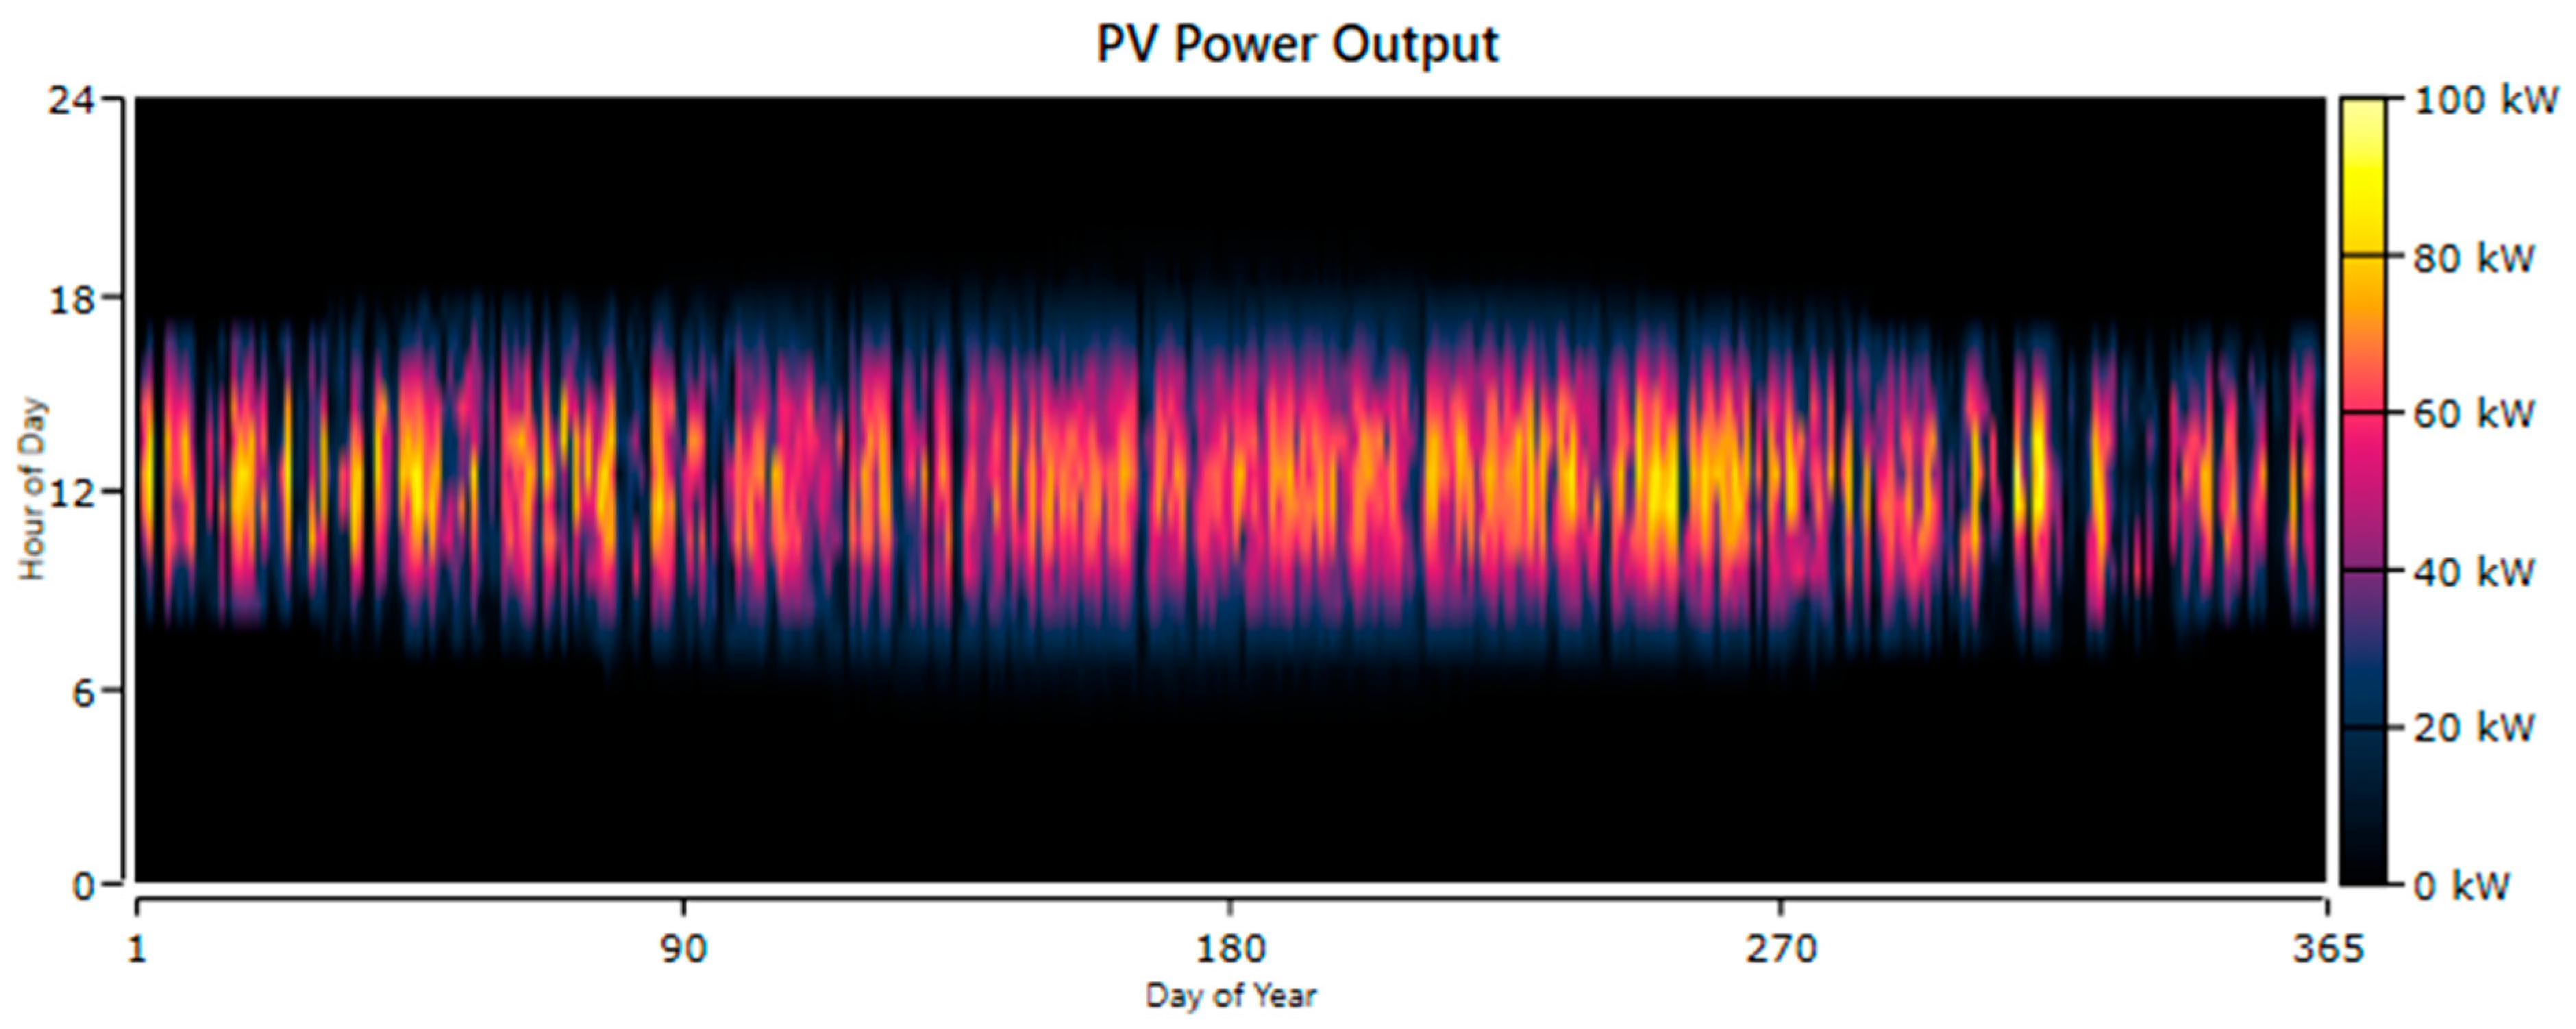
PV panels have shown consistent performance in both the model including all components calculated by HOMER Pro software and the most economical model. The annual variation in the output power of the panels is shown in Figure 13. As can be seen in the figure, the panels generated power between approximately 6 am and 6 pm. Due to the variability of many parameters, especially the amount of radiation, a constant generation was not achieved every day. According to the simulation results, the annual operating time of the panels was 4387 h, and they produced a total of 137,170 kWh of electrical energy during this period. All parameters related to the panels are presented in Table 10.

3.3. Effects of Wind Turbines on the System

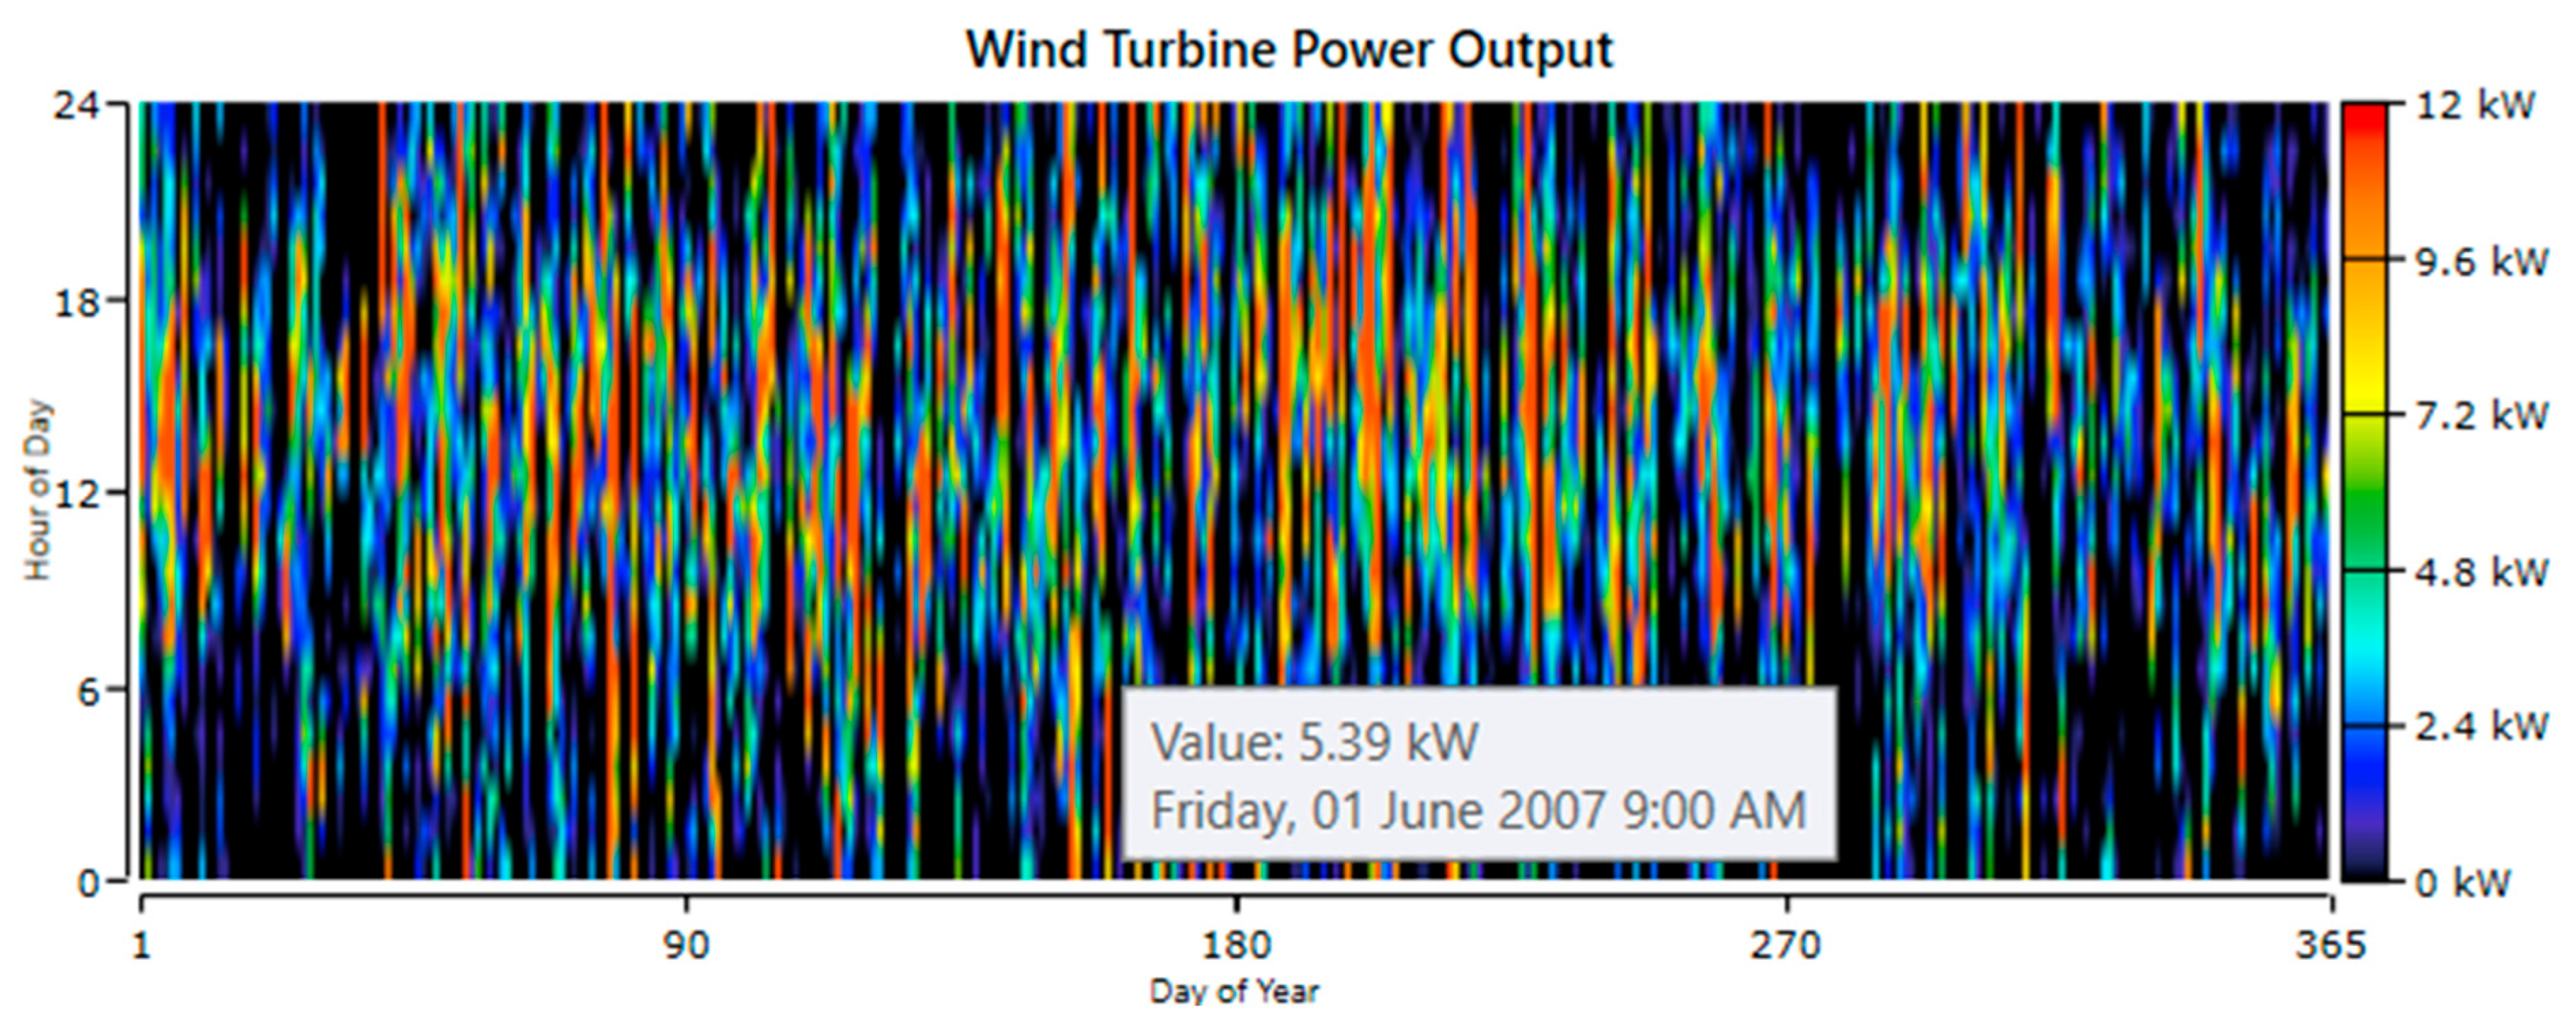
In the simulation of the model, one wind turbine operated for 5283 h over the year, generating 22,861 kWh of energy. The output power variations of wind turbines are shown in Figure 14. Additionally, the turbine parameters obtained are provided in Table 11.

3.4. Effects of Biogas Generator on the System

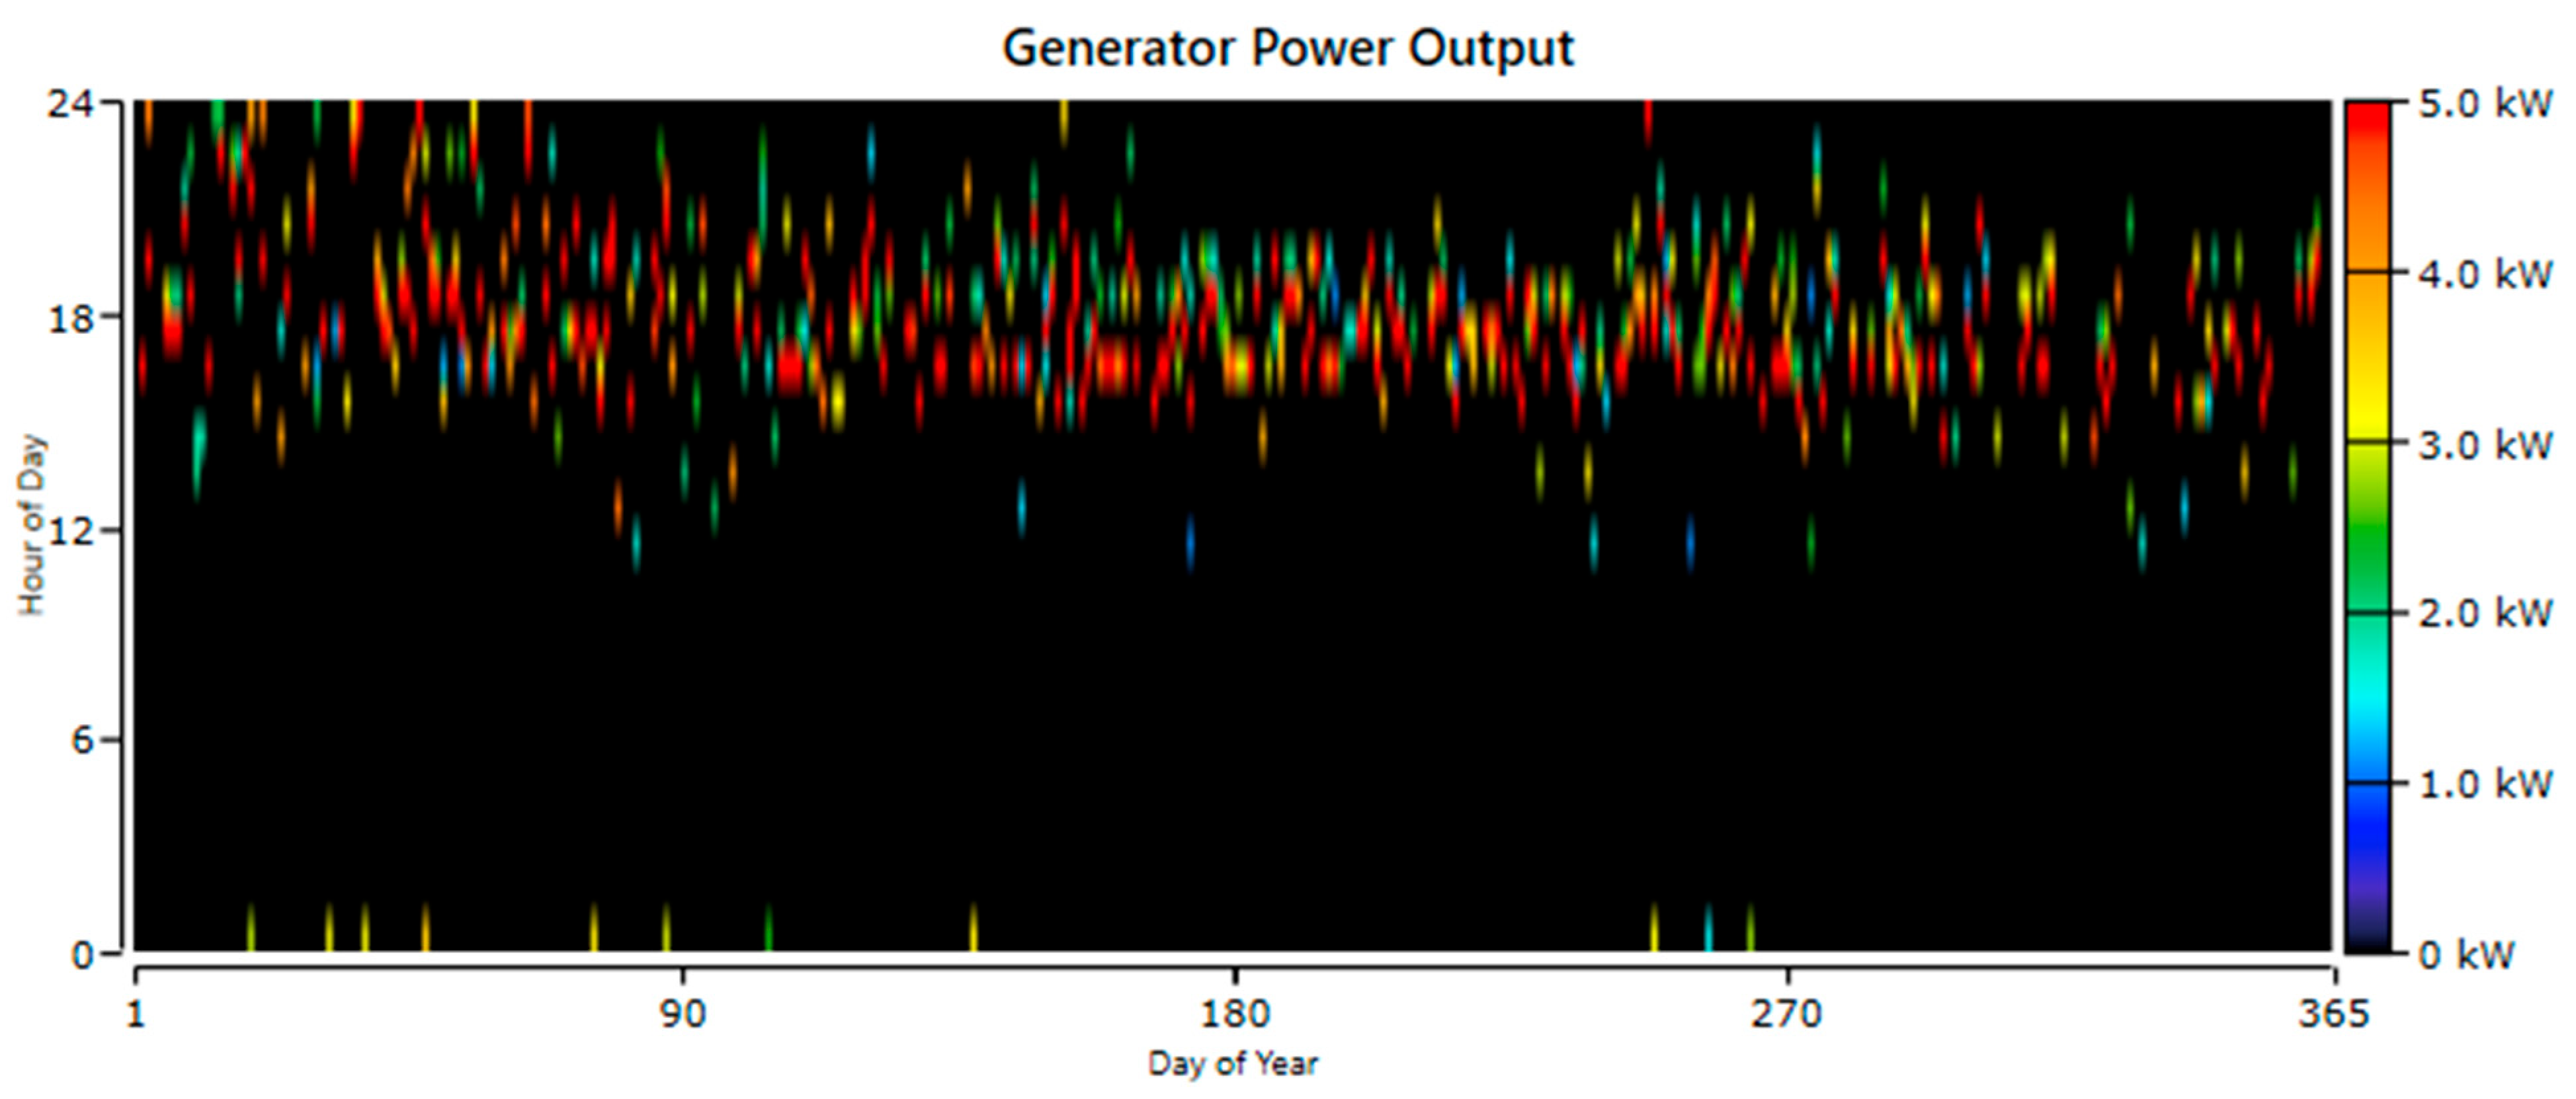
The biogas generator operated for 3466 h in a year, generating 94,784 (36.9%) kWh electrical energy and 126,431 (42.5%) kWh thermal energy. To reduce the system’s COE value, the generation capacity of the biogas generator was increased by limiting the number of wind turbines in the model to one. This choice also contributes to the increased disposal of animal waste. The power variation of the biogas generator in both models is shown in Figure 15, while the parameter values are presented in Table 12. As can be seen in the figure, the generator operated more frequently during evening and nighttime hours. In other words, biogas generators come into operation during periods when PV panels are not producing, thereby meeting the energy demands of the loads. Biogas generators play a crucial role in ensuring uninterrupted energy supply.

3.5. Effects of the Fuel Cell on the System

The values of the fuel cell obtained as a result of the simulation are presented in Table 13. As indicated in the table, the fuel cell operated 400 times over the year and generated 1893 kWh (0.738%) of electrical energy and 6817 kWh (2.29%) thermal energy in 508 h.
Figure 16 illustrates the variation in the output power of the fuel cell. Like the biogas generator, the fuel cell primarily operates during hours when PV panels are inactive, contributing to energy production during those periods.

3.6. Effects of Electrolyzer on the System

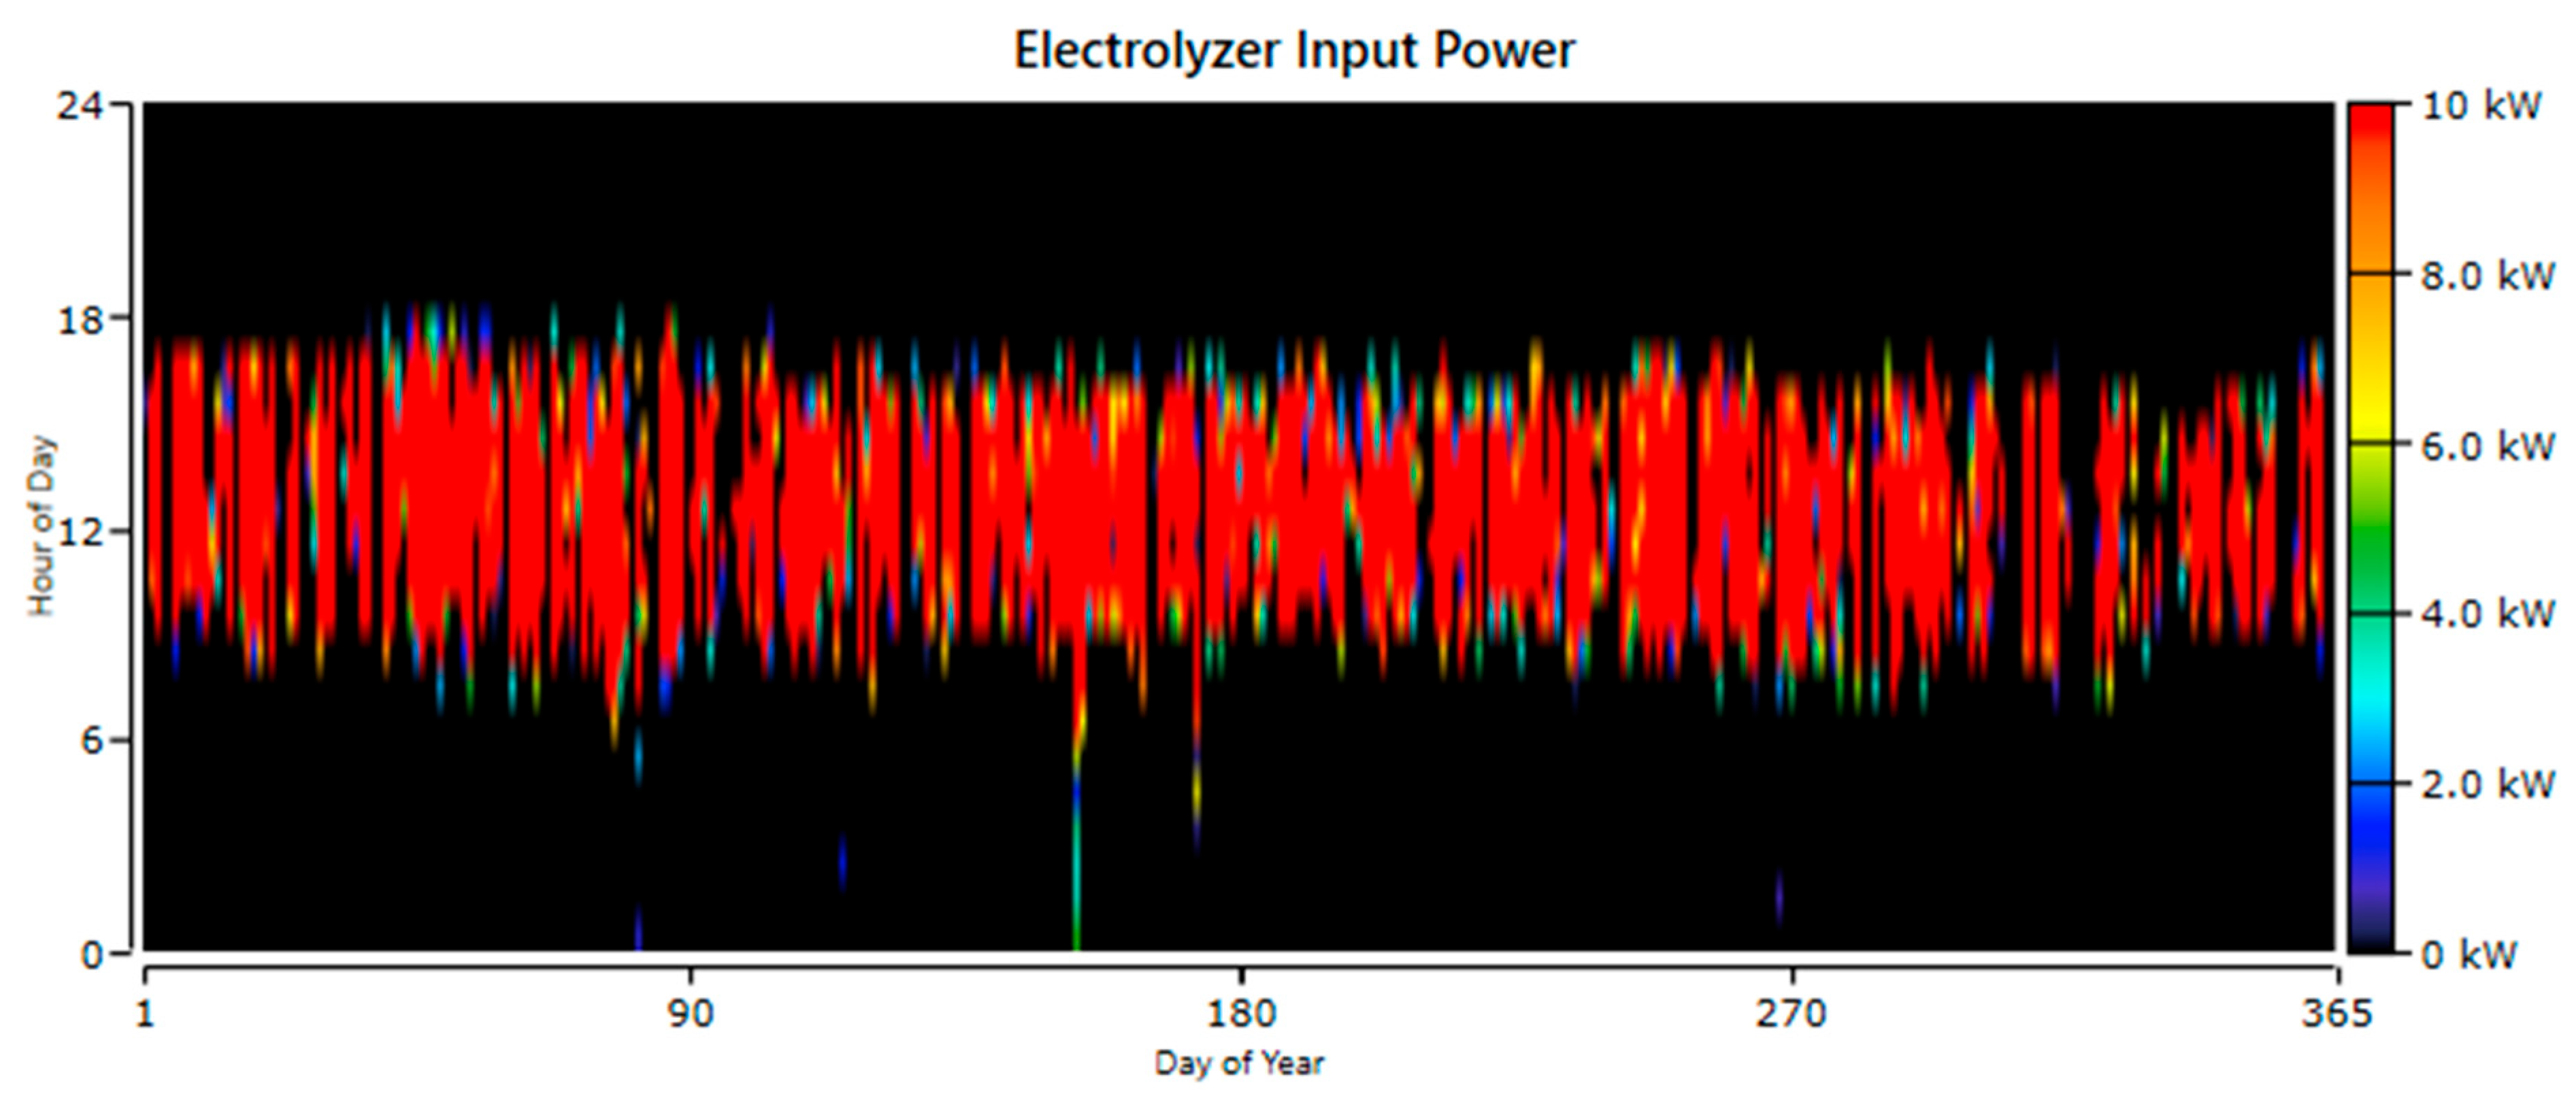
In addition to the operational performance of the fuel cell, the performance of the electrolyzer used for hydrogen production is also crucial. The simulation results obtained for the electrolyzer parameters are presented in Table 14. As evident from these data, the electrolyzer produced 398 kg of hydrogen by operating for 4566 h in a year. It consumed 18,452 kWh of energy for this production. The monthly energy consumption of the electrolyzer is presented in Figure 17. As depicted in the figure, the electrolyzer produced hydrogen at the same time that PV panels were generating electricity. In other words, the energy required by the electrolyzer was met by the PV panels.

3.7. Effects of BSSs on the System

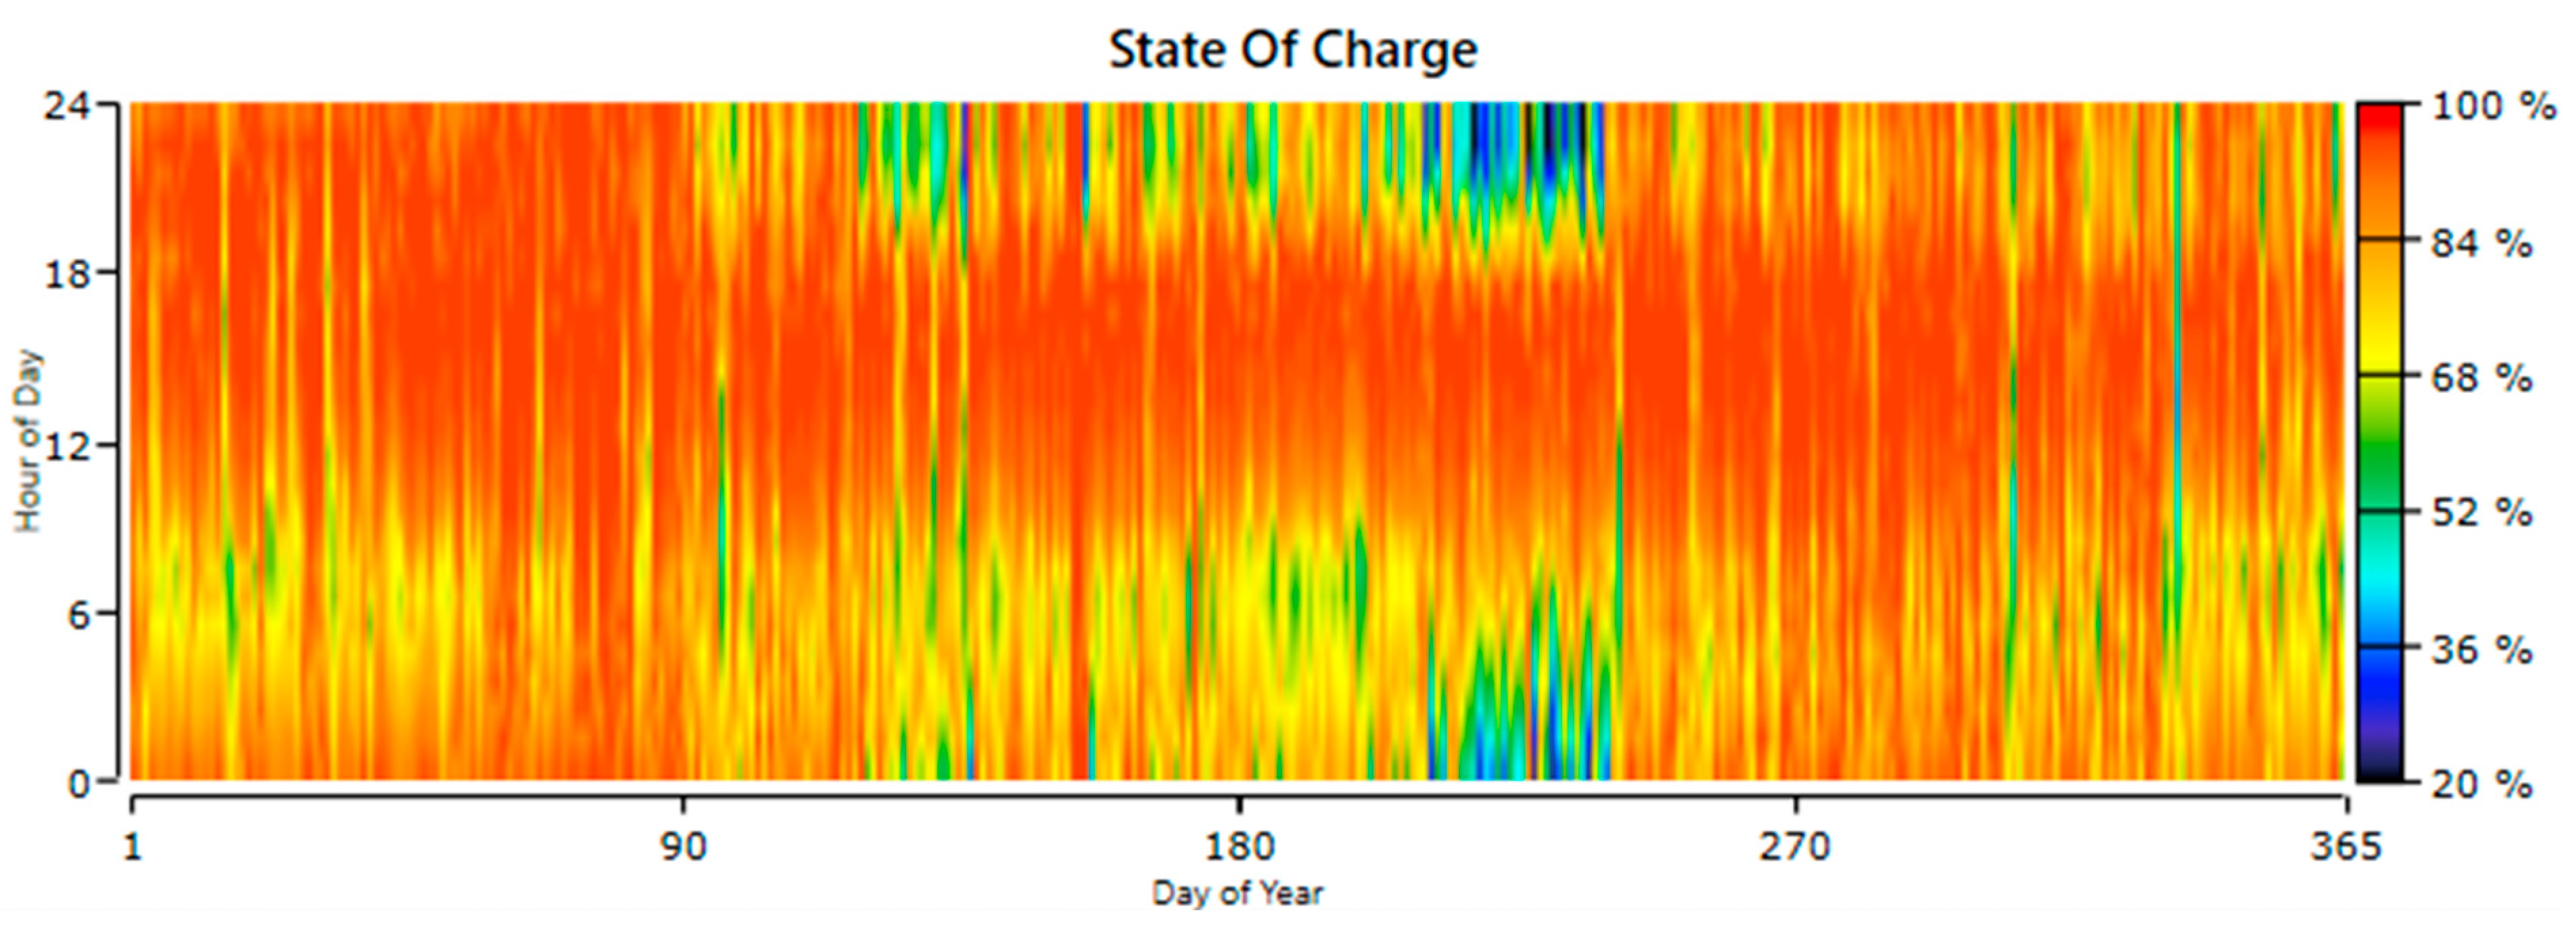
The annual charge level variation graph of the BSSs used is shown in Figure 18, and the values obtained from the simulation are presented in Table 15. During the daytime hours, when the red regions are dense, the BSSs are charging, while during the nighttime hours, they are supplying loads. The BSS system, consisting of 249 BSSs, has met an energy demand of 29,591 kWh in one year.

4. Conclusions

In this study, an off-grid hybrid energy system was designed to meet the electrical and thermal energy needs of Yiğit Harman Village, located in the Solhan district of Bingöl Province, using the village’s resources. The simulation of grid design was carried out using the HOMER software. Considering the region’s wind, solar, and biomass energy resources, a microgrid was designed using PV, WT, BG, and FC production sources. HOMER Pro software performs technical, economic, and environmental analysis separately for different combinations of these components. Although this study was conducted for Yiğit Harman Village, it serves as a model for all regions with similar characteristics.
The proposed microgrid model includes PV, BG, WT, FC, BSS, electrolyzer, HST, converter, and boiler components. According to the simulation results, the electrical energy generation values and percentages for these sources were calculated as 137,170 kWh/yr (53.4%) for PV, 94,784 kWh/yr (36.9%) for BG, 22,861 kWh/yr (8.91%) for WT, and 1893 kWh/yr (0.738%) for FC. The thermal energy generation values and percentages were 126,431 kWh/yr (42.5%) for BG, 6817 kWh/yr (2.29%) for FC, and 163,943 kWh/yr (55.2%) for the boiler. The NPC, LCOE, and CO2 emission values of this model were obtained as USD 739,772, 0.271 USD/kWh, and 37,958 kg/yr, respectively. More clearly, by investing approximately USD 7000 per household, it is possible to meet the 25-year electrical and thermal energy needs of that household through this model.
To demonstrate the environmental superiority of the designed microgrid, scenarios in which the existing loads are powered solely by a diesel generator and solely by a natural gas generator were separately simulated. The CO2 emission values for these scenarios were found to be 61 and 117 times higher, respectively, than the proposed model. These values indicate that the proposed system would be highly advantageous from an environmental perspective.
This and similar studies in the literature highlight the economic and environmental advantages of HRES, encouraging both governments and private enterprises to invest in this field. With technological advancements, it is highly probable that the costs of renewable energy components will decrease in the coming years.
In future studies, an analysis can be performed using a control algorithm written in MATLAB, and a comparison can be made with the analysis performed by HOMER software. In addition, since there are many small river resources in Bingöl Province, the effect of hydroelectric energy can be examined by designing a microgrid for one of the settlements close to these resources.

Author Contributions

F.A., Investigation, writing—original draft preparation, visualization, formal analysis. D.Ö., Writing—review and editing, validation, supervision, project administration. All authors have read and agreed to the published version of the manuscript.

Funding

This research received no external funding.

Data Availability Statement

The raw data supporting the conclusions of this article will be made available by the authors on request.

Conflicts of Interest

The authors declare no conflict of interest.

References

  1. Available online: https://iea.blob.core.windows.net/assets/86ede39e-4436-42d7-ba2a-edf61467e070/WorldEnergyOutlook2023.pdf (accessed on 3 February 2024).
  2. Available online: https://www.teias.gov.tr/turkiye-elektrik-uretim-iletim-istatistikleri (accessed on 3 February 2024).
  3. Available online: https://www.setav.org/assets/uploads/2022/04/A365.pdf (accessed on 27 July 2024).
  4. León Gómez, J.C.; De León Aldaco, S.E.; Aguayo Alquicira, J. A Review of Hybrid Renewable Energy Systems: Architectures, Battery Systems, and Optimization Techniques. Eng 2023, 4, 1446–1467. [Google Scholar] [CrossRef]
  5. Qiblawey, Y.; Alassi, A.; Abideen, M.Z.U.; Bañales, S. Techno-economic assessment of increasing the renewable energy supply in the Canary Islands: The case of Tenerife and Gran Canaria. Energy Policy 2022, 162, 112791. [Google Scholar] [CrossRef]
  6. Ellabban, O.; Alassi, A. Optimal hybrid microgrid sizing framework for the mining industry with three case studies from Australia. IET Renew. Power Gener. 2021, 15, 409–423. [Google Scholar] [CrossRef]
  7. Demiroren, A.; Yilmaz, U. Analysis of change in electric energy cost with using renewable energy sources in Gökceada, Turkey: An island example. Renew. Sustain. Energy Rev. 2010, 14, 323–333. [Google Scholar] [CrossRef]
  8. Fikari, S.G.; Sigarchian, S.G.; Chamorro, H.R. Modeling and simulation of an autonomous hybrid power system. In Proceedings of the 2017 52nd International Universities Power Engineering Conference (UPEC), Heraklion, Greece, 28–31 August 2017; pp. 1–6. [Google Scholar]
  9. Hafez, O.; Bhattacharya, K. Optimal planning and design of a renewable energy based supply system for microgrids. Renew. Energy 2012, 45, 7–15. [Google Scholar] [CrossRef]
  10. Islam, M.S.; Akhter, R.; Rahman, M.A. A thorough investigation on hybrid application of biomass gasifier and PV resources to meet energy needs for a northern rural off-grid region of Bangladesh: A potential solution to replicate in rural off-grid areas or not? Energy 2018, 145, 338–355. [Google Scholar] [CrossRef]
  11. He, L.; Zhang, S.; Chen, Y.; Ren, L.; Li, J. Techno-economic potential of a renewable energy-based microgrid system for a sustainable large-scale residential community in Beijing, China. Renew. Sustain. Energy Rev. 2018, 93, 631–641. [Google Scholar] [CrossRef]
  12. Sigalo, M.; Tee, N.; Usman, R. Comparative Analysis and Simulation of a Hybrid PV/Diesel Generator/Grid System for the Faculty of Engineering Main Building, Rivers State University, Port Harcourt Nigeria. Int. Organ. Sci. Res. J. Eng. (IOSRJEN) 2017, 7, 37–44. [Google Scholar]
  13. Shezan, S.A.; Ishraque, M.F.; Shafiullah, G.M.; Kamwa, I.; Paul, L.C.; Muyeen, S.M.; Ramakrishna, N.S.S.; Saleheen, M.Z.; Kumar, P.P. Optimization and control of solar-wind islanded hybrid microgrid by using heuristic and deterministic optimization algorithms and fuzzy logic controller. Energy Rep. 2023, 10, 3272–3288. [Google Scholar] [CrossRef]
  14. Odetoye, O.A.; Olulope, P.K.; Olanrewaju, O.M.; Alimi, A.O.; Igbinosa, O.G. Multi-year techno-economic assessment of proposed zero-emission hybrid community microgrid in Nigeria using HOMER. Heliyon 2023, 9, e19189. [Google Scholar] [CrossRef] [PubMed]
  15. Mbasso, W.F.; Naoussi, S.R.D.; Molu, R.J.J.; Saatong, K.T.; Kamel, S. Technical assessment of a stand-alone hybrid renewable system for energy and oxygen optimal production for fishes farming in a residential building using HOMER pro. Clean. Eng. Technol. 2023, 17, 100688. [Google Scholar] [CrossRef]
  16. Peláez-Peláez, S.; Colmenar-Santos, A.; Pérez-Molina, C.; Rosales, A.-E.; Rosales-Asensio, E. Techno-economic analysis of a heat and power combination system based on hybrid photovoltaic-fuel cell systems using hydrogen as an energy vector. Energy 2021, 224, 120110. [Google Scholar] [CrossRef]
  17. Kalamaras, E.; Belekoukia, M.; Lin, Z.; Xu, B.; Wang, H.; Xuan, J. Techno-economic Assessment of a Hybrid Off-grid DC System for Combined Heat and Power Generation in Remote Islands. Energy Procedia 2019, 158, 6315–6320. [Google Scholar] [CrossRef]
  18. Jahangiri, M.; Karimi Shahmarvandi, F.; Alayi, R. Renewable energy-based systems on a residential scale in southern coastal areas of Iran: Trigeneration of heat, power, and hydrogen. J. Renew. Energy Environ. 2021, 8, 67–76. [Google Scholar] [CrossRef]
  19. Available online: https://www.sbb.gov.tr/wp-content/uploads/2023/03/2023-Kahramanmaras-and-Hatay-Earthquakes-Report.pdf (accessed on 27 July 2024).
  20. Available online: https://tr.wikipedia.org/wiki/Yi%C4%9Fitharman,_Solhan (accessed on 8 February 2024).
  21. Özkoca, M.İ. Kojenerasyon ve Güneş Enerjisinin Bütünleştirildiği Hibrit Sistemin Ekonomik ve Emisyon Analizi. Master’s Thesis, īstanbul Teknik Üniversitesi, Fen Bilimleri Enstitüsü, īstanbul, Turkey, 2019. [Google Scholar]
  22. Jahangiri, M.; Haghani, A.; Heidarian, S.; Mostafaeipour, A.; Raiesi, H.A.; Shamsabadi, A.A. Sensitivity analysis of using solar cells in regional electricity power supply of off-grid power systems in Iran. J. Eng. Des. Technol. 2020, 18, 1849–1866. [Google Scholar] [CrossRef]
  23. Beyarslan, S. Yenilenebilir Enerji Kaynakları ile Mikro şebeke tasarımı ve Optimum çözümünün homer ile Incelenmesi. Master’s Thesis, īstanbul Teknïk Ünïversïtesï, īstanbul, Turkey, 2021. [Google Scholar]
  24. Available online: https://gepa.enerji.gov.tr (accessed on 11 February 2024).
  25. Available online: http://turkiyekoyunkeci.org/tr/RakamlarlaKoyunKeci (accessed on 11 February 2024).
  26. Available online: https://www.bingolkenthaber.com/hayvan-sayisinda-buyuk-dusus-yasandi#:~:text=Verilere%20g%C3%B6re%2C%20Bing%C3%B6l’de%202021,bin%20635%20adet%20azalm%C4%B1%C5%9F%20oldu (accessed on 25 July 2024).
  27. Salihoğlu, N.K.; Teksoy, A.; Altan, K. Büyükbaş ve küçükbaş hayvan atiklarindan biyogaz üretim potansiyelinin belirlenmesi: Balikesir ili örneği. Niğde Ömer Halisdemir Üniversitesi Mühendislik Bilim. Derg. 2019, 8, 31–47. [Google Scholar]
  28. Available online: https://bingol.ktb.gov.tr/TR-56989/ilin-cografi-konumu.html (accessed on 11 February 2024).
  29. Available online: https://homerenergy.com/pdf/HOMERHelpManual.pdf (accessed on 21 February 2024).
  30. Şenaktaş, B. Hidrojen enerjisi, üretimi ve uygulamaları. Master’s Thesis, Pamukkale Üniversitesi, Fen Bilimleri Enstitüsü, Denizli, Turkey, 2005. [Google Scholar]
  31. Khadem, T.; Billah, S.B.; Barua, S.; Hossain, M.S. Homer based hydrogen fuel cell system design for irrigation in bangladesh. In Proceedings of the 2017 4th International Conference on Advances in Electrical Engineering (ICAEE), Dhaka, Bangladesh, 28–30 September 2017. [Google Scholar]
  32. Mudgal, V.; Reddy, K.S.; Mallick, T.K. Techno-Economic Analysis of Standalone Solar Photovoltaic-Wind-Biogas Hybrid Renewable Energy System for Community Energy Requirement. Future Cities Environ. 2019, 5, 11. [Google Scholar] [CrossRef]
  33. Liu, G.; Li, M.; Zhou, B.; Chen, Y.; Liao, S. General indicator for techno-economic assessment of renewable energy resources. Energy Convers. Manag. 2018, 156, 416–426. [Google Scholar] [CrossRef]
Figure 1. The location of the case study region (Yiğit Harman Village).
Electricity 05 00028 g001
Figure 2. Configuration of the proposed microgrid.
Electricity 05 00028 g002
Figure 3. Electrical load data for Load-1.
Electricity 05 00028 g003
Figure 4. Electrical load data for Load-2.
Electricity 05 00028 g004
Figure 5. Thermal load data for Yiğit Harman Village.
Electricity 05 00028 g005
Figure 6. Daily solar radiation and openness index for Yiğit Harman Village.
Electricity 05 00028 g006
Figure 7. Wind speed graph for Yiğit Harman Village.
Electricity 05 00028 g007
Figure 8. Biomass graph of Yiğit Harman Village.
Electricity 05 00028 g008
Figure 9. Power curve of the Eocycle EO10 model WT.
Electricity 05 00028 g009
Figure 10. Optimization results.
Electricity 05 00028 g010
Figure 11. Annual generation distribution by sources for the model. (a) Electrical energy. (b) Thermal energy.
Electricity 05 00028 g011
Figure 12. (a) Generation with diesel generator. (b) Generation with natural gas generator.
Electricity 05 00028 g012
Figure 13. Annual output power variation of PV panels.
Electricity 05 00028 g013
Figure 14. Annual output power variation of wind turbines.
Electricity 05 00028 g014
Figure 15. Annual output power variation of the BG.
Electricity 05 00028 g015
Figure 16. Annual output power variation of the FC.
Electricity 05 00028 g016
Figure 17. Annual input power variation of the electrolyzer.
Electricity 05 00028 g017
Figure 18. Annual charge level change of BSSs.
Electricity 05 00028 g018
Table 1. Change in the rate of RES in Türkiye’s total installed capacity.
Development of the Rate of RES in Türkiye’s Total Installed Capacity
(2000–2022)
YearsTotal Hydraulic (MW)Geothermal (MW)Wind (MW)Solar (MW)Biomass (MW) (Including Industrial Waste, Excluding Waste Heat)Installed Capacity of RESs (MW)Total Installed Power (MW)Rate of RESs (%)
200011,175.217.518.9-10.011,221.627,264.141.2
200512,906.115.020.1-13.812,955.038,843.533.4
201015,831.294.21320.2-85.717,331.349,524.135.0
201525,867.8623.94503.2248.8277.131,520.873,146.743.1
202030,983.91613.28832.46667.41105.349,202.295,890.651.3
202131,492.61676.210,607.07815.61642.753,234.199,819.653.3
202231,571.51691.311,396.29425.41920.856,005.3103,809.354.0
Table 2. Monthly energy consumption (Cons.) values of Yiğit Harman Village.
Total Cons.
(kWh)
Total Cons. of Customers (kWh)Lighting Cons. (kWh)Daily Average Cons. of Customers (kWh)Hourly Average Cons. of Customers (kWh)Daily Average Cons. of Lighting (kWh)Hourly Average Cons. of Lighting (kWh)
January8.6496.3632.2862059743
February7.4765.7591.7172069613
March12.28410.4931.79133814582
April16.77315.3931.38051321462
May18.81317.5141.29956524422
Jun17.42416.2621.16254223392
July19.97819.20377561926251
August25.15623.7641.39276732452
September17.35215.8521.50052822502
October17.39115.7321.65950721542
November15.95314.2281.72547420572
December14.33212.4181.91440117623
Table 3. Global daily radiation values of Yiğit Harman Village and Türkiye.
JanuaryFebruaryMarchAprilMayJuneJulyAugustSeptemberOctoberNovemberDecember
Yiğit Harman (kWh/m2/day)2.254.174.895.887.387.596.725.433.582.301.824.17
Türkiye (kWh/m2/day) [24]1.792.503.874.936.146.576.505.814.813.462.141.59
Table 4. Average wind speed values of Yiğit Harman Village.
JanuaryFebruaryMarchAprilMayJuneJulyAugustSeptemberOctoberNovemberDecember
Wind Speed (m/s)3.8004.0404.2004.2303.8604.2004.4004.1403.9003.6803.5903.570
Table 5. Amount of waste according to animal breeds [27].
Animal BreedLive Weight (kg)Amount of Waste
Percentage of Weightkg/Day
Cattle135–8005–610–20
Sheep and goat30–754–52
Table 6. Notations in BSS system equations.
ComponentsInitial Cost (USD/kWh)Replacement (USD)O&M (USD/yr)
PV panel700010
WT29,00025,00050
BGG300012500.1 (USD/h)
Electrolyzer1000100015
FC300025000.01 (USD/h)
HST50050010
BSS30030010
Converter30030010
Table 7. Shares of system components in energy generation for the model.
ComponentsPVWTBGFCBoiler
Electrical energy generationPower (kWh/yr)137,17022,86194,7841893-
Percentage (%)53.48.9136.90.738-
Thermal energy generationPower (kWh/yr)--126,4316817163,943
Percentage (%)--42.52.2955.2
Table 8. NPC of the system for the model.
ComponentsCapital Price (USD)Replace Price (USD)O&M (USD)Salvage (USD)Fuel (USD)Total (USD)
PV63,166.79011,665.570074,832.36
WT29,0007970.18646.384491.71033,124.85
BG90,00070,319.32134,420.325996.430288,743.21
FC15,0000328.362233.88013,094.48
Electrolyzer10,0004242.741292.75798.53014,736.96
Converter15,434.4006650.950022,085.35
BSS74,700135,939.5832,189.5215,173.150227,655.95
HST15,000000015,000
Boiler000050,498.9550,498.95
System312,301.19218,471.83187,193.8428,693.6950,498,95739,772.11
Table 9. Emission values for all models.
The Proposed Model (kg/yr)The Model with Natural Gas Generator (kg/yr)The Model with Diesel Generator (kg/yr)
CO237,9582,330,2234,444,353
CO0.651510,2372826
Unburned hydrocarbons00437
Particulate matter00488
SiO20011,030
NO0.365102,04724,994
Table 10. Values of PV panel systems.
QuantityValueUnits
Rated capacity90.2kW
Capacity factor17.4%
Total production137,170kWh/yr
PV penetration71.6%
Hours of operation4387hrs/yr
COE0.0422USD/kWh
Table 11. Values of the wind turbine systems.
QuantityValueUnits
Total rated capacity10.0kW
Capacity factor26.1%
Total production22,861kWh/yr
Wind penetration11.9%
Hours of operation5283h/yr
LCOE0.112USD/kWh
Table 12. Values of the BG.
QuantityValueUnits
Hours of operation3466h/yr
Fixed generation cost4.88USD/h
Electrical production94,784kWh/yr
Thermal production126,431kWh/yr
Fuel consumption286tons/yr
Specific fuel consumption2.11kg/kWh
Fuel energy input305,503kWh/yr
Mean electrical efficiency31%
Table 13. Values of the FC.
QuantityValue
(for the Model with All Components)
Units
Hours of operation508h/yr
Electrical production1893kWh/yr
Thermal production6817kWh/yr
Fuel consumption398kg
Fuel energy input13,254kWh/yr
Mean electrical efficiency14.3%
Table 14. Values of the electrolyzer.
QuantityValue
(for the All-Component Model)
Units
Rated capacity10.0kW
Total input energy18,452kWh/yr
Capacity factor21.1%
Hours of operation4566h/yr
Total production398kg/yr
Specific consumption46.4kWh/kg
Table 15. Values of the BSS systems.
QuantityValueUnits
BSSs249qty.
Lifetime throughput199,200kWh
Expected life6.02yr
Energy in36,926kWh/yr
Energy out29,591kWh/yr
Storage depletion56.5kWh/yr
Loses7391kWh/yr
Annual throughput33,084kWh/yr
Disclaimer/Publisher’s Note: The statements, opinions and data contained in all publications are solely those of the individual author(s) and contributor(s) and not of MDPI and/or the editor(s). MDPI and/or the editor(s) disclaim responsibility for any injury to people or property resulting from any ideas, methods, instructions or products referred to in the content.