Abstract
Accurate electricity demand forecasting is vital to the development and evolution of smart grids as well as the reinforcement of demand side management strategies in the energy sector. Since this forecasting task requires the efficient processing of load profiles extracted from smart meters for large sets of clients, the challenges of high dimensionality often lead to the adoption of cluster-based aggregation strategies, resulting in scalable estimation models that operate on aggregate times series formed by client groups that share similar load characteristics. However, it is evident that the clustered time series exhibit different patterns that may not be processed efficiently by a single estimator or a fixed hybrid structure. Therefore, ensemble learning methods could provide an additional layer of model fusion, enabling the resulting estimator to adapt to the input series and yield better performance. In this work, we propose an adaptive ensemble member selection approach for stacking and voting regressors in the cluster-based aggregate forecasting framework that focuses on the examination of forecasting performance on peak and non-peak observations for the development of structurally flexible estimators for each cluster. The resulting ensemble models yield better overall performance when compared to the standalone estimators and our experiments indicate that member selection strategies focusing on the influence of non-peak performance lead to more performant ensemble models in this framework.
1. Introduction
Smart grid technologies and applications are at the forefront of modern electricity network research and development due to the increasing number of challenges that hinder the performance of the traditional power grid as well as the accrescent need to transition towards a digital ecosystem where the bidirectional flow of information between the electricity provider and consumers is simplified. Since the penetration of renewable energy sources introduces additional volatility that could compromise the reliability of the grid and the increasing electricity demand from a growing number of consumers could lead to the occurrence of irregular events such as blackouts, the centralized structure of the traditional grid has limited control over these phenomena [1,2]. Therefore, the development of smart grids that rely on the wide deployment of smart meters is necessary for the efficient, adaptive and autonomous management of consumer loads in a distributed framework. Consequently, a large volume of high dimensional sensor data are extracted from smart meters and the efficient processing as well as prediction of electricity load are crucial tasks that reinforce advanced transmission, distribution, monitoring and billing strategies [3]. Load forecasting tasks could be developed for different time horizons depending on the focus of each smart grid application. In the context of real-time load monitoring, demand response and smart energy pricing, accurate short-term predictions and point forecasts could support energy management systems as well as decision-making models in shaping load allocation and pricing strategies for consumer groups that share similar load profile characteristics. Additionally, high-resolution predictions of total electricity demand could assist in the stability of the grid through the real-time detection of irregular events, enabling online scheduling at a higher level while preserving consumer privacy. It is equally important to note that high-frequency demand forecasts could result in the optimization of energy resources through the examination of total load fluctuations at a higher granularity as well as the optimization of bidding strategies when utility companies purchase electricity from energy markets, enabling short-term flexibility and more efficient market balancing [4].
Artificial intelligence and machine learning contributed significantly towards the accurate estimation of total demand through the supervised learning task of regression analysis. Firstly, simple linear models such as ordinary least squares linear regression [5], Ridge [6], Lasso [7], Stochastic Gradient Descent (SGD) [8] and Huber [9] estimators search for the line of best fit that optimally describes the relationship between the dependent and independent variables. Linear models are commonly used in large-scale forecasting tasks due to their low computational cost and interpretability. However, these models do not interpret complex nonlinear relationships and the impact of outliers within the data could hinder the forecasting accuracy. Therefore, more robust methods were developed such as the generalized median Theil-Sen estimator [10], gradient boosting models based on decision trees such as XGBoost [11], the least angle regressor (LARS) [12] and efficient unsupervised learning models were adapted such as k-nearest neighbor (KNN) [13] and support vector machine models for regression (SVR) [14] in order to achieve higher accuracy in high dimensional spaces and ensure resilience against multivariate outliers. Secondly, neural network models such as the multilayer perceptron [15,16,17] and long short-term memory network [18] could be applied to this forecasting task in order to capture nonlinear relationships as well as time dependencies adaptively, operating as function approximators in a black-box approach. It is important to mention that while the standalone performance of these models could result in predictions with low error metrics, combinatorial and hybrid approaches such as ensemble learning could be considered for further performance improvement when a suitable combination of models is discovered through arbitrary selection, informed selection based on expert knowledge and experimentation or criteria examination. Time series estimator output could be combined in a meta-modeling framework for stacked generalization, averaged in a voting framework or used to improve another set of estimators sequentially through boosting [19,20].
It is evident that since consumer load profiles are organized in high dimensional time series, forecasting total electricity demand through the direct use of regression analysis would be computationally expensive and the resulting estimators would exhibit diminishing accuracy as more load data from different types of consumers is collected. Consequently, in order to provide solutions to the challenges of dimensionality and scalability, load forecasting approaches in this sector utilize clustering and aggregation strategies as a preprocessing step, altering the shape of the data before it is used for the training of estimators. Cluster-based approaches mainly focus on the segmentation of the consumers into groups based on similar characteristics or by utilizing heuristic algorithms. Predictions for each cluster are extracted and summed to derive the total demand forecast. This approach may become computationally expensive when the consumer base is large and the optimal number of clusters remains small. However, clustering approaches are valuable to demand forecasting since they preserve load patterns within each consumer group. Furthermore, advances in distributed computing attempt to develop more efficient parallelizable models to offset that computational cost [21]. Aggregation approaches attempt to develop a single prediction model where the time series dataset is typically derived from the summation of all consumer load profiles. This approach offers substantial benefits in terms of data compression at the cost of prediction accuracy since the impact of the patterns found in individual consumer time series as well as the behaviors exhibited in different clusters could be reduced greatly in the resulting time series [22]. Combining the clustering and aggregation methods led to the development of the cluster-based aggregate framework where the time series for each consumer group can be aggregated before the prediction in order to derive the estimated partial sum of total demand. This approach attempts to balance accuracy and computational cost and presents a scalable alternative that improves the performance of estimators as the size of the customer base increases.
In the modern power grid, the evolution of the increasingly diverse customer base coupled with the overall complexity of the data collection process often result in datasets that include missing values, outliers and typically exhibit structural issues due to variations in monitoring periods and differences in the quality of the available equipment. Therefore, the performance of load estimators depends on the dataset structure as well as the ability of data-driven models to adapt to the given input. Consequently, a static load estimation model may not maintain optimal performance across multiple forecasting tasks since some components may underperform due to the unique characteristics of the input. This phenomenon could be easily observed in the processing of clustered time series for the prediction of total electricity demand. The utilization of clustered time series results in several structurally different datasets derived from different consumer groups. When the datasets pass through a single type of estimator or a static combinatorial structure, divergent performance metrics between partial demand predictions could be observed, resulting in suboptimal overall performance when the values are aggregated for the estimation of total demand. The potential failure to adapt to an individual dataset could be more impactful in short-term and very short-term forecasting tasks since lagged features at higher resolutions would require a higher volume of information in order to properly capture meaningful temporal dependencies between samples. These load forecasting issues could be connected to the challenges of data drift and concept drift in machine learning modeling. The challenge of data drift indicates the deterioration of model performance as the distribution of input data changes and the challenge of concept drift denotes the difficulty of the model to adapt to the data as the mapping between the input and the target variable changes [23,24]. These challenges could arise when load time series are considered for the prediction of total demand since data distributions could vary between different client types and the relationship between input and output could change as the size of the customer base and the complexity of observed patterns increase. Furthermore, the impact of those challenges could affect the performance of combinatorial approaches such as ensemble learning significantly, since potential concept or data drift across multiple datasets could result in inefficient estimator combinations that may yield suboptimal performance when compared to standalone models due to underperforming components. As a result, the focus should be shifted towards modular estimator structures that utilize well-defined, criteria-based strategies in order to select estimation components that would not underperform given a specific input, thereby reinforcing consistency. Moreover, the implementation of estimator selection strategies would lead to less arbitrary and less ambiguous combinatorial structures since estimator members would be directly connected to the input data.
Several recent research projects presented interesting demand forecasting approaches utilizing a plethora of regression estimators for centralized analysis as well as distributed modeling in clustering and aggregation frameworks. Ceperic et al. [25] proposed a model input selection strategy for SVR-based load forecasting, outperforming state of the art short-term forecasting approaches in terms of accuracy. Wijaya et al. [26] examined the performance of linear regression, multilayer perceptron and support vector regression on several clustering strategies for short-term load forecasting, highlighting the dependence of the cluster-based aggregate forecasting approach on the number of clusters as well as the size of the customer base for optimal performance. Karthika et al. [27] proposed a hybrid model based on the autoregressive moving average and support vector machine algorithms for hourly demand forecasting, showing reduced error metrics and increased convergence speed through the efficient merging of those machine learning methods. Laurinec and Lucká [28] studied the impact of unsupervised ensemble learning models on clustered and aggregated load forecasting tasks and deduced that the adaptation of those methods could lead to improved performance. Fu et al. [29] developed an adaptive cluster-based method for residential load forecasting through the utilization of self-organizing fuzzy neural networks, harnessing the unique characteristics of each cluster. Li et al. [30] utilized subsampled SVR ensembles coupled with a swarm optimization strategy, resulting in a deterministic and interpretable forecasting model that efficiently combines the output of multiple predictors. Bian et al. [31] proposed a similarity-based approach and implemented K-means clustering and fuzzy C-mean clustering for the derivation of features based on locally similar consumer data for the training of a back-propagation neural network. Sarajcev et al. [32] presented a stacking regressor that combined gradient boosting, support vector machine and random forest learners for clustered total load forecasting, signifying that the robust estimation of electricity consumption can be achieved when a suitable model combination is discovered. Cini et al. [33] examined the performance of the cluster-based aggregate framework on deep neural network architectures and highlighted the suitability of this clustering approach for short-term load forecasting. Additionally, this project raises awareness about the complex and challenging nature of implementations involving multiple predictors in this framework for future research. Kontogiannis et al. [34] presented a meta-modeling technique combining long short-term memory network ensembles and a multilayer perceptron to forecast power consumption and examine the impact of causality and similarity information extracted from client load profiles. This project presented a novel strategy for the decomposition of load data into causal and similar components, resulting in a combinatorial structure that outperformed the standalone load representation. Stratigakos et al. [35] proposed a hybrid model combining time series decomposition and artificial neural networks for efficient short-term net load forecasting. The approach presented in this work reduced the error metrics of multi-layer perceptron and long-short term memory network and highlighted the impact of trend, seasonal and noise time series components. Zafeiropoulou et al. [36] proposed a pilot project that addressed the challenges of congestion and balancing management in energy systems and provided robust solutions that could improve resource flexibility and power system stability. Phyo et al. [37] developed a voting regression model including decision tree, gradient boosting and nearest neighbor estimators, resulting in improved performance when compared to the baseline standalone predictors. This symmetrical forecasting approach achieved the expected performance boost that is often observed in optimal ensemble models and when compared to the autoregressive moving average model, the proposed estimator yielded lower error metrics due to the highly performant components included in this ensemble structure.
In this study, we focused on the high-frequency point prediction of total electricity demand on the cluster-based aggregate framework for the development and evaluation of adaptive and structurally flexible stacking and voting ensemble models. This very short-term forecasting approach addresses the challenges in combinatorial forecasting models through the processing of diverse clustered time series and the introduction of a well-defined member selection strategy. The ensemble estimator considers several peak detection perspectives for member selection. The membership of base learners is determined based on the performance examination from a set of 11 candidate estimators on subsets of training observations from the actual as well as the predicted clustered time series, detected as peaks and non-peaks. The proposed ensemble regressors were evaluated in a case study utilizing smart meter data from a dataset of 370 Portuguese electricity consumers for a period of 4 years. The goal of this project is to examine the impact of this criteria-influenced member selection strategy on the cluster-based aggregate framework and propose alternative adaptive ensemble models that combine knowledge extracted from different estimators based on core time series characteristics. Since recent research efforts have deployed training performance indicators and feature-based criteria for member selection on centralized ensemble models, our contribution aims to expand on this approach through the implementation of flexible ensemble estimators constructed from different base learners on each consumer cluster. Additionally, several adaptive hybrid modeling and meta-modeling approaches on clustered and aggregated frameworks typically include the most prominent estimators for model fusion based on expert knowledge or arbitrary selection. Consequently, the effect of criteria-based ensemble structures for cluster-based aggregate load forecasting is not thoroughly explored. Our study aims to provide meaningful insights while addressing this research gap. Case studies and model comparisons in the literature show that a static ensemble structure or a standalone estimator may not always yield the same level of performance stability on all types of consumer load time series. This observation holds true in the examination of clustered time series since each cluster needs to be processed differently in order to capture the patterns of a specific client group efficiently. Therefore, our project considers the fundamental characteristic of peak and non-peak detection in time series and attempts to adjust the ensemble structure for each cluster locally, reinforcing the idea that more modular and dynamic estimation strategies should be developed for those distributed frameworks. The deployment of our proposed approach in real-world applications could support advanced energy management systems and contribute towards the development of more robust bidding strategies through the extraction of more precise total demand analytics in short time intervals.
In Section 2, we present the main methodologies involved in the implementation of our proposed models, including the ensemble learning structure for stacking and voting regression, an overview of the cluster-based aggregate framework for total demand forecasting, an inspection of well-known clustering evaluation methodologies and the structure of our proposed ensemble regressors. Additionally, information about the dataset and the definitions of error metrics are provided in this section for completeness. In Section 3, we analyze the results of our experiments and evaluate the performance of our models, comparing them to baseline standalone estimators. In Section 4, we discuss the impact of the experimental results and outline the advantages and the potential challenges of the proposed models. Furthermore, we provide insights on future research directions that could expand on our forecasting approach and possibly enhance model performance for similar applications in the energy sector. Finally, in Section 5, we present the conclusions derived from the experiments and the analysis of the results.
2. Materials and Methods
2.1. Stacking and Voting Ensemble Regression
Time series forecasting estimators attempt to capture linear and non-linear patterns from the training data in order to fit a model that is able to generalize well when new observations are tested. However, due to the coexistence of those two types of patterns, a single estimator may not be able to achieve both good interpretation and optimal forecasting performance. The suboptimal accuracy could be attributed to high bias, resulting in limited approximation flexibility, or high variance, leading to larger fluctuations in the estimated time series when value changes occur in the training data. Therefore, models with a high bias could be prone to underfitting, resulting in poor performance on the training and test set. Additionally, models with high variance are prone to overfitting, resulting in optimal performance on the training set and suboptimal accuracy on the test set. Ensemble learning methods acknowledge those potential model instabilities and contribute to the implementation of more robust estimators that are more resilient to noise through the combination of multiple regression models [38]. In this project, we develop the forecasting model structure and investigate the impact of stacking and voting ensembles on clustered aggregate load time series.
The stacking ensemble regression approach combines multiple estimators in order to construct a meta-model that consists of multiple layers responsible for processing estimated time series as features for the training of a new estimator. For this study, we consider the simple two-layer stacking ensemble structure for time series regression tasks. Layer 0 trains several diverse estimators commonly known as base learners and produces a feature set of estimated time series, denoting different representations of the target variable, forming the stacked dataset. Layer 1 usually consists of a simple model such as linear regression that is trained on the stacked dataset in order to derive the final predictions. Figure 1 presents this two-layer structure for base learners. Multilayer stacking extends this structure through the derivation of multiple meta-model time series that are utilized for the training of a subsequent estimator, following the process of the first two layers [39,40].
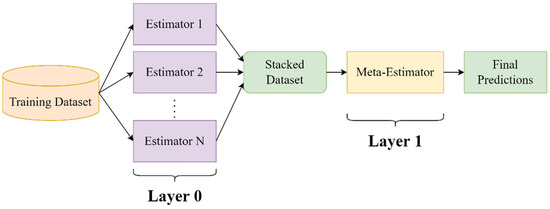
Figure 1.
Stacked ensemble regressor structure with two layers and base estimators.
Voting ensemble models attempt to correct highly divergent estimated time series values through the averaging of multiple estimators. Firstly, a set of similarly performant models is selected for the prediction of the target variable. The members of voting regression typically share similar error metrics during training in order to preserve stable performance after the averaging process. Secondly, a weighting strategy is applied in order to denote the significance of each estimated time series in the final prediction. Uniform weights are commonly considered as the default averaging strategy but more sophisticated strategies based on the process of member selection could be explored for performance evaluation. Figure 2 presents the structure of a voting regression model of members [41,42].
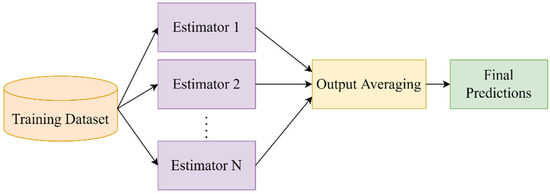
Figure 2.
Voting regressor structure for the averaging of estimators.
Stacking and voting ensembles could result in improved performance when compared to standalone estimators since the simultaneous reduction in bias and variance could derive estimated values that are closer to the actual values of the target variable. Additionally, the combination of ensemble members that are able to independently interpret linear or non-linear patterns leads to more robust estimators that could process more complex high-dimensional time series data efficiently. However, the performance benefits stemming from the implementation of an ensemble model are not guaranteed and it is commonly observed that the wrong or arbitrary selection of ensemble members leads to suboptimal performance. Therefore, studies that propose ensemble models based on arbitrary membership usually undergo extensive experimentation in order to verify the results. This work proposes a deterministic approach for member selection based on fundamental time series components, aiming to outperform the standalone base estimators on both ensemble approaches for clustered aggregate forecasting.
2.2. Cluster-Based Aggregate Forecasting Framework
Smart meter data processing is a challenging task in the development of load forecasting models since the dimensionality of the datasets and the plethora of different consumer types increase model complexity, resulting in a suboptimal prediction accuracy and convergence time for several centralized approaches relying on a single estimator structure. Therefore, cluster-based approaches attempt to divide the consumer base into groups based on distinct time series characteristics or geographical features in order to leverage trends within similar sets of consumers and reduce the noise by processing consumers with different load patterns separately. This work considers the cluster-based aggregate forecasting framework outlined in [26,33] since this method attempts to balance the effects of data compression from aggregation models and the fine-grained distributed prediction of clustered time series, resulting in a scalable strategy that could lower the forecasting error as the size of the consumer base increases. Firstly, load profile time series are clustered into groups based on similarity distance metrics. It is important to note that the number of clusters affects the forecasting performance of the model since a suboptimal division of consumers could result in noisy and unbalanced datasets that could overfit or underfit the estimators. Therefore, cluster evaluation strategies such as the elbow method [43] and silhouette analysis [44] are often applied in this step, in order to determine the optimal value of and ensure that the clusters are well-separated. Secondly, the load consumption time series in each cluster are aggregated in a single time series, resulting in drastically reduced dimensions and increased pattern regularity. The aggregated time series train estimators that output aggregate load predictions for each cluster. Lastly, the summation of clustered predictions derives the total demand forecast and error metrics for model evaluation are calculated based on this time series. Figure 3 presents the cluster-based aggregate forecasting strategy.
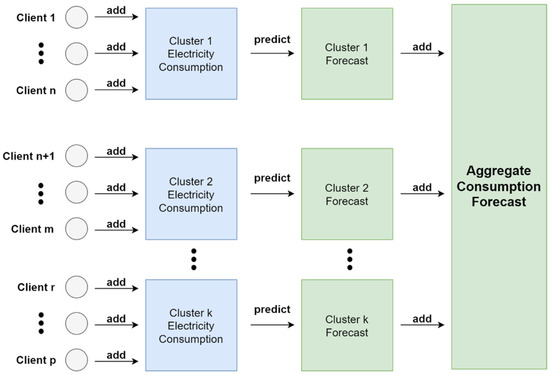
Figure 3.
Cluster-based aggregate forecasting approach separating the consumer base into clusters of variable sizes for the prediction of total electricity consumption.
2.3. Clustering Evaluation Methods
Clustering approaches in load forecasting such as the cluster-based aggregate framework utilize several evaluation methods in order to determine optimal data segmentation, resulting in groups of similar time series. The increased homogeneity of time series reinforces the presence of patterns in the aggregate data, reducing the noise that could be observed when load profiles of consumers exhibiting drastically different behaviors would be aggregated for the prediction of total demand. Additionally, energy applications based on the processing of load features as well as projects that utilize anonymous consumer data often face the challenge of separating the consumer set into distinct groups, since this would help the predictive performance of forecasting models, leading to meaningful deductions. Therefore, it is important to include some of the commonly used clustering evaluation methods in this project such as the elbow method and the silhouette method in order to properly divide the client base into clusters and potentially avoid irregularities in performance that could result in unstable error metrics.
The elbow method is an iterative process used for the selection of the optimal number of clusters through the search for the point where an increase in the number of clusters would not yield substantial data modeling benefits. This point is considered a threshold for clustering algorithms since the diminishing returns from the inclusion of additional clusters may not improve model performance. The commonly used metric in the elbow method is the sum of squared distances between the samples in each cluster and the cluster center. The value of this metric is calculated as the number of clusters increases and it is usually found that the sum of squared distances decreases in every iteration. The curve formed by those values is examined for the selection of the point after which the metric decreases slowly, exhibiting a linear pattern [45].
The silhouette method aims to quantify the cohesion as well as separation of samples by measuring the similarity of data points within the same cluster and the degree of dissociation of samples from other data points found in neighboring clusters. The silhouette coefficient is the metric calculated for the selection of the optimal number of clusters. Given the average distance of sample to all other samples in the same cluster denoted as and the average distance of sample to all the points in the closest neighboring clusters, denoted as the silhouette coefficient is computed with the following formula:
The silhouette score derived from the averaging of the silhouette coefficient for each data point is utilized for the iterative analysis of each number of clusters. The computation and visualization of the silhouette score provide a robust cluster assessment, summarized in values ranging from −1 to 1. Positive silhouette scores closer to 1 indicate sufficient separation of samples into distinct and well-defined clusters. When the silhouette score is close to 0, the examined samples are usually close to the decision boundary between two neighboring clusters, denoting the ambiguity of the resulting data segmentation. Furthermore, negative silhouette scores closer to −1 often denote incorrect cluster assignment or the presence of outliers. Consequently, the optimal number of clusters corresponds to the number that resulted in the highest silhouette score [46]. However, it is worth noting that a thorough examination of model performance should consider both evaluation metrics and investigate the edge case of the minimum number of clusters when the silhouette score is positive since execution time and parallelization availability could be important factors in the deployment of forecasting applications.
2.4. Proposed Forecasting Model
This study examines a combinatorial forecasting approach utilizing the cluster-based aggregate framework as the main structure for customer base segmentation and a model selection method for the development of flexible ensemble estimators that are able to efficiently derive total demand predictions. At the first step, the dataset containing client load profiles is clustered using the K-means algorithm [47] based on the dynamic time warping metric [48] in order to reinforce optimal time series similarity when client data are collected from different start periods. A silhouette analysis and the inertia-based elbow method were applied in order to determine the optimal number of clusters. Following the cluster-based aggregate framework, client time series within each cluster were aggregated to form the input dataset for the ensemble model. At the second step, ensemble membership is determined using peak and non-peak performance evaluation. A peak detection algorithm [49] is applied to the training set in order to detect local maxima by the comparison of neighboring values. A subdivision of the training set is used to train a set of estimators and evaluate their predictive potency on peak and non-peak indices.
The evaluation of peaks and non-peaks is quantified based on an error metric following the examination of three sets of indices denoting three different perspectives where peak and non-peak values are observed. The first set examines the performance of peak and non-peak indices as they were detected by the estimated time series for each candidate ensemble member, the second set examines the performance of peak and non-peak indices observed in the actual time series and the third set considers the performance of peaks and non-peaks detected exclusively in the actual time series. These sets of indices were selected based on the intuitive assumption that peaks and non-peaks should be detected from a relatively large and well-defined set of observations in order to derive robust performance metrics. Therefore, in the extreme case of poor time series estimation, the common index set for the actual and estimated load could result in a small sample that would provide insignificant insight towards the overall peak and non-peak performance of the candidate ensemble members. Additionally, when this extreme scenario is considered, the candidate estimator could be automatically eliminated since the potential inclusion of a prediction model that yields exceedingly poor performance in the ensemble model does not benefit the combinatorial approach. Similarly, uncertainty surrounds the consideration of peak and non-peak values detected exclusively for each estimator since this set may not share a strong connection to the actual time series and result in unreliable deductions. However, in the edge case where the candidate estimators perform extremely well and there is a great overlap of peak and non-peak positions between the actual and estimated time series due to the optimal match of the data points, the evaluation of the remaining indices exclusively detected in the actual time series is significant for the extraction of additional insights that could support informed decisions for model selection since the examination of this small region could be the deciding factor when multiple models are highly performant. The estimator scoring the lowest error metric for each perspective set is added to a list. Consequently, lists of peak and non-peak influenced estimators are formed, including the most performant estimators for each case. Figure 4 presents the total observation space and highlights the sets of indices selected for this strategy. Furthermore, Figure 5 presents the derivation of the membership lists.
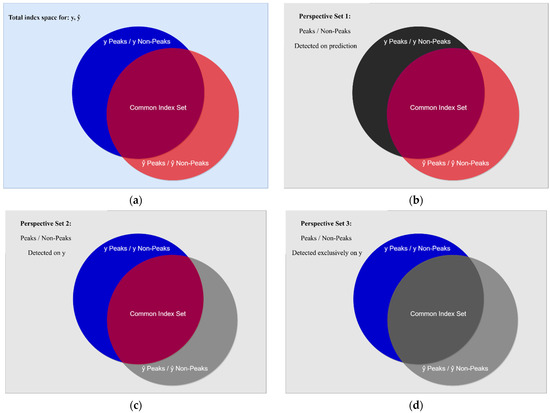
Figure 4.
Set representation for the peak and non-peak model selection strategy based on training performance. (a) Total index space of peak and non-peak observations. The blue circle in the background denotes the total set of indices of peak and non-peak values for the actual load time series. The red circle in the foreground denotes the total set of indices of peak and non-peak values for the predicted load time series. (b) The highlighted red circle denotes the first evaluation set of peaks and non-peaks detected in each estimated time series. (c) Denotes the second evaluation set of peaks and non-peaks detected in the actual time series. (d) Evaluation set denoting the peaks and non-peaks exclusively detected in the actual time series.
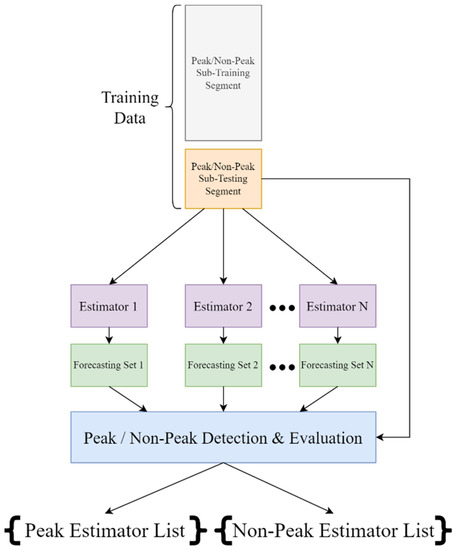
Figure 5.
Ensemble membership selection process.
At the final step of this approach, ensemble regression structures adapted to each cluster due to the membership selection strategy, derive the predicted cluster load. The ensemble estimators could utilize the stacking or the voting paradigm in order to combine the output of the selected ensemble members. When a stacking ensemble is utilized, the lists derived from the member selection strategy could determine the base learners of the first level. Therefore, three models featuring the most performant estimators from sets of peaks, non-peaks and the joint set of indices can be evaluated. Figure 6 presents the structure of the stacking ensemble when the information from the sets of indices is available. Alternatively, the consideration of a voting ensemble could result in the development of more models since the member selection strategy could affect the base predictors as well as the weight strategy for the averaging of the estimated output. Consequently, six models could be examined in this case, since each of the previously mentioned sets of indices could follow a uniform or occurrence-based weight strategy. Figure 7 presents the structure of the voting ensemble models. Lastly, Figure 8 presents the process pipeline of this combinatorial forecasting approach.
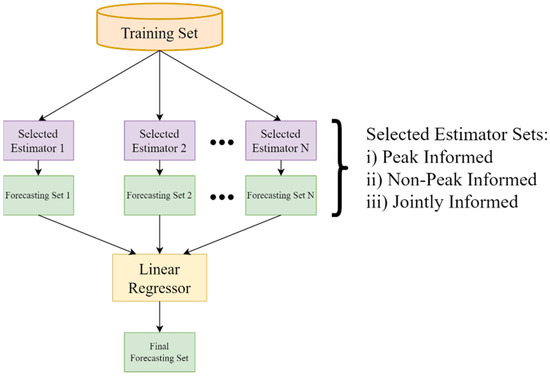
Figure 6.
Stacking ensemble structure based on the peak and non-peak member selection strategy.
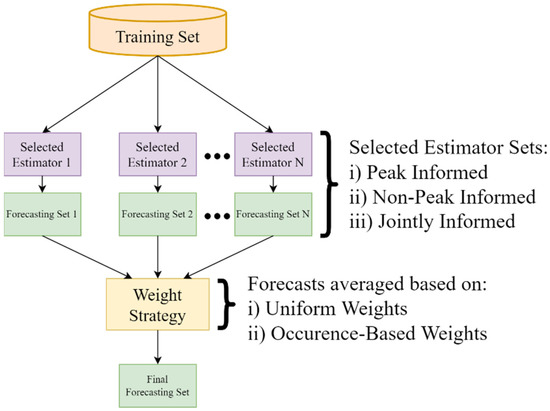
Figure 7.
Voting ensemble structure based on the peak and non-peak member selection strategy.
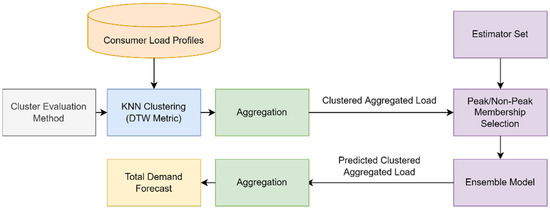
Figure 8.
Process pipeline for structural ensemble regression on the cluster-based aggregate framework.
2.5. Case Study
2.5.1. Data Overview
The proposed model was evaluated on a publicly available dataset [50] containing load measurements for 370 Portuguese clients extracted from smart meters in 15 min intervals for 4 years from January 2011 to December 2014, including a total of 140,256 observations. Since some clients were monitored after 2011, load measurements were considered as zeros. The dataset did not contain any missing values and client measurements were converted from kW to kWh for the purposes of this study. Additionally, the time labels follow the Portuguese time zone and at the start of daylight saving in March values between 1:00 a.m. and 2:00 a.m are zeros. At the end of daylight saving in October, values between 1:00 a.m. and 2:00 a.m. aggregate the consumption of two hours. The load profiles included in this dataset belong to different types of clients such as industrial and residential, exhibiting different consumption patterns that could lead to the fine-grained classification of several subcategories. Since the dataset focuses solely on load features, the anonymity of clients is preserved. Consequently, the segmentation of the client base through clustering is important to the efficiency of the aggregate forecasting model since the processing of clients exhibiting similar consumption patterns could reduce the potential noise and contribute towards faster convergence during training.
The inspection of total demand in Figure 9 as well as the yearly boxplot presented in Figure 10 show that the aggregation of different consumer types coupled with the difference in monitoring periods result in peaks and valleys that could be difficult to interpret in short-term and very short-term prediction horizons. These effects become less impactful as the number of actively monitored consumers remains the same and the forecasting horizon is extended since seasonal patterns can be easily discovered. However, the requirement of a static consumer set in the modern power grid would be unrealistic due to the continuous expansion of the client base as well as the increased diversity in client behavior. Therefore, the examination of very short-term forecasting tasks for the prediction of aggregate load through frameworks that aim to address these challenges could lead to the implementation of more robust design strategies.
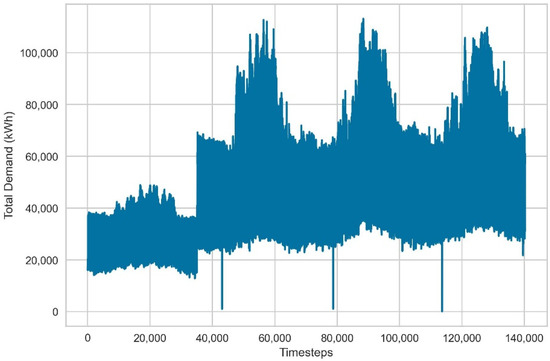
Figure 9.
Total electricity demand in kWh for 370 clients.
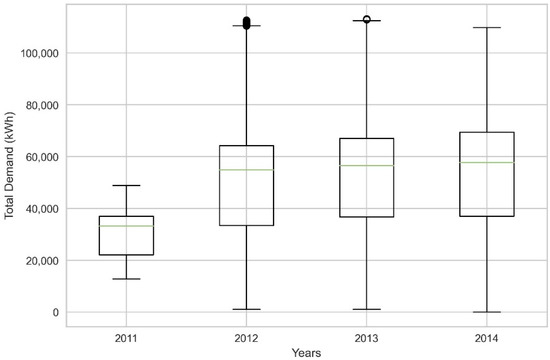
Figure 10.
Boxplot of total yearly electricity demand.
The examination of the histogram and the inspection of the density plot for the aggregate load in Figure 11 indicate a bimodal distribution that could be interpreted as the broader classification of clients into residential and industrial groups. Alternatively, this distribution could denote the sinusoidal shape of observations as the number of actively monitored clients becomes more stable. The presence of several peaks in the density plot and the general imbalance of samples in the bins of the histogram could confirm that this is a challenging task for some linear forecasting models that assume a Gaussian distribution. The implementation of a clustering algorithm could lead to more easily interpretable data distributions, resulting in the accurate prediction of partial aggregate load. However, the selection of estimators for the prediction of the partial aggregate load should not be arbitrary due to irregular data distributions that might persist after the clustering step. Therefore, the adoption of membership strategies is important for the development of combinatorial forecasting approaches; additionally, the utilization of fundamental methods tied to the data distribution such as peak detection could be useful in the refinement of error metrics.
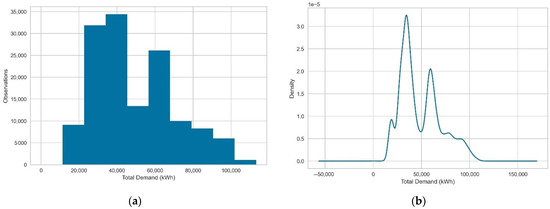
Figure 11.
Non-temporal representation of total electricity demand samples. (a) Total electricity demand histogram. (b) Density plot denoting bimodal distribution.
Lastly, the observation of the first order lag plot denotes relatively high autocorrelation due to the high concentration of samples on the diagonal. Figure 12 suggests a positive correlation between the time series and the lag due to the positive slope of the line formed in the graph. Therefore, autoregressive approaches could be suitable for the prediction of total electricity demand in a very short-term time horizon since most data points are densely concentrated in this linear shape. This could be useful information in research projects that primarily include load features as proof of concept or due to data availability issues.
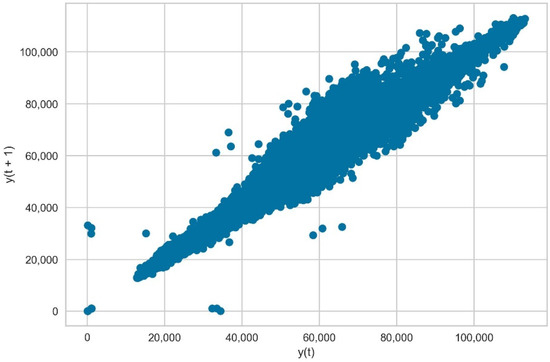
Figure 12.
First order lag plot comparing total electricity demand time series to the lagged total demand .
2.5.2. Implementation and Experiments
The forecasting problem examined in this study can be formulated as the point prediction of total demand for the next 15 min interval based on 4 lagged observations for the previous hour in order to define a simple and interpretable supervised learning task. This task minimizes the impact of feature engineering and data preprocessing on the overall performance of estimators and could allow us to focus on the performance of the cluster-based structure through the dedicated usage of load features as the membership of estimators changes for each cluster. The training set contained 80% of observations and the test set 20%, following common practice for similar forecasting tasks. Since the model focuses on very short-term predictions, the execution time for clustering needs to be fast in order to reserve time for the tuning and recalibration of the ensemble predictors at later steps. Consequently, monthly down-sampled load profiles were considered for the assignment of clients into clusters. As a result, the clustering procedure could be executed in seconds instead of several minutes when compared to weekly and daily down-sampling. Furthermore, the utilization of K-means clustering based on dynamic time warping was beneficial to the optimal alignment of the time series since some clients were monitored after 2011 and prior data entries were zeros. Following this step, silhouette and elbow methods were utilized for the selection of the optimal number of clusters. The silhouette score is the main metric examined in the silhouette method and ranges from −1 to 1, denoting poor cluster assignment when the clustering method achieves a negative silhouette score and satisfactory data separation when the value of that score is positive. The silhouette analysis showed that the assignment of clients into clusters ranging from 2 to 10 resulted in acceptable data separation since the silhouette scores were above 0.6, verifying the consensus of selecting an optimal number of clusters that falls within this range and reaching a global maximum at . The elbow method based on the sum of squared distances of the samples to their closest cluster center denotes that the selection of a number of clusters higher than 7 for the assignment of clients would not yield significant data modeling benefits since after that point, inertia decreases linearly at a slow rate. We observed that clustering derived from other candidate elbow points such as and did not yield a significant difference in terms of error metrics in this forecasting task when compared to . However, the significantly lower silhouette score of could indicate data separation issues, discouraging the selection of this value for the elbow method and reinforcing the selection of since this is a pivotal point after which a significant decrease in the silhouette score occurs when this region of the inertia curve is examined. Therefore, the performance of the ensemble learning models was examined in the representative points of each method for 2 and 7 clusters, respectively. Figure 13 and Figure 14 present the clustering evaluation of the silhouette and elbow methods.
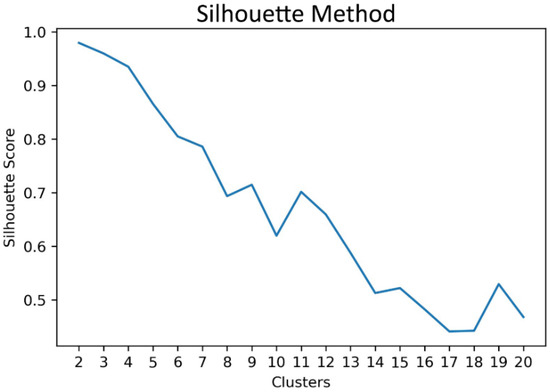
Figure 13.
Silhouette method for clusters ranging from 2 to 20 using K-means clustering of client load profiles based on dynamic time warping.
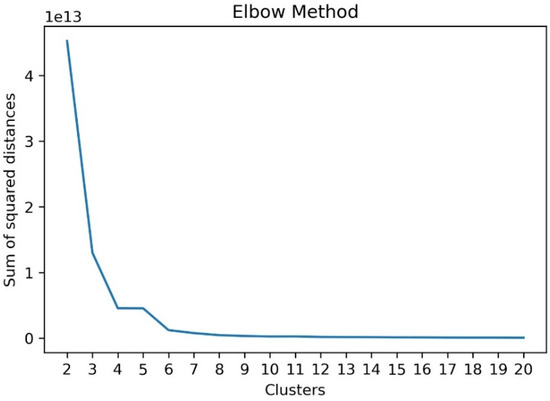
Figure 14.
Inertia-based elbow method for clusters ranging from 2 to 20 using K-means clustering of client load profiles based on dynamic time warping.
The next process of this forecasting model considers a set of 11 base regression estimators as candidate members of the ensemble structure for each clustered aggregated load. The estimators were tuned based on cross-validated random search [51] on the training data, utilizing a 5-fold time series split that returns the first folds as the training set and the last fold as the evaluation set, maintaining the temporal order of observations. Consequently, the models were configured in a way that reflects the average performance of the best selected hyperparameters. Table 1 presents the methods utilized for our experiments as well as their respective parameters based on the implementations found on scikit-learn and xgboost packages [52,53].

Table 1.
Base estimators and hyperparameters.
The training set was segmented for the peak and non-peak detection and evaluation following the previously mentioned time series split and mean absolute error was selected as the error metric for the quantification of predictive potency since the dataset contains zeros for the time periods where some clients were not monitored. After the examination of three different perspectives corresponding to three different sets of indices as described in the previous subsection, three lists of estimators were formed for each cluster. The first list contained the three most performant estimators on the sets of observations related to peak indices, the second list included the most performant estimators on the sets of observations associated with non-peak indices and the third list was the concatenated list of the previous two after the removal of duplicate estimator entries. Three stacking ensemble models were developed based on the estimators of each list with linear regression being the second level estimator. Additionally, six voting regression models were developed, featuring uniform and occurrence-based weighting strategies based on the concatenated membership list. All models featuring the tuned ensemble members were trained on the full training set of observations and evaluated on the holdout test set.
This project was developed in Python 3.8.8 using the packages pandas 1.2.3, numpy 1.21.5 and scipy 1.7.3 for data processing, tslearn 0.5.2 for clustering, scikit-learn 1.0.2 and xgboost 1.3.3 for predictive modeling and matplotlib 3.5.1 for visualization. The model implementation and the experiments were executed on a desktop computer with an AMD Ryzen 1700X processor, 8 gigabytes of RAM, and a NVIDIA 1080Ti graphics processor. Additionally, the code of this forecasting approach and case study is publicly available on GitHub [54].
2.6. Performance Metrics
In this section, we define and outline the main performance metrics utilized for the evaluation of all nine ensemble estimators in the cluster-based aggregate framework. Firstly, mean absolute error (MAE) [55] is utilized for the peak and non-peak influenced member selection as well as the final ensemble evaluation since it is a common and simple loss function that measures the average error of continuous variables without considering error direction. Given the total number of test observations , the estimated values and the actual values , the mean absolute error can be computed using the following formula:
Furthermore, the mean absolute percentage error (MAPE) [56] is included for the generalized measurement of relative error since it is an interpretable scale-independent metric. The usage of MAPE is restricted to the evaluation of the total demand for the final ensemble models due to the existence of zeros in some of the clustered time series. Given the same information for the calculation of MAE, MAPE can be defined as:
Secondly, the mean squared error (MSE) [57] and root mean squared error (RMSE) [58] are included as quadratic scale-dependent loss functions that could denote the impact of large errors since errors are squared before they are averaged. Additionally, the simultaneous examination of MAE and RMSE could determine the variation of errors for the ensemble models since a large difference between the values of those metrics could denote great variance in the individual errors of the test sample, indicating the occurrence of large errors. Given the same information used to calculate the previous metrics, MSE and RMSE could be calculated using the following formulae:
3. Results
In this section, we analyze the performance of the ensemble models by providing an overview of the error metrics based on the data available in this case study. Since this project focuses on the implementation of a deterministic membership selection technique on stacking and voting ensembles, all nine ensemble estimators discussed in the experiments presented earlier are compared to the standalone estimators in the cluster-based aggregate framework in order to distinguish the most efficient ensemble structures and outline the potential performance benefits of this approach. The main motivation for the development and subsequent comparison of those models stems from the uncertainty that some values could introduce during the training of estimators, resulting in regions where suboptimal fitting could occur. Intuitively, unstable estimator performance could be observed in regions where local maxima could be detected due to the sudden change in the value of electricity consumption or due to the irregularity of the consumption pattern, resulting in large errors. Therefore, the prioritization of points or regions where peaks are not observed would be considered as a safer starting point for the fair performance comparison of base learners and the examination of optimization benefits through the combination of multiple estimated time series. Since the discovery of base learner combinations that reduce the forecasting error in a given machine learning task is a challenging process and a given ensemble structure does not guarantee improved performance when applied to different datasets, adaptive ensembles could result in more robust estimation and the examination of fundamental time series characteristics such as peak and non-peak points could lead to flexible ensemble structures that yield performance benefits when diverse time series are processed, such as the clustered load of different client types. The performance comparison includes the computation of MAPE, MAE, MSE and RMSE for all models. The stacking ensembles utilizing the list of best peak estimators, the list of best non-peak estimators and the merged list containing a single instance of all members from both lists, are labeled as SRP, SRNP and SRA, respectively. Similarly, the voting ensemble structures featuring a uniform weight strategy are labeled as VRUP, VRUNP and VRUA. Lastly, the voting ensemble models featuring an occurrence-based weight strategy derived from the frequencies of estimators in the merged list before duplicate removal are labeled as VROWP, VROWNP and VROWA, respectively.
Figure 15 presents the error metrics of the standalone models as well as the ensemble structures on the optimal assignment of clients into two clusters based on the silhouette analysis. The examination of MAPE and MSE shows that the ensemble methods following this membership selection strategy yielded improved forecasting performance when compared to the standalone estimators. Additionally, the simultaneous examination of MAE and RMSE indicates that there is a small variation in the magnitude of the errors in standalone models and each ensemble structure but the occurrence of large errors is unlikely. The stacking and voting regressors utilizing the membership list derived from performant non-peak estimators yielded the most distinct improvement and relatively smaller benefits can be observed from the ensembles based on peak membership. Furthermore, the implementation of a uniform and occurrence-based weight strategy resulted in similar forecasting performances for voting ensembles that utilized the peak as well as the merged membership lists. However, a more substantial difference in error metrics can be observed in the comparison of the voting estimators utilizing the non-peak membership list, where uniform weights resulted in lower metrics.
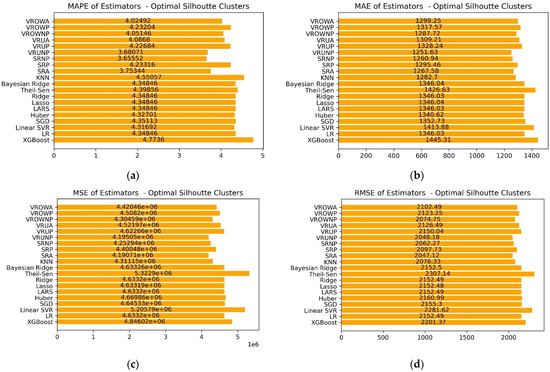
Figure 15.
Error metric comparison for standalone estimators and structural ensemble models given the optimal clustering denoted by the silhouette method. The panels present the following metrics: (a) Mean absolute percentage error. (b) Mean absolute error. (c) Mean squared error. (d) Root mean squared error.
Figure 16 provides an overview of the error metrics derived from the inertia-based elbow method for optimal clustering. Similar to the examination of the silhouette optimal cluster selection, it is evident that the stacking and voting ensembles based on the non-peak membership list yield improved performance in this forecasting task, resulting in lower MAPE values. The values of MAE, MSE and RMSE for those models remain close to the lowest value of the KNN regressor, denoting the overall stability of the ensemble models. However, this observation does not hold true for all ensemble models since voting ensembles following an occurrence-based weight strategy yielded MAE, MSE and RMSE values closer to the average standalone predictors while yielding a smaller improvement of MAPE, denoting fewer substantial benefits derived from the model fusion in this case.
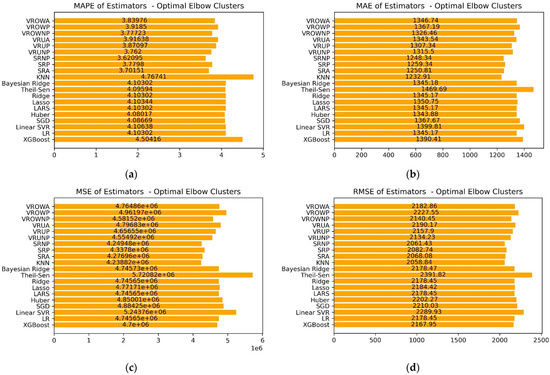
Figure 16.
Error metric comparison for standalone estimators and structural ensemble models given the optimal clustering denoted by the elbow method. The panels present the following metrics: (a) Mean absolute percentage error; (b) Mean absolute error; (c) Mean squared error; (d) Root mean squared error.
Consequently, the inspection of both optimal clustering strategies shows that the implementation of flexible ensemble models in the cluster-based framework could improve the overall load forecasting performance when considering ensemble members that performed well on the prediction of non-peak observations during training. This deduction partly verifies the intuitive assumption that regions with sudden peaks in the clustered data may introduce a level of uncertainty which could result in unstable estimator behavior, leading to the unfair performance evaluation of base learners for membership selection. The uniformly weighted voting regressor based on non-peak influenced membership achieved, approximately, a 16.5% improvement over the average MAPE value of standalone estimators while utilizing the silhouette analysis for optimal clustering. Similarly, the stacking non-peak influenced regressor achieved a 17.2% improvement in the experiment. Furthermore, the experiment utilizing the elbow method for the selection of the optimal number of clusters showed that the previously examined models yielded a 10.4% and 13.8% MAPE improvement over the average of the standalone values, respectively. It is worth noting that in this second experiment the stacking regressor considering the merged list of peak and non-peak influenced membership yielded an 11.9% MAPE improvement, showing slightly better performance when compared to the VRUNP model. The examination of those metrics denotes an overall reduction in MAPE, comparable to the average reduction observed in the implementation of ensemble learning for short-term forecasting over different sets of estimators in recent research results presented in [19] as well as [59,60]. Since the successful implementation of an ensemble model typically yields a small improvement when compared to the best base estimator, a similar behavior can be observed in our study, achieving approximately the same level of error metric reduction when compared to relevant studies. The main difference highlighted in our approach is related to the discovery and examination of optimal base estimator sets from a wider estimator space in an attempt at eliminating the uncertainty of the initial ensemble member selection process. Therefore, our work aims to shift the focus from the individual proposal of specific ensemble structures to member selection strategies that generate appropriate sets of estimators for the training of a given time series.
4. Discussion
This research project examined the performance of structurally flexible ensemble estimators on the cluster-based aggregate framework for the improvement of short-term total demand predictions. The proposed approach implemented a membership selection strategy focusing on the evaluation of peak and non-peak data points given different perspectives that consider sets of observations on the actual as well as the estimated time series derived from segments of the training set. This process resulted in the development of nine ensemble models consisting of three stacking and six voting regression structures that covered several ensemble member combinations. Consequently, a case study was carried out for the evaluation of those models on a dataset including the load profiles of 370 clients. The research findings indicated that the ensemble models were able to improve the forecasting accuracy for clustered load estimation, resulting in more robust combinatorial structures. The experiments showed that voting and stacking ensembles influenced by the membership set of non-peak performant base learners could provide more significant forecasting improvements, yielding MAPE scores of 3.68 and 3.65, respectively, when silhouette analysis is used for optimal clustering. Similarly, those models achieved MAPE scores of 3.76 and 3.62, respectively, when an inertia-based elbow method was utilized for optimal clustering and the stacking ensemble including peak as well as non-peak performant base learners resulted in adequate performance, achieving a MAPE value of 3.7.
Since the discovery of efficient base learner combinations is not a straightforward process and one specific ensemble structure may not guarantee the reduction in error in a given forecasting task, we believe that this adaptive approach contributes towards the deterministic member selection through the inspection of fundamental time series characteristics. Additionally, it is evident that a standalone estimator may not perform well when processing time series that exhibit different patterns, resulting in unstable overall metrics for the aggregate values. The average performance of some robust and optimally tuned standalone estimators could be drastically affected by the input data as well as the data collection process. Different electricity consumer types and various data collection characteristics such as the start of the load monitoring period could impact the prediction accuracy and the recalibration process of the forecasting models. Consequently, it could be observed that some estimators may outperform others with minimal context related to the justification of the difference in performance, leading to less interpretable implementations that follow arbitrary model selection processes. Therefore, the main advantage of this proposed approach is the efficient combination of base learners through a simple and well-defined process that could be seamlessly integrated in ensemble regression tasks for the energy sector. The performance hinderances introduced by the extreme cases where the response of a standalone estimator yields irregularly high error metrics on certain data points are diminished through the consideration of multiple estimated time series. Moreover, the focus is shifted towards the inspection of data points where the estimators are expected to perform optimally, reinforcing the fairness of comparison and setting additional criteria towards member selection in ensemble learning.
On the other side of the spectrum, there are a few disadvantages in the application of this method that should be mentioned for completeness. Since cluster-based frameworks often lead to computationally expensive models, the integration of flexible ensemble learners in this paradigm could increase the computational cost due to the training and processing of multiple estimators. Therefore, the complexity of each candidate base learner could be restricted since the tuning, training and processing of several deep neural network architectures and hybrid structures would increase the execution time substantially due to the increased number of hyperparameters as well as the overall latency encountered when loading and storing data during training, rendering them inefficient for short-term forecasting tasks and real time applications. However, advances in distributed computing could remedy this issue through the parallelization of data processing tasks. It is evident that the proposed approach could be implemented in multi-threaded distributed systems since there is a clear distinction between standalone and aggregate tasks. Consequently, the inspection of each base learner and the membership evaluation process for each cluster could be easily parallelized, resulting in a scalable hybrid structure.
Future research projects could explore different time series characteristics and combine them in order to extend the current membership evaluation strategy, resulting in the discovery of additional ensemble structures. Since this study primarily focused on load features, isolating their impact for the inspection of base learners in an environment containing only the load profiles from different types of customers anonymously, the inspection of time series elements derived from different types of features could provide significant insights towards the development of more robust ensemble estimators, depending on data availability. Furthermore, the proposed strategy could be applied to multiple unclustered time series or load profiles processed in different clustering or aggregation frameworks in order to examine the performance of adaptive peak and non-peak ensemble learning through more diverse experiments. Lastly, the impact of several vital parameters to the definition of the forecasting tasks could be studied, such as the forecasting horizon, and the customer base size could be studied in an attempt at quantifying the scalability of this approach in different client groups as well as the versatility of the method.
5. Conclusions
The intricacies of very short-term total electricity demand forecasting tasks add a layer of ambiguity to combinatorial modeling since the challenges derived from increasingly diverse and rapidly growing client groups could hinder the efficiency of robust estimators. Additionally, the inclusion of estimators in hybrid and combinatorial approaches is often influenced by expert knowledge and general performance indicators in similar forecasting tasks. Therefore, the criteria for the selection of base estimators are not explicitly linked to the shape and the individual characteristics of a given dataset, resulting in a seemingly arbitrary estimator selection process. This phenomenon could be easily observed in the implementation of ensemble learning models where small refinements to the error metrics are expected when several estimators are optimally combined. Since this optimal combination differs depending on the available data and the problem formulation, this performance boost is not guaranteed and is often derived from extensive experimentation.
In this project, we presented an estimator selection strategy that generates base estimator sets capable of achieving this performance boost through the examination of peak and non-peak observations from multiple evaluation perspectives during training. This membership strategy aims to adapt to different shapes of time series and output estimator groups that outperform the standalone estimators when combined in a stacking or voting ensemble structure. The case study presented in this work focused on the effect of load features and utilized the cluster-based aggregate framework since the clustered time series derived from a diverse set of clients monitored from different starting points would introduce a degree of unpredictability between consecutive samples that would intuitively cause certain models to underperform as the shape of the time series could be drastically different between clusters. As a result, three stacking models and six voting models were evaluated on a group of clustered time series for the prediction of total demand based on the most important numbers of clusters derived from the silhouette and elbow methods. Through our experiments, we observed that base estimator sets generated from the proposed strategy led to consistently more performant ensemble models when the criteria influencing the selection of estimators involved the examination of non-peak observations. It is worth noting that in some ensemble structures the merged set of estimators selected from the examination of peak and non-peak observations performed adequately well. In conclusion, this work attempts to reinforce the basis of ensemble and hybrid modeling through a well-defined and easily interpretable criteria-based approach which is tuned based on the input time series in order to boost predictive performance.
Author Contributions
Conceptualization, D.K.; methodology, D.K.; software, D.K.; validation, D.K., D.B., A.D. and L.H.T.; formal analysis, D.K.; investigation, D.K.; resources, D.K. and A.I.A.; data curation, D.K. and A.I.A.; writing—original draft preparation, D.K.; writing—review and editing, D.K., D.B., A.D. and L.H.T.; visualization, D.K. and A.I.A.; supervision, D.B., A.D. and L.H.T.; project administration, D.B. and A.D. All authors have read and agreed to the published version of the manuscript.
Funding
This research received no external funding.
Institutional Review Board Statement
Not applicable.
Informed Consent Statement
Not applicable.
Data Availability Statement
Data are available in a publicly accessible repository. The data used in this study are openly available in [UCI Machine Learning Repository] at [https://archive.ics.uci.edu/ml/datasets/ElectricityLoadDiagrams20112014] (accessed on 1 July 2022), reference number [50]. The dataset was processed as the input for the design and performance assessment of the load forecasting approach described in this article.
Conflicts of Interest
The authors declare no conflict of interest.
References
- Impram, S.; Varbak Nese, S.; Oral, B. Challenges of renewable energy penetration on power system flexibility: A survey. Energy Strategy Rev. 2020, 31, 100539. [Google Scholar] [CrossRef]
- Tsampasis, E.; Bargiotas, D.; Elias, C.; Sarakis, L. Communication challenges in Smart Grid. MATEC Web Conf. 2016, 41, 01004. [Google Scholar] [CrossRef]
- Barai, G.; Krishnan, S.; Venkatesh, B. Smart metering and functionalities of smart meters in smart grid—A review. In Proceedings of the 2015 IEEE Electrical Power and Energy Conference (EPEC), London, ON, Canada, 26–28 October 2015. [Google Scholar] [CrossRef]
- Muñoz, A.; Sánchez-Úbeda, E.; Cruz, A.; Marín, J. Short-term Forecasting in Power Systems: A Guided Tour. In Handbook of Power Systems II; Springer: Berlin, Germany, 2010; pp. 129–160. [Google Scholar] [CrossRef]
- Manojpraphakar, T. Energy Demand Prediction Using Linear Regression. In Proceedings of the International Conference on Artificial Intelligence, Smart Grid and Smart City Applications, Coimbatore, India, 3–5 January 2019; Springer: Cham, Switzerland, 2020; pp. 407–417. [Google Scholar] [CrossRef]
- Cetinkaya, M.; Acarman, T. Next-Day Electricity Demand Forecasting Using Regression. In Proceedings of the 2021 International Conference on Artificial Intelligence and Smart Systems (ICAIS), JCT College of Engineering and Technology, Coimbatore, India, 25–27 March 2021. [Google Scholar] [CrossRef]
- Tang, N.; Mao, S.; Wang, Y.; Nelms, R. Solar Power Generation Forecasting with a LASSO-Based Approach. IEEE Internet Things J. 2018, 5, 1090–1099. [Google Scholar] [CrossRef]
- Sivanantham, G.; Gopalakrishnan, S. Stochastic Gradient Descent Optimization Model for Demand Response in a Connected Microgrid. KSII Trans. Internet Inf. Syst. 2022, 16, 97–115. [Google Scholar] [CrossRef]
- Levenbach, H. Time series forecasting using robust regression. J. Forecast. 1982, 1, 241–255. [Google Scholar] [CrossRef]
- Dang, X.; Peng, H.; Wang, X.; Zhang, H. Theil-Sen Estimators in a Multiple Linear Regression Model. Olemiss Edu, 2008. Available online: http://home.olemiss.edu/~xdang/papers/MTSE.pdf (accessed on 1 July 2022).
- Wang, Y.; Sun, S.; Chen, X.; Zeng, X.; Kong, Y.; Chen, J.; Guo, Y.; Wang, T. Short-term load forecasting of industrial customers based on SVMD and XGBoost. Int. J. Electr. Power & Energy Syst. 2021, 129, 106830. [Google Scholar]
- Gelper, S.; Croux, C. Least Angle Regression for Time Series Forecasting with Many Predictors. 2008. Available online: https://www.researchgate.net/publication/255575037_Least_angle_regression_for_time_series_forecasting_with_many_predicpred (accessed on 1 July 2022).
- Wahid, F.; Kim, D. A Prediction Approach for Demand Analysis of Energy Consumption Using K-Nearest Neighbor in Residential Buildings. Int. J. Smart Home 2016, 10, 97–108. [Google Scholar] [CrossRef]
- Guo, Q.; Feng, Y.; Sun, X.; Zhang, L. Power Demand Forecasting and Application based on SVR. Procedia Comput. Sci. 2017, 122, 269–275. [Google Scholar] [CrossRef]
- Leite Coelho da Silva, F.; da Costa, K.; Canas Rodrigues, P.; Salas, R.; López-Gonzales, J.L. Statistical and Artificial Neural Networks Models for Electricity Consumption Forecasting in the Brazilian Industrial Sector. Energies 2022, 15, 588. [Google Scholar] [CrossRef]
- Arvanitidis, A.I.; Bargiotas, D.; Daskalopulu, A.; Kontogiannis, D.; Panapakidis, I.P.; Tsoukalas, L.H. Clustering Informed MLP Models for Fast and Accurate Short-Term Load Forecasting. Energies 2022, 15, 1295. [Google Scholar] [CrossRef]
- Arvanitidis, A.I.; Bargiotas, D.; Daskalopulu, A.; Laitsos, V.M.; Tsoukalas, L.H. Enhanced Short-Term Load Forecasting Using Artificial Neural Networks. Energies 2021, 14, 7788. [Google Scholar] [CrossRef]
- Kontogiannis, D.; Bargiotas, D.; Daskalopulu, A. Minutely Active Power Forecasting Models Using Neural Networks. Sustainability 2020, 12, 3177. [Google Scholar] [CrossRef]
- Wang, L.; Mao, S.; Wilamowski, B.; Nelms, R. Ensemble Learning for Load Forecasting. IEEE Trans. Green Commun. Netw. 2020, 4, 616–628. [Google Scholar] [CrossRef]
- Cho, J.; Yoon, Y.; Son, Y.; Kim, H.; Ryu, H.; Jang, G. A Study on Load Forecasting of Distribution Line Based on Ensemble Learning for Mid- to Long-Term Distribution Planning. Energies 2022, 15, 2987. [Google Scholar] [CrossRef]
- Motlagh, O.; Berry, A.; O’Neil, L. Clustering of residential electricity customers using load time series. Appl. Energy 2019, 237, 11–24. [Google Scholar] [CrossRef]
- Bellahsen, A.; Dagdougui, H. Aggregated short-term load forecasting for heterogeneous buildings using machine learning with peak estimation. Energy Build. 2021, 237, 110742. [Google Scholar] [CrossRef]
- Ackerman, S.; Farchi, E.; Raz, O.; Zalmanovici, M.; Dube, P. Detection of data drift and outliers affecting machine learning model performance over time. arXiv 2021, arXiv:2012.09258. [Google Scholar] [CrossRef]
- Lu, J.; Liu, A.; Dong, F.; Gu, F.; Gama, J.; Zhang, G. Learning under Concept Drift: A Review. IEEE Trans. Knowl. Data Eng. 2018, 31, 2346–2363. [Google Scholar] [CrossRef]
- Ceperic, E.; Ceperic, V.; Baric, A. A Strategy for Short-Term Load Forecasting by Support Vector Regression Machines. IEEE Trans. Power Syst. 2013, 28, 4356–4364. [Google Scholar] [CrossRef]
- Wijaya, T.; Vasirani, M.; Humeau, S.; Aberer, K. Cluster-based aggregate forecasting for residential electricity demand using smart meter data. In Proceedings of the 2015 IEEE International Conference on Big Data (Big Data), Santa Clara, CA, USA, 29 October–1 November 2015. [Google Scholar] [CrossRef]
- Karthika, S.; Margaret, V.; Balaraman, K. Hybrid short term load forecasting using ARIMA-SVM. In Proceedings of the 2017 Innovations in Power and Advanced Computing Technologies (i-PACT), Vellore, India, 21–22 April 2017. [Google Scholar] [CrossRef]
- Laurinec, P.; Lucká, M. Usefulness of Unsupervised Ensemble Learning Methods for Time Series Forecasting of Aggregated or Clustered Load. In New Frontiers in Mining Complex Patterns; Springer: Cham, Switzerland, 2018; pp. 122–137. [Google Scholar] [CrossRef]
- Fu, X.; Zeng, X.; Feng, P.; Cai, X. Clustering-based short-term load forecasting for residential electricity under the increasing-block pricing tariffs in China. Energy 2018, 165, 76–89. [Google Scholar] [CrossRef]
- Li, Y.; Che, J.; Yang, Y. Subsampled support vector regression ensemble for short term electric load forecasting. Energy 2018, 164, 160–170. [Google Scholar] [CrossRef]
- Bian, H.; Zhong, Y.; Sun, J.; Shi, F. Study on power consumption load forecast based on K-means clustering and FCM–BP model. Energy Rep. 2020, 6, 693–700. [Google Scholar] [CrossRef]
- Sarajcev, P.; Jakus, D.; Vasilj, J. Ensemble learning with time-series clustering for aggregated short-term load forecasting. In Proceedings of the 2020 IEEE 20th Mediterranean Electrotechnical Conference (MELECON), Palermo, Italy, 16–18 June 2020. [Google Scholar] [CrossRef]
- Cini, A.; Lukovic, S.; Alippi, C. Cluster-based Aggregate Load Forecasting with Deep Neural Networks. In Proceedings of the 2020 International Joint Conference on Neural Networks (IJCNN), Glasgow, UK, 19–24 July 2020. [Google Scholar] [CrossRef]
- Kontogiannis, D.; Bargiotas, D.; Daskalopulu, A.; Tsoukalas, L.H. A Meta-Modeling Power Consumption Forecasting Approach Combining Client Similarity and Causality. Energies 2021, 14, 6088. [Google Scholar] [CrossRef]
- Stratigakos, A.; Bachoumis, A.; Vita, V.; Zafiropoulos, E. Short-Term Net Load Forecasting with Singular Spectrum Analysis and LSTM Neural Networks. Energies 2021, 14, 4107. [Google Scholar] [CrossRef]
- Zafeiropoulou, M.; Mentis, I.; Sijakovic, N.; Terzic, A.; Fotis, G.; Maris, T.I.; Vita, V.; Zoulias, E.; Ristic, V.; Ekonomou, L. Forecasting Transmission and Distribution System Flexibility Needs for Severe Weather Condition Resilience and Outage Management. Appl. Sci. 2022, 12, 7334. [Google Scholar] [CrossRef]
- Phyo, P.-P.; Byun, Y.-C.; Park, N. Short-Term Energy Forecasting Using Machine-Learning-Based Ensemble Voting Regression. Symmetry 2022, 14, 160. [Google Scholar] [CrossRef]
- Ensemble Learning Techniques. Available online: https://towardsdatascience.com/ensemble-learning-techniques-6346db0c6ef8 (accessed on 1 July 2022).
- Wolpert, D. Stacked generalization. Neural Netw. 1992, 5, 241–259. [Google Scholar] [CrossRef]
- Tugay, R.; Gündüz Öğüdücü, Ş. Demand Prediction using Machine Learning Methods and Stacked Generalization. In Proceedings of the 6th International Conference on Data Science, Technology and Applications, Madrid, Spain, 24–26 July 2017. [Google Scholar] [CrossRef]
- 1.11. Ensemble Methods. Available online: https://scikit-learn.org/stable/modules/ensemble.html#voting-regressor (accessed on 1 July 2022).
- An, K.; Meng, J. Voting-Averaged Combination Method for Regressor Ensemble. In Lecture Notes in Computer Science; Springer: Berlin, Germany, 2010; pp. 540–546. [Google Scholar] [CrossRef]
- Humaira, H.; Rasyidah, R. Determining The Appropiate Cluster Number Using Elbow Method for K-Means Algorithm. In Proceedings of the 2nd Workshop on Multidisciplinary and Applications (WMA) 2018, Padang, Indonesia, 24–25 January 2018. [Google Scholar] [CrossRef]
- Shahapure, K.; Nicholas, C. Cluster Quality Analysis Using Silhouette Score. In Proceedings of the 2020 IEEE 7th International Conference on Data Science and Advanced Analytics (DSAA), Sydney, Australia, 6–9 October 2020. [Google Scholar] [CrossRef]
- Yuan, C.; Yang, H. Research on K-Value Selection Method of K-Means Clustering Algorithm. J 2019, 2, 226–235. [Google Scholar] [CrossRef]
- Shutaywi, M.; Kachouie, N.N. Silhouette Analysis for Performance Evaluation in Machine Learning with Applications to Clustering. Entropy 2021, 23, 759. [Google Scholar] [CrossRef]
- Time Series Clustering—Tslearn 0.5.2 Documentation. Available online: https://tslearn.readthedocs.io/en/stable/user_guide/clustering.html (accessed on 1 July 2022).
- Senin, P. Dynamic Time Warping Algorithm Review. 2008. Available online: https://www.researchgate.net/publication/228785661_Dynamic_Time_Warping_Algorithm_Review (accessed on 1 July 2022).
- Scipy.Signal.Find_Peaks—SciPy v1.8.1 Manual. Available online: https://docs.scipy.org/doc/scipy/reference/generated/scipy.signal.find_peaks.html (accessed on 1 July 2022).
- UCI Machine Learning Repository: Electricity Load Diagrams 2011–2014 Data Set. Available online: https://archive.ics.uci.edu/ml/datasets/ElectricityLoadDiagrams20112014 (accessed on 1 July 2022).
- 3.2. Tuning the Hyper-Parameters of an Estimator. Available online: https://scikit-learn.org/stable/modules/grid_search.html#randomized-parameter-search (accessed on 1 July 2022).
- Scikit-Learn: Machine Learning in Python—Scikit-Learn 1.1.1 Documentation. Available online: https://scikit-learn.org/stable/ (accessed on 1 July 2022).
- Python Package Introduction—xgboost 1.6.1 Documentation. Available online: https://xgboost.readthedocs.io/en/stable/python/python_intro.html (accessed on 1 July 2022).
- GitHub—Dimkonto/Structural-Ensemble-Regression-Models-for-CBAF: Structural Ensemble Regression for Cluster-Based Aggregate Electricity Load Forecasting. Available online: https://github.com/dimkonto/Structural-Ensemble-Regression-Models-for-CBAF (accessed on 11 July 2022).
- Fürnkranz, J.; Chan, P.; Craw, S.; Sammut, C.; Uther, W.; Ratnaparkhi, A.; Jin, X.; Han, J.; Yang, Y.; Morik, K.; et al. Mean Absolute Error. In Encyclopedia of Machine Learning; Springer: Boston, MA, USA, 2011; p. 652. [Google Scholar] [CrossRef]
- de Myttenaere, A.; Golden, B.; Le Grand, B.; Rossi, F. Mean Absolute Percentage Error for regression models. Neurocomputing 2016, 192, 38–48. [Google Scholar] [CrossRef]
- Wang, Z.; Bovik, A. Mean squared error: Love it or leave it? A new look at Signal Fidelity Measures. In IEEE Signal Processing Magazine; IEEE: New York, NY USA, 2009; Volume 26, pp. 98–117. [Google Scholar] [CrossRef]
- Hodson, T. Root mean square error (RMSE) or mean absolute error (MAE): When to use them or not. Geosci. Model Dev. Discuss. 2022, 15, 5481–5487. [Google Scholar] [CrossRef]
- Von Krannichfeldt, L.; Wang, Y.; Hug, G. Online Ensemble Learning for Load Forecasting. IEEE Trans. Power Syst. 2021, 36, 545–548. [Google Scholar] [CrossRef]
- Sengar, S.; Liu, X. Ensemble approach for short term load forecasting in wind energy system using hybrid algorithm. J. Ambient. Intell. Humaniz. Comput. 2020, 11, 5297–5314. [Google Scholar] [CrossRef]
Publisher’s Note: MDPI stays neutral with regard to jurisdictional claims in published maps and institutional affiliations. |
© 2022 by the authors. Licensee MDPI, Basel, Switzerland. This article is an open access article distributed under the terms and conditions of the Creative Commons Attribution (CC BY) license (https://creativecommons.org/licenses/by/4.0/).