1. Introduction
The existing high energy utilization rates in the energy sector mean that the required improvements must be made in terms of returns on capital investments and material costs. Currently, the consumption of electricity by industrial enterprises in certain regions of Russia can reach about 44% (in the Nenets Autonomous Area). For example, the Ural Federal District is one of the richest mineral regions in Russia, with a share of electricity consumption by industrial enterprises constituting about 30% and with the likelihood of such consumption increasing due to the active development of this region and the construction of new industrial enterprises [
1]. The construction and further operation of any industrial enterprise is preceded by the design stage, involving the definition of the key characteristics of each system and the design of the power supply system (PSS). The efficiency of the PSS is determined by the reliable evaluation of the characteristics of electrical loads, with the calculated results then shown in graphs [
2]. This is due to the fact that the calculated characteristics electrical loads provide information to inform the solutions for most of the technical and economic issues in the design stage.
It should also be noted that the issues regarding energy efficiency and energy savings are very acute, and the measures taken to achieve certain goals are widely implemented in all production cycles, meaning that it is important to take these changes into consideration when calculating electrical loads by using probabilistic calculation methods [
3].
Reference [
4] reviewed how the need for efficient electrical energy consumption has greatly expanded in the process industries. The article dealt with industrial enterprises for the recognition of electricity consumption in a two-echelon supply model with a stochastic lead-time demand and imperfect production, while considering the distribution-free approach. Reference [
5] discussed the impact of electric energy on production cost recovery, transport discounts and process quality improvement in two algorithms are developed using an analytical approach to obtain the optimal solution. With the increase in the varieties products and the increasing uncertainty about product demand, the production preparation time is a significant factor in addressing these issues. The basic calculation methods applied today, such as the method of ordered diagrams (MOD) [
6] and the modified statistical method (MSM) [
7], lead to significant errors in estimating the design loads, as shown in References [
7,
8]. This is due to the fact that the applied methods are static modeling methods that involve uninformative mathematical model, while the indicated design characteristics can solve only a very limited range of technical and economic issues; as a consequence, the efficiency of the PSS is reduced. As such, increasing the energy efficiency of mineral resource enterprises by improving the methods for calculating electrical loads is an urgent task, as these initial datasets are used in design stage.
The methods for calculating electrical loads used currently in our country and abroad refer to probabilistic methods based on a mathematical model of the “random variable” [
9,
10]. It should be noted that we are talking about methods of raising mining enterprises and not about load forecasting based on an analysis of the current situation, and, for example, by using neural networks to predict both long-term and short-term load electrical curves [
11]. The basis for all further research in the field of calculating electrical loads and, in fact, the first method based on the principles of the probability of a random process, is the statistical method; there is no need to dwell separately on the shortcomings, because they have already been repeatedly described in Reference [
8].
The statistical method was replaced by the MOD [
6], which made it possible to reduce errors in the estimation of electrical loads by creating a database of initial data of individual load schedules, but still remained insufficiently reliable; this is due to several shortcomings, especially the following: discrepancy between the design technological modes and the actual operating modes [
12].
Today, all mining enterprises are designed by using an MSM [
7]. Developed more than 25 years ago, these methods are the basis of approved methods for calculation of electrical loads [
13]. Such a long break in research can be explained by the sufficient reliability of the MSM, combined with the simplicity of performing engineering calculations, but the last few years have been practically associated with a revolution in the mining and processing industry, increasing the automation of technological processes through the use of modern energy-efficient equipment [
14,
15]. Moreover, the effect of such changes must be taken into account, including in the calculation methods [
16].
Separately, it is worth mentioning the alternative calculation methods considered in the works of Stepanova [
17]; the main advantage of the method under consideration is the consideration of correlation dependencies both at the level of individual and group loads, as well as additional calculation of dynamic characteristics [
18]. At the same time, the disadvantages include a small base of initial data on consumers, which, in turn, does not allow a reliable analysis of this method applied to consumers at mining enterprises, as well as the lack of accounting from the introduction of modern means to improve energy efficiency [
19].
Table 1 presents the contributions to this paper.
3. Dynamic Characteristics of Electrical Load Curves
As such, when determining the calculated loads, it is also necessary to take into account dynamic characteristics, such as peaks and valleys, surges and load dips, and load fluctuations, which will contribute to forecasting calculations of electrical loads with a higher confidence probability. It becomes possible by using a dynamic modeling method, such as the hierarchical–structural method (HSM) [
24].
The method is realized for load curves of general-purpose industrial and special industrial consumers, and the base of the method is an extended database containing the source data with additional characteristics (
Table 5), such as the normalized correlation function (NCF) and its parameters presented in the
Table 5. The necessity of using additional characteristics is connected to a fundamental change of the initial information about the individual load curves of the consumers. Physically, the NCF describes the probabilistic causation for the sequence of ordinates of the random process of changing the load, and due to the fact that the technological processes in mining enterprises have a steady-state mode of operation, the load curves are stationary [
25].
Our analysis of the literary sources [
8,
16,
26] showed that the correlation functions (CF) for all general-purpose industrial and special industrial consumers can be approximated by using the following analytical expressions:
where
is the variance of an individual electrical load curve (ELC), the parameter
characterizes the attenuation of correlations between the ordinates of the initial ELC, and
is the natural frequency of oscillations of the CF, due to the repeatability of technological operations. The main idea of this study is to identify differences in the NCF and its parameters for the same consumers, both with and without using means to improve energy efficiency.
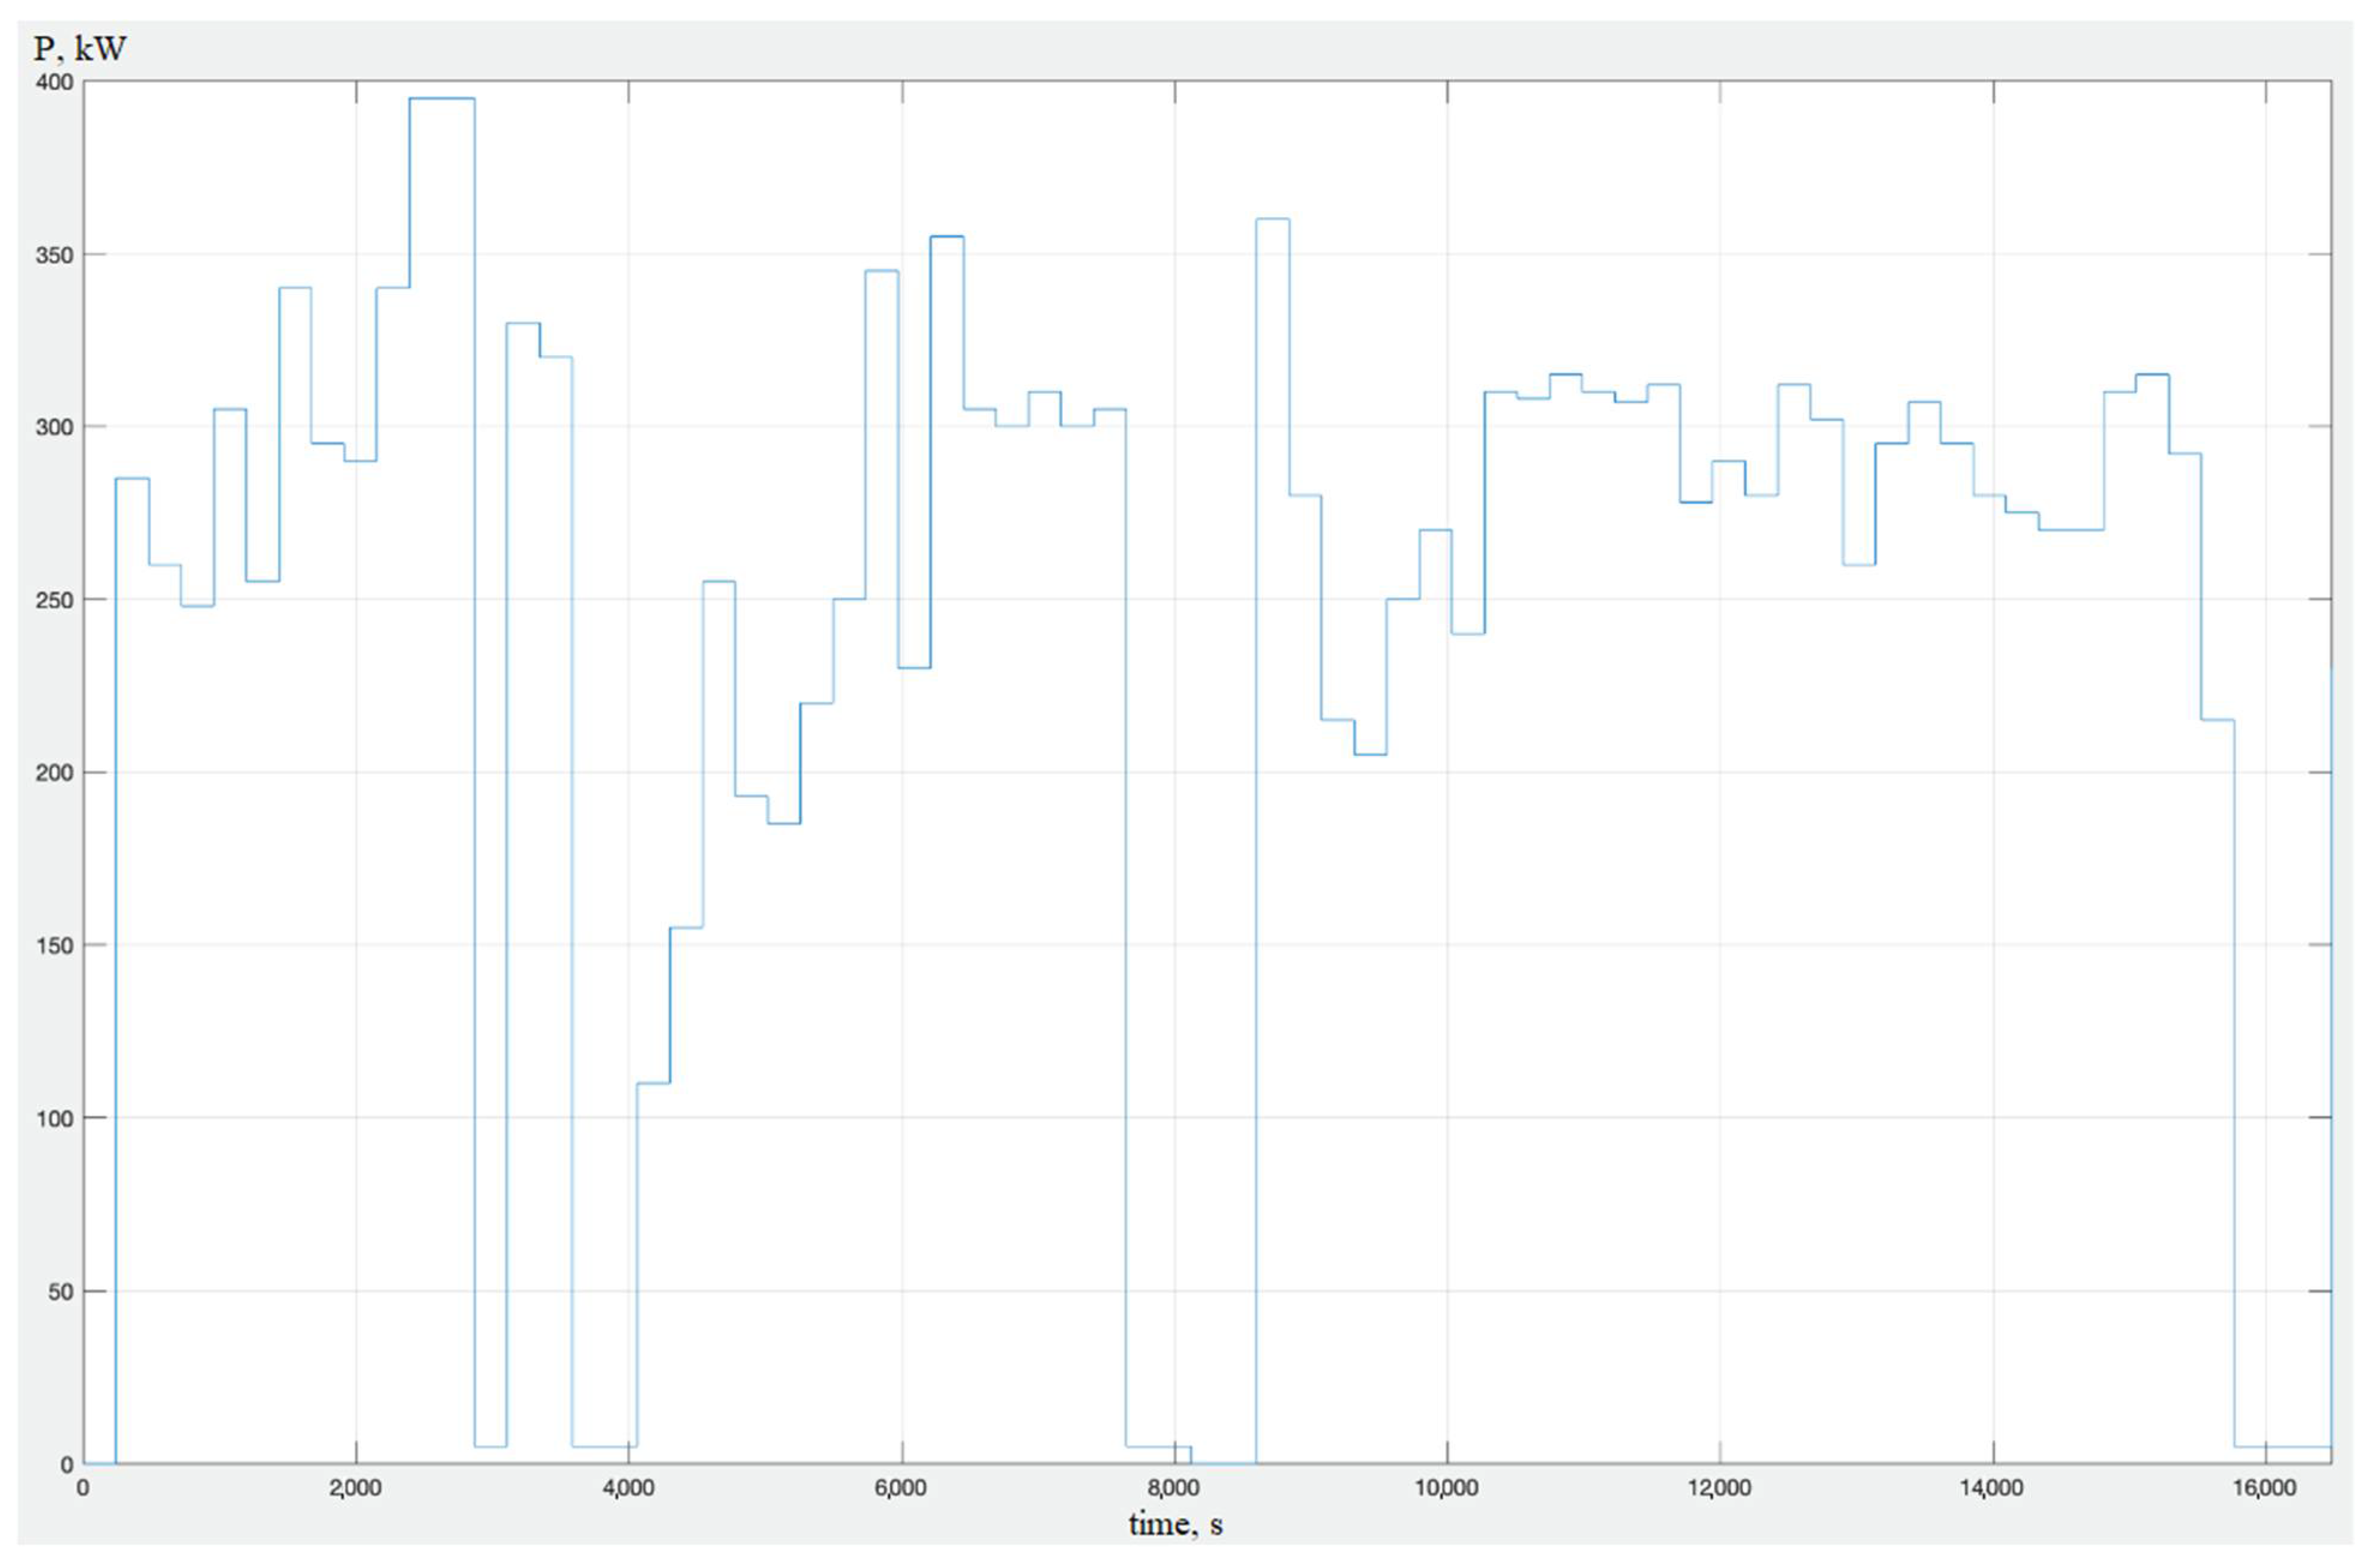
Experimental studies aimed at determining the NCF and its parameters of the electrical load curves were carried out in operating mining enterprises, the main consumers of which are general-purpose industrial consumers. The load curves were compared with and without using energy-efficiency means—in this case, with and without the use of a variable-frequency drive. The initial curves and step-wise determination of the type and parameters of the NCF for a conveyor unit with power motor of
are given by way of example. Earlier, in Reference [
24], the authors described a detailed algorithm for determining the NCF, so this article presents only the main points.
Determination of the average load value (
Table 6).
The given time values, namely the correlation time (
), the sampling interval
, and the recording time (
) (
Table 7), were determined according to the initial load curve (
Figure 1 and
Figure 2). Then, using the MATLAB software package, the experimental NCF was calculated.
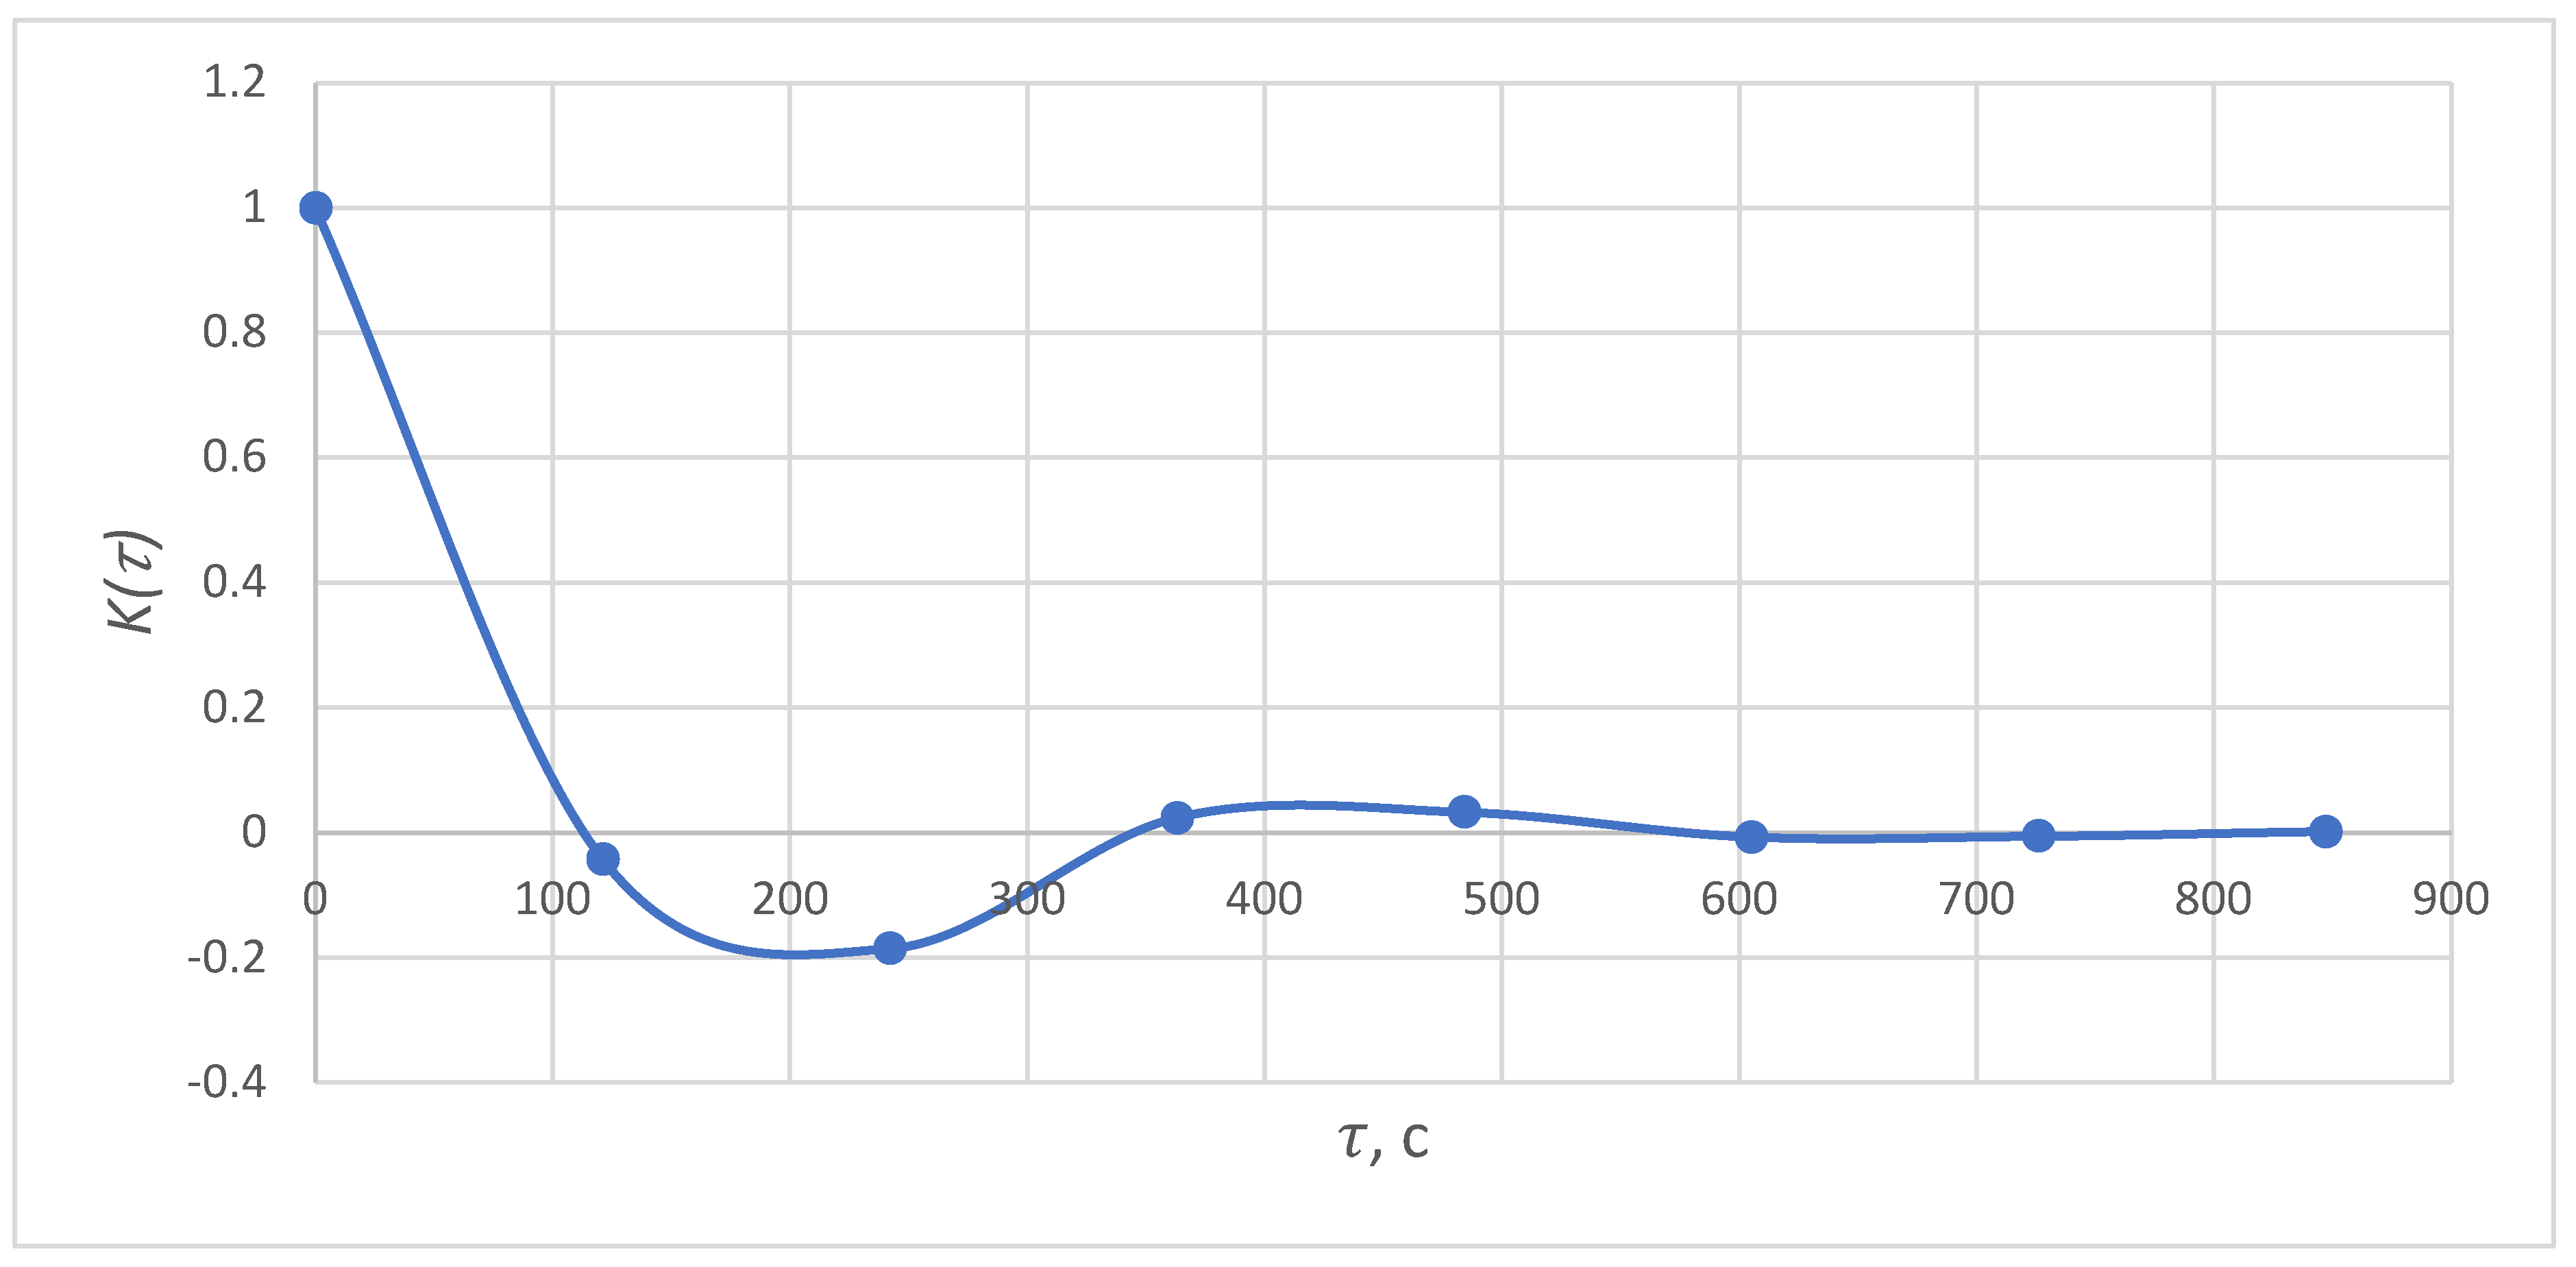
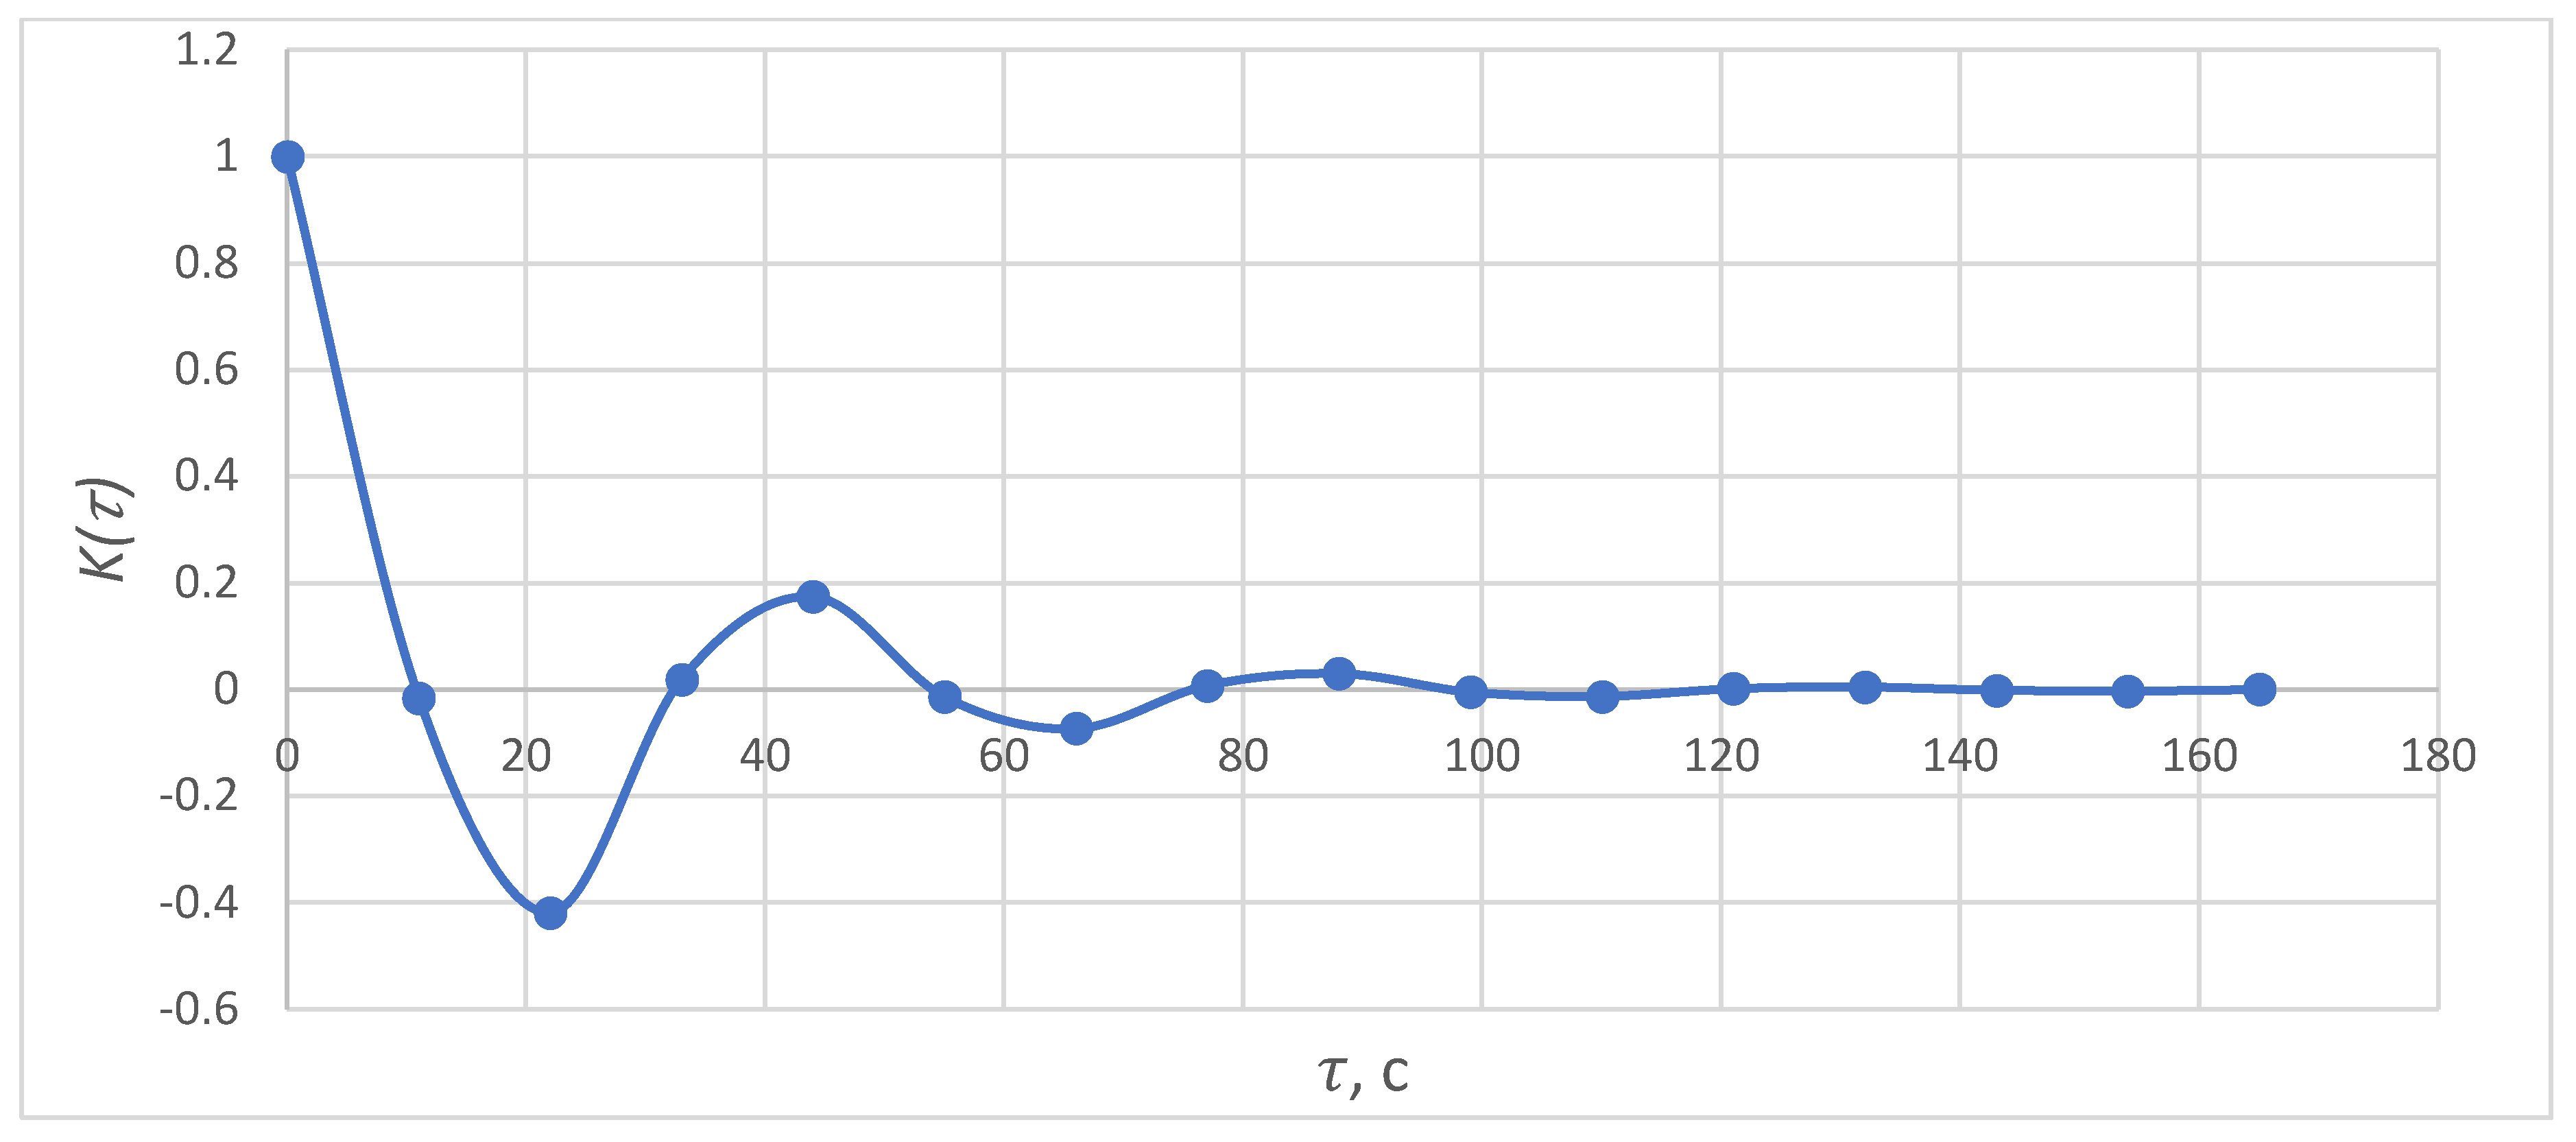
Using the least-squares method, we determined the parameters of a theoretical NCF, as shown in
Table 8, and identified its type (
Figure 3 and
Figure 4).
The conducted studies showed that general-purpose industrial electric drives belong to the same type of NCF with and without the use of a variable-frequency drive, although the difference in the NCF parameters determines the calculated values of the entire power supply system. As a result, there is a need to supplement the new information database.
4. Group Load Curve Forecasting Using a Probabilistic Calculation Method
The above operations are also valid for group curves; however, due to the variations in PSS by structure and functionality, it is necessary to perform electrical load curve forecasting by summing individual curves in order to obtain equivalent parameters of the NCF [
13]. To do this, at the level of the group curves, it is necessary to use the following analytical expression:
where DP is the variance of the active load curve, and
is the equivalent factor characterizing the attenuation of the correlation between the ordinates of the summed ELCs [
27].
The group load curve
P(), which is formed according to the individual curves,
(
), gives the following definitions for
:
In the formula, the numbers of curves with NCF types 1, 2, 3, and 4, respectively, are taken for
Taking into account the differences in the type and parameters of the NCF for individual consumers, in Formula (6), we determine the variance of
peaks and
valleys of the ELCs in the averaging interval
:
Methodology for Calculating Load Estimation Parameters
The characteristics of electrical load curves, such as peaks and valleys, make it possible to determine the following main parameters:
- -
Determination of the conductor section according to the condition of heating and economic density;
- -
Determination of minimum and maximum power losses;
- -
Determination of voltage deviation.
The expression for determining the definition of
peaks is as follows:
and for
valleys, it is as follows:
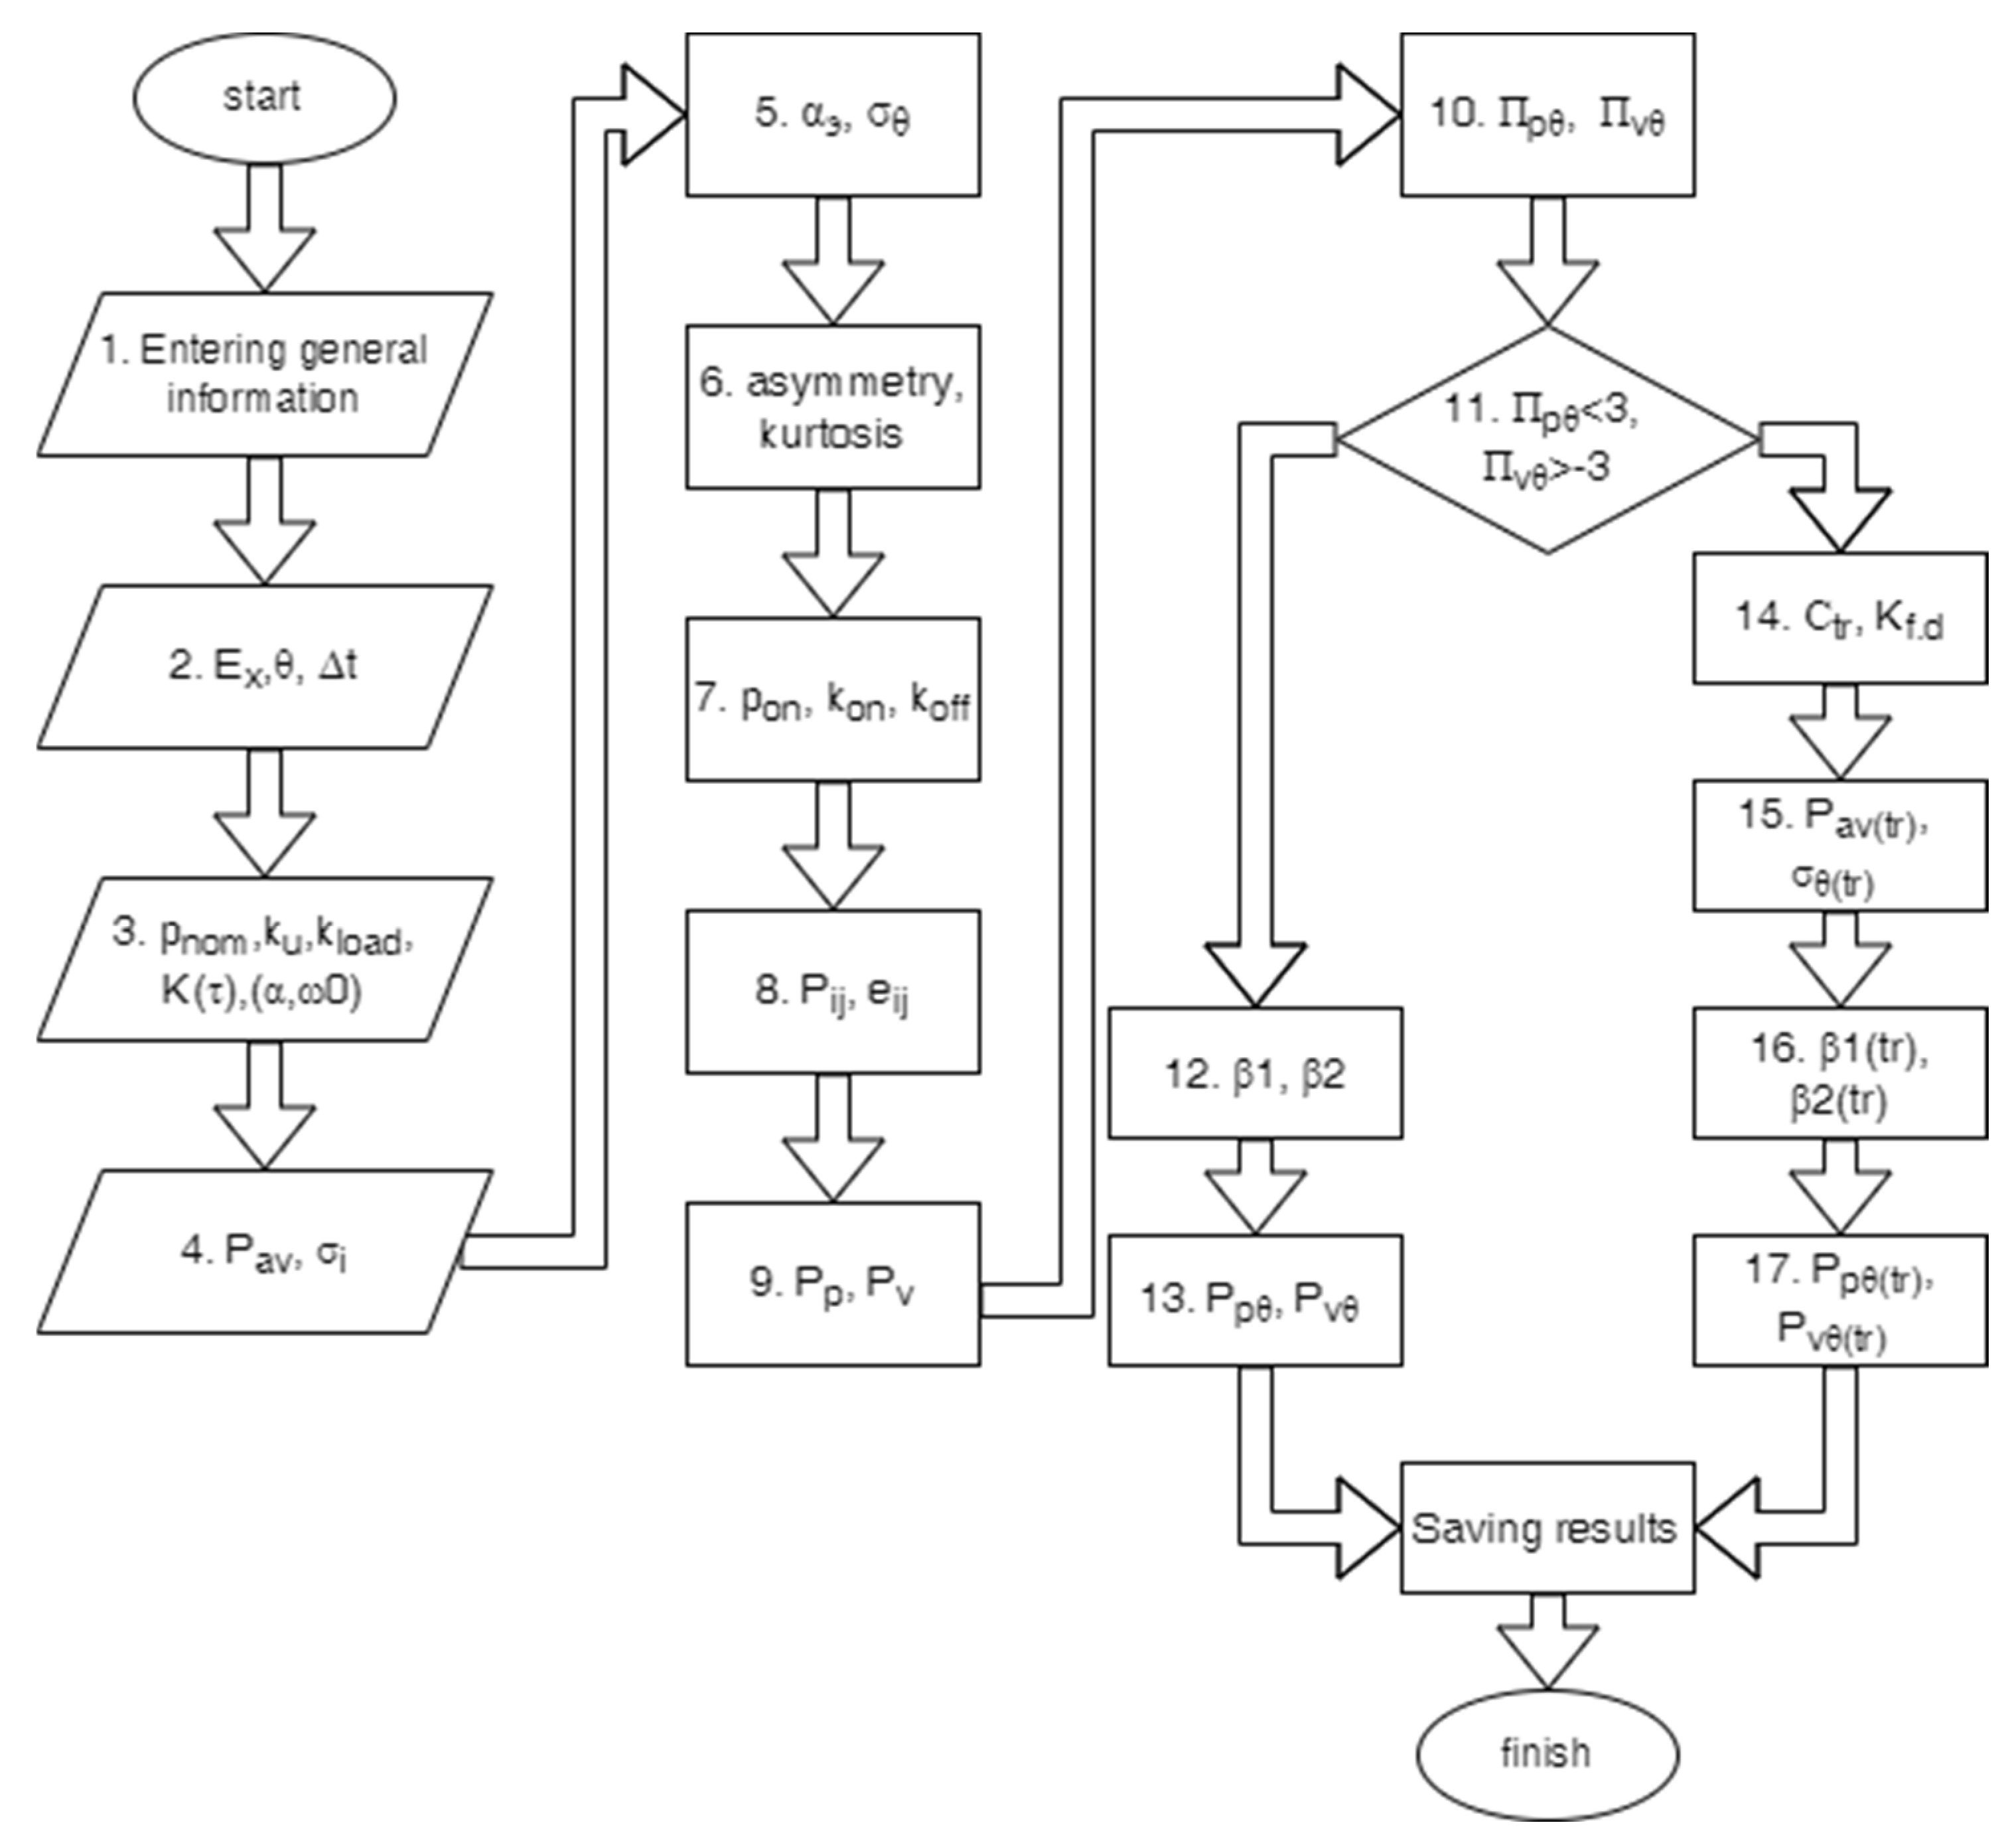
Similar to other methods of calculation of electrical loads, the HS method has its own clear sequence of actions that must be performed to obtain a result, so the task is to simplify as much as possible and create an algorithm that would not require using other sources to search information. It makes the database for the individual consumers important. Such an algorithm was developed and is presented in
Figure 9.
Following each block of the algorithm, it is necessary to consider what actions take place in the system:
- 1.
It is necessary to indicate complete information on the design object, as well as information on the designer performing the calculation;
- 2.
The value corresponding to the boundary probability (Ex), the required intervals of averaging (), and discretization (Δt);
- 3.
Using the dataset, select the necessary equipment from the list, with the specified characteristics. Next, a group of consumers is formed, and the calculation is carried out according to the group schedule;
- 4.
There is a calculation of the average active and reactive power, according to the following formulas:
Moreover, the calculation of the standard deviation of the active load curve is as follows:
- 5.
From this block, the transition to the group graph is implemented through an equivalent correlation function, and for this, as described above, it is necessary to determine the parameter
of the active load according to the following formula:
Moreover, the variance of the load group graph is calculated as follows:
- 6.
In block 6, the coefficients of asymmetry (skewness)
and kurtosis (
) are calculated, and for cases when the values of these coefficients are not equal to zero, it is necessary to use a law other than normal, for example, the Gram–Charlier type A distribution law [
16]:
- 7.
From block 7, we see that the algorithm for estimating the characteristics of group curve begins, taking into account the limitations of the limits of its change; thus, it is necessary to calculate additional characteristics for individual consumers, such as the following:
the value of the average power during switch-on time
,
the value of the switch-on factor as the probability of the “on” mode,
and the value of the switch-off factor as the probability of the “off” mode,
- 8.
Searching through the combinations of the
ith modes “on” and the
jth modes “off”, we see that the possible ordinates for the ELCs are determined, and using the theorem of the product of probabilities, we obtain the probability of a single combination [
28,
29]:
In Formula (11), the value m denotes the consumers operating in the “on” mode and with the corresponding , while the value n-m denotes the consumers operating in the “off” mode and with the corresponding .
The electrical load values correspond to the probabilities,
:
If the same load arises as a result of different combinations of different options for the work of consumers, there is a general probability of the occurrence of a given load arising in a given complex situation of probabilities [
30]. As a result, a statistical series is formed, according to which the step function of the probability distribution of the ordinates ELC
F(P) is constructed. To determine the actual lower (valley)
and upper (peak)
values of the limits of variation of the ordinates of the ELC, the principle of practical confidence of the theory of probabilities is used [
17]. According to this principle, practically impossible values of electrical loads are excluded from the obtained possible range of electrical load values from 0 to
, which have a lower probability than the boundary probability,
Ex = 0.05.
- 9.
Furthermore, according to Expressions (8) and (9) above, peaks and valleys are determined.
- 10.
From the theory of electrical loads, it is known that the calculated values of the load curve are limited by the upper limit, which is obtained by summing all individual consumers, as well as the lower limit, which corresponds to the complete absence of load. In real industrial conditions, the upper design limits are always higher than the real maximum values, while for the lower limit, the load is usually greater than zero. Consequently, due to the disagreement between the real and theoretical limits, an error occurs in the calculations of the peaks,
, and the valleys,
. For this, in addition to the normal distribution law, it is also necessary to consider the “truncated” normal distribution law, and for this, it is necessary to determine the values of the normalized upper and lower limits:
- 11.
Furthermore, according to the results obtained in block 10, the values are checked according to the normalized limits according to the following conditions:
- -
For , the calculation is performed for blocks 12 and 13 by using the normal distribution law;
- -
For , the calculation is performed in blocks 14–17, using the “truncated” normal distribution law.
- 12.
Calculation of statistical coefficients and calculation of power peaks and valleys.
- 13.
The use of the “truncated” normal distribution law is possible by introducing the truncation coefficient,
, into probabilistic models and form factor,
[
16,
31]:
After a series of mathematical transformations, the truncation coefficient,
, expressed through the normalized function,
, of the normal distribution law, is defined by the following formula [
32,
33]:
- 14.
Furthermore, taking into account the limits on the maximum and minimum values, the value of the average power and the standard deviation are determined as follows:
where
is the density of the standard normal distribution [
34]. The standard deviation of the load is as follows:
- 15.
In block 16, the statistical coefficients
and
are as follows:
- 16.
Next
—peaks
, and
—valleys
are calculated through the average power and statistical coefficients, taking into account truncation:
5. Discussion
Below are the results of the studies carried out according to the above-described methodology on the example of group curves of the load of conveyor units. A feature of this method is the determination of the actual consumption of active power, both with and without the use of variable-frequency drives. For this purpose, measurements of power consumption were taken at the facility during one of the most loaded shifts, with a duration of
h and with a sampling interval
[
17,
32] Such parameters allow for sufficient reliability when assessing the range of voltage deviations in electrical networks at the lower stages of the PSS (
Table 10).
The parameters of the NCF and the recalculated utilization factor (
) were defined by other authors earlier, with a detailed overview of the scientific research [
4,
26].
Furthermore, using the calculation formulae, we determined the probabilistic characteristics of the group ELC (
Table 11).
Furthermore, it is necessary to calculate the switch-on and -off factors according to (9) and (10), respectively, and also to calculate power consumption during the switch-on time according to (8). The data are summarized in
Table 12.
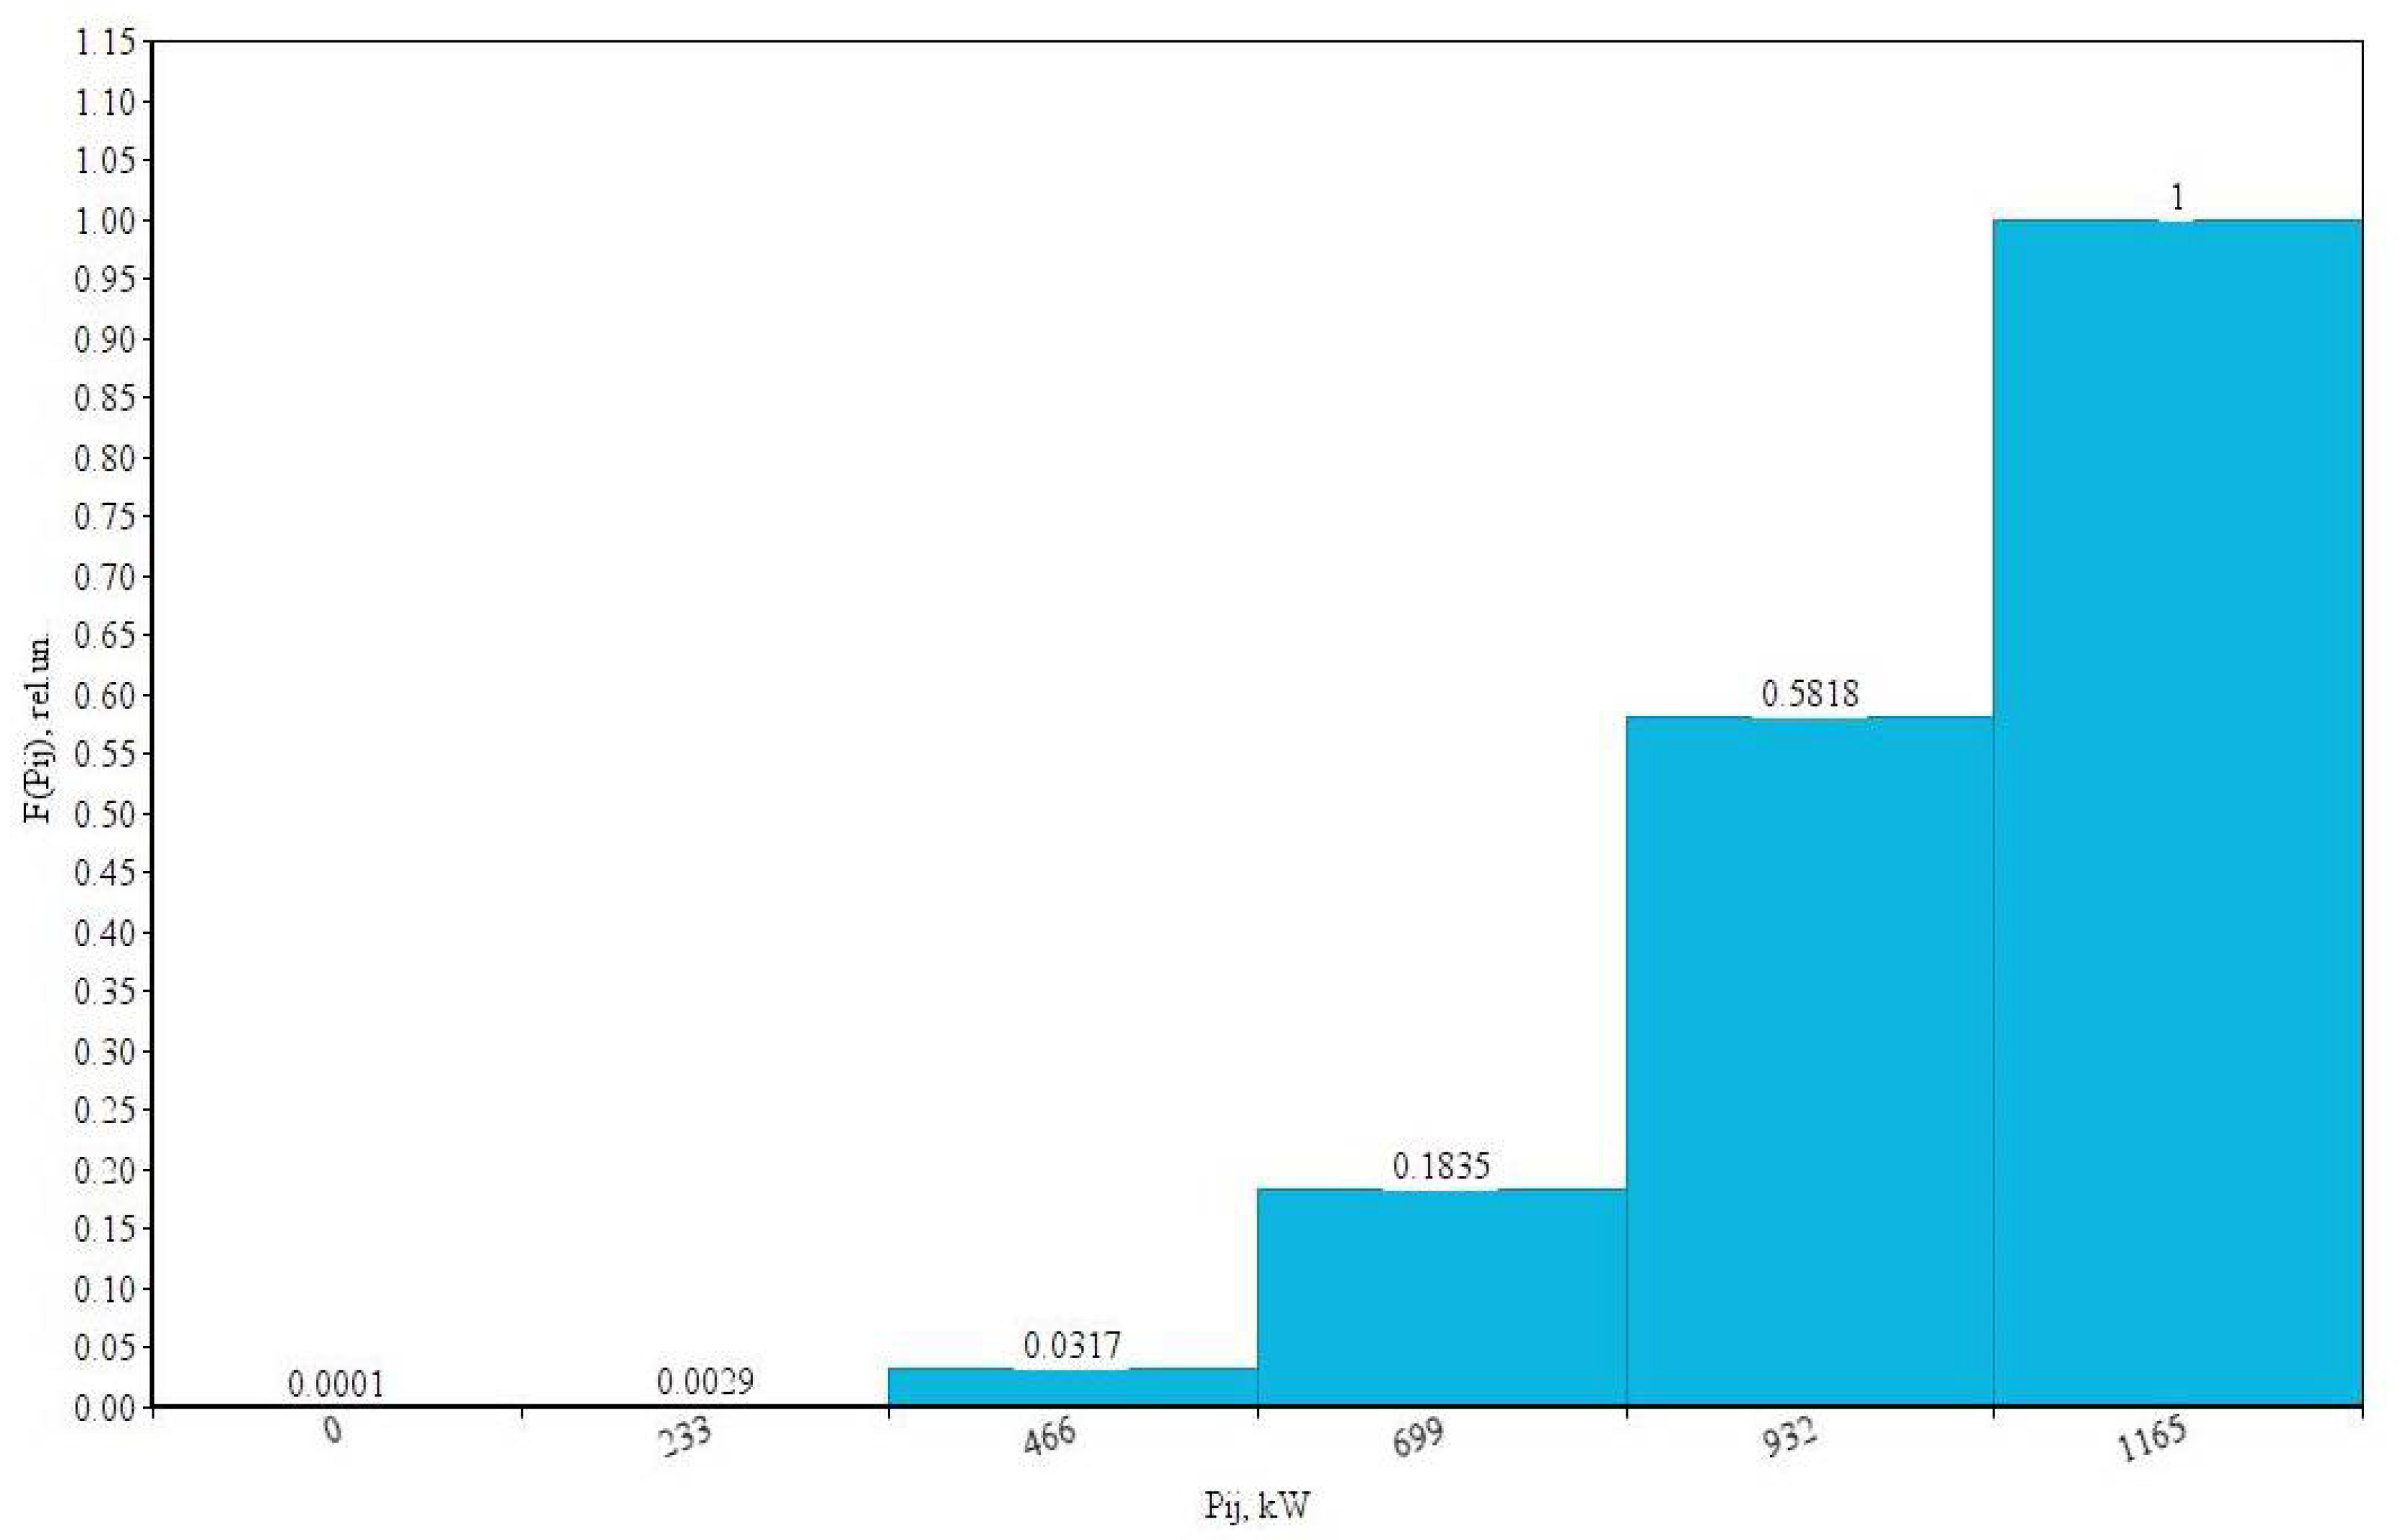
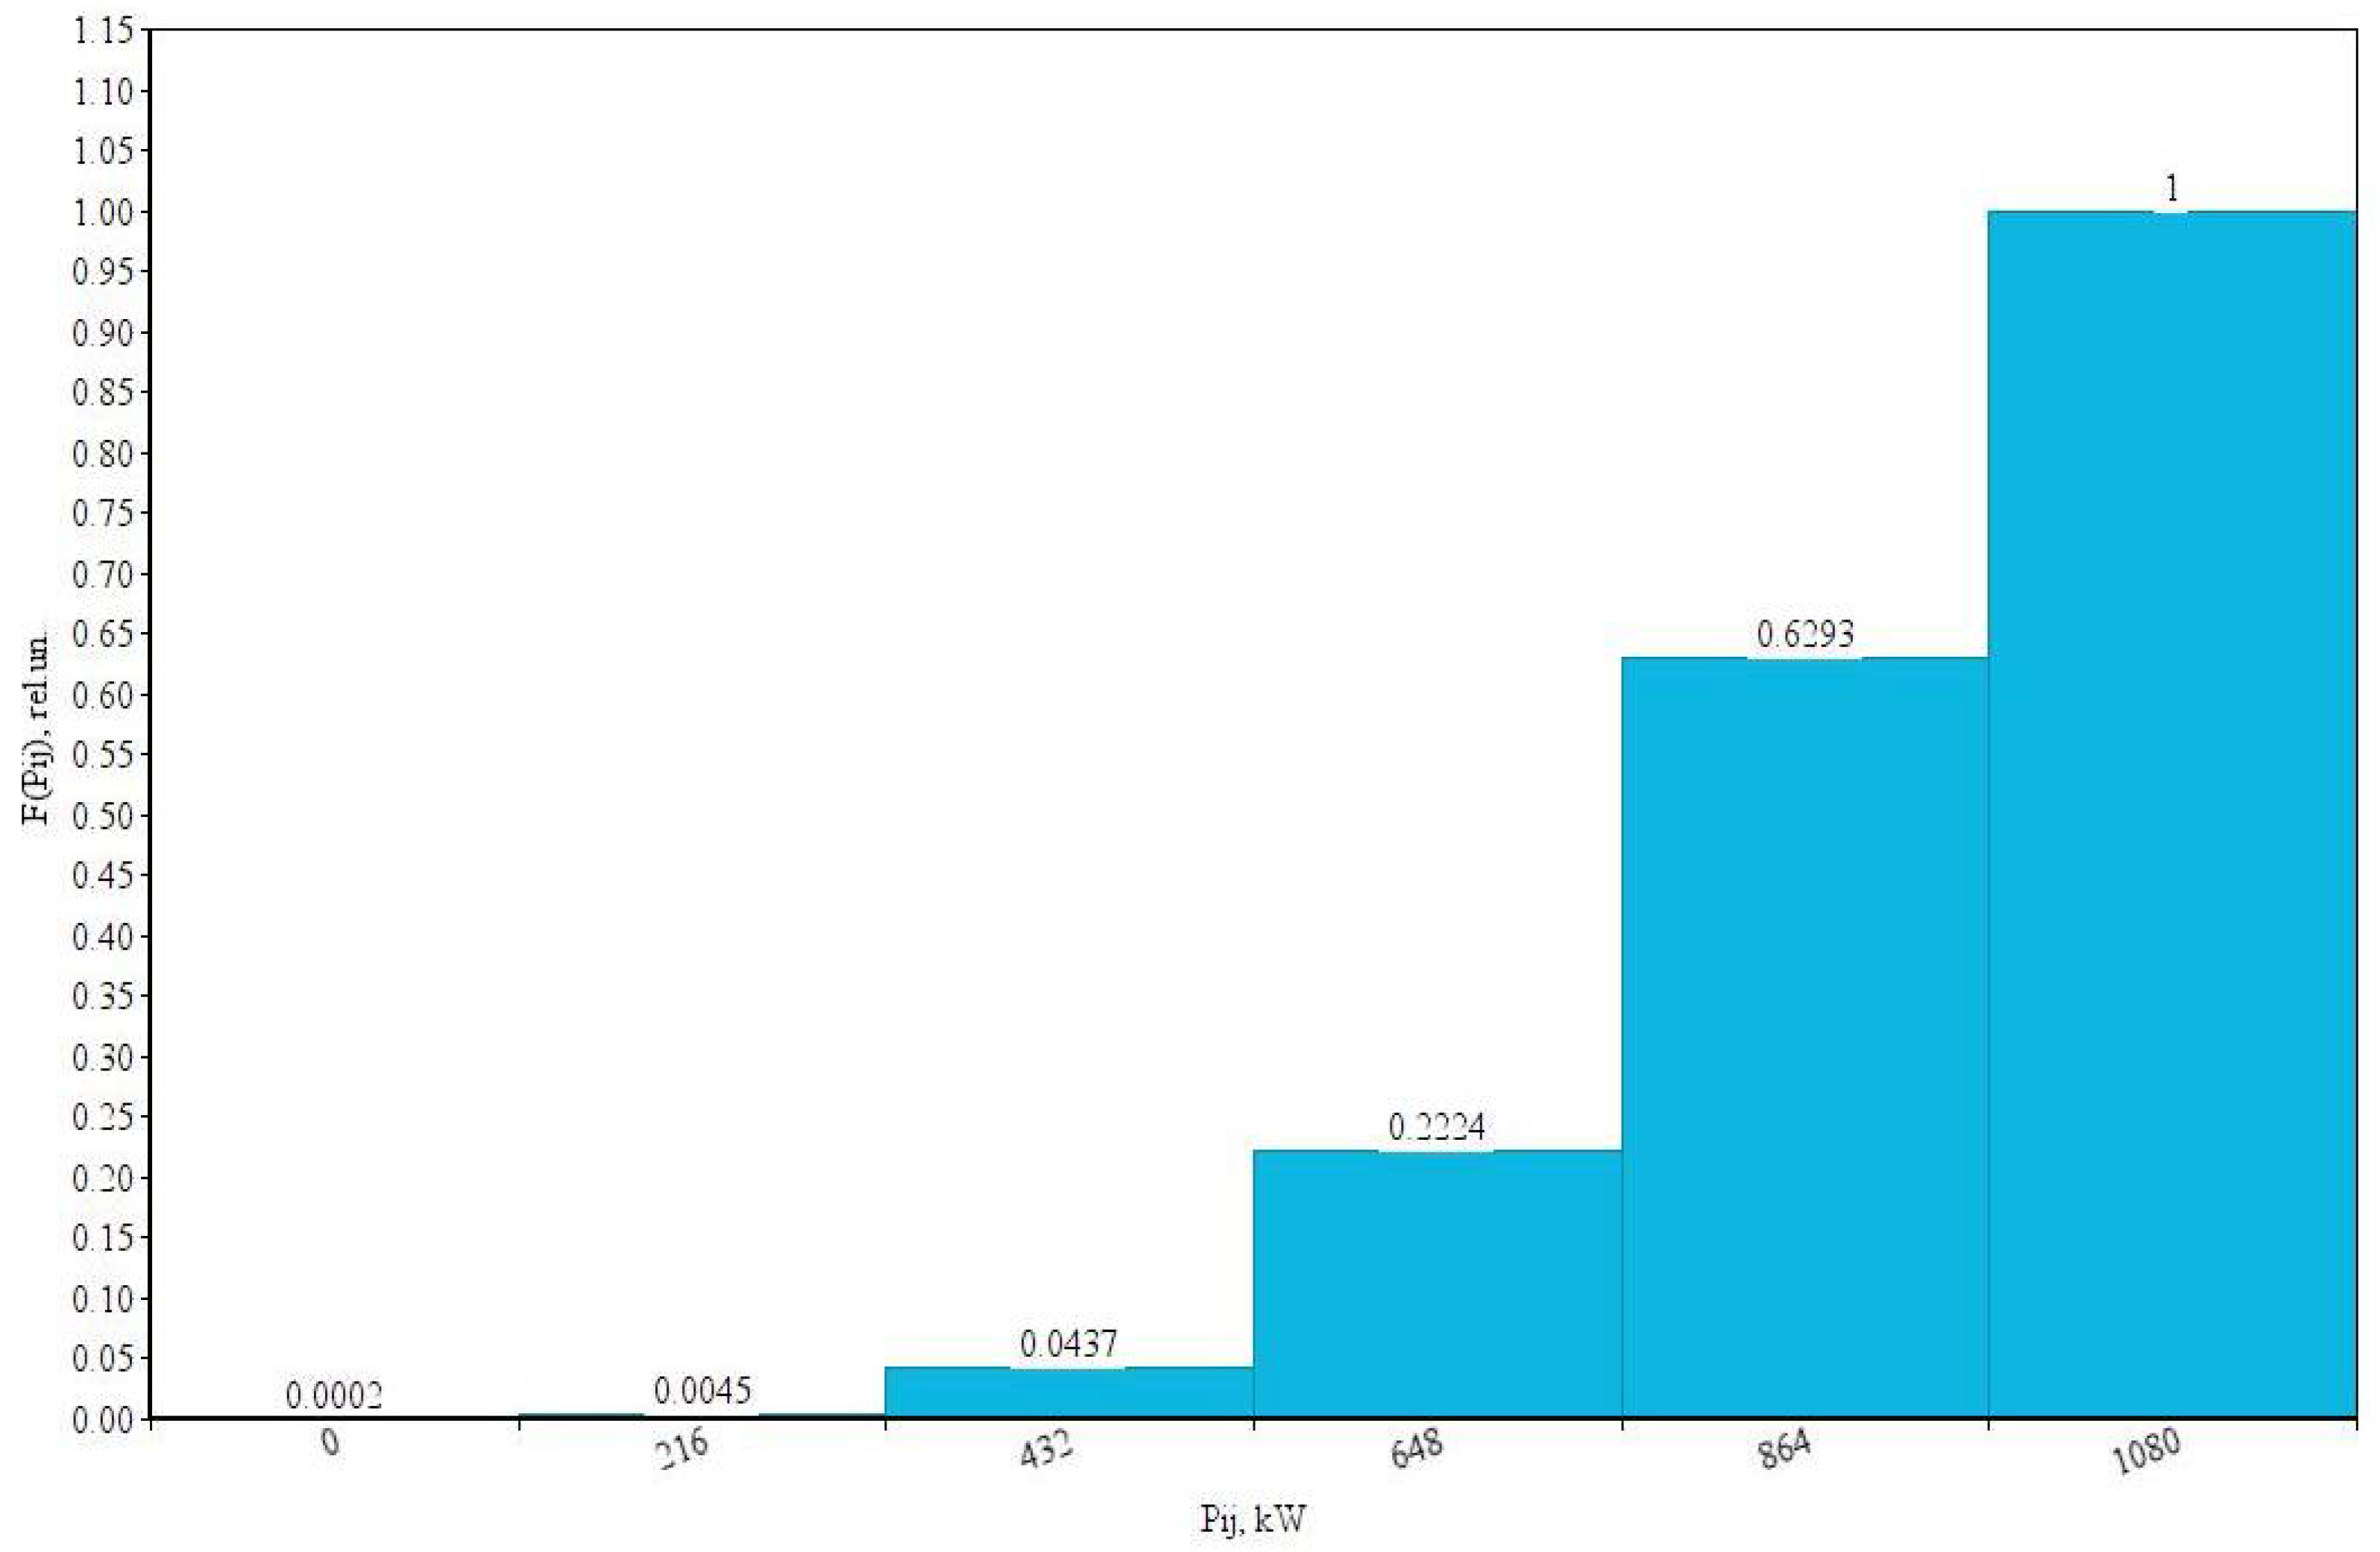
Using (11) and (12), we can determine the probabilities,
, of the occurrence of an electric load (
), according to which we can build two static series, which are summarized in
Table 13 and
Table 14 and shown in graphical form in
Figure 10 and
Figure 11 for a group curve, both without the use of and with the use of frequency control, respectively.
Having analyzed the obtained static series of the probability distribution of the group curve without using frequency control, we can now select the lowest and the highest , and then with the use of frequency control, the lowest and the highest .
Furthermore, using the specified averaging interval equal to 1 min, the upper and lower limits of change of
θ-ordinates are calculated according to (13) and (14). The calculation results for the normalized limits are summarized in
Table 15.
The results of intermediate studies proved the significant limitations in magnitude; therefore, further assessment of the calculated values of the peaks and valleys of conveyor units in order to compare the two distribution laws described above must be carried out by using these limitations, taking into account the truncation factor,
[
32,
35]. Using Equations (24)–(32), we obtained the values which are summarized in
Table 16.
The resulting errors in the assessment of the calculated values of peaks and valleys relative to the two laws of distribution of the normal law and the truncated normal law are calculated by using the following expression [
8]:
The error is no more than 6%, which does not go beyond the limits of permissible values of
[
36]; however, the use of a variable frequency drive is not considered, where the error is as follows:
This clearly goes beyond the limits of permissible values, causing us to consider a variable frequency drive as a separate load that has its own parameters.
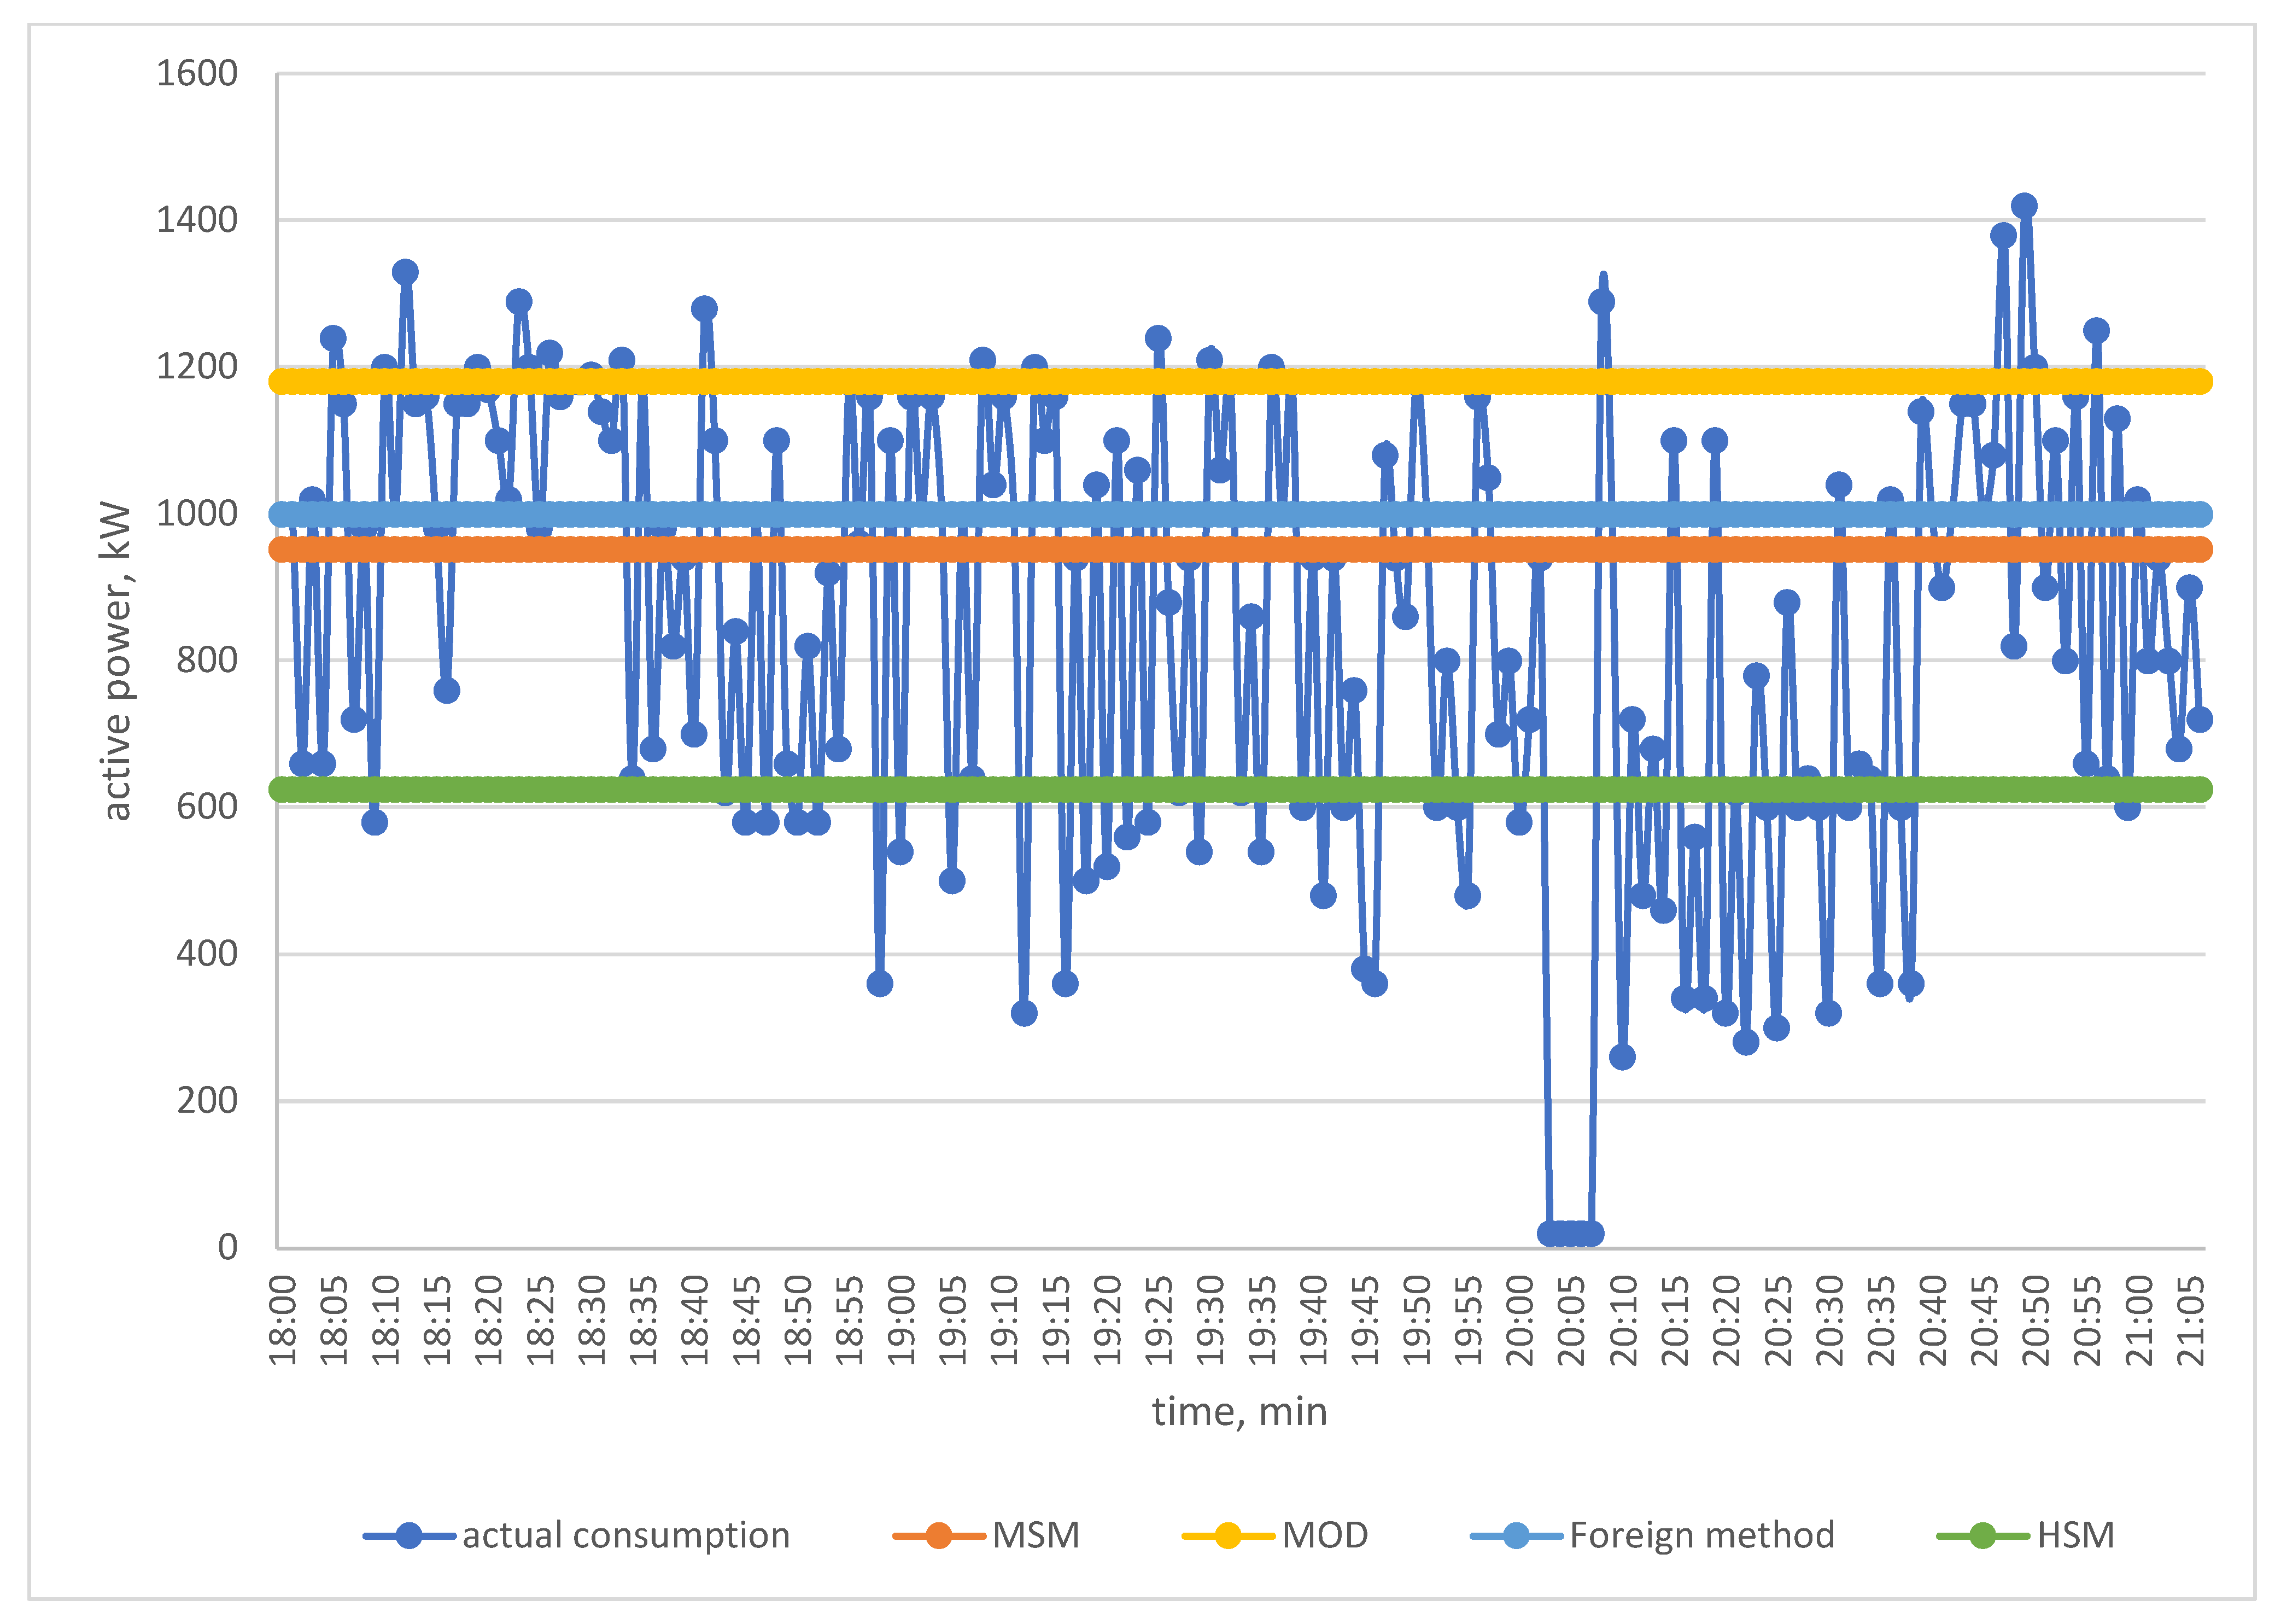
Foreign methods, as well as the method of ordered diagrams and the modified statistical method (
Table 17), do not allow the effects from using a variable-frequency drive to be assessed, and all attempts to do this by adjusting the utilization factor failed [
37,
38].
Figure 12 shows the values of the average calculated loads defined by using various methods.
6. Conclusions
In this study, a method was developed for determining the design calculated electrical loads of mining enterprises that also takes into account the dynamic characteristics of load changes, such as peaks and troughs, surges and load dips, and load fluctuations, which will solve the problems of performing electrical load calculations with a higher confidence probability. These load characteristics were not taken into account in previous studies. This has been shown to have a significant impact on the resulting design power. As a result of increasing the reliability of determining the calculated values of electrical loads, it became possible to make the right choice of power and switching electrical equipment for distribution and protection, which will lead to a reduction in material costs.
The experimental and theoretical studies were carried out personally at the mining facilities, while the gathering of initial data took about 2 years. The initial obtained data made it possible to expand the information base for various consumers, thereby increasing interest in using this calculation method, which ultimately will allow us to design high-quality power supply systems.
The technique proposed in this article can be extended in several aspects by including the technologies of neural networks and machine learning in the calculation.
