
Understanding the Long-Term Development of Portland Pozzolan Cement Concrete Post 28 Days †

Abstract
1. Introduction
2. Materials and Methods
2.1. Materials
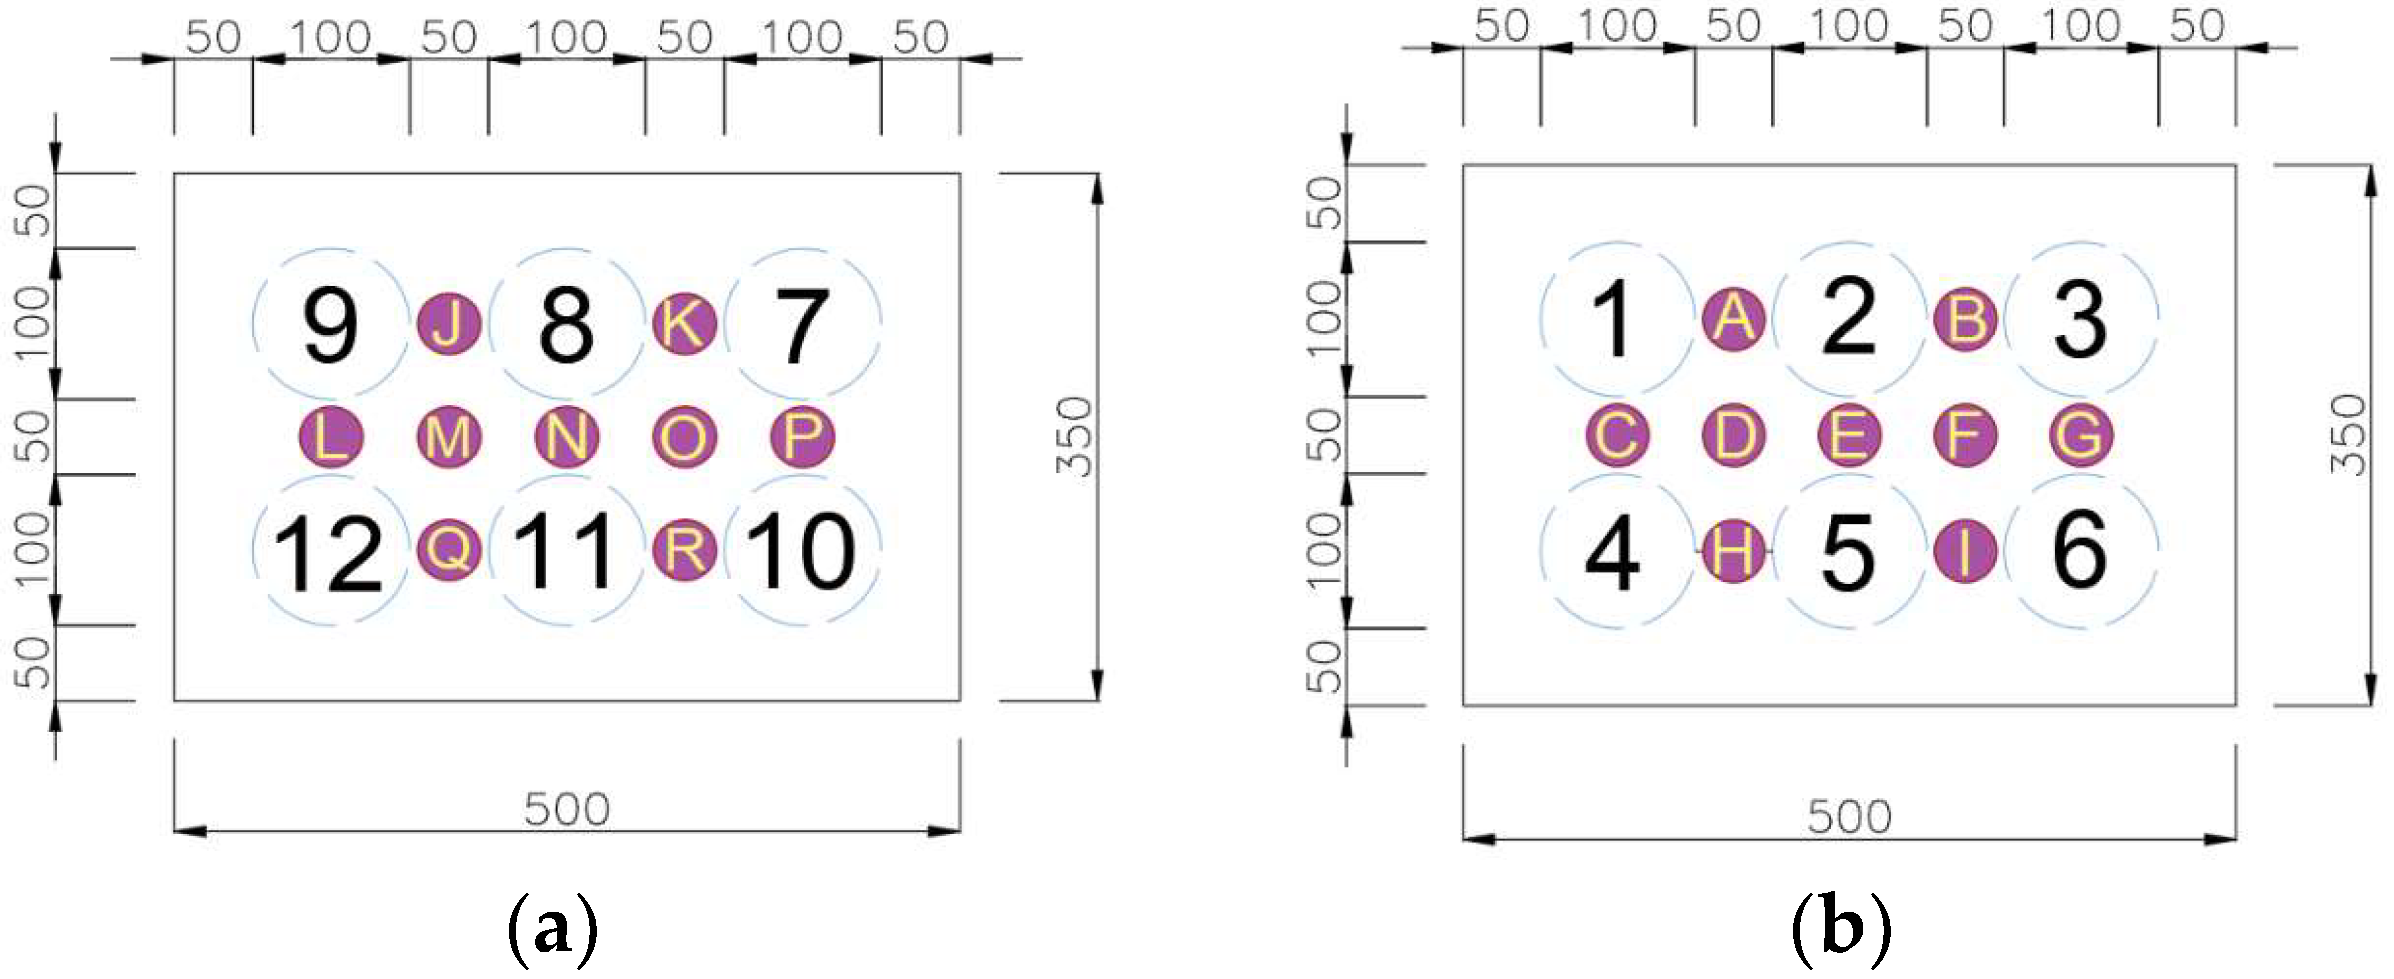
2.2. Specimen Preparation
2.3. Testing Ages
2.4. Rebound Hammer
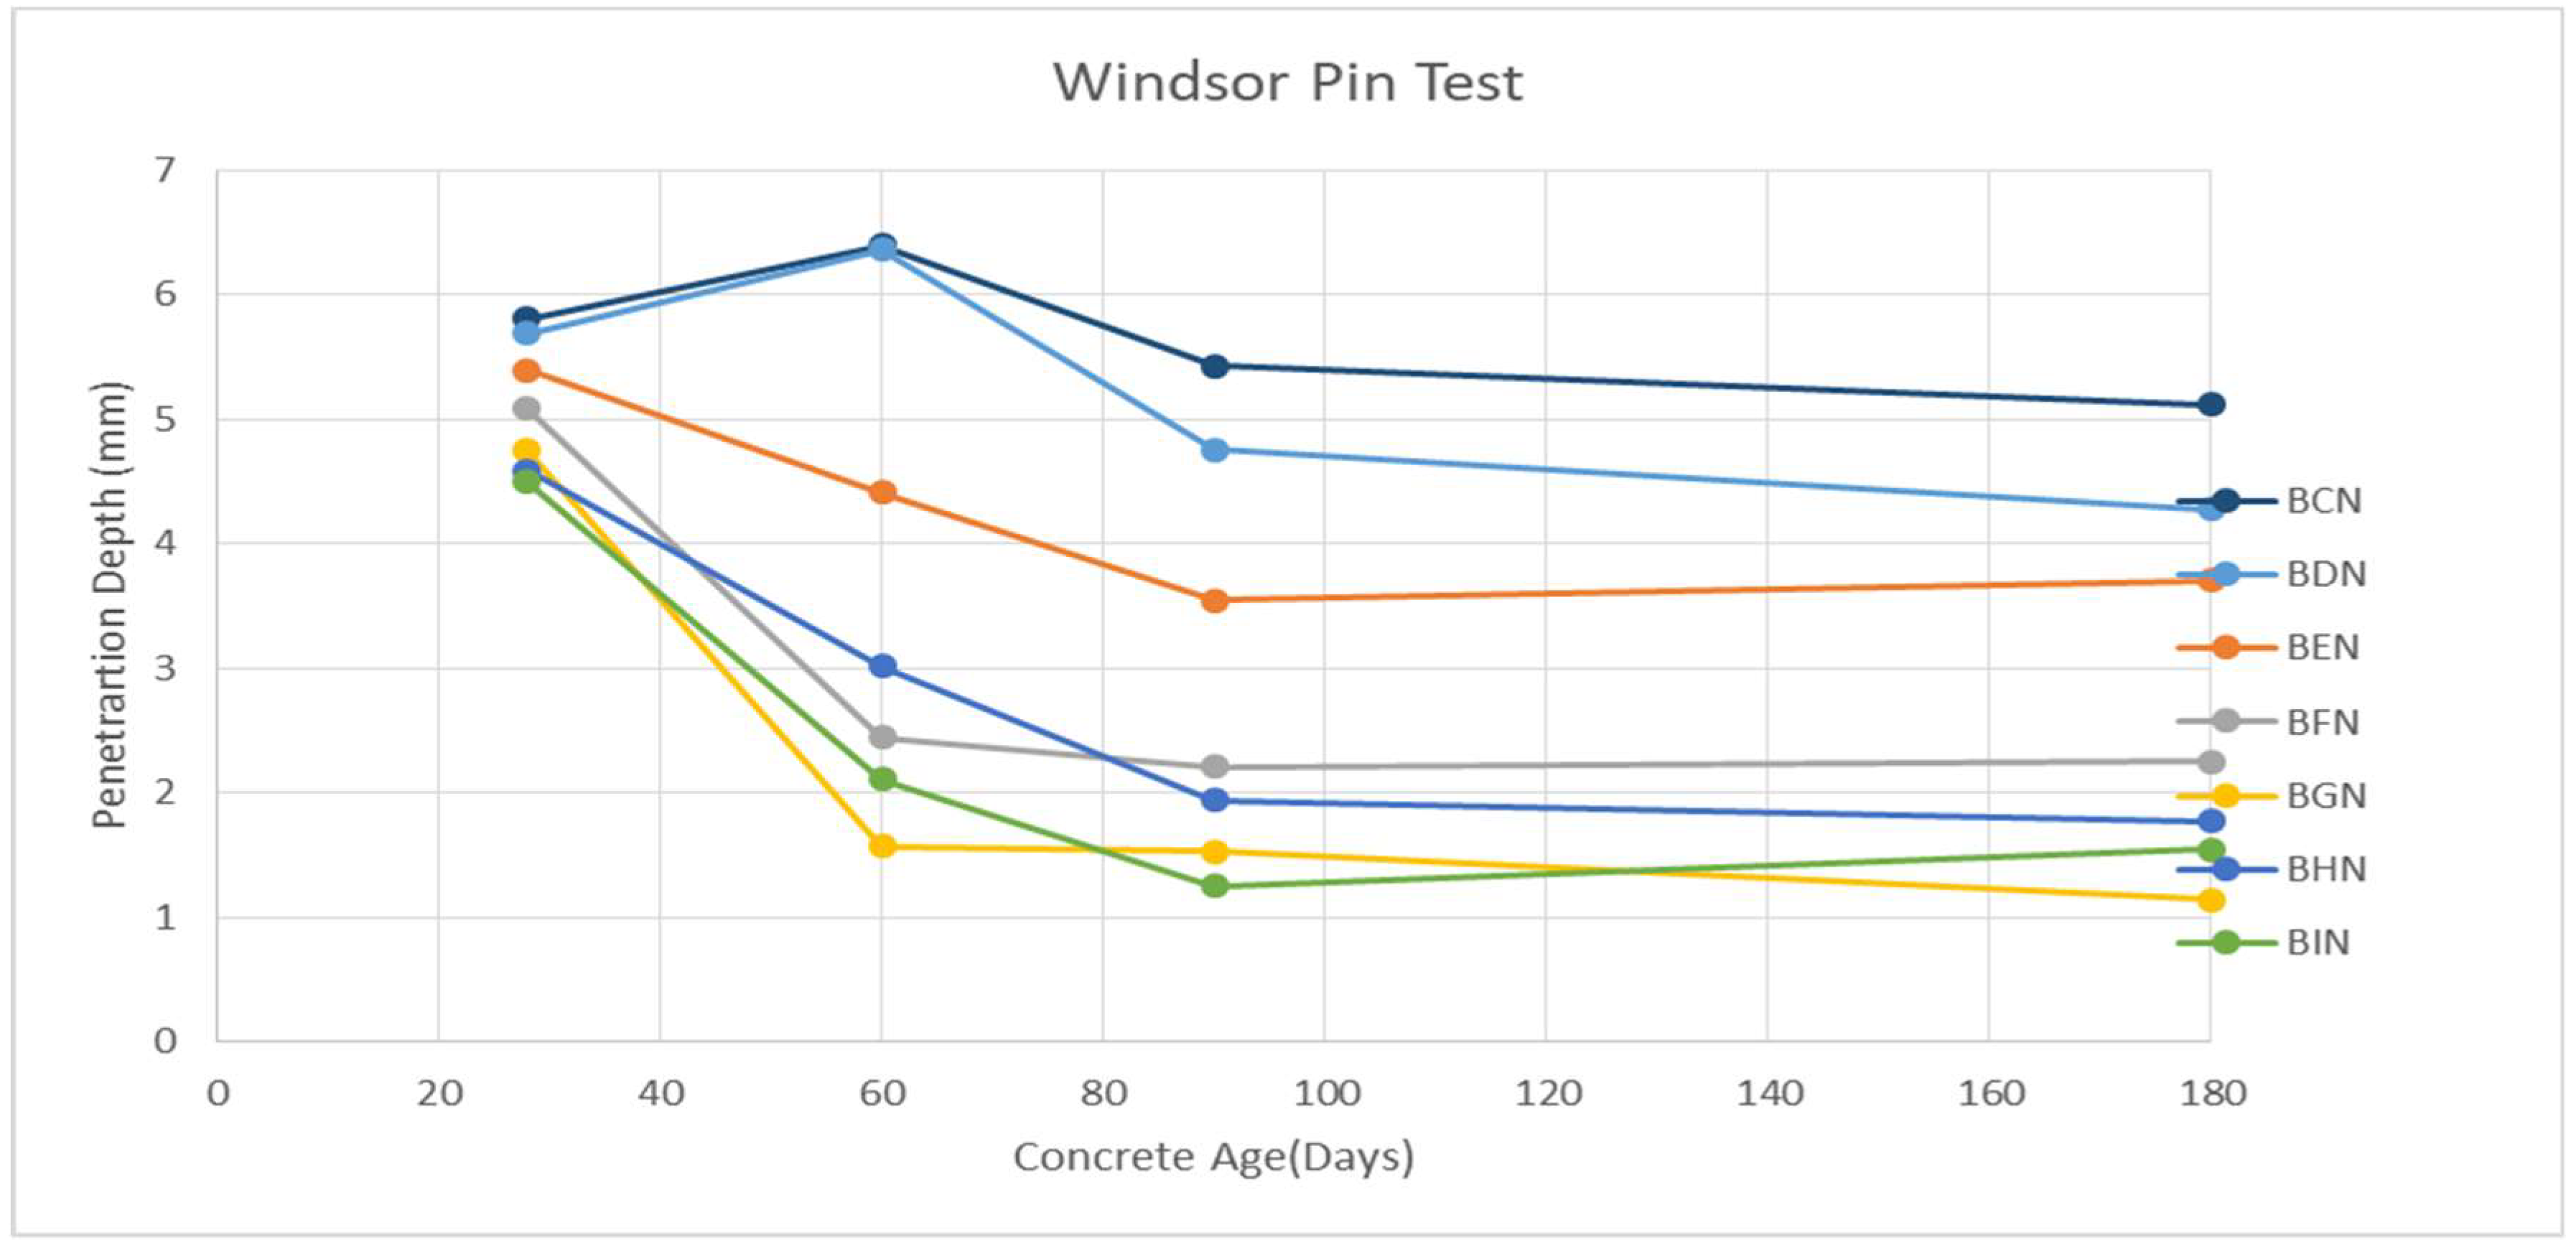
2.5. Windsor Pin Test
3. Result
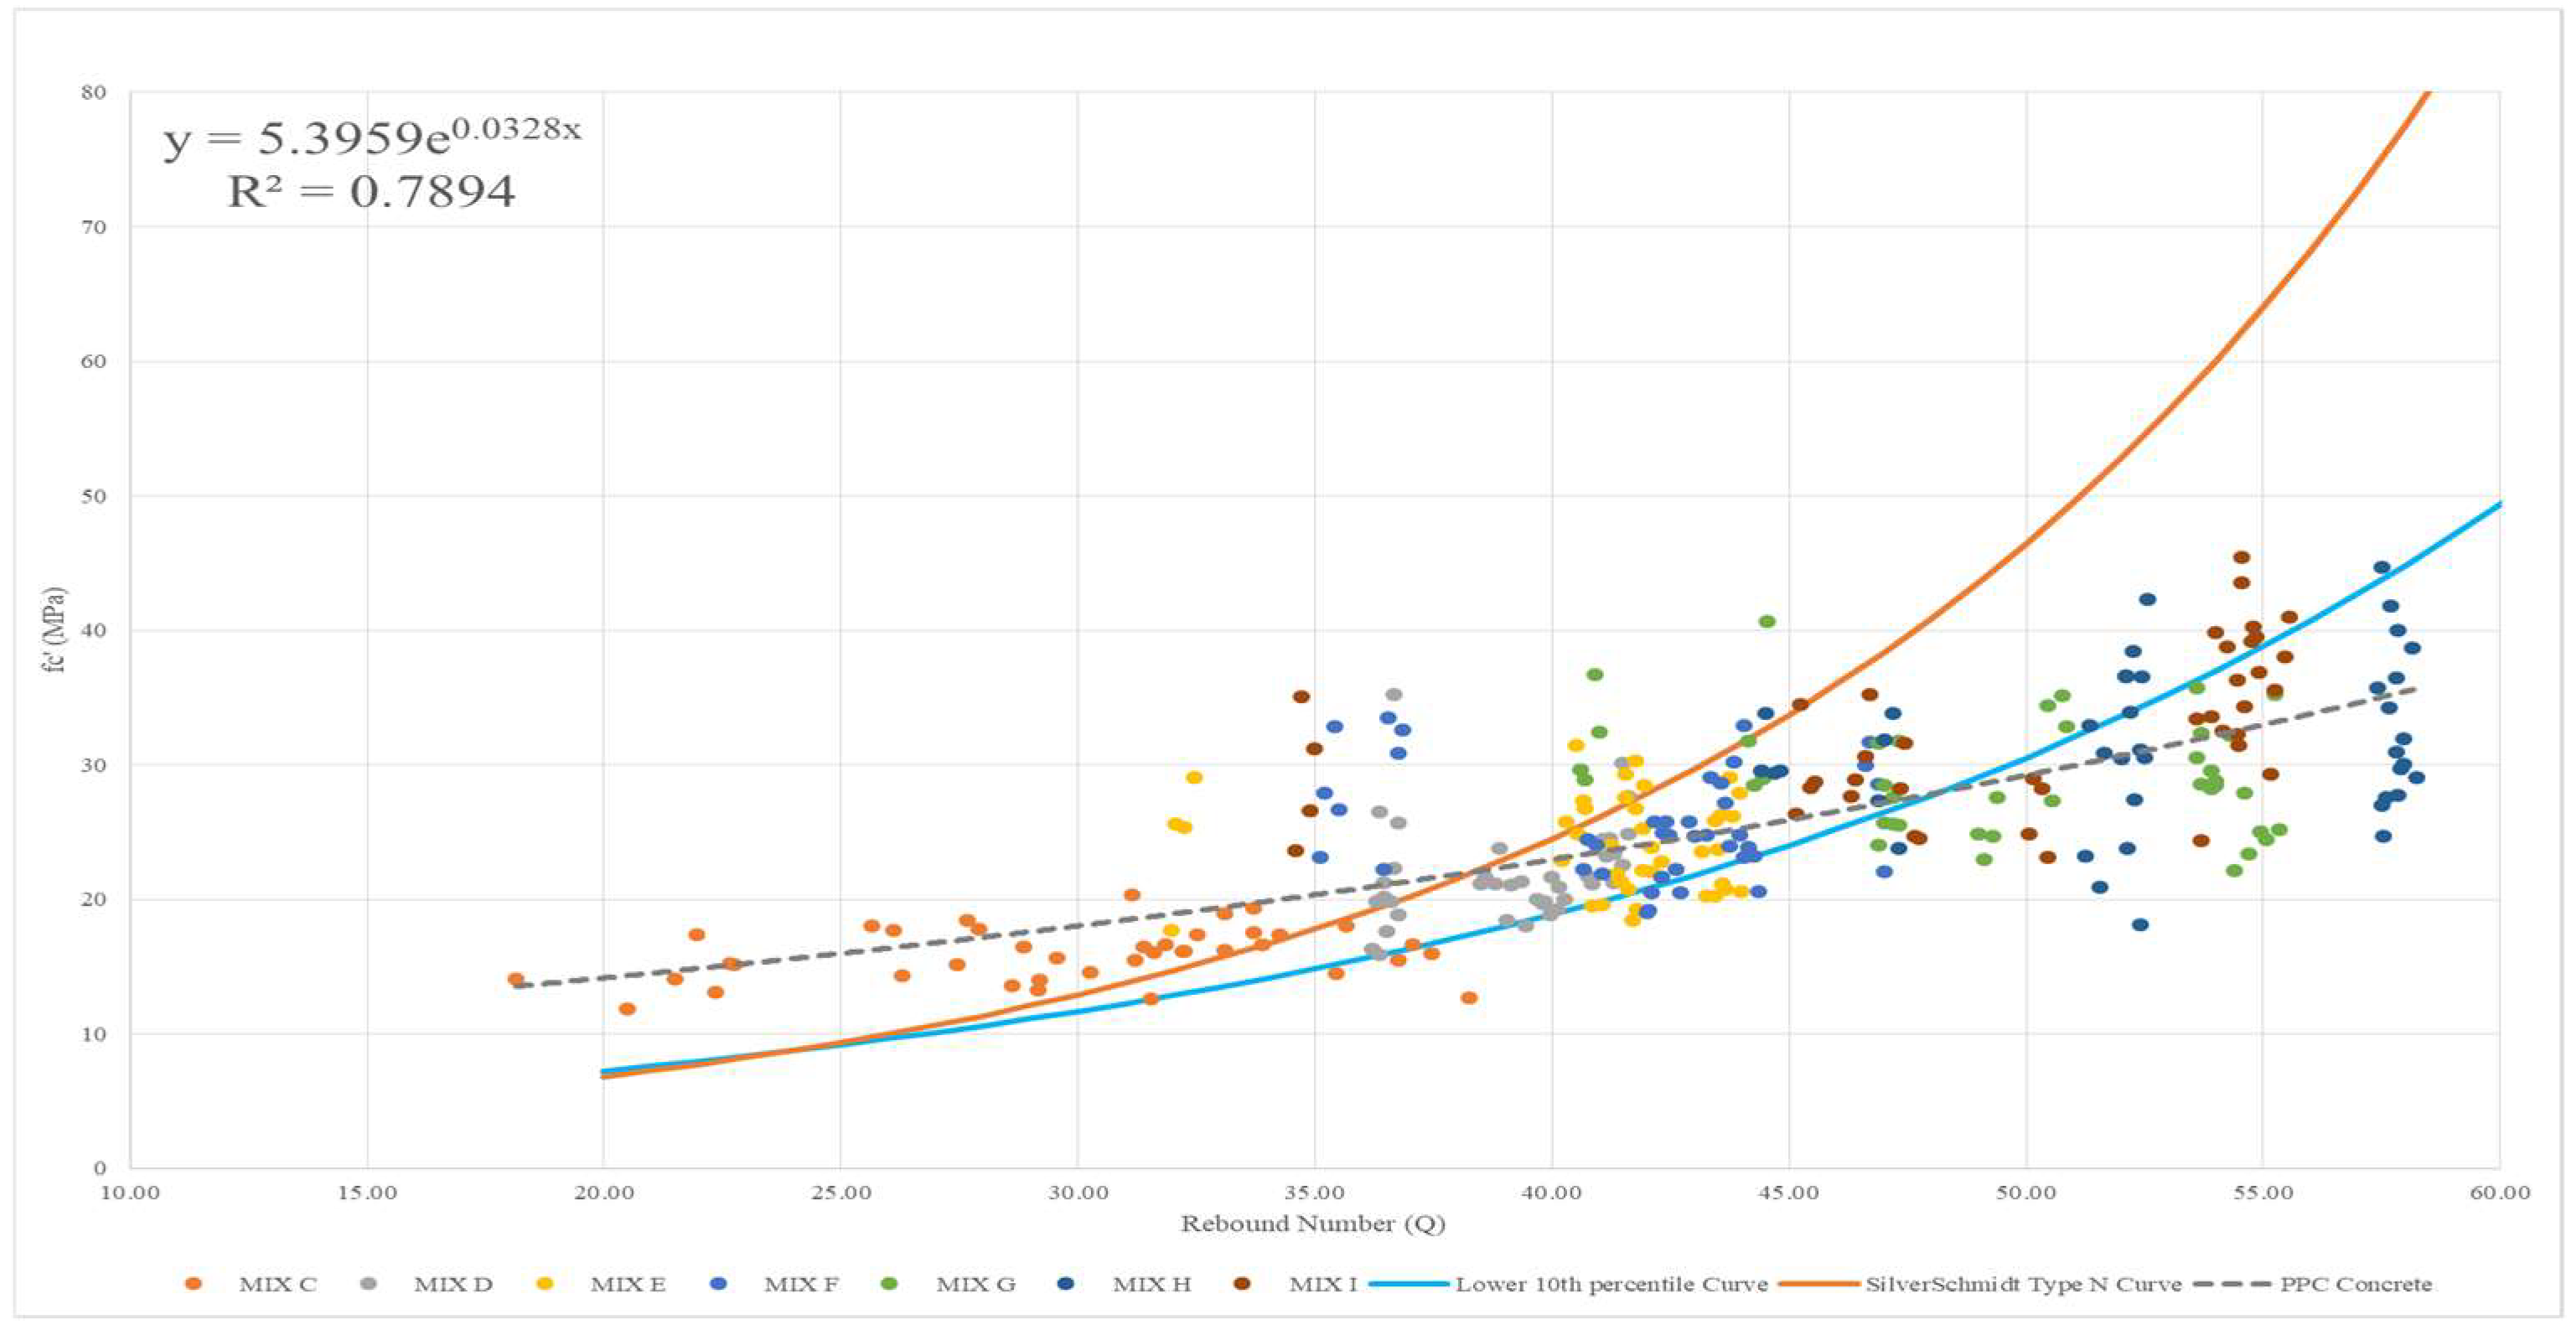
3.1. Rebound Number
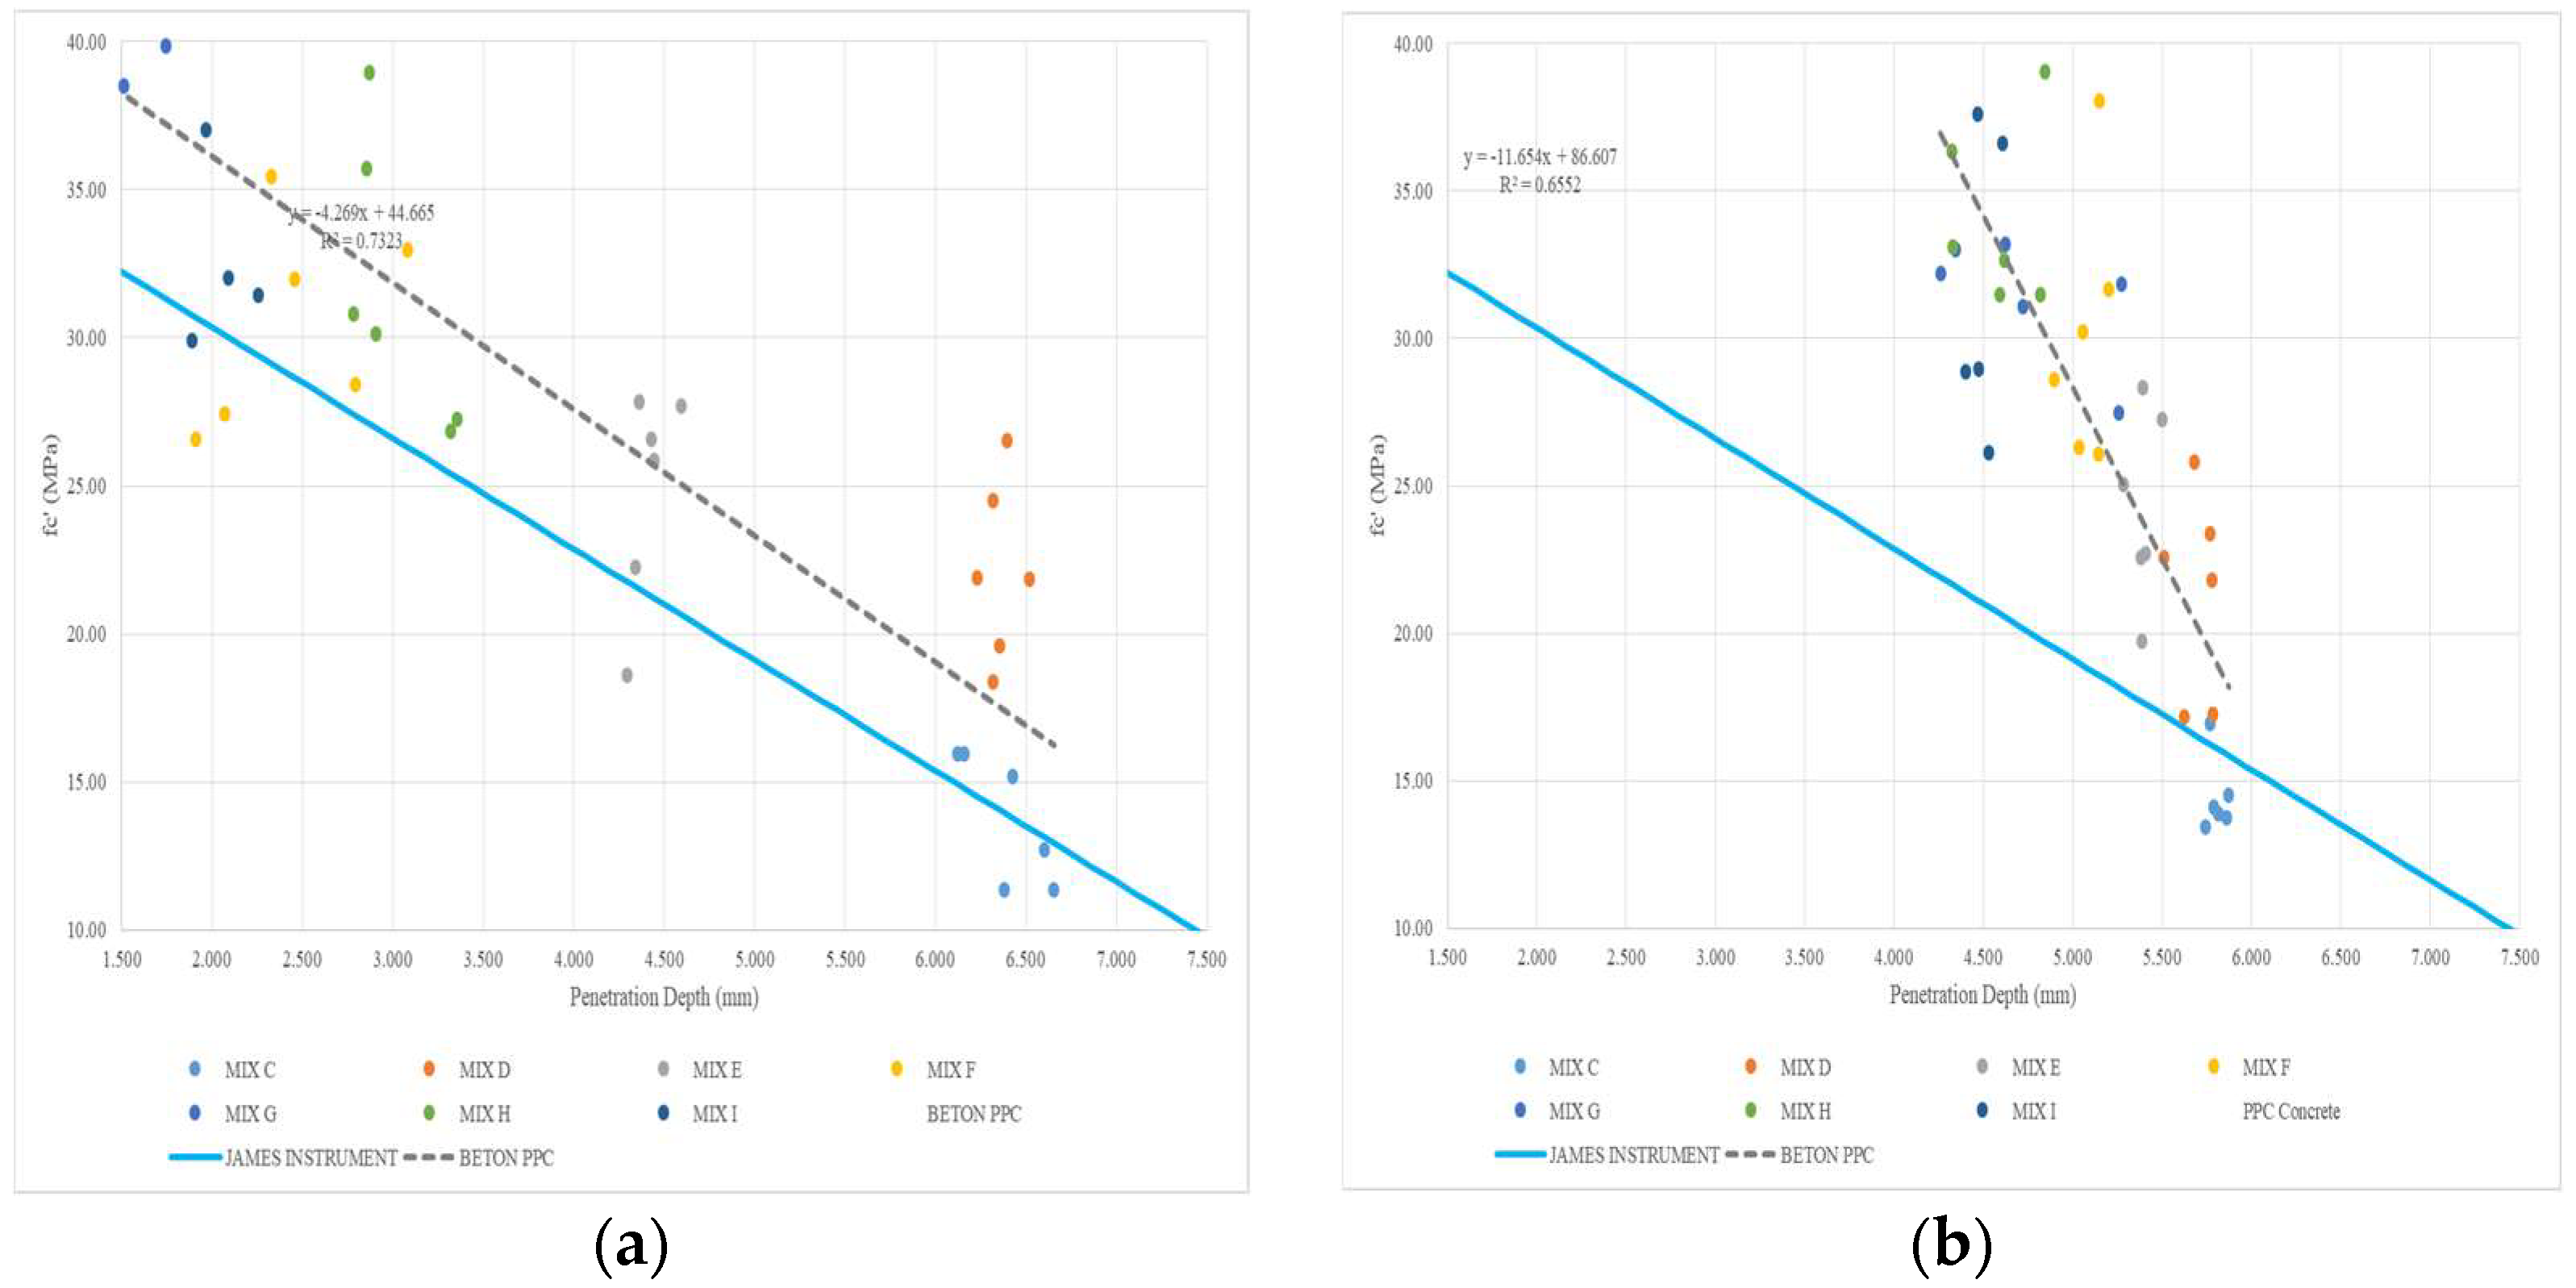
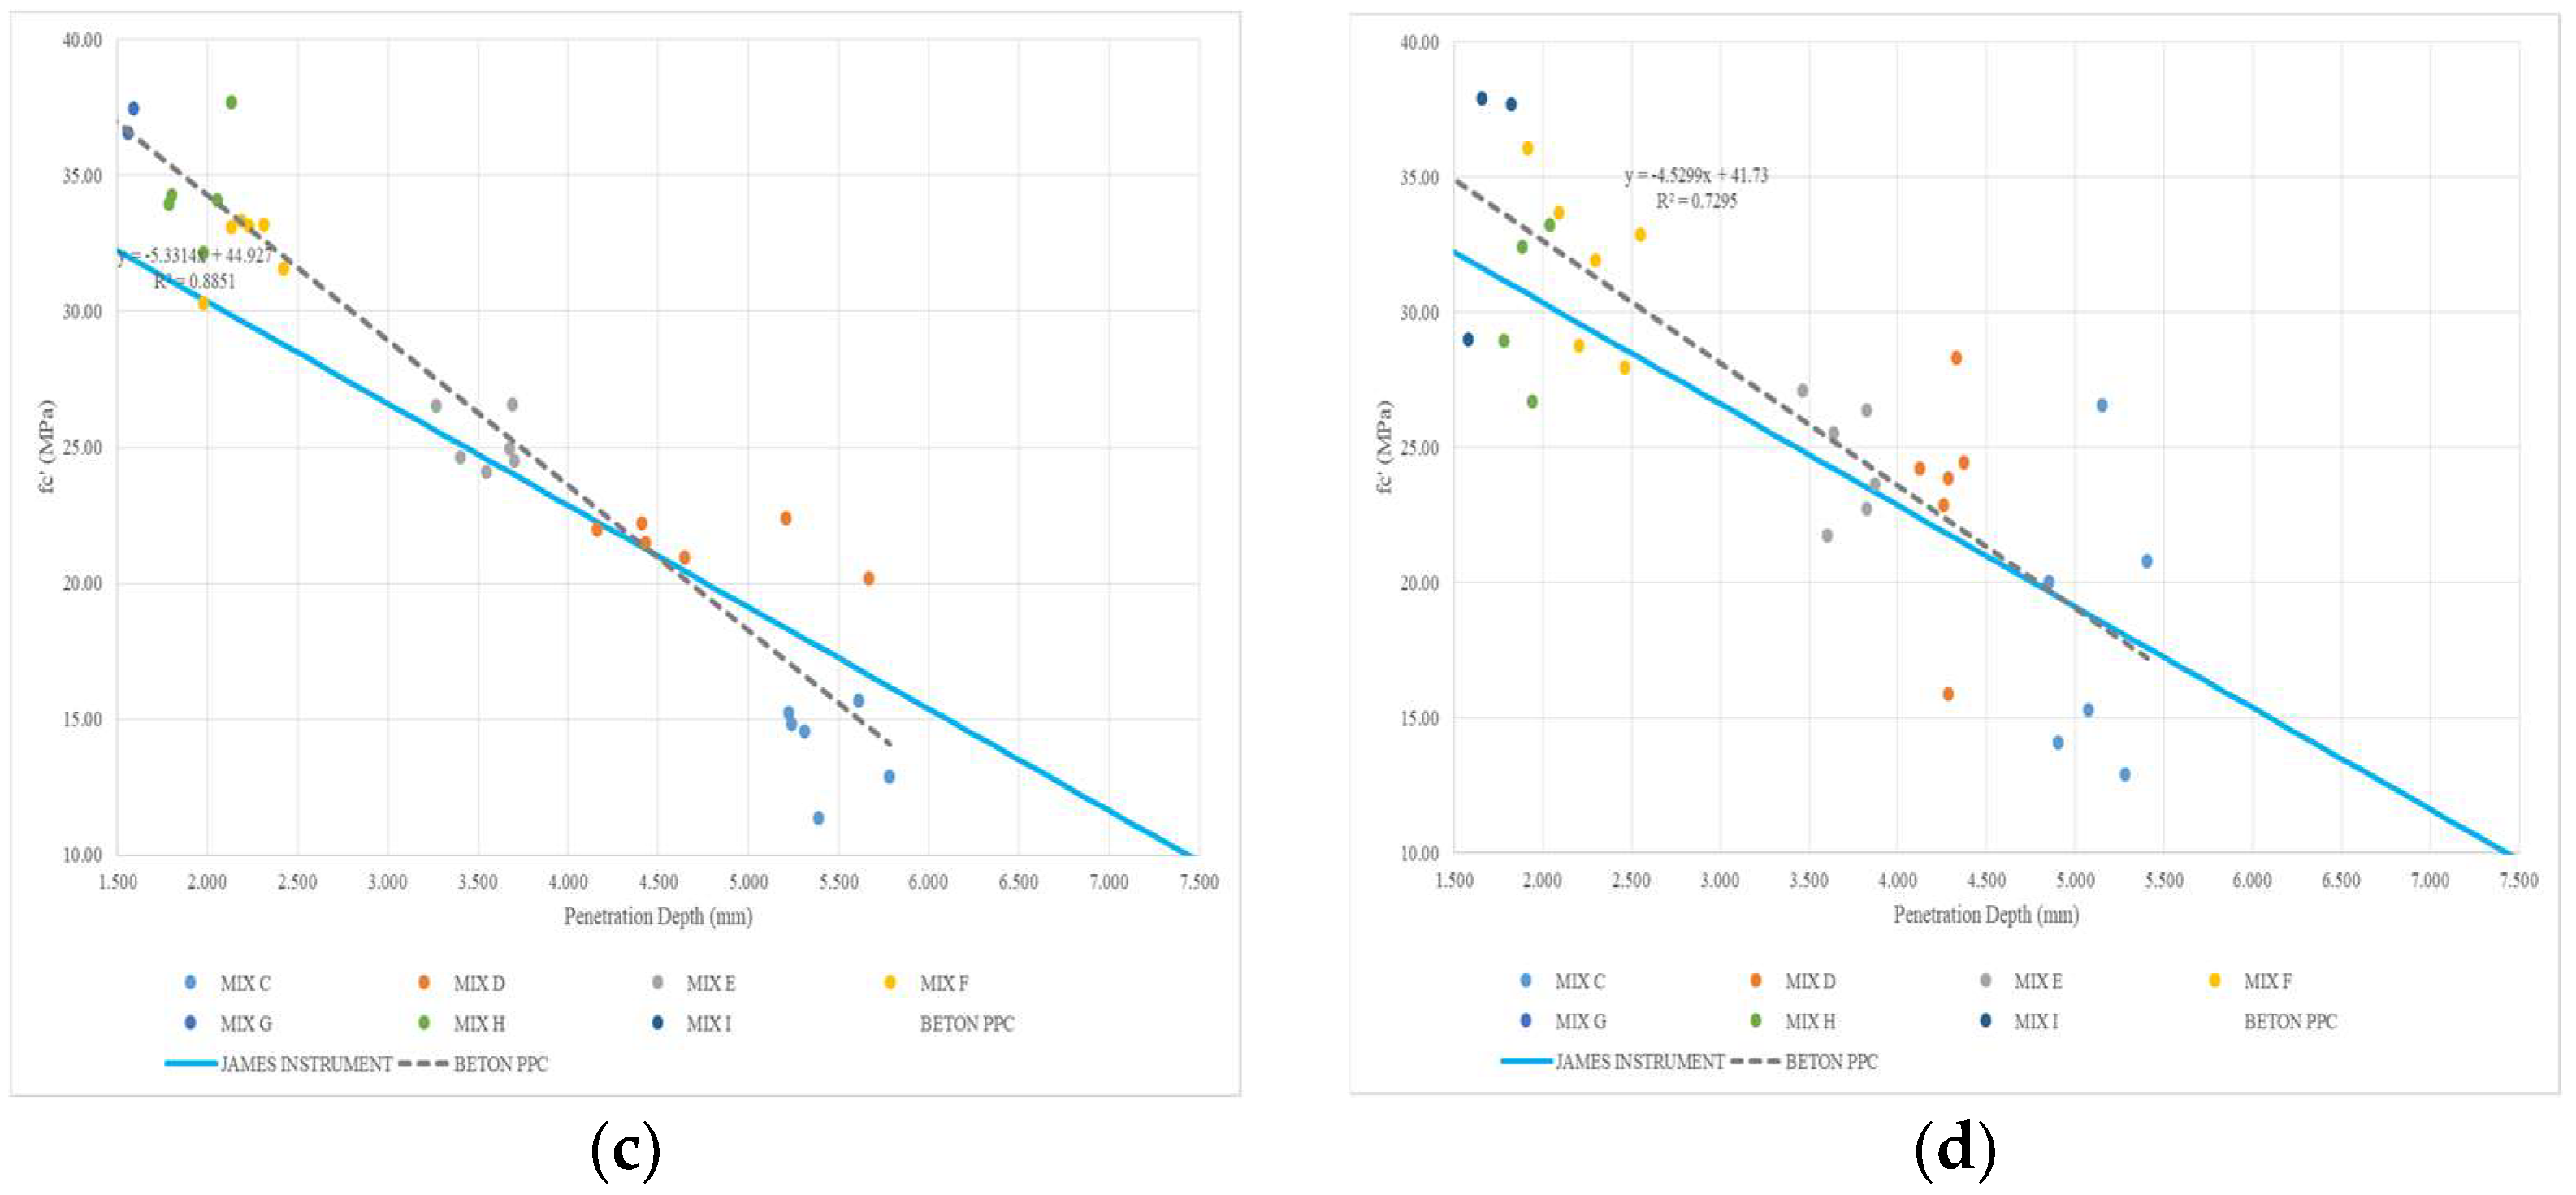
3.2. Penetration Depth
3.3. Penetration Depth of PPC Concrete Development with Age
4. Conclusions
Author Contributions
Funding
Institutional Review Board Statement
Informed Consent Statement
Data Availability Statement
Conflicts of Interest
References
- Hemalatha, T.; Sasmal, S. Early-age strength development in fly ash blended cement composites: Investigation through chemical activation. Mag. Concr. Res. 2019, 71, 260–270. [Google Scholar] [CrossRef]
- Cabané, A.; Pelà, L.; Roca, P. Laboratory and in-situ mechanical characterisation of masonry components by comparing destructive and minor destructive testing techniques. Constr. Build. Mater. 2024, 411, 134474. [Google Scholar] [CrossRef]
- Onyeka, F.C. A Comparative Analysis of the Rebound Hammer and Pullout As Non-Destructive Method in Testing Concrete. EJENG 2020, 5, 554–558. [Google Scholar] [CrossRef]
- Sunarno, Y.; Tjaronge, M.W.; Irmawaty, R. Preliminary Study on Early Compressive Strength of Foam Concrete Using Ordinary Portland Cement (OPC) and Portland Composite Cement (PCC). IOP Conf. Ser. Earth Environ. Sci. 2020, 419, 012033. [Google Scholar] [CrossRef]
- Kencanawati, N.N.; Rawiana, S.; Darmayanti, N.P.R.R. Characteristics of Pozzolan and Composite Portland Cements for Sustainable Concrete Material. Aceh J. Sci. Technol. 2020, 9, 40–49. [Google Scholar] [CrossRef]
- Abd Elrazek, M.; Gamal, Y.A.S. The Reliable Concrete Compression Strength Assessment by SCHMIDT Hammer for Different Concrete Grades. IOP Conf. Ser. Mater. Sci. Eng. 2021, 1171, 012004. [Google Scholar] [CrossRef]
- Kumavat, H.R.; Chandak, N.R.; Patil, I.T. Factors influencing the performance of rebound hammer used for non-destructive testing of concrete members: A review. Case Stud. Constr. Mater. 2021, 14, e00491. [Google Scholar] [CrossRef]
- ASTM C 805-02; Standard Test Method for Rebound Number of Hardened Concrete. ASTM: West Conshohocken, PA, USA, 2002.
- ASTM C803/C803M-17; Standard Test Method for Penetration Resistance of Hardened Concrete. ASTM International: West Conshohocken, PA, USA, 2017.
- BSI 1881–207:1992; Testing Concrete. Recommendations for the Assessment of Compressive Strength by Penetration Resistance. British Standards Institution: London, UK, 1992.


| Compressive Strength (Mpa) | W/C | Code |
|---|---|---|
| 14.25 (Mix C) | 0.60 | C |
| 16.28 (Mix D) | 0.60 | D |
| 18.32 (Mix E) | 0.55 | E |
| 20.36 (Mix F) | 0.55 | F |
| 22.39 (Mix G) | 0.45 | G |
| 24.43 (Mix H) | 0.40 | H |
| 28.50 (Mix I) | 0.40 | I |
Disclaimer/Publisher’s Note: The statements, opinions and data contained in all publications are solely those of the individual author(s) and contributor(s) and not of MDPI and/or the editor(s). MDPI and/or the editor(s) disclaim responsibility for any injury to people or property resulting from any ideas, methods, instructions or products referred to in the content. |
© 2024 by the authors. Licensee MDPI, Basel, Switzerland. This article is an open access article distributed under the terms and conditions of the Creative Commons Attribution (CC BY) license (https://creativecommons.org/licenses/by/4.0/).
Share and Cite
Faisal, M.; Sjah, J.; Rastandi, J.I. Understanding the Long-Term Development of Portland Pozzolan Cement Concrete Post 28 Days. Mater. Proc. 2024, 18, 11. https://doi.org/10.3390/materproc2024018011
Faisal M, Sjah J, Rastandi JI. Understanding the Long-Term Development of Portland Pozzolan Cement Concrete Post 28 Days. Materials Proceedings. 2024; 18(1):11. https://doi.org/10.3390/materproc2024018011
Chicago/Turabian StyleFaisal, Muhammad, Jessica Sjah, and Josia Irwan Rastandi. 2024. "Understanding the Long-Term Development of Portland Pozzolan Cement Concrete Post 28 Days" Materials Proceedings 18, no. 1: 11. https://doi.org/10.3390/materproc2024018011
APA StyleFaisal, M., Sjah, J., & Rastandi, J. I. (2024). Understanding the Long-Term Development of Portland Pozzolan Cement Concrete Post 28 Days. Materials Proceedings, 18(1), 11. https://doi.org/10.3390/materproc2024018011