
UV-LED Photocatalytic Device for the Oxidation of Ethanol and Hexane Vapors in Air †


 and
and
Abstract
:1. Introduction
2. Experimental Methods
2.1. Materials
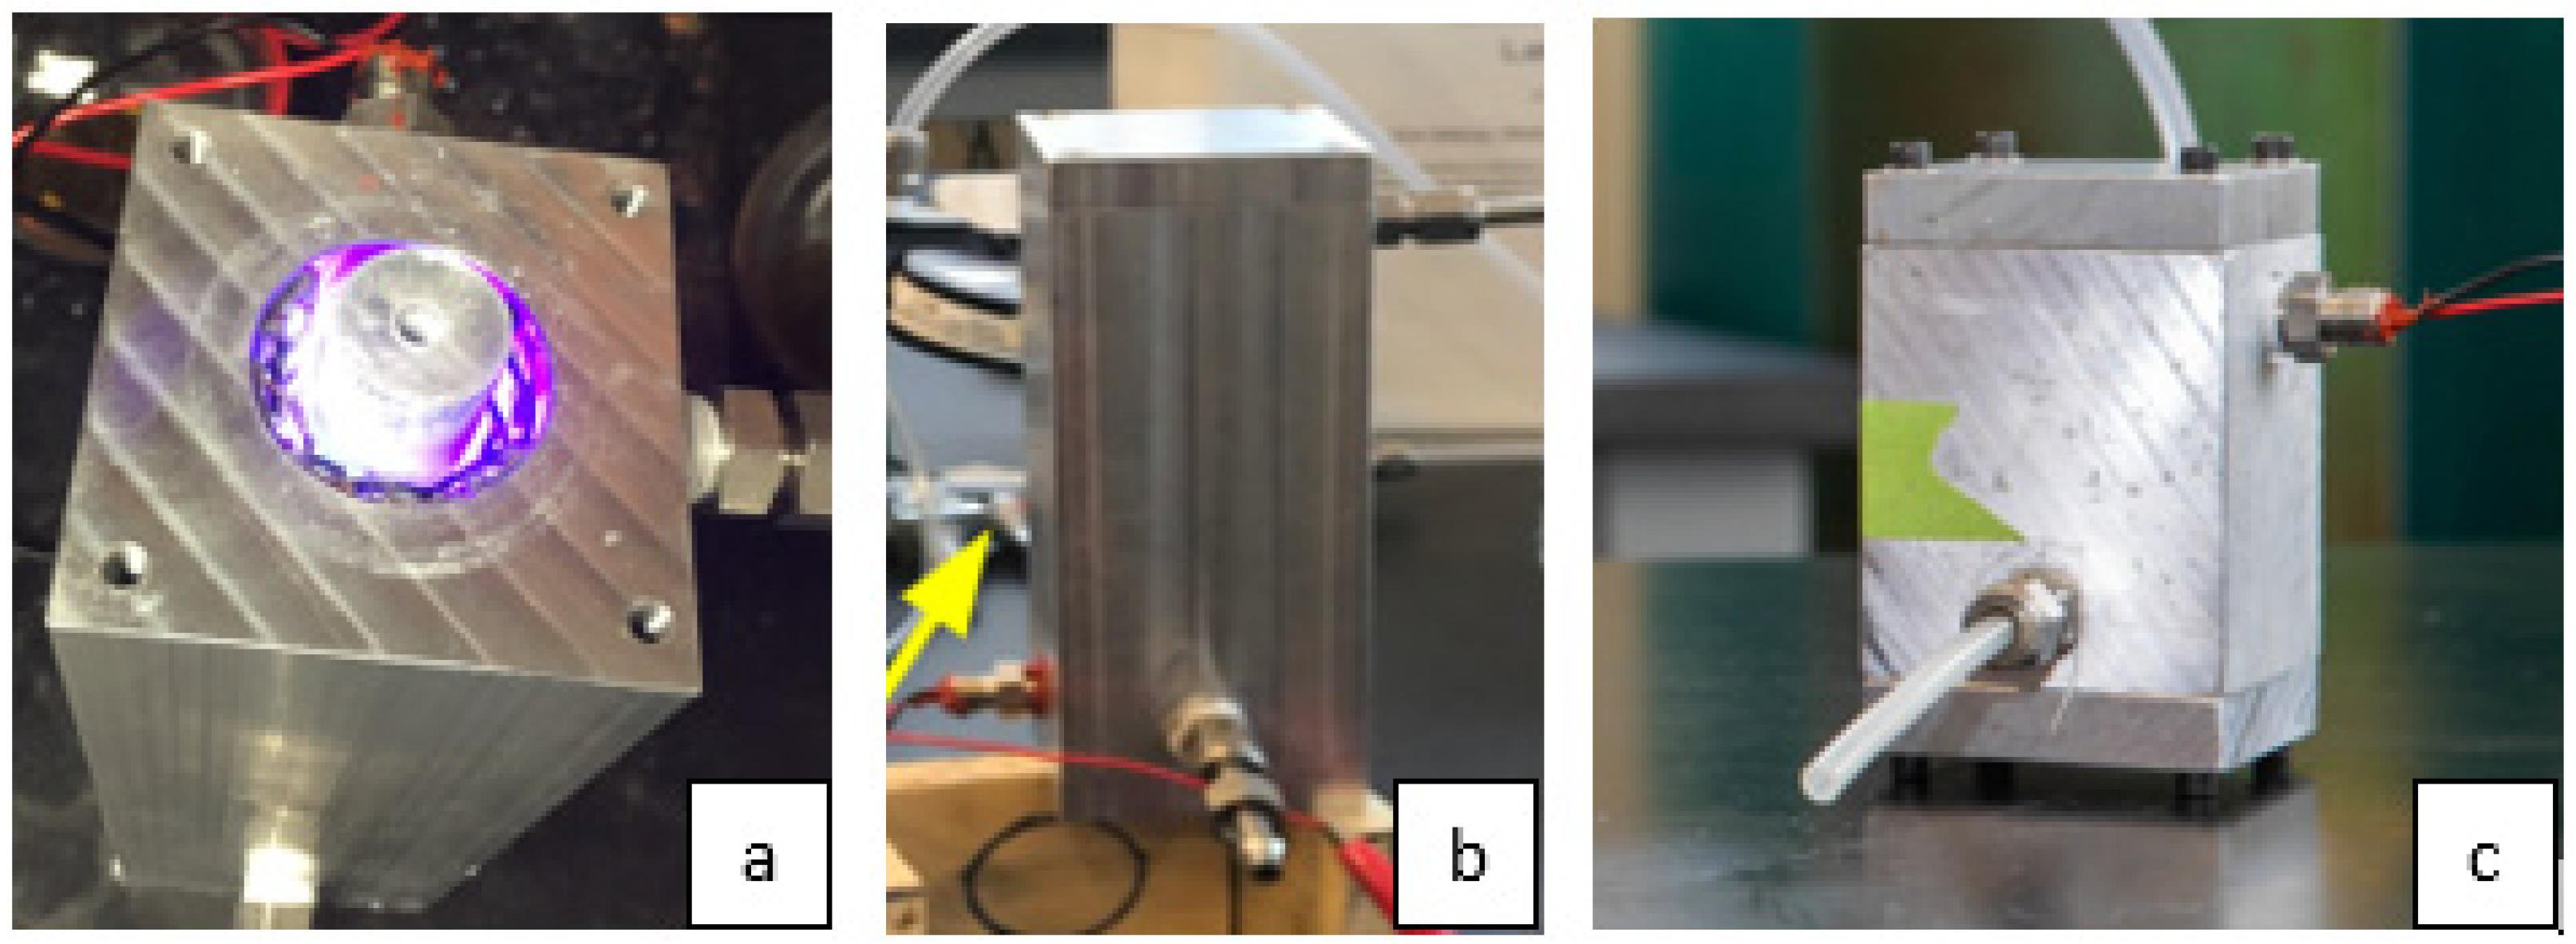
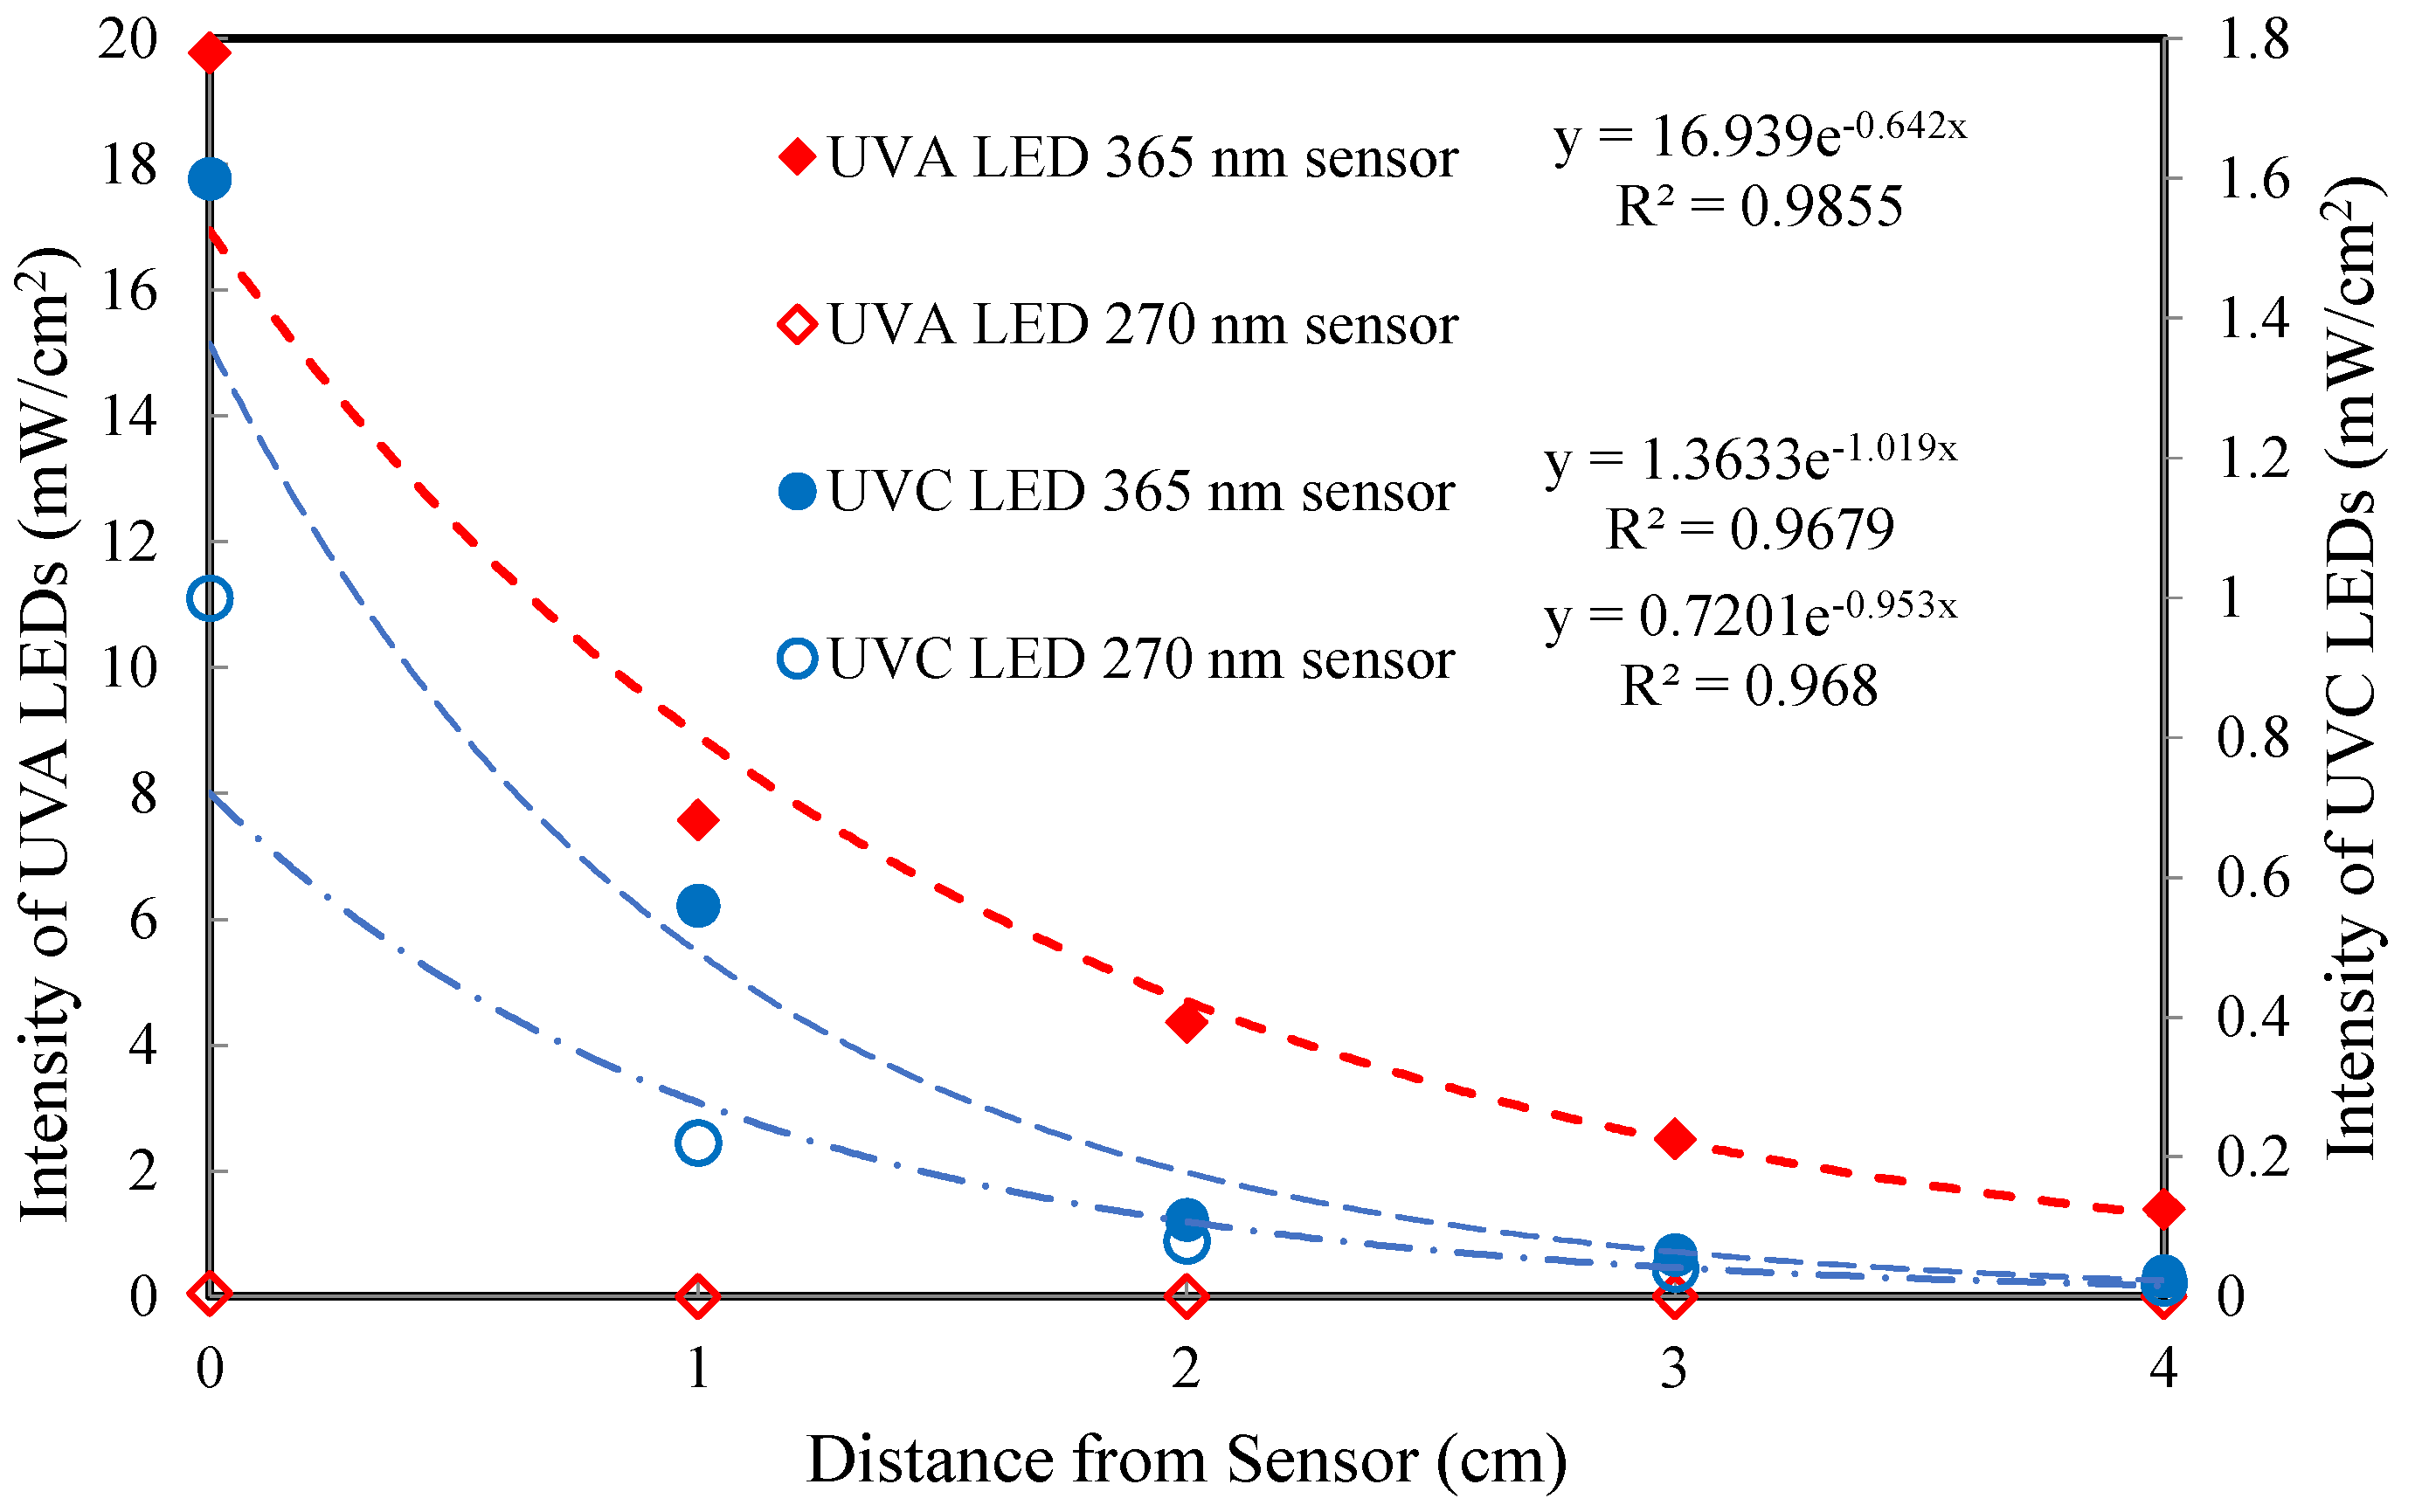
2.2. Reactors
2.3. Photocatalytic Films
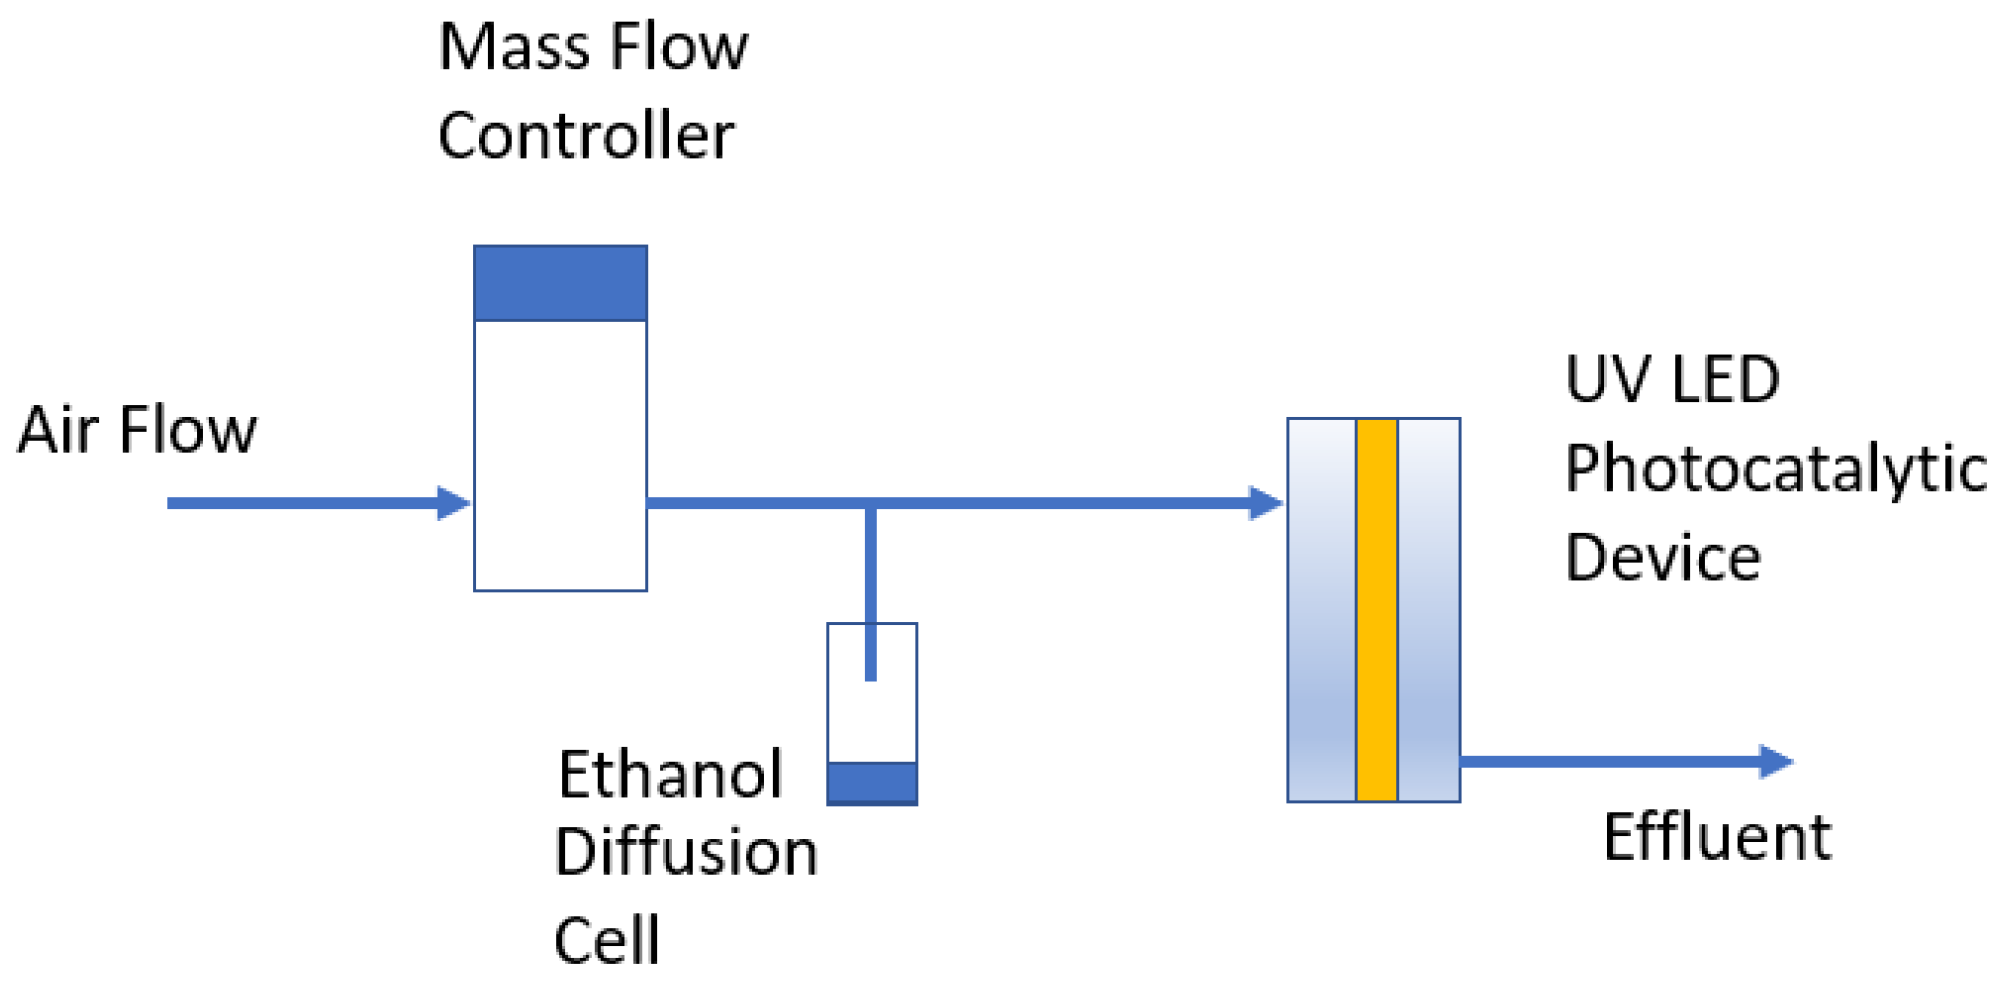
2.4. Test System
3. Results and Discussion
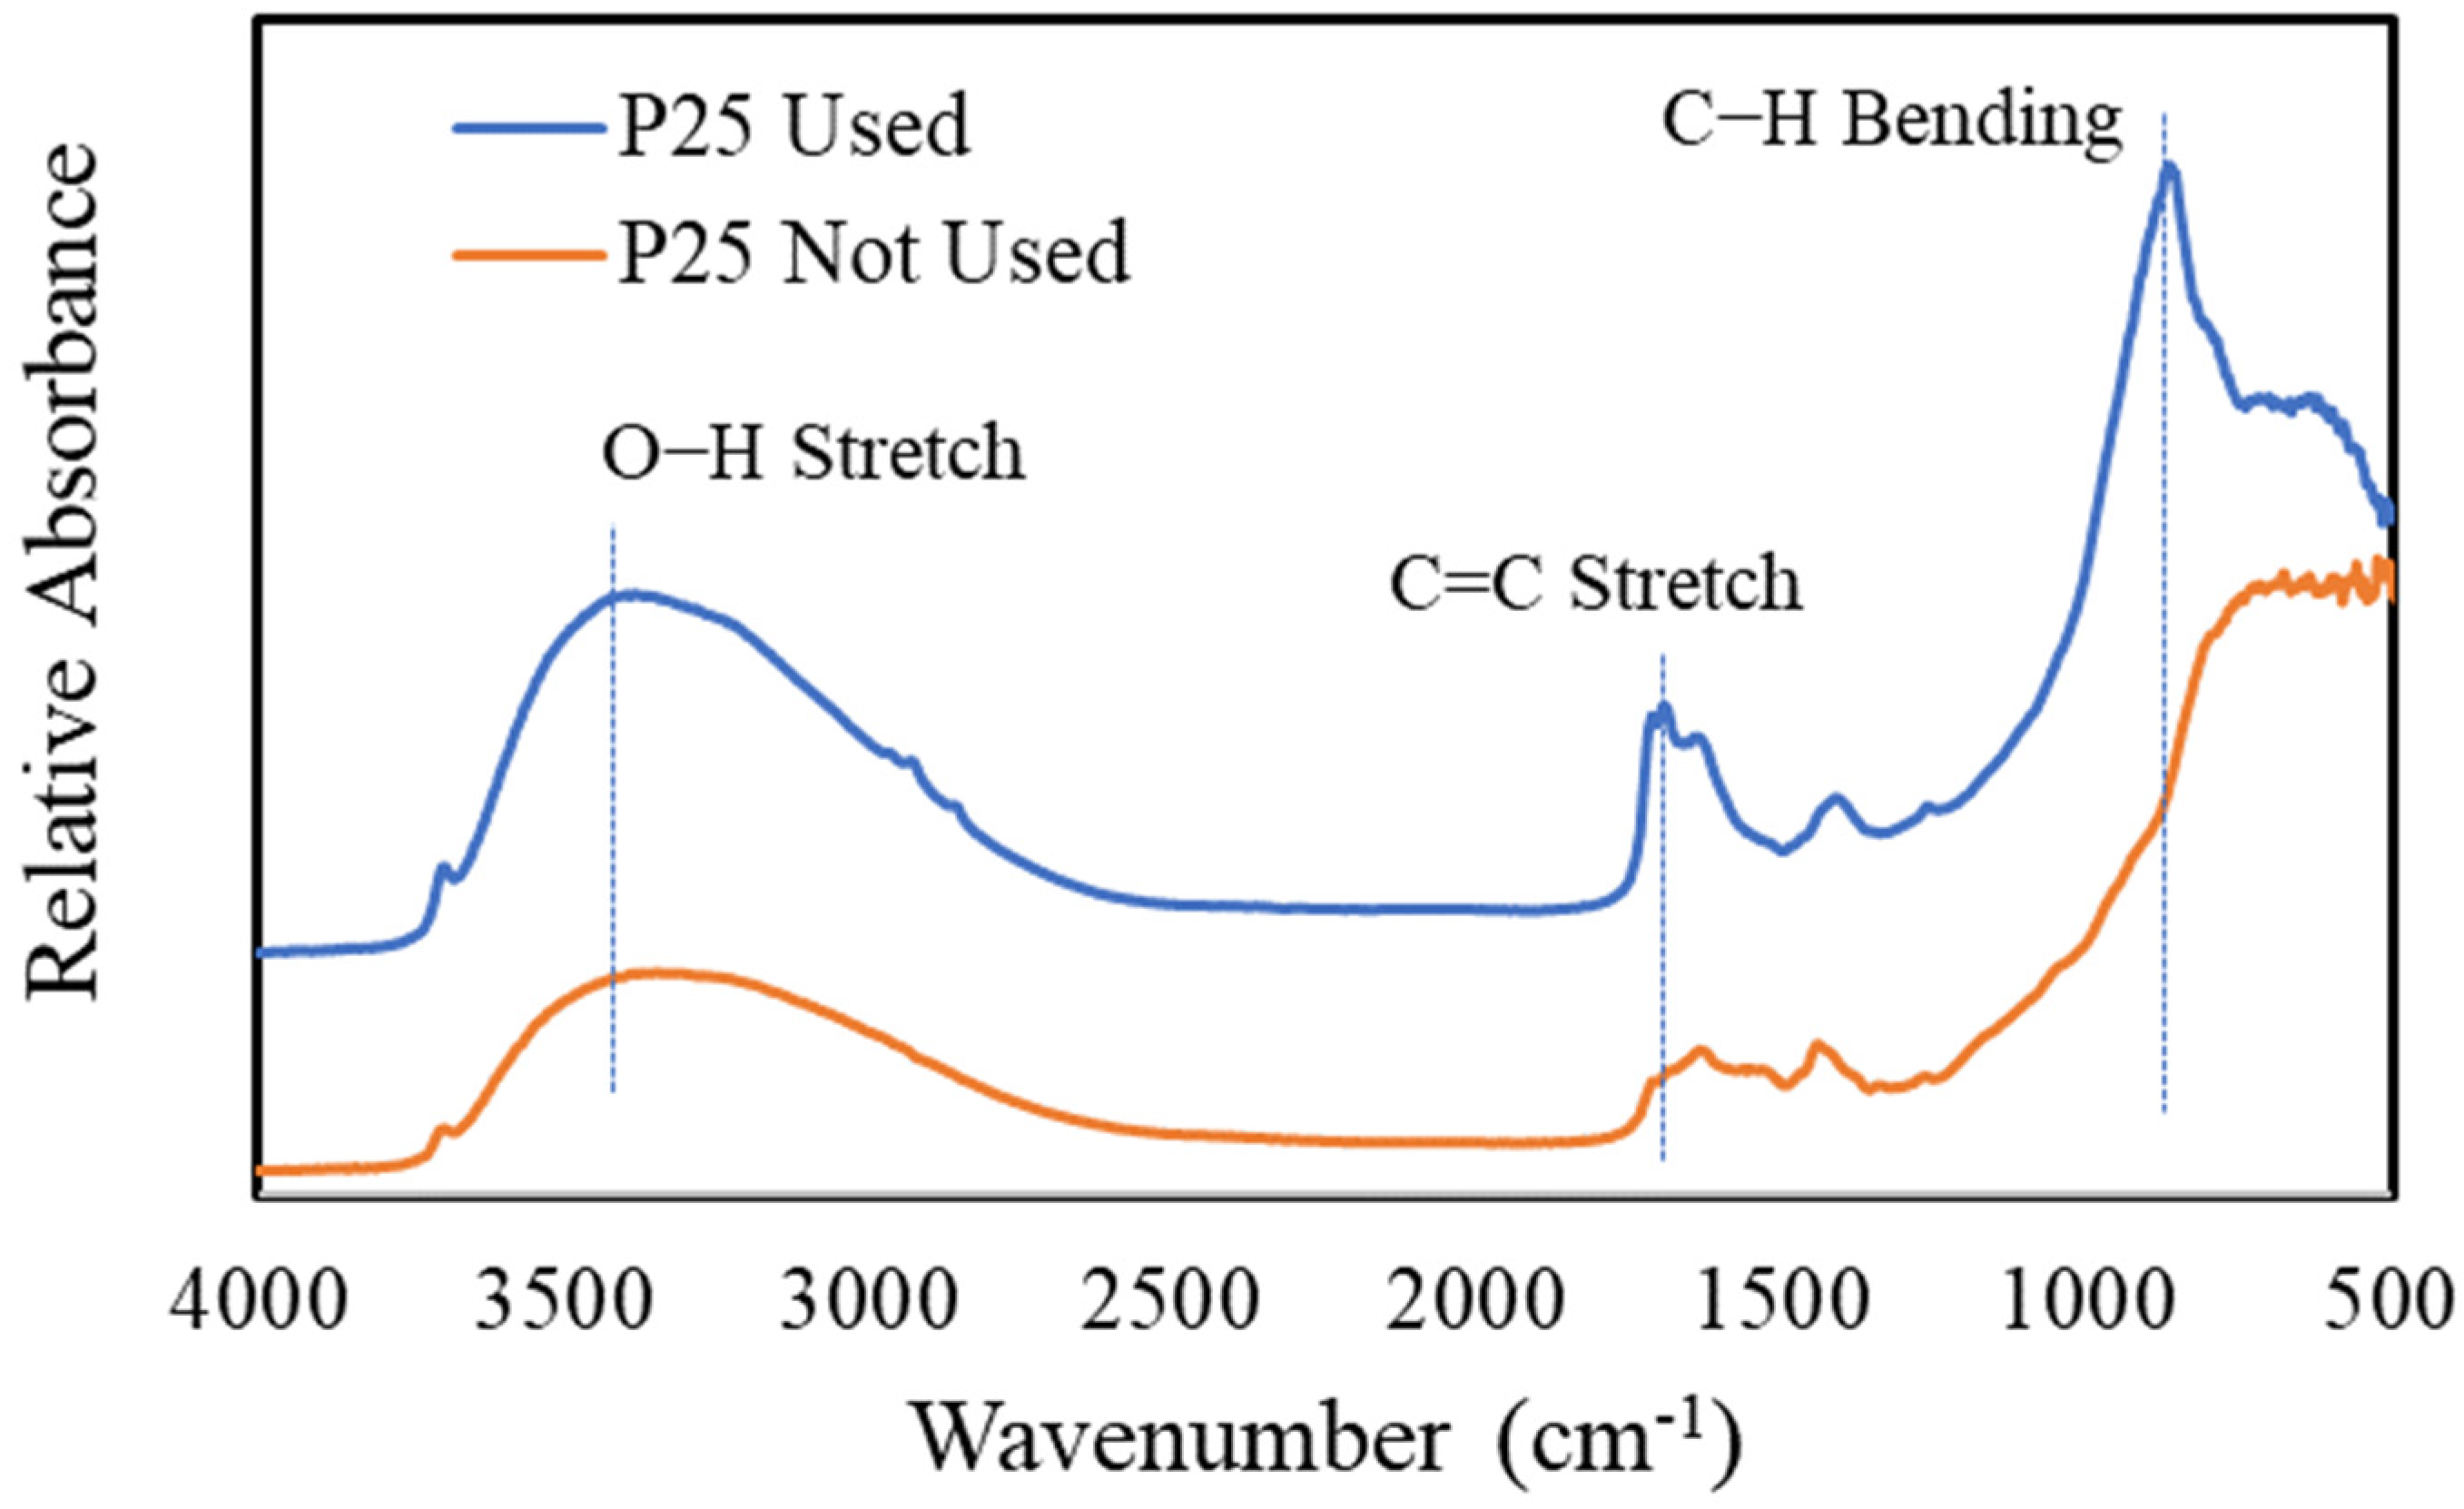
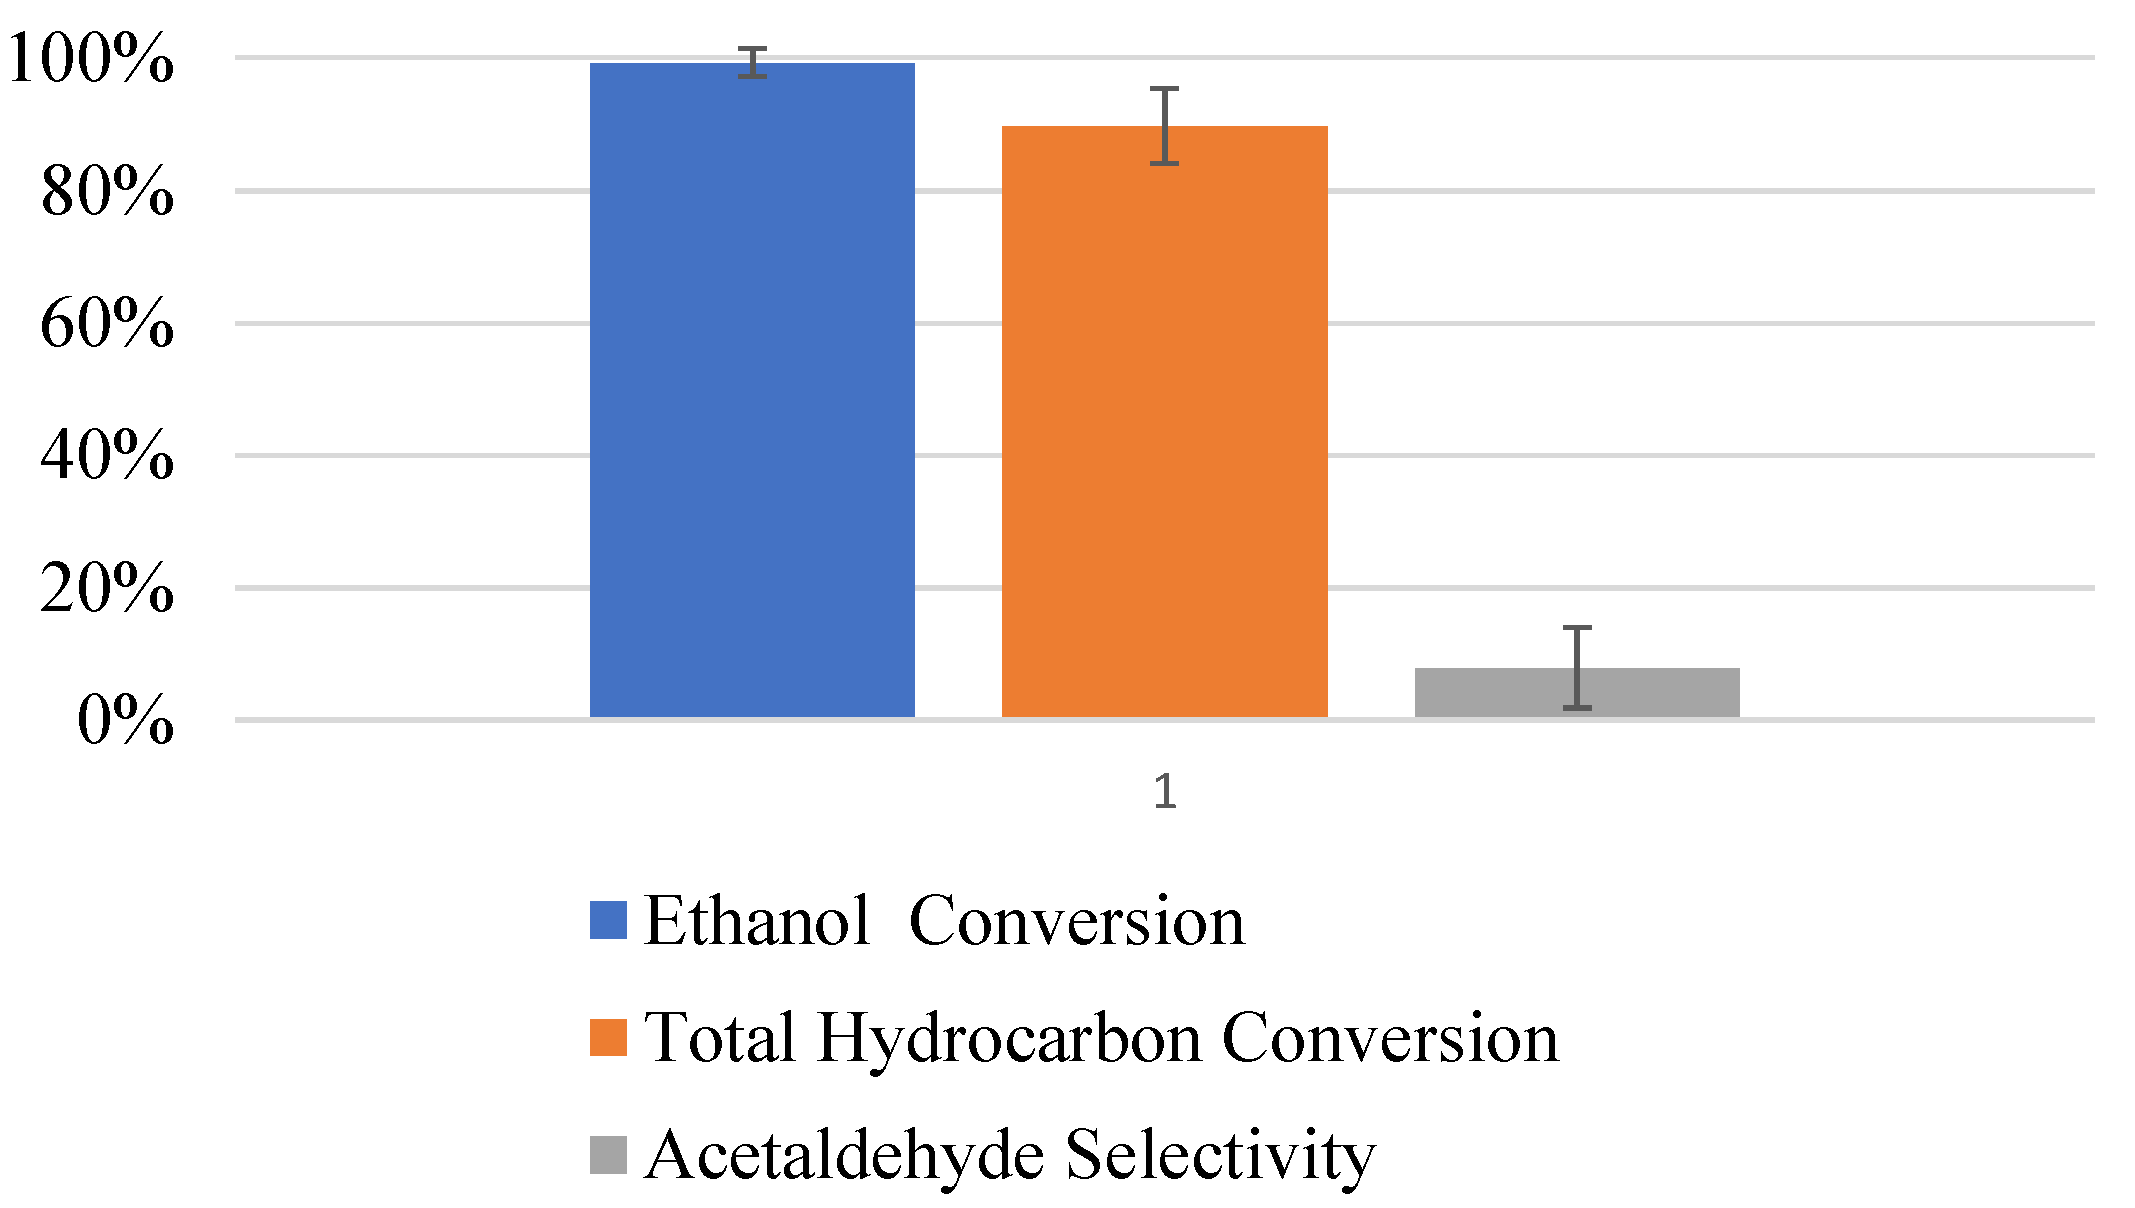
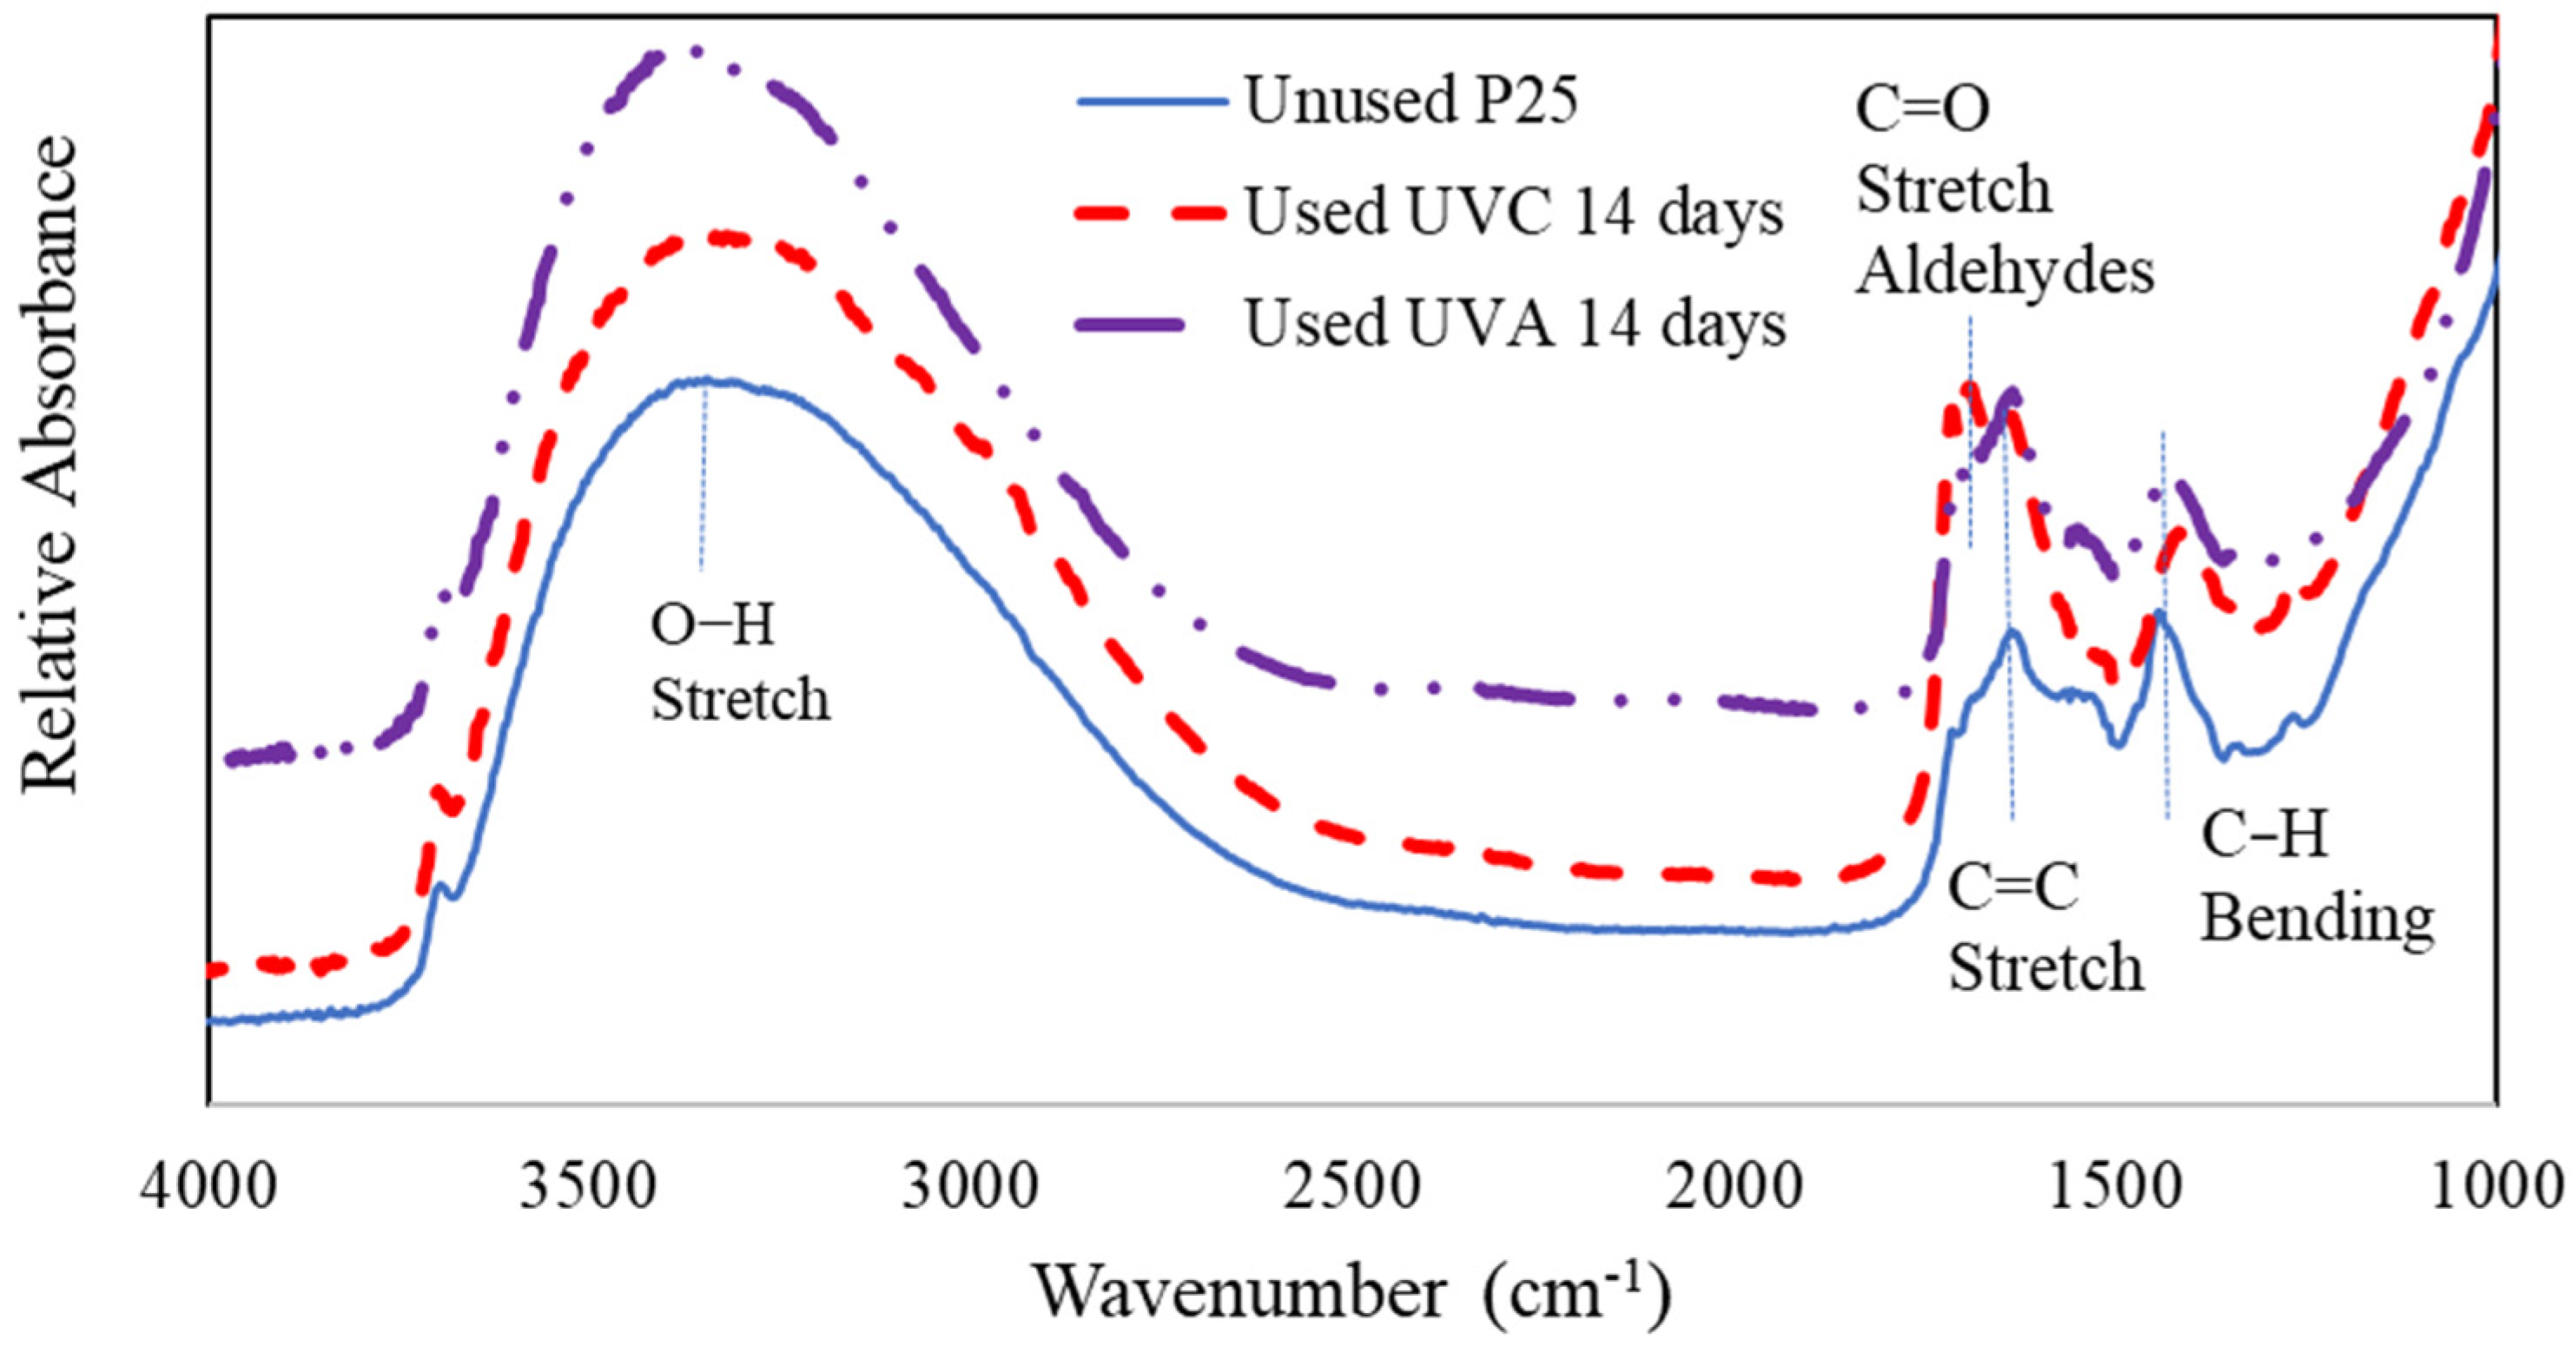
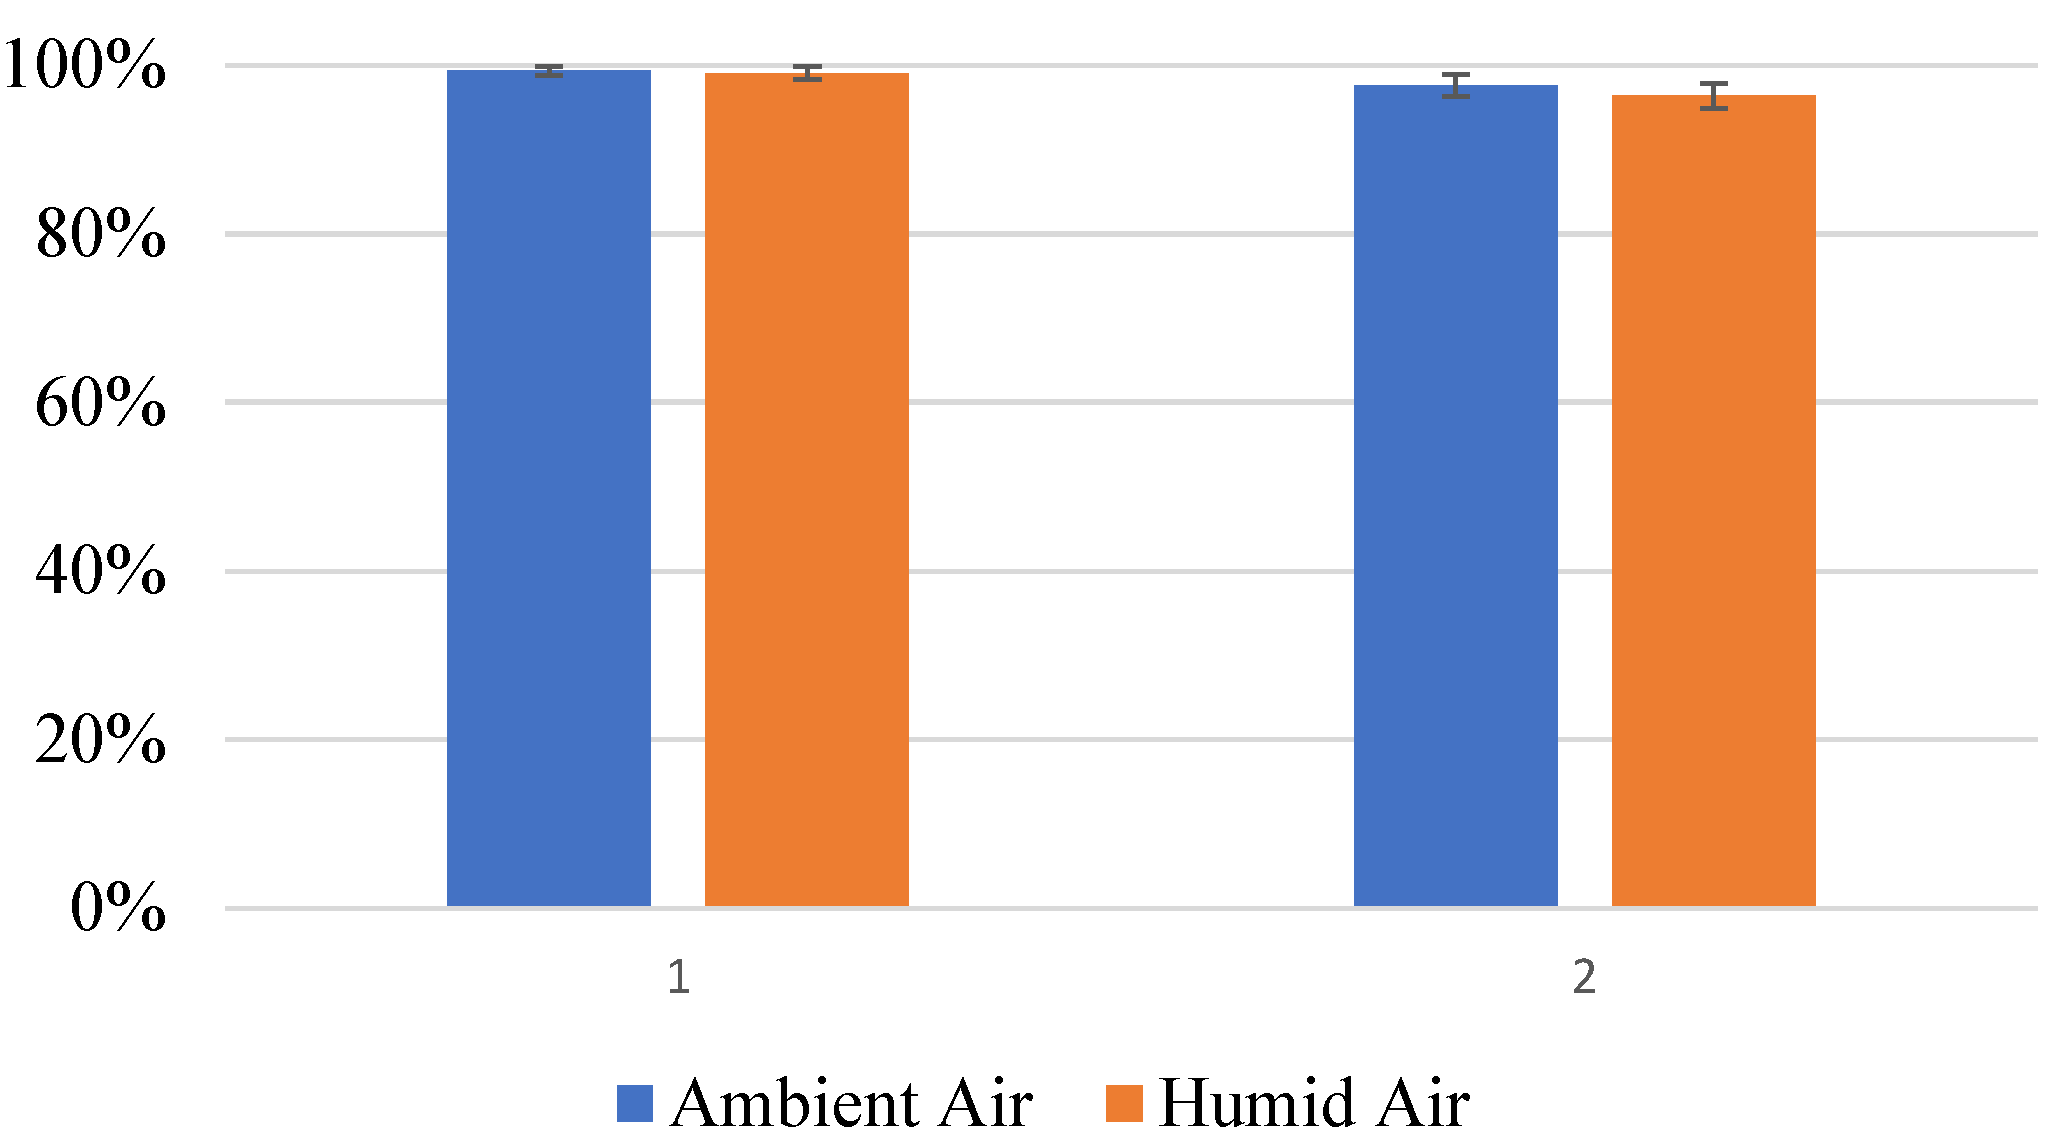
3.1. Ethanol Vapor Photocatalytic Oxidation
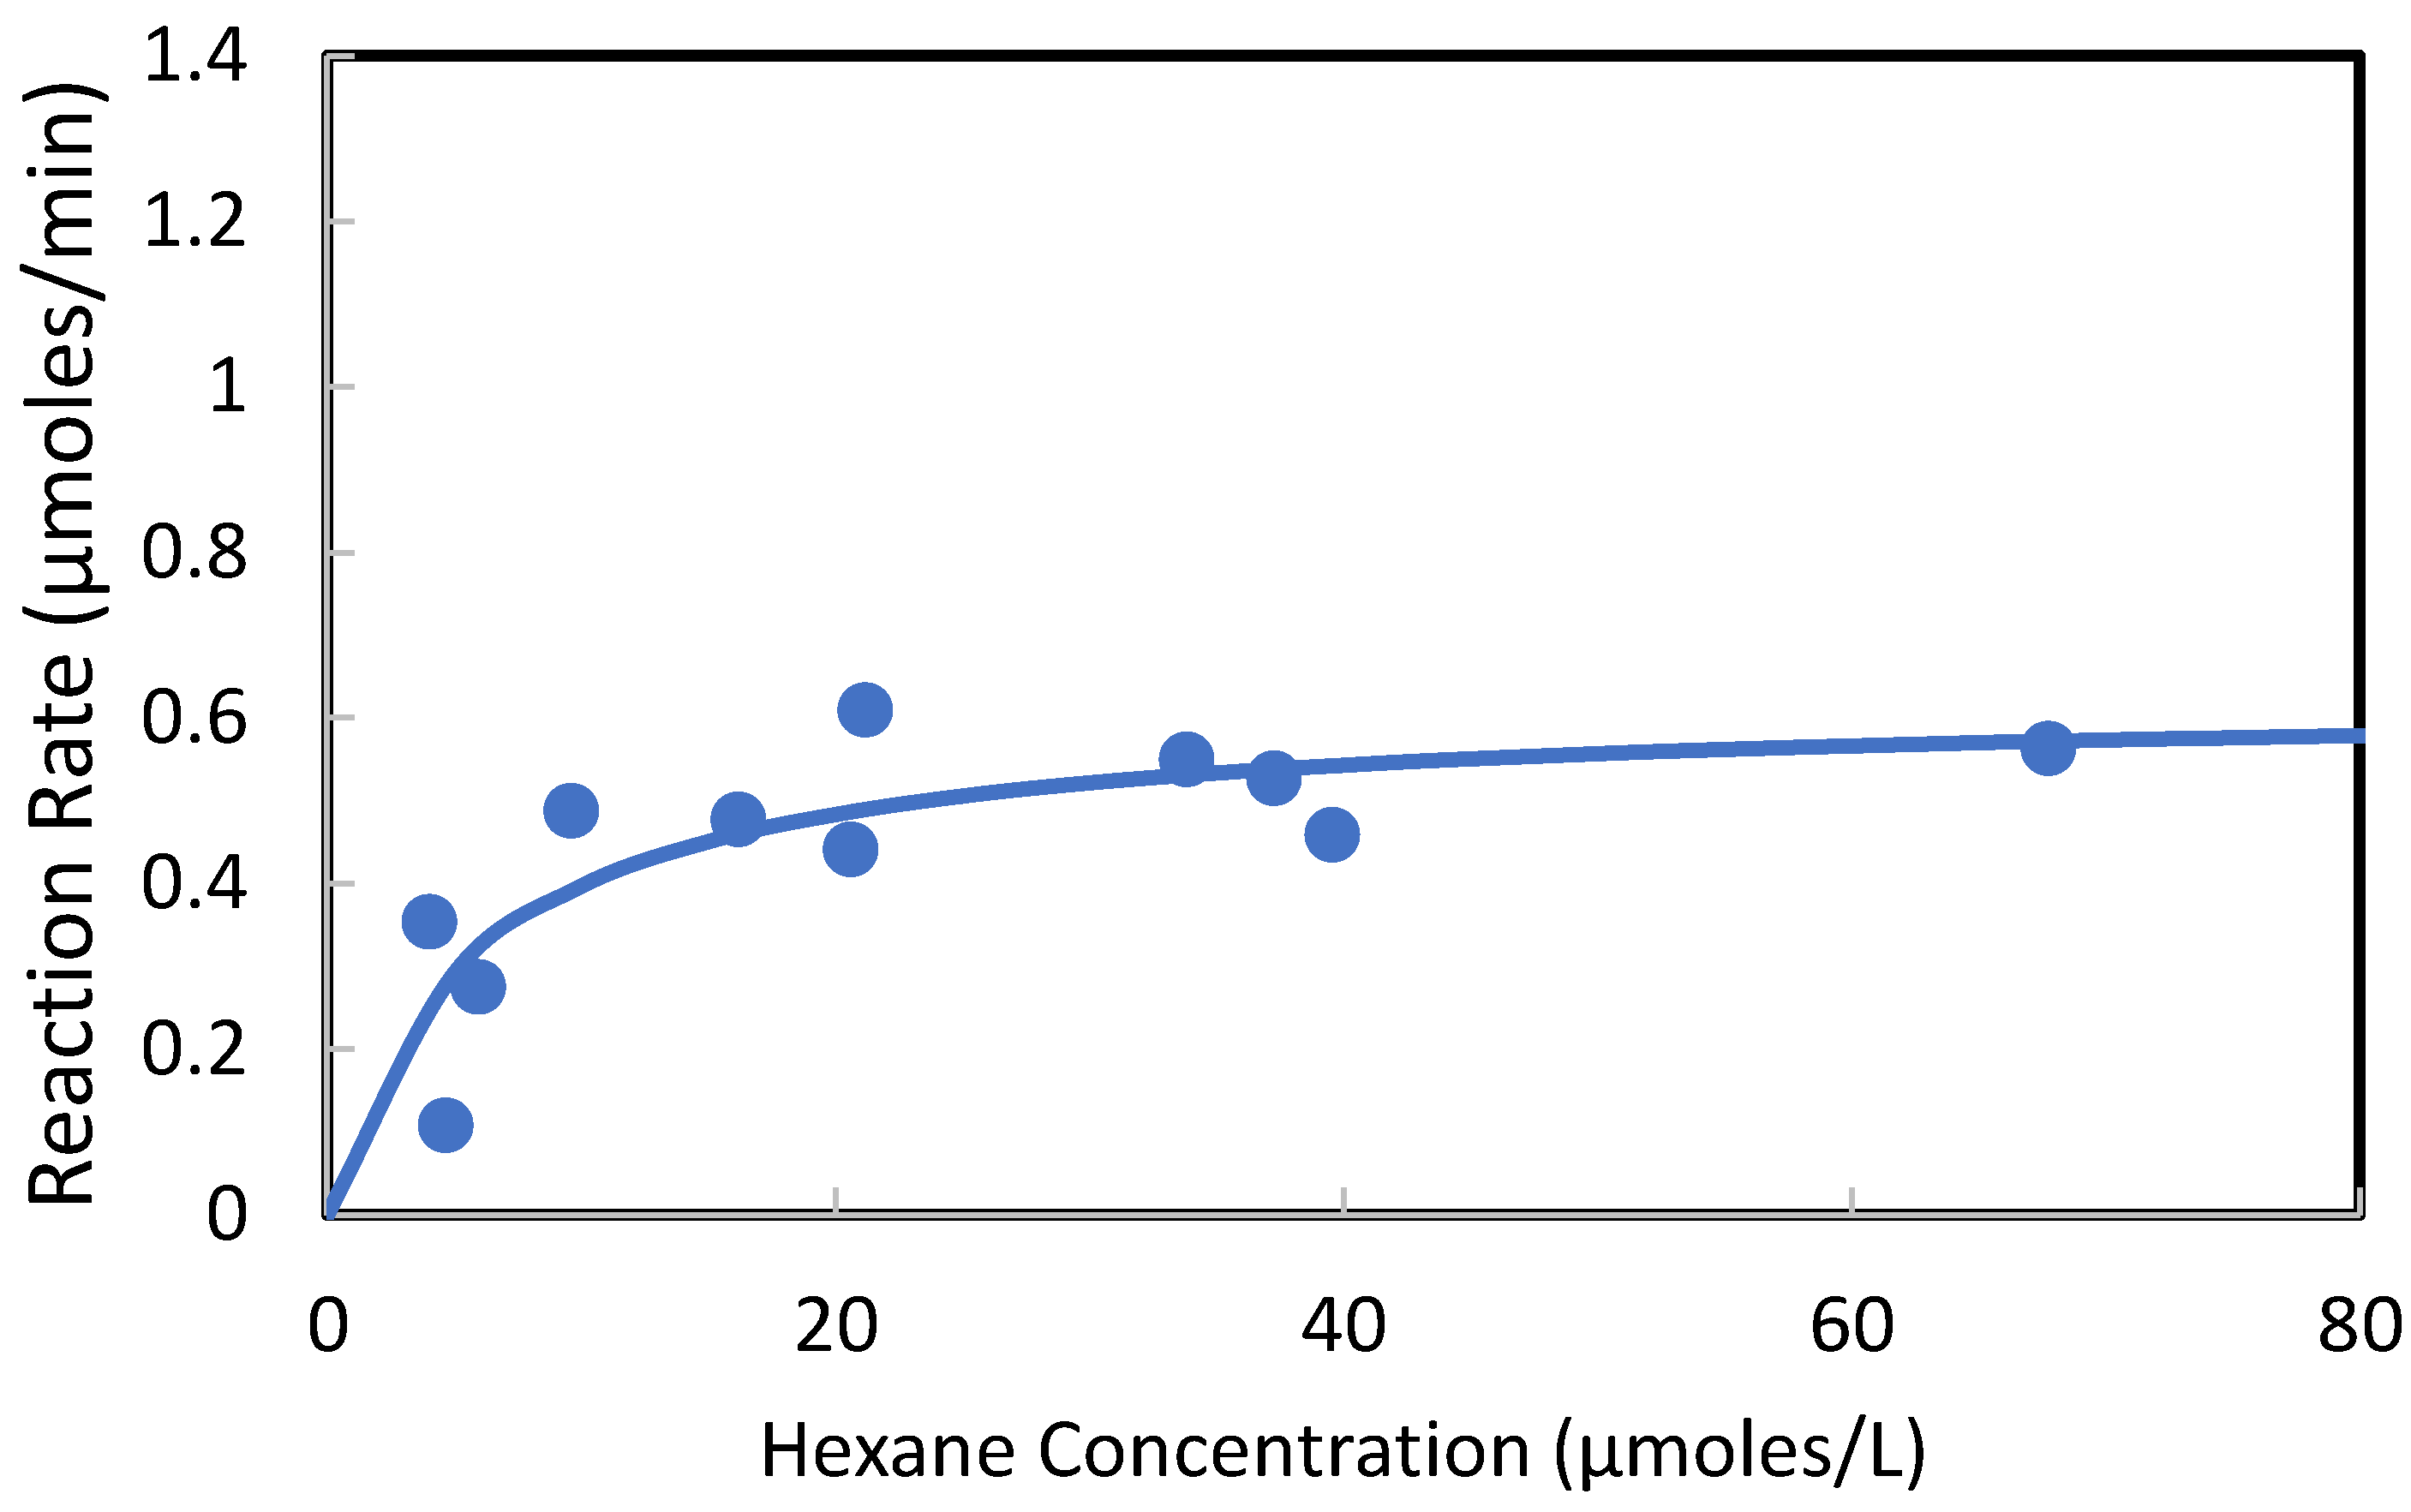
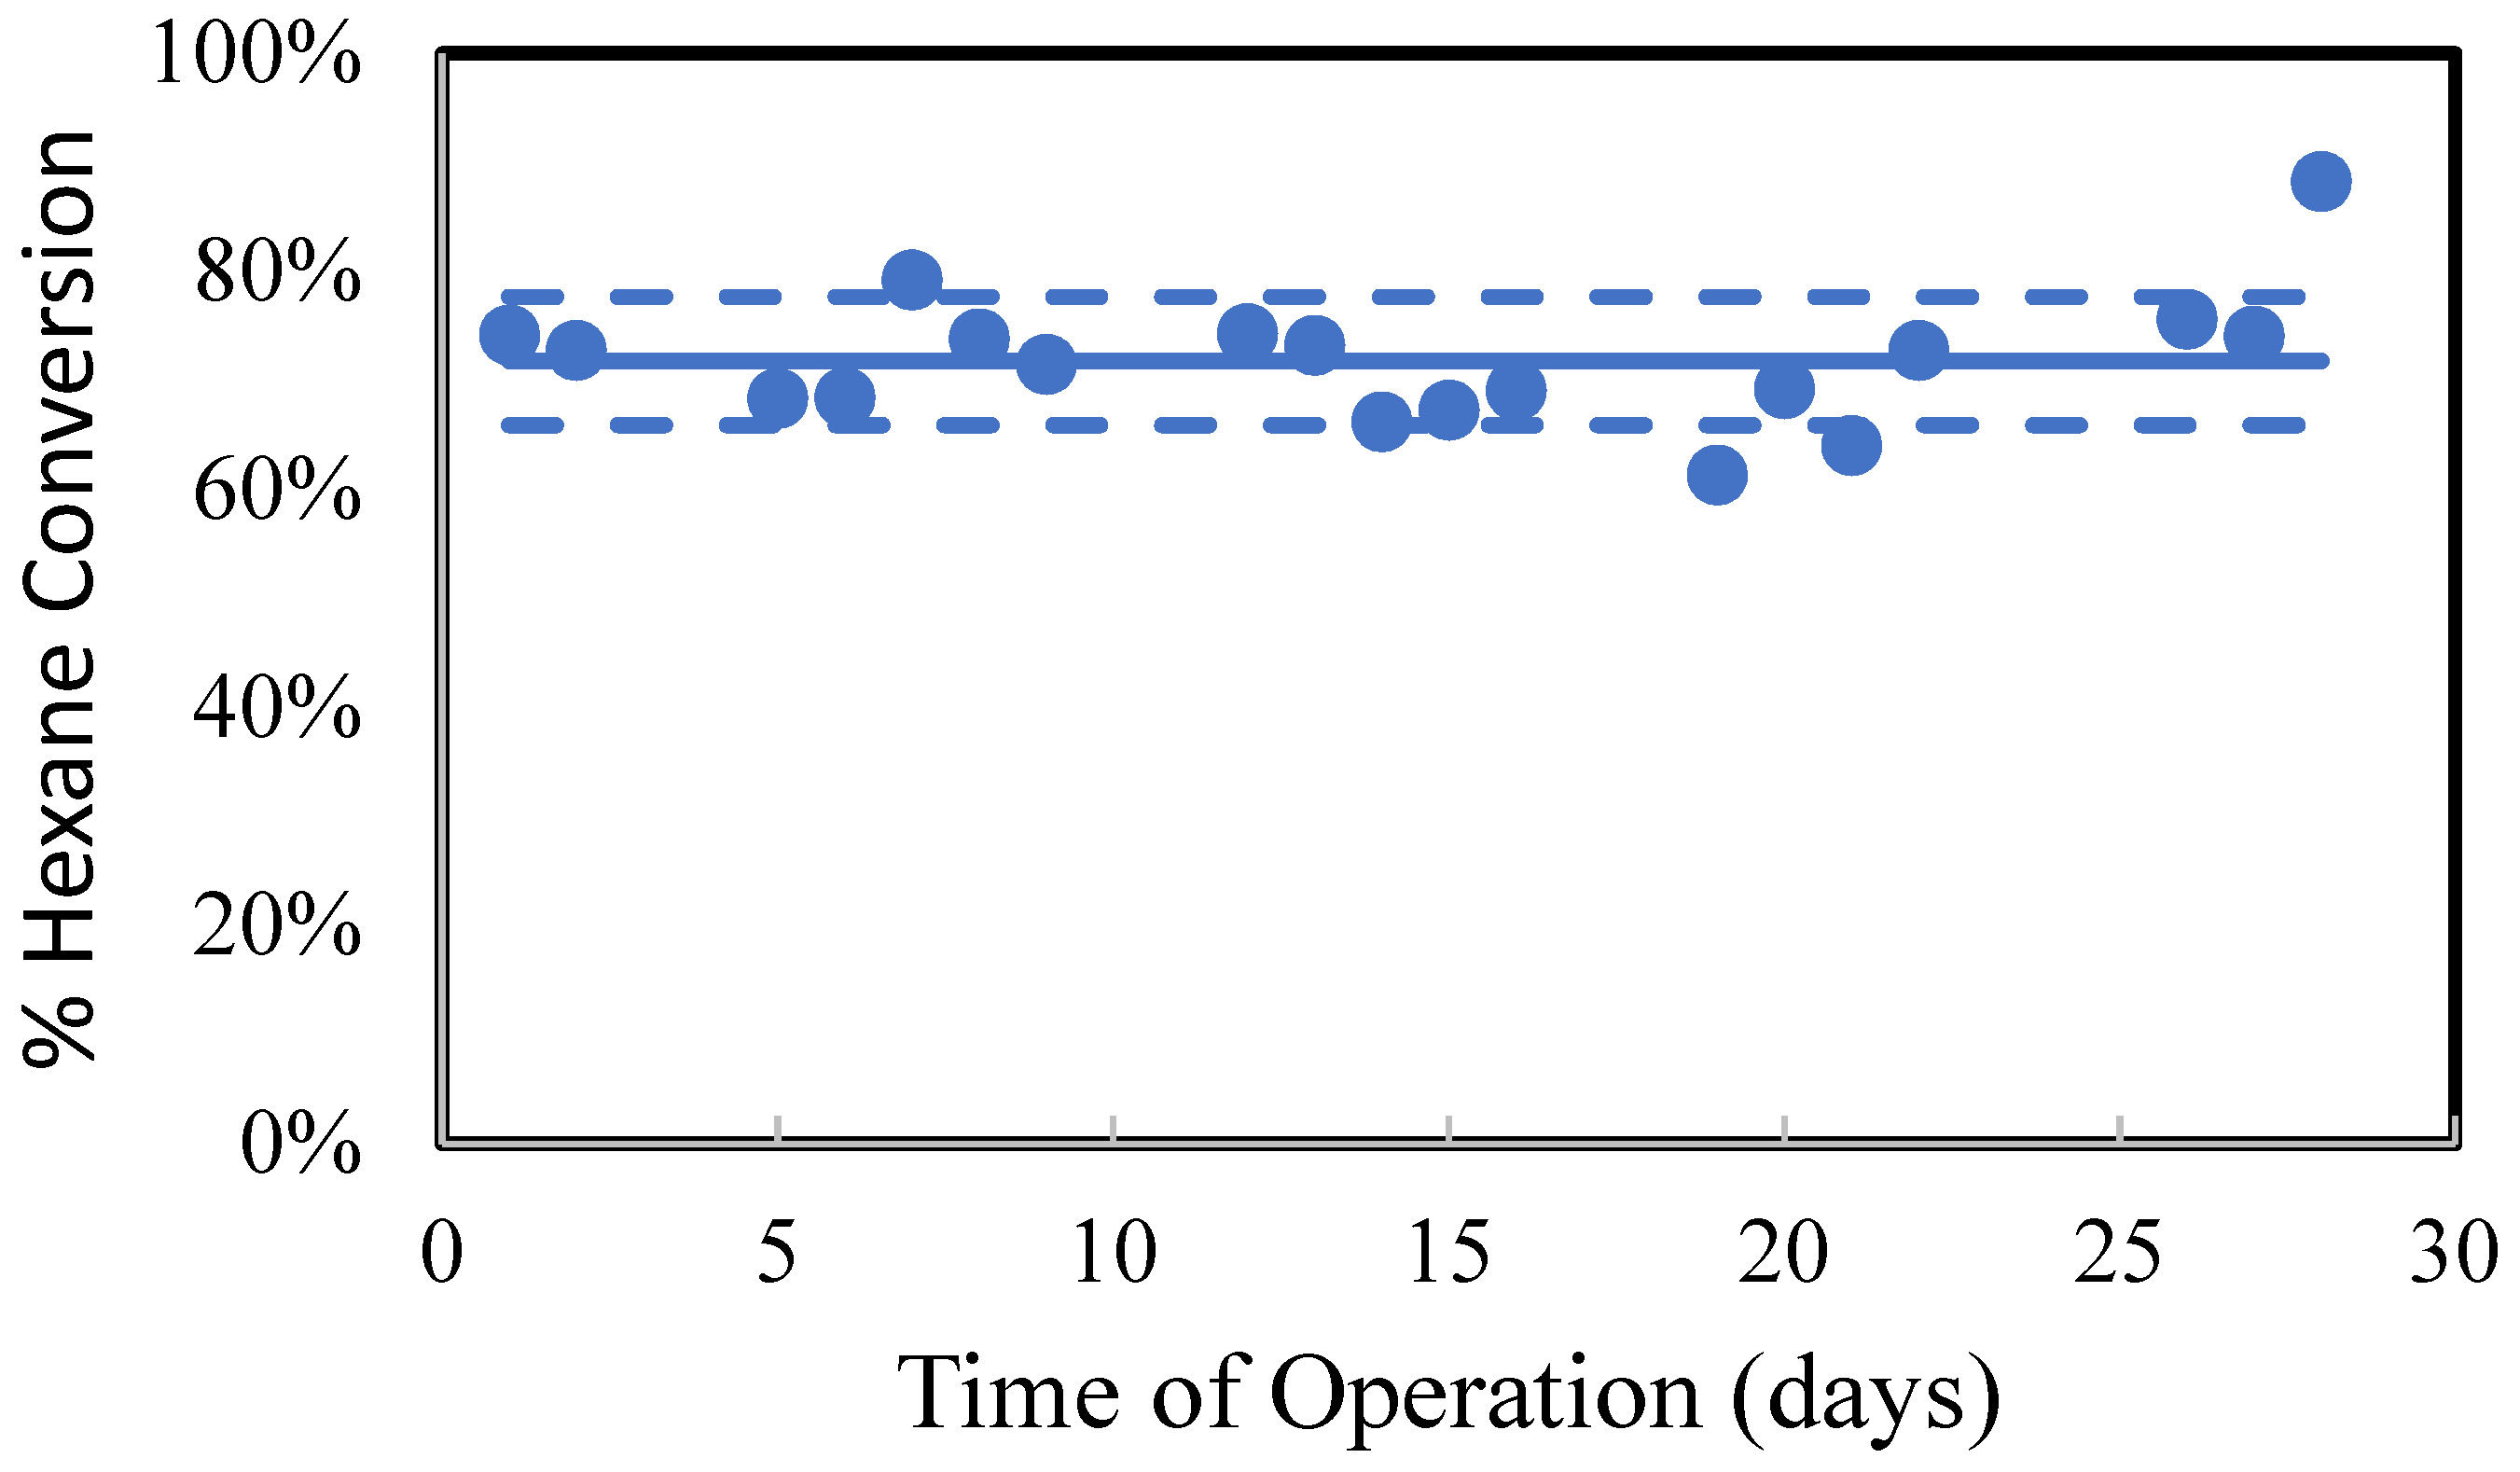
3.2. Hexane Vapor Photocatalytic Oxidation
4. Conclusions
Author Contributions
Funding
Institutional Review Board Statement
Informed Consent Statement
Data Availability Statement
Acknowledgments
Conflicts of Interest
References
- Urban Air Toxics. Available online: https://www.epa.gov/urban-air-toxics (accessed on 22 February 2022).
- About Urban Air Toxics. Available online: https://www.epa.gov/urban-air-toxics/about-urban-air-toxics (accessed on 22 February 2022).
- Annual Volatile Organic Compounds (VOC) Emissions from Road Vehicles in the United States from 1970 to 2020. Available online: https://www.statista.com/statistics/1234976/road-transportation-volatile-organic-compounds-emissions-us/ (accessed on 22 February 2022).
- Automotive Evaporative Emissions Systems. Available online: http://tiij.org/issues/issues/5_1/5_1e/5_1e.html (accessed on 22 February 2022).
- Onboard Refueling Vapor Recovery. Available online: https://en.wikipedia.org/wiki/Onboard_refueling_vapor_recovery (accessed on 22 February 2022).
- Evaporative Emission Regulations and EVAP Systems. Available online: https://www.automotive-iq.com/exhaust/articles/evaporative-emission-regulations-and-evap-systems (accessed on 22 February 2022).
- Siciliano, B.; Martins da Silva, C.; Loureiro, L.N.; Vicentini, P.C.; Arbilla, G. Hydrocarbon emissions in flex fuel vehicles using ethanol: Preliminary results using a method implemented in Brazil. Fuel 2021, 287, 119506. [Google Scholar] [CrossRef]
- Ethanol Blends. Available online: https://afdc.energy.gov/fuels/ethanol_blends.html (accessed on 22 February 2022).
- Waveform Lighting, PN 7021. Available online: https://www.waveformlighting.com/datasheets/CS_7021.pdf (accessed on 22 February 2022).
- Waveform Lighting, PN 7026. Available online: https://www.waveformlighting.com/datasheets/CS_7026.pdf (accessed on 22 February 2022).
- Limsuwan, P.; Ngotawornchai, B. Phase Characterization of TiO2 Powder by XRD and TEM. Kasetsart J. (Nat. Sci.) 2008, 42, 357–361. [Google Scholar]
- Sola, A.C.; Garzón Sousa, D.; Araña, J.; González Díaz, O.; Doña Rodríguez, J.M.; Ramírez de la Piscina, P.; Homs, N. Differences in the vapour phase photocatalytic degradation of ammonia and ethanol in the presence of water as a function of TiO2 characteristics and the presence of O2. Catal. Today 2016, 266, 53–61. [Google Scholar] [CrossRef]
- Kolinko, P.A.; Selishchev, D.S.; Kozlov, D.V. Visible light photocatalytic oxidation of ethanol vapor on titanium dioxide modified with noble metals. Theor. Exp. Chem. 2015, 51, 96–103. [Google Scholar] [CrossRef]
- Coronado, J.M.; Kataoka, S.; Tejedor-Tejedor, I.; Anderson, M.A. Dynamic phenomena during the photocatalytic oxidation of ethanol and acetone over nanocrystalline TiO2: Simultaneous FTIR analysis of gas and surface species. J. Catal. 2003, 219, 219–230. [Google Scholar] [CrossRef]
- Piera, E.; Ayllón, J.A.; Doménech, X.; Peral, J. TiO2 deactivation during gas-phase photocatalytic oxidation of ethanol. Catal. Today 2002, 76, 259–270. [Google Scholar] [CrossRef]
- Sauer, M.L.; Ollis, D.F. Photocatalyzed oxidation of ethanol and acetaldehyde in humidified air. J. Catal. 1996, 158, 570–582. [Google Scholar] [CrossRef]
- Nimlos, M.R.; Wolfrum, E.J.; Brewer, M.L.; Fennell, J.A.; Bintner, G. Gas-phase heterogeneous photocatalytic oxidation of ethanol: Patheways and kinetic modeling. Environ. Sci. Technol. 1996, 30, 3102–3110. [Google Scholar] [CrossRef]
- Muggli, D.S.; McCue, J.T.; Falconer, J.L. Mechanism of the photocatalytic oxidation of ethanol on TiO2. J. Catal. 1998, 173, 470–483. [Google Scholar] [CrossRef]
- Takeuchi, M.; Deguchi, J.; Sakai, S.; Anpo, M. Effect of H2O vapor addition on the photocatalytic oxidation of ethanol, acetaldehyde and acetic acid in the gas phase on TiO2 semiconductor powders. Appl. Catal. B 2010, 96, 218–223. [Google Scholar] [CrossRef]
- Saucedo-Lucero, J.O.; Arriaga, S. Photocatalytic degradation of hexane vapors in batch and continuous systems using impregnated ZnO nanoparticles. Chem. Eng. J. 2013, 218, 358–367. [Google Scholar] [CrossRef]
- Boulamanti, A.K.; Philippopoulos, C.J. Photocatalytic degradation of C5–C7 alkanes in the gas–phase. Atmos. Environ. 2009, 43, 3168–3174. [Google Scholar] [CrossRef]
- Zhang, P.; Liu, J. Photocatalytic degradation of trace hexane in the gas phase with and without ozone addition: Kinetic study. J. Photochem. Photobiol. A 2004, 167, 87–94. [Google Scholar] [CrossRef]
- Wei, P.; Qin, D.; Chen, J.; Li, Y.; Wen, M.; Ji, Y.; Li, G.; An, T. Photocatalytic ozonation mechanism of gaseous n-hexane on MOx–TiO2–foam nickel composite (M = Cu, Mn, Ag): Unveiling the role of ˙OH and ˙O2. Environ. Sci. Nano 2019, 6, 959. [Google Scholar] [CrossRef]


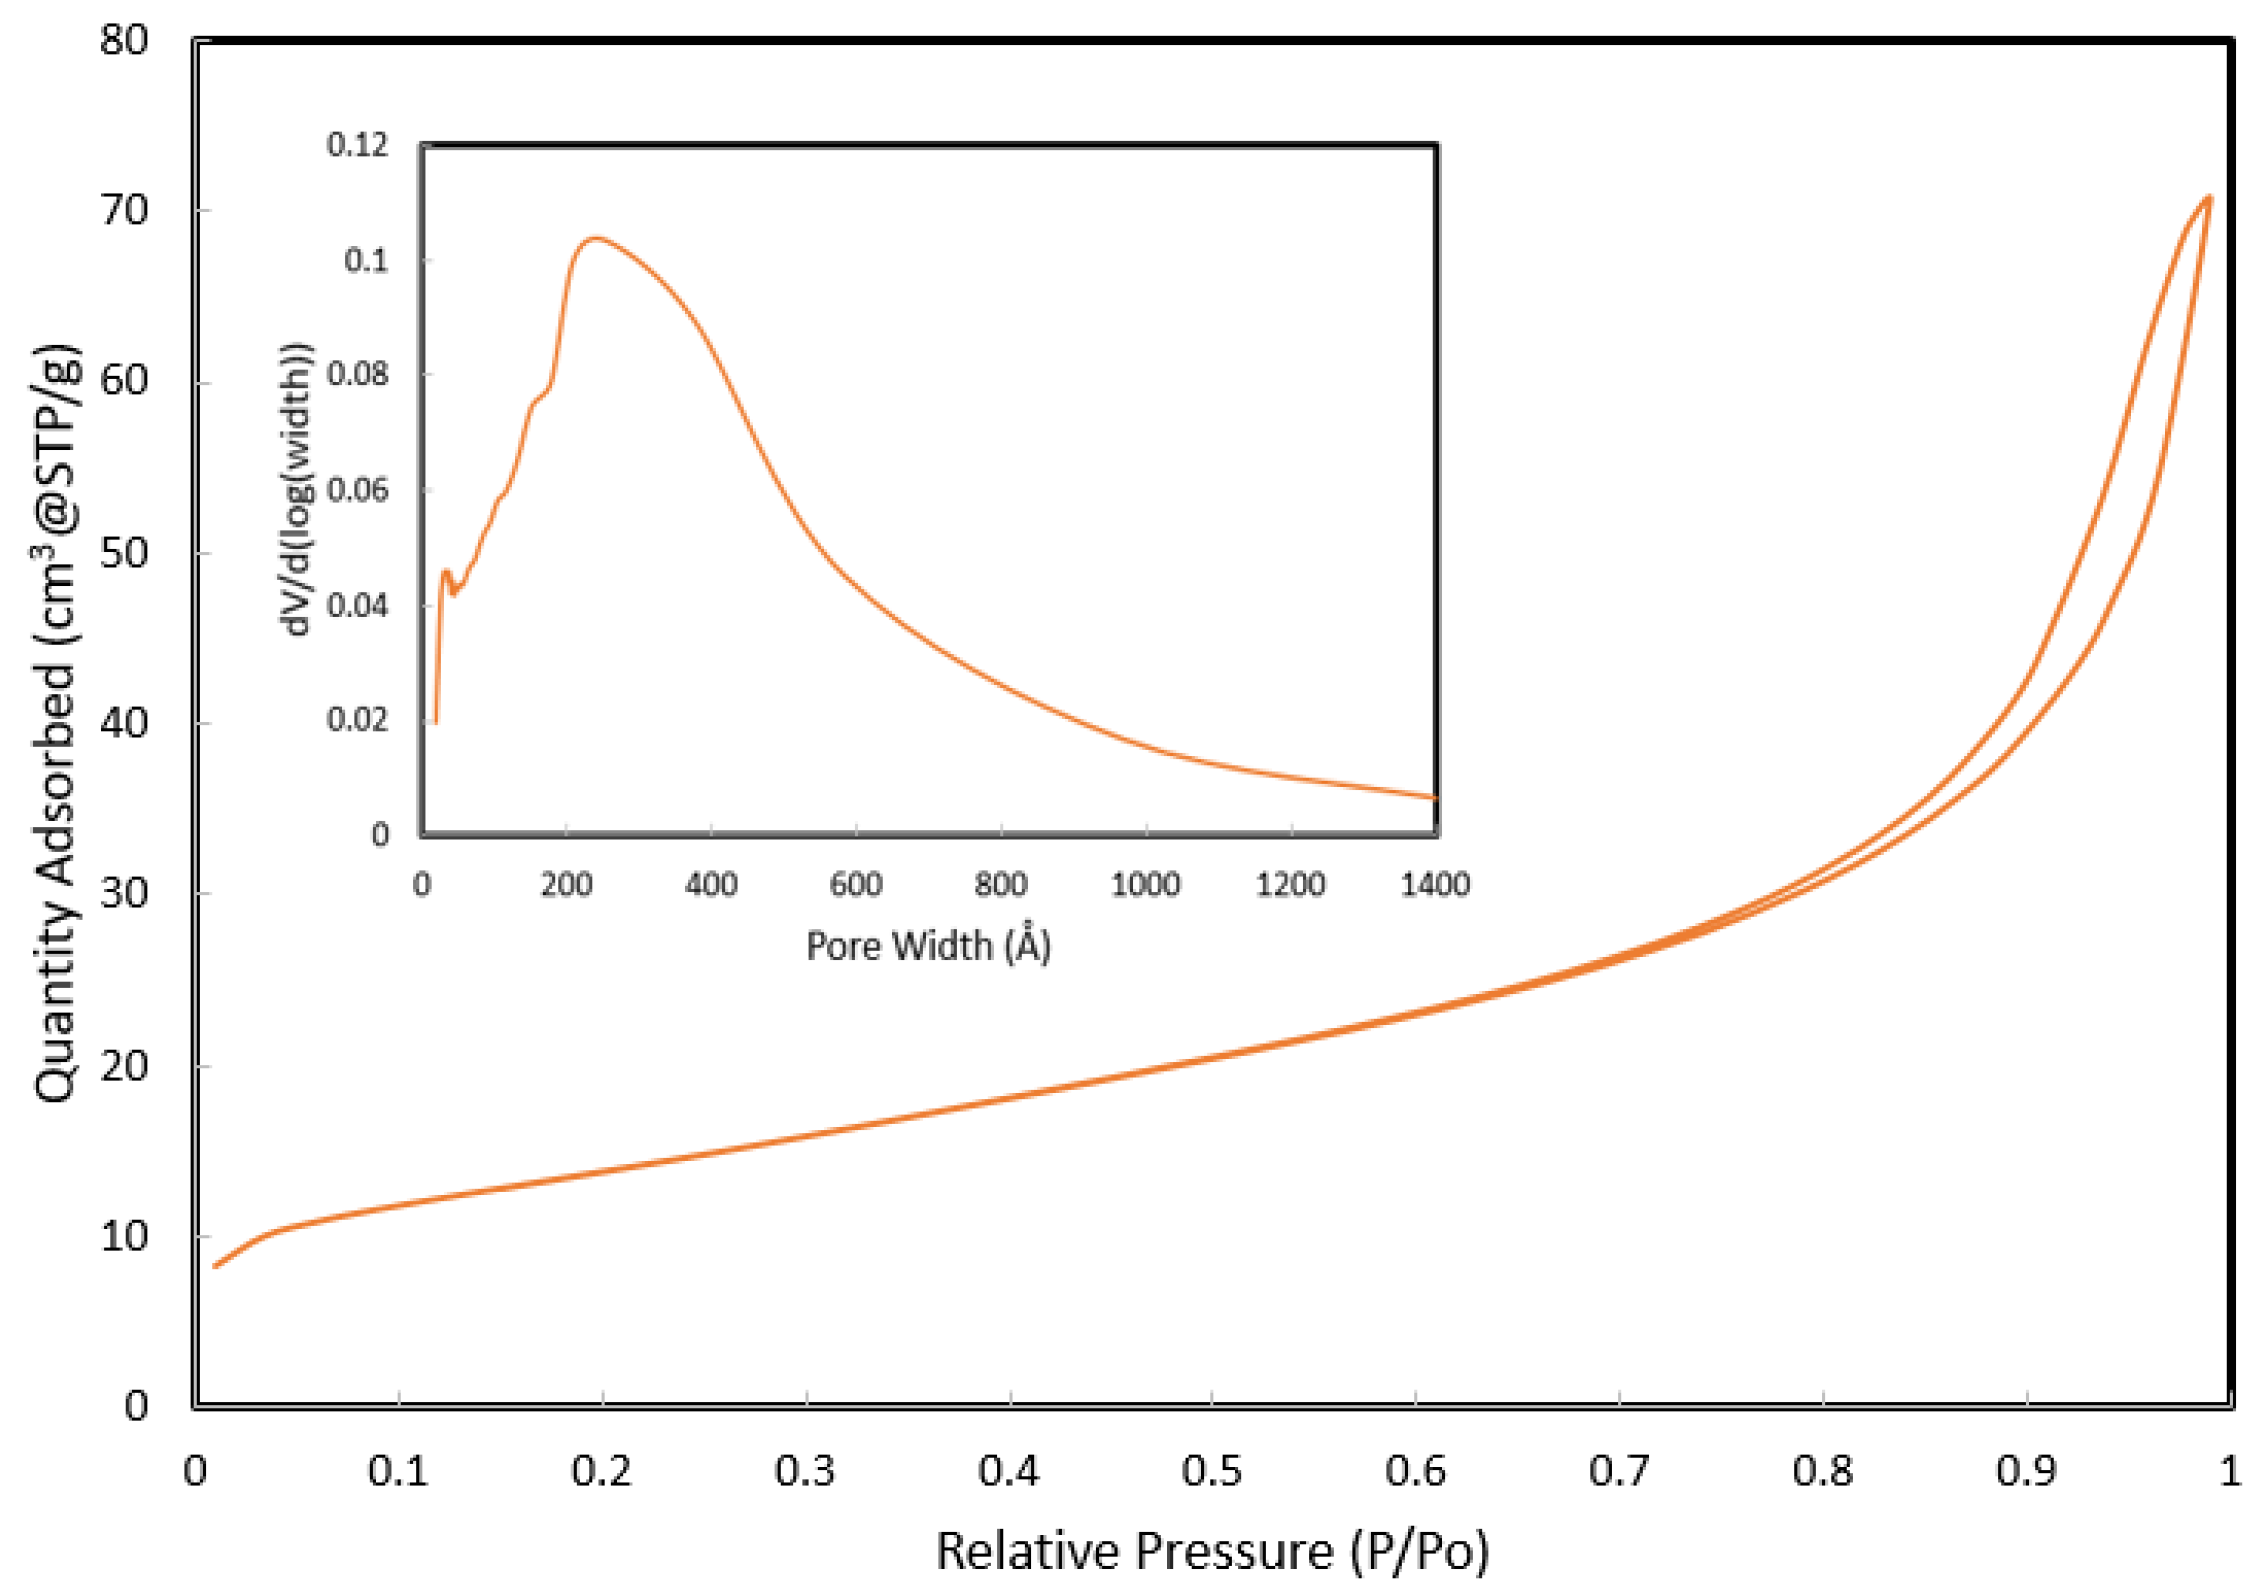
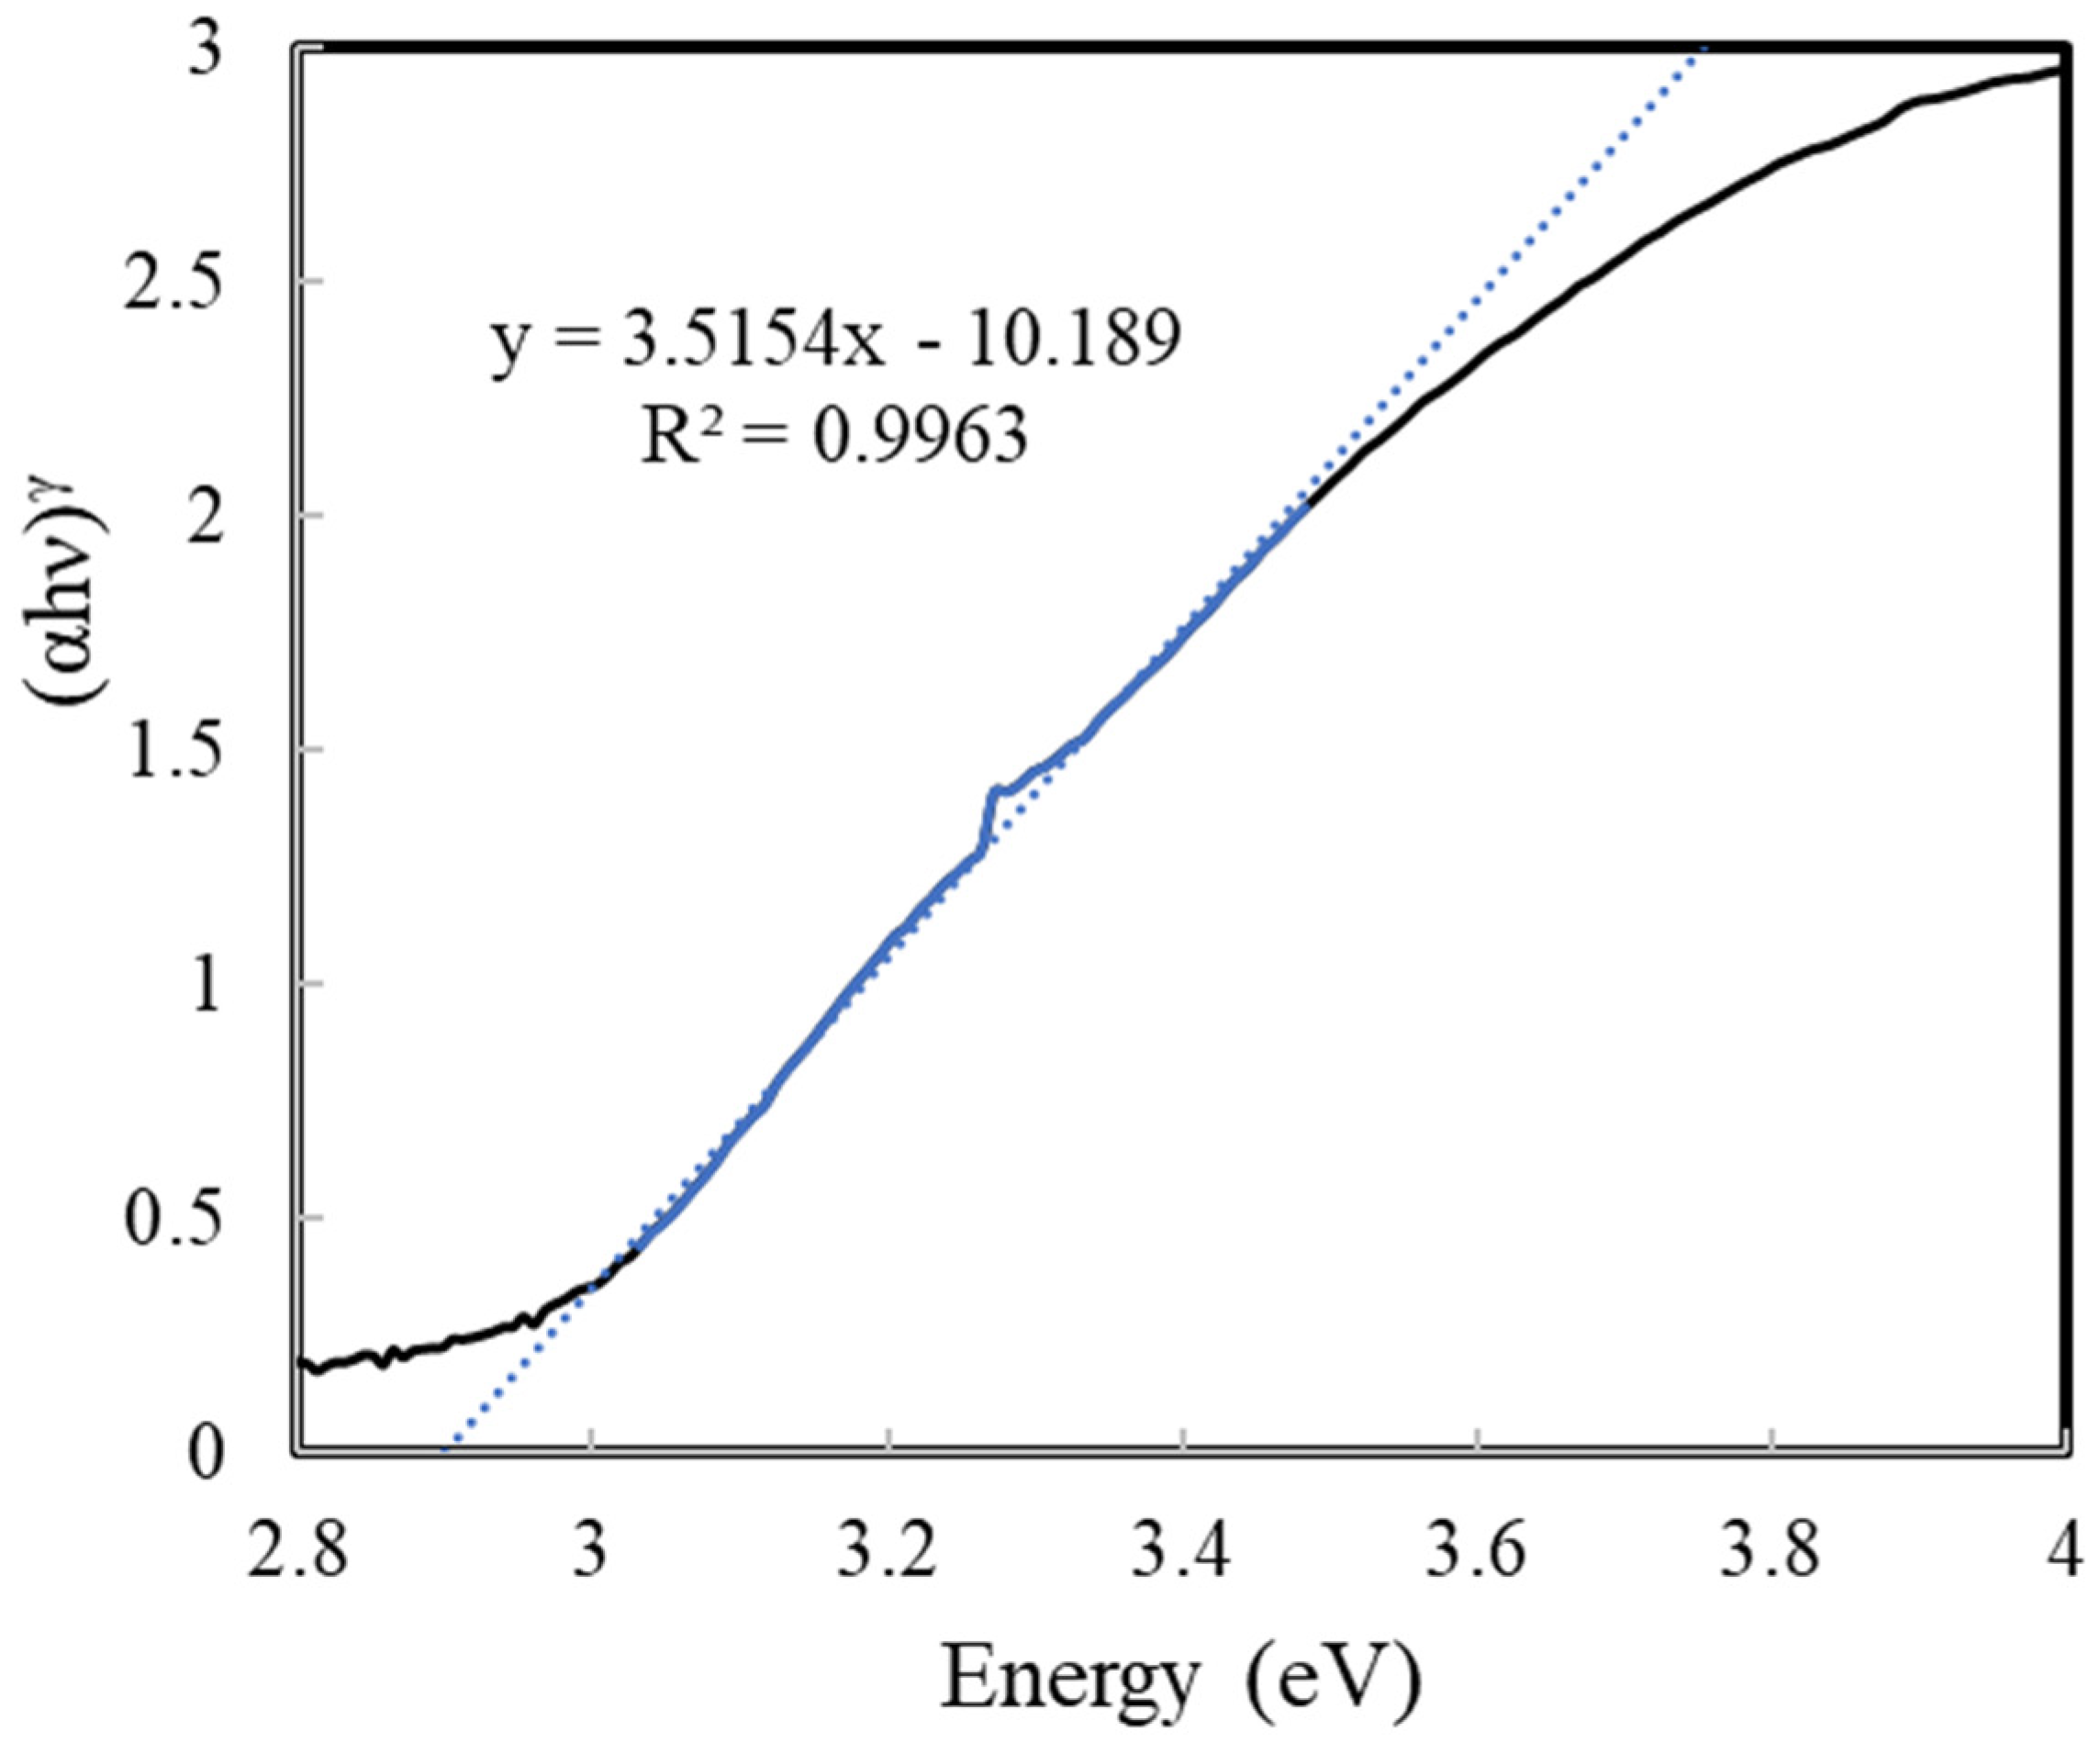
| BET Surface Area 1 (m2/g) | Total Pore Volume 2 (cm3 @ STP/g) | Average Pore Width 2 (nm) | Crystal Size 3 (nm) | Band Gap 4 (eV) | Crystal Structure A/R Ratio 5 | |
|---|---|---|---|---|---|---|
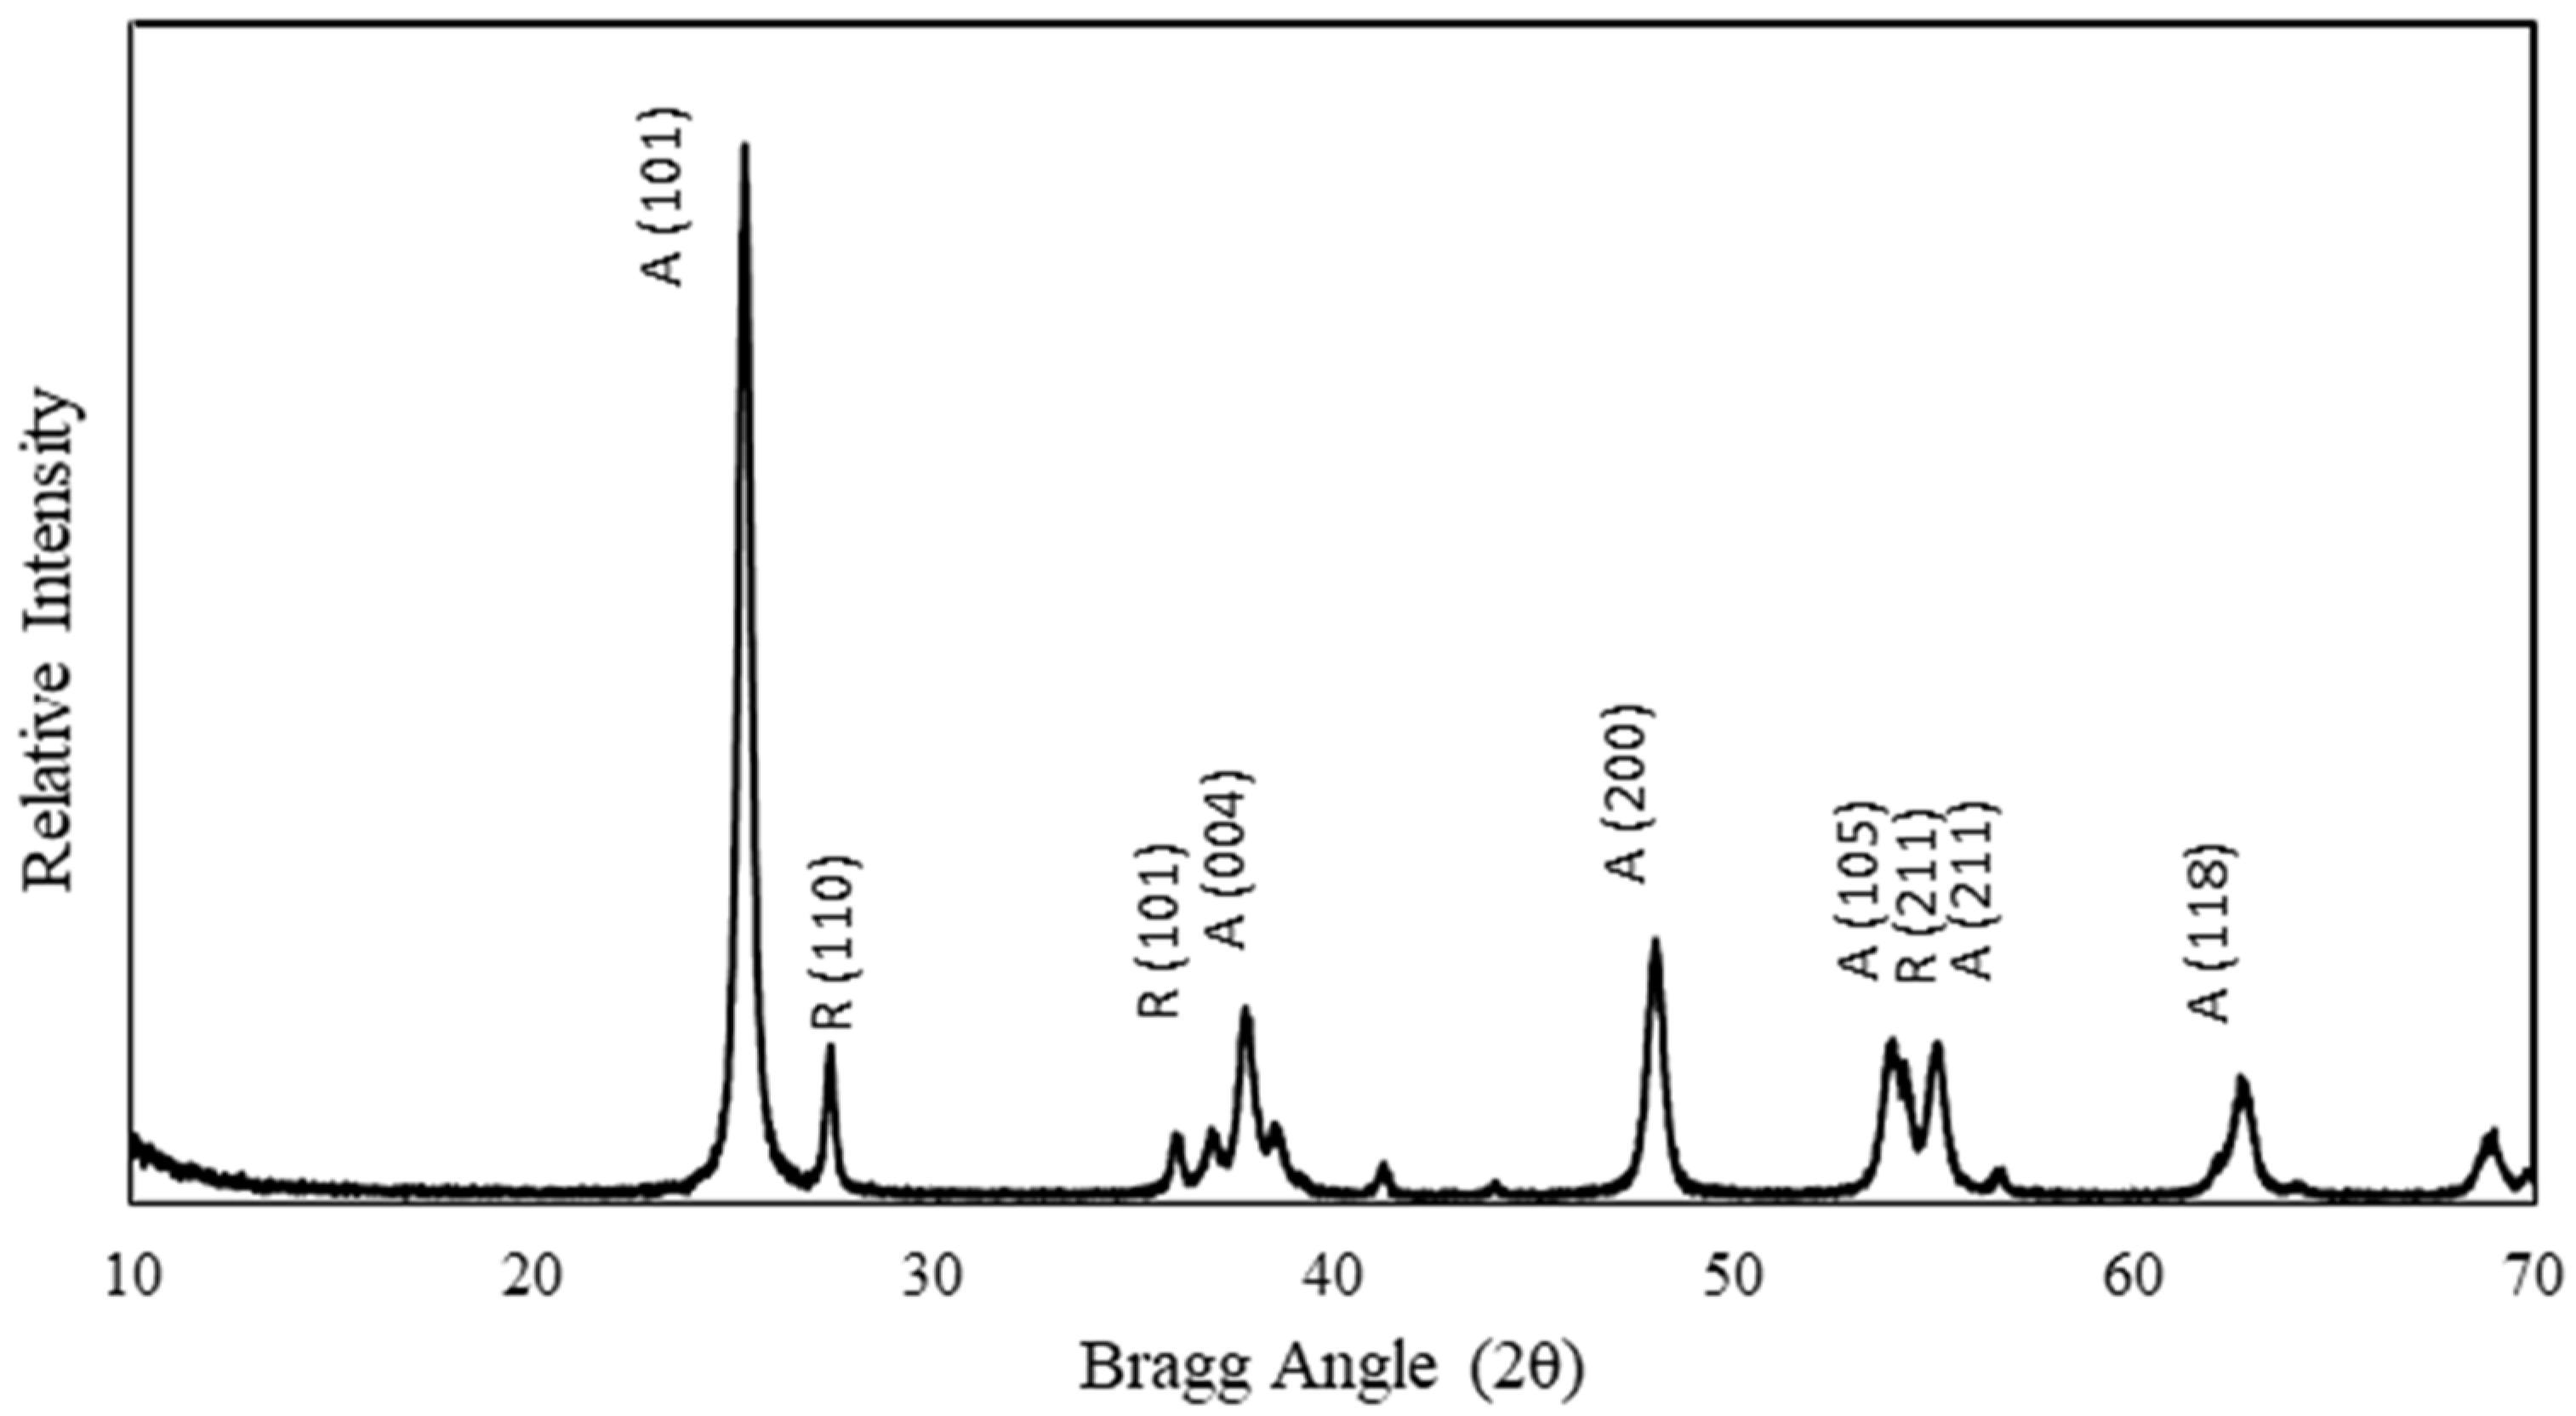
| P25 TiO2 | 49.5 | 0.105 | 9.7 | 22.9 | 2.9 | 6.5 |
Publisher’s Note: MDPI stays neutral with regard to jurisdictional claims in published maps and institutional affiliations. |
© 2021 by the authors. Licensee MDPI, Basel, Switzerland. This article is an open access article distributed under the terms and conditions of the Creative Commons Attribution (CC BY) license (https://creativecommons.org/licenses/by/4.0/).
Share and Cite
Almquist, C.B.; O’Hare, I.; Garza, L.; Badahman, A.; Jung, W.; Hanzel, S.; Neal, J. UV-LED Photocatalytic Device for the Oxidation of Ethanol and Hexane Vapors in Air. Chem. Proc. 2022, 6, 4. https://doi.org/10.3390/ECCS2021-11036
Almquist CB, O’Hare I, Garza L, Badahman A, Jung W, Hanzel S, Neal J. UV-LED Photocatalytic Device for the Oxidation of Ethanol and Hexane Vapors in Air. Chemistry Proceedings. 2022; 6(1):4. https://doi.org/10.3390/ECCS2021-11036
Chicago/Turabian StyleAlmquist, Catherine B., Isabelle O’Hare, Linda Garza, Akram Badahman, Will Jung, Samantha Hanzel, and John Neal. 2022. "UV-LED Photocatalytic Device for the Oxidation of Ethanol and Hexane Vapors in Air" Chemistry Proceedings 6, no. 1: 4. https://doi.org/10.3390/ECCS2021-11036
APA StyleAlmquist, C. B., O’Hare, I., Garza, L., Badahman, A., Jung, W., Hanzel, S., & Neal, J. (2022). UV-LED Photocatalytic Device for the Oxidation of Ethanol and Hexane Vapors in Air. Chemistry Proceedings, 6(1), 4. https://doi.org/10.3390/ECCS2021-11036