Proceeding Paper

Feasibility of Total White Blood Cells Counts by Visible-Near Infrared Spectroscopy †

1
TOXRUN—Toxicology Research Unit, University Institute of Health Sciences, CESPU, CRL, 4585-116 Gandra, Portugal
2
Veterinary Hospital Center (CHV), R. Manuel Pinto de Azevedo 118, 4100-320 Porto, Portugal
3
Department of Veterinary Medicine, Universidade Lusófona de Humanidades e Tecnologias, Campo Grande 376, 1749-024 Lisboa, Portugal
4
INESC TEC, Institute for Systems and Computer Engineering, Technology and Science, Campus da FEUP, Rua Dr. Roberto Frias, 4200-465 Porto, Portugal
*
Author to whom correspondence should be addressed.
Presented at the 1st International Electronic Conference on Chemical Sensors and Analytical Chemistry, 1–15 July 2021; Available online: https://csac2021.sciforum.net/.
Chem. Proc. 2021, 5(1), 77; https://doi.org/10.3390/CSAC2021-10434
Published: 30 June 2021

Abstract

:
Total white blood cells (WBC) count is an important indication for infection diagnosis, in both human and veterinary medicine. State-of-the-art WBC counts are performed by flow cytometry combined with light scattering or impedance measurements, in the clinical analysis laboratory. These technologies are complex and difficult to be miniaturized into a portable point-of-care (POC) system. Spectroscopy is one of the most powerful technologies for POC miniaturization due to its capacity to analyze low sample quantities, little to no sample preparation, and ‘real-time’ results. WBC is in the proportion of 1:1000 to red blood cells (RBC), and the latter dominate visible-near infrared (Vis-NIR) information due to their large quantities and hemoglobin absorbance. WBC are difficult to be detected by traditional spectral analysis because their information is contained within the interference of hemoglobin bands. Herein, we perform a feasibility study for the direct detection of WBC counts in canine blood by Vis-NIR spectroscopy for veterinary applications, benchmarking current chemometrics techniques with self-learning artificial intelligence—a new advanced method for high-accuracy quantification from spectral information. Results show that total WBC counts can be detected by Vis-NIR spectroscopy to an average detection limit of 7.8 × 10 9 cells/L, with an R 2 of 0.9880 between impedance flow cytometry analysis and spectral quantification. This result opens new possibilities for reagent-less POC technology in infection diagnosis. As WBC counts in dogs range from 5 to 45 × 10 9 cells/L, the detection limit obtained in this research allows concluding that the combined use of spectroscopy with this SL-AI new algorithm is a step towards the existence of portable and miniaturized Spectral POC hemogram analysis.

1. Introduction

Total white blood cell (WBC) count is one of the most requested hematology parameters because of its broad diagnostic value, including for infection and leukemia. Leukocytosis and leukopenia, which are abnormal values (high/low, respectively) in WBC counts, are more frequently associated with neutrophil changes, although other leukocytes and neoplastic cells can also cause fluctuations. Neutrophilia is usually related to inflammation, and neutropenia to greater peripheral use or reduced bone marrow production [1].
Most common methods for WBC differential are based on electrical impedance, laser light scattering, radio frequency conductivity, and/or flow cytometry [2] (Figure 1). The basic principles of operation for automated hematology analyzers are based on cell size affecting directly impedance and scattering angle. This approach has disadvantages for WBC differential, because cell sizes for each type of leukocyte are highly dependent on the development stage and differentiation, leading to inaccurate counts in current automated equipment [3]. Despite laser scattering technology provides better accuracy than impedance technology, the latter is widely adopted in Veterinary Medicine. Impedance counting is a cheaper technology and the best hematology practices recommend that blood smear microscope counts are performed on abnormal cases [4].
Spectroscopy is one of the leading technologies for the development of reagent-less point-of-care (POC) devices [5,6], capable of providing comprehensive clinical information from a single drop of blood (<10 μ L), with little or no sample preparation and real-time results.
Visible short-wave near-infrared (Vis-SWNIR) spectroscopy is an information-rich technology that carries both physical and chemical information, where the information about blood cells and constituents is distributed across the different wavelengths. Dominant spectral information in blood comes from highly absorbent constituents in the Vis-SWNIR region, such as hemoglobin present in red blood cells (RBC) and bilirubin in serum.
WBC is present in significantly lower quantities than RBC (∼1:1000), being considerably more difficult to be detected because the information about WBC is a small interference effect on the hemoglobin bands. State-of-the-art chemometrics and artificial intelligence technologies are unable to deal with small-scale interference and non-dominant spectral information sample constituents with good accuracy [6]. Such may lead to non-causal correlation in spectroscopy quantification, where the quantification is not obtained by direct relationship to the spectral absorbance bands, but rather by intrinsic correlations of the dataset [7], which may lead to erroneous diagnosis [6].
In this research, we study the capacity of WBC quantification by Vis-SWNIR spectroscopy and a new algorithm based on Self-Learning Artificial Intelligence [6]. This new approach isolates spectral interference by searching consistent covariance between WBC and spectral features—the covariance mode (CovM). CovM is a set of samples that allow the direct relationship between spectral features and WBC, by sharing the same latent structure information [6]. Ideally, the relationship between WBC and spectral features is given by a single eigenvector or latent variable (LV), allowing to unscramble spectral interference in complex samples such as blood.
Herein, we provide a feasibility study on using Vis-SWNIR spectroscopy for the quantification and diagnosis of WBC, by providing a benchmark between a common chemometrics technique—partial least squares (PLS), and our new methodology (SL-AI).

2. Materials and Methods

2.1. Hemogram Analysis

Blood samples from daily clinical practice were collected from the jugular vein by qualified personnel using standardized venipuncture procedures at the Centro Hospitalar Veterinário do Porto into EDTA tubes. The sample was measured to WBC by a Beckman–Coulter capillary impedance [8] Mindray BC-2800-vet auto-hematology analyzer (Mindray, Shenzen, China), and a drop of blood (10 μ L) was used for spectroscopy measurement.

2.2. Spectroscopy

Blood spectra were recorded using a POC prototype (INESC TEC, Porto, Portugal) using a 4500 K power LED as light source, and an USB-based miniaturized spectrometer (Ocean Insight STS-vis, Orlando, FL, USA) with an optical configuration and plug-in capsule system according to [5]. LED temperature and spectrometer integration times were automatically managed to maintain result consistency. Three replicates measurements were made for each blood sample.

2.3. Chemometrics

Spectral records were subjected to scattering correction (Mie and Rayleigh) before modeling. A feasibility benchmark is performed between PLS and SL-AI methods. PLS maximizes the global covariance between spectral features and WBC, by determining the orthogonal eigenvectors of the covariance matrix. The relationship between WBC and signal features is derived by the latent variables (LV), at each deflation. The number of LV is determined by cross-validation at the minimum value of the predicted residuals sum of squares (PRESS) [9].
SL-AI searches for stable covariance in spectral datasets, finding covariance modes (CovM). CovM is a group of samples that hold the same interference information characteristics, carrying proportionality between WBC and spectral features. Ideally, the CovM relationship between WBC and spectral features is given by a single eigenvector or latent variable (LV). The CovM is validated by leave one-out cross-validation [6].

3. Results and Discussion

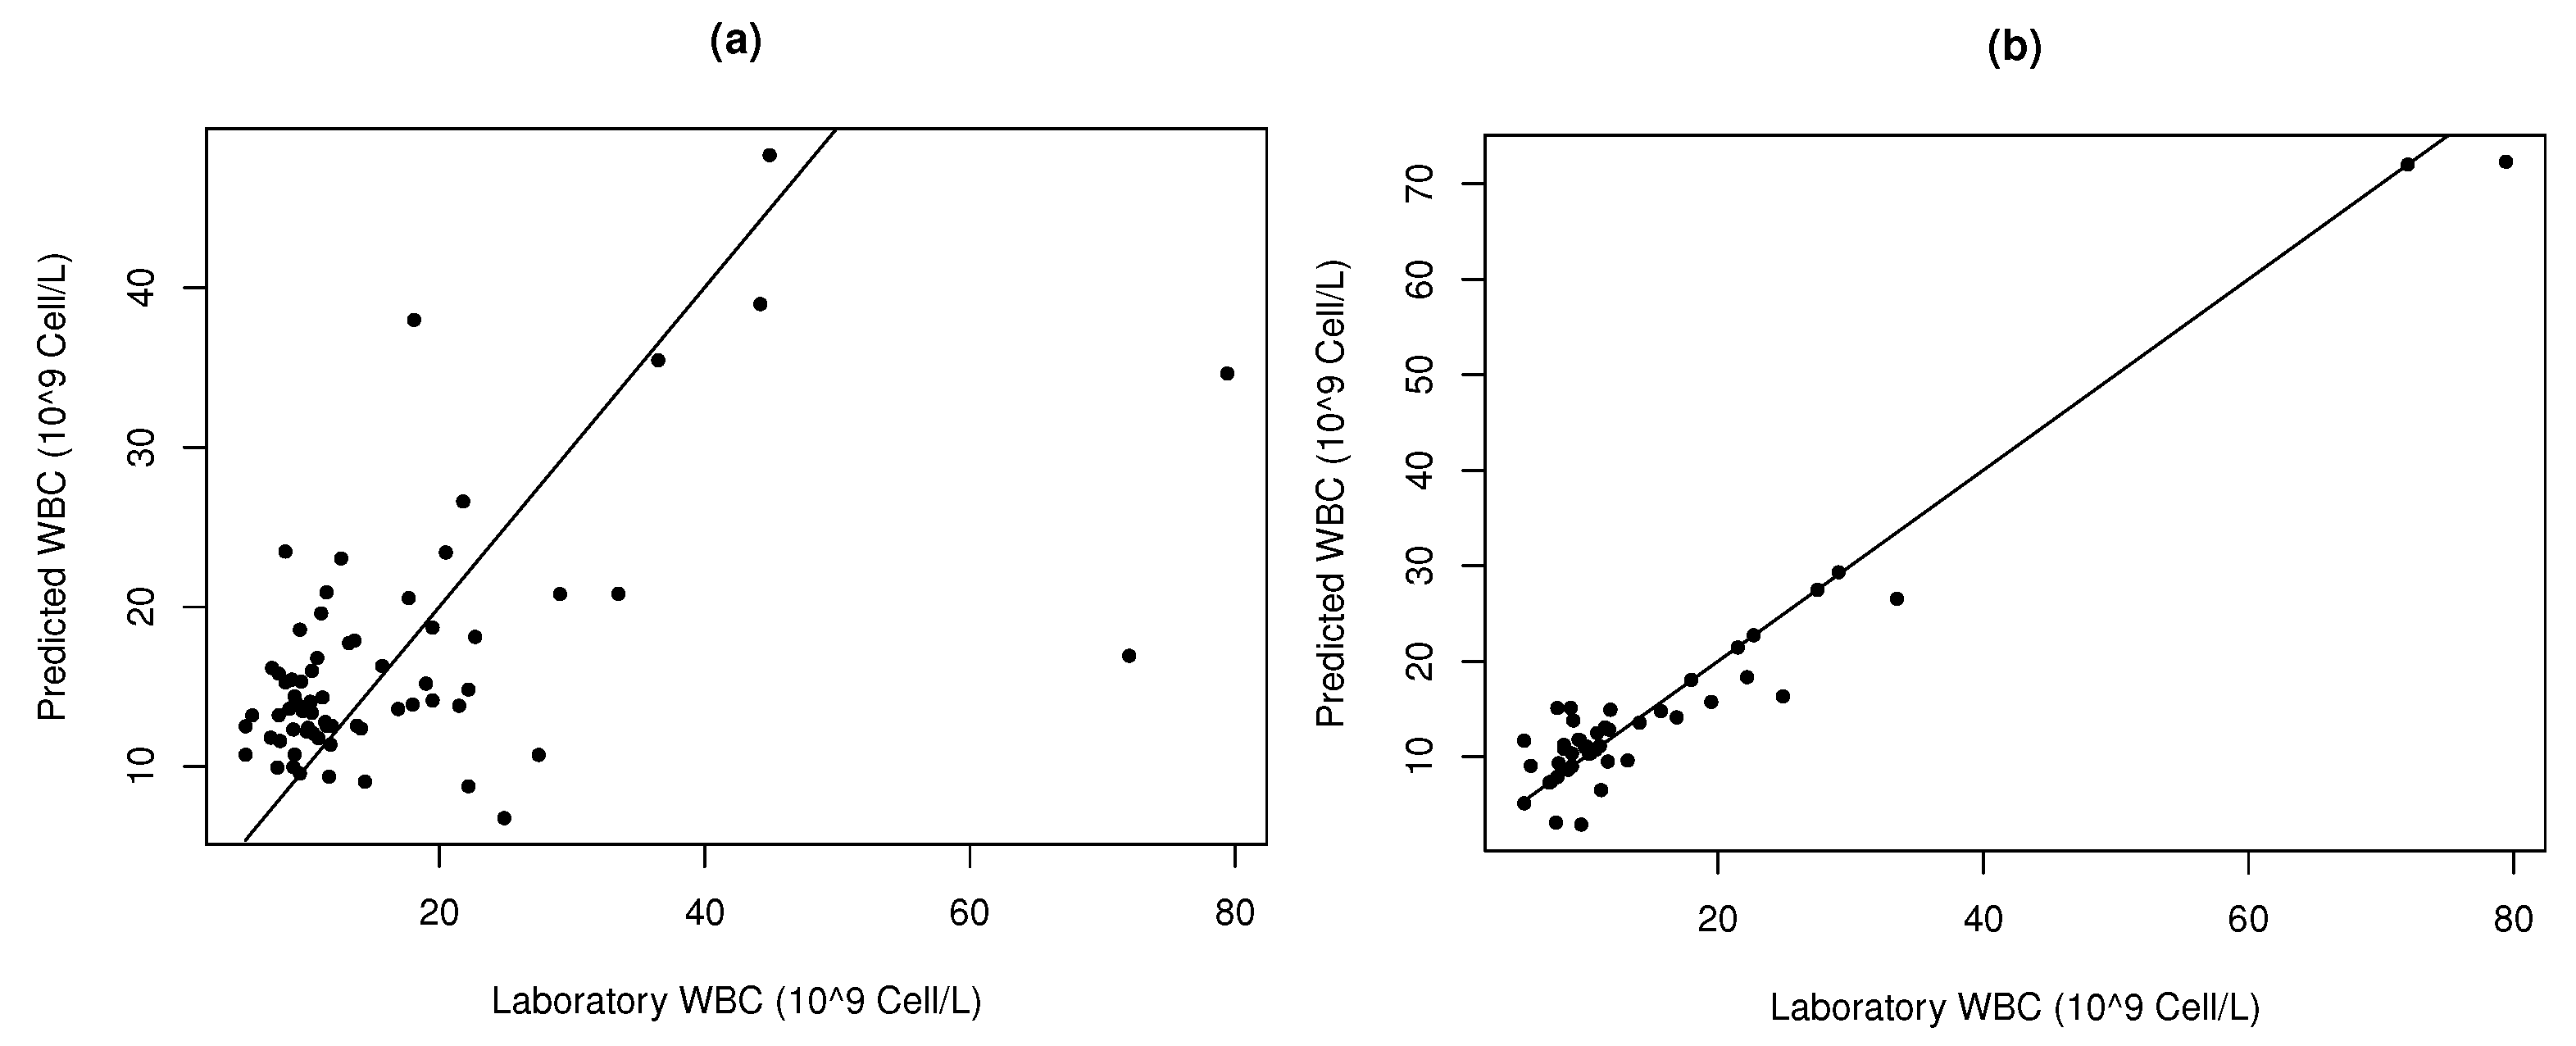
PLS attains a correlation of 0.5687 and a SE of 11.60 × 10 9 cell/L (Table 1). PLS analysis demonstrates that there is a significant correlation between spectral features and WBC, and the small-scale interference of WBC is present in the spectra records. PLS model is obtained with 5 LV. Such means that the interference information about WBC in the blood Vis-SWNIR spectra is present in a significant number of differentiated covariance modes, where the non-dominant spectral interference can be related to WBC. PLS collapses the 5 LV into a single linear coefficient, which relates the WBC to the recorded spectra, leading to an averaged representation of all covariance modes present in the dataset. Such results in a high SE and MAPE of 44.62%. The PLS model is unable to estimate WBC values above 45.00 × 10 9 cell/L, misdiagnosing severe infection cases (Figure 2).
The minimal total error criteria established by the American Society for Veterinary Clinical Pathology (ASVCP) for WBC is 20%. PLS shows to be unable to provide the necessary accuracy for WBC spectral POC technology.
SL-AI has a significantly higher correlation (R = 0.9733), a SE of 2.16 × 10 9 cell/L, and a MAPE of 20.00%. SL-AI covariance modes are obtained with 3 LV (Table 1). Results show that the different covariance modes (CovM) hold spectral interference proportional to WBC. Such demonstrates that it is possible to search non-dominant spectral interference from WBC and correlate it to total WBC count (Figure 3).
SL-AI CovM relationships are obtained with 3 LV. This is an indication that interference with other constituents and WBC differential population are incorporated in total WBC count, and that this higher complexity is not completely unscrambled in the dataset. In ideal conditions, CovM is obtained with a single LV (one eigenvector), directly relating the constituent concentration to spectral interference. The results show that non-dominant WBC spectral interference information has high complexity, which can be attributed to complex immune response, where differentiated cell types act at different stages and levels of infection or inflammation. The LV number re-assures the need for further studies, in order to investigate the source of non-dominant spectral interference attributed to WBC. Results may be improved by:
i. 
Larger datase—more data can help to complement the information of consistent CovM, allowing detection of single LV CovM;
ii. 
Feature space optimization—optimize the search for a feature space that better discriminates the small variation of WBC interference (e.g., Fourier or Wavelets decomposition).
Despite the limitations shown in this feasibility study, WBC quantification using Vis-SWNIR spectroscopy in conjunction with the new SL-AI algorithm can attain a total error estimate of 20%. Such result is following the ASVCP total allowable error for WBC in dog blood [4], but is above the 15% total allowable error in humans defined by CLIA [10].

4. Conclusions

This feasibility study has shown that low intensity, non-dominant, and multi-scale interferent spectral information is possible to be accessed by unscrambling information with the CovM principle included in our SL-AI method. The smaller quantities of WBC and corresponding interference with dominant constituents, such as erythrocytes, hemoglobin, and bilirubin, are detectable in each CovM. The results allow us to conclude that a spectral POC in the Vis-SWNIR for measuring WBC is achievable, for the application in both veterinary and human medicine.

Author Contributions

T.G.B., L.R. and H.G.: Investigation, methodology, validation, writing—review and editing; F.S.: investigation, hardware and firmware; R.C.M.: conceptualization, software and hardware, funding acquisition, writing—original draft, resources and formal analysis, project administration. All authors have read and agreed to the published version of the manuscript.

Funding

Rui Costa Martins acknowledges Fundação para a Ciência e Tecnologia (FCT) research contract grant (CEEIND/017801/2018).

Data Availability Statement

Not applicable.

Conflicts of Interest

The authors declare that they have no known competing financial interests or personal relationships that could have appeared to influence the work reported in this paper.

References

  1. Burton, A.G.; Jandrey, K.E. Leukocytosis and Leukopenia. In Textbook of Small Animal Emergency Medicine; Drobatz, K.J., Hopper, K., Rozanski, E., Silverstein, D.C., Eds.; John Wiley & Sons, Inc.: New York, NY, USA, 2018. [Google Scholar] [CrossRef]
  2. Chabot-Richards, D.S.; George, T.I. White blood cell counts: Reference methodology. Clin. Lab Med. 2015, 35, 11–24. [Google Scholar] [CrossRef] [PubMed]
  3. Rishniw, M.; Pion, P.D. Evaluation of Performance of Veterinary In-Clinic Hematology Analyzers. Vet. Clin. Path. 2016, 45, 604–614. [Google Scholar] [CrossRef] [PubMed]
  4. Nabity, M.B.; Harr, K.E.; Camus, M.S.; Flatland, B.; Vap, L.M. ASVCP guidelines: Allowable total error hematology. Vet. Clin. Pathol. 2018, 47, 9–21. [Google Scholar] [CrossRef] [Green Version]
  5. Martins, R.C.; Sousa, N.J.; Osorio, R. Optical System for Parameter Characterization of an Element of Body Fluid or Tissue. U.S. Patent 10209178B2, 19 February 2019. [Google Scholar]
  6. Martins, R.C. Big Data Self-Learning Artificial Intelligence Methodology for the Accurate Quantification and Classification of Spectral Information under Complex Variability and Multi-Scale Interference. WO Patent WO/2018/060967, 5 April 2018. [Google Scholar]
  7. Pasquini, C. Near infrared spectroscopy: A mature analytical technique with new perspectives—A review. Anal. Chim. Acta 2018, 1026, 8–36. [Google Scholar] [CrossRef] [PubMed]
  8. Brown, M.D.; Carl, T. Wittwer. Flow cytometry: Principles and clinical applications in hematology. Clin. Chem. 2000, 46, 1221–1229. [Google Scholar] [CrossRef] [PubMed] [Green Version]
  9. Geladi, P.; Kowalsky, B. Partial least squares regression: A tutorial. Anal. Acta 1988, 185, 1–17. [Google Scholar] [CrossRef]
  10. Westgard, J. CLIA Requirements for Analytical Chemistry. 2021. Available online: https://www.westgard.com/clia.htm (accessed on 1 May 2021).
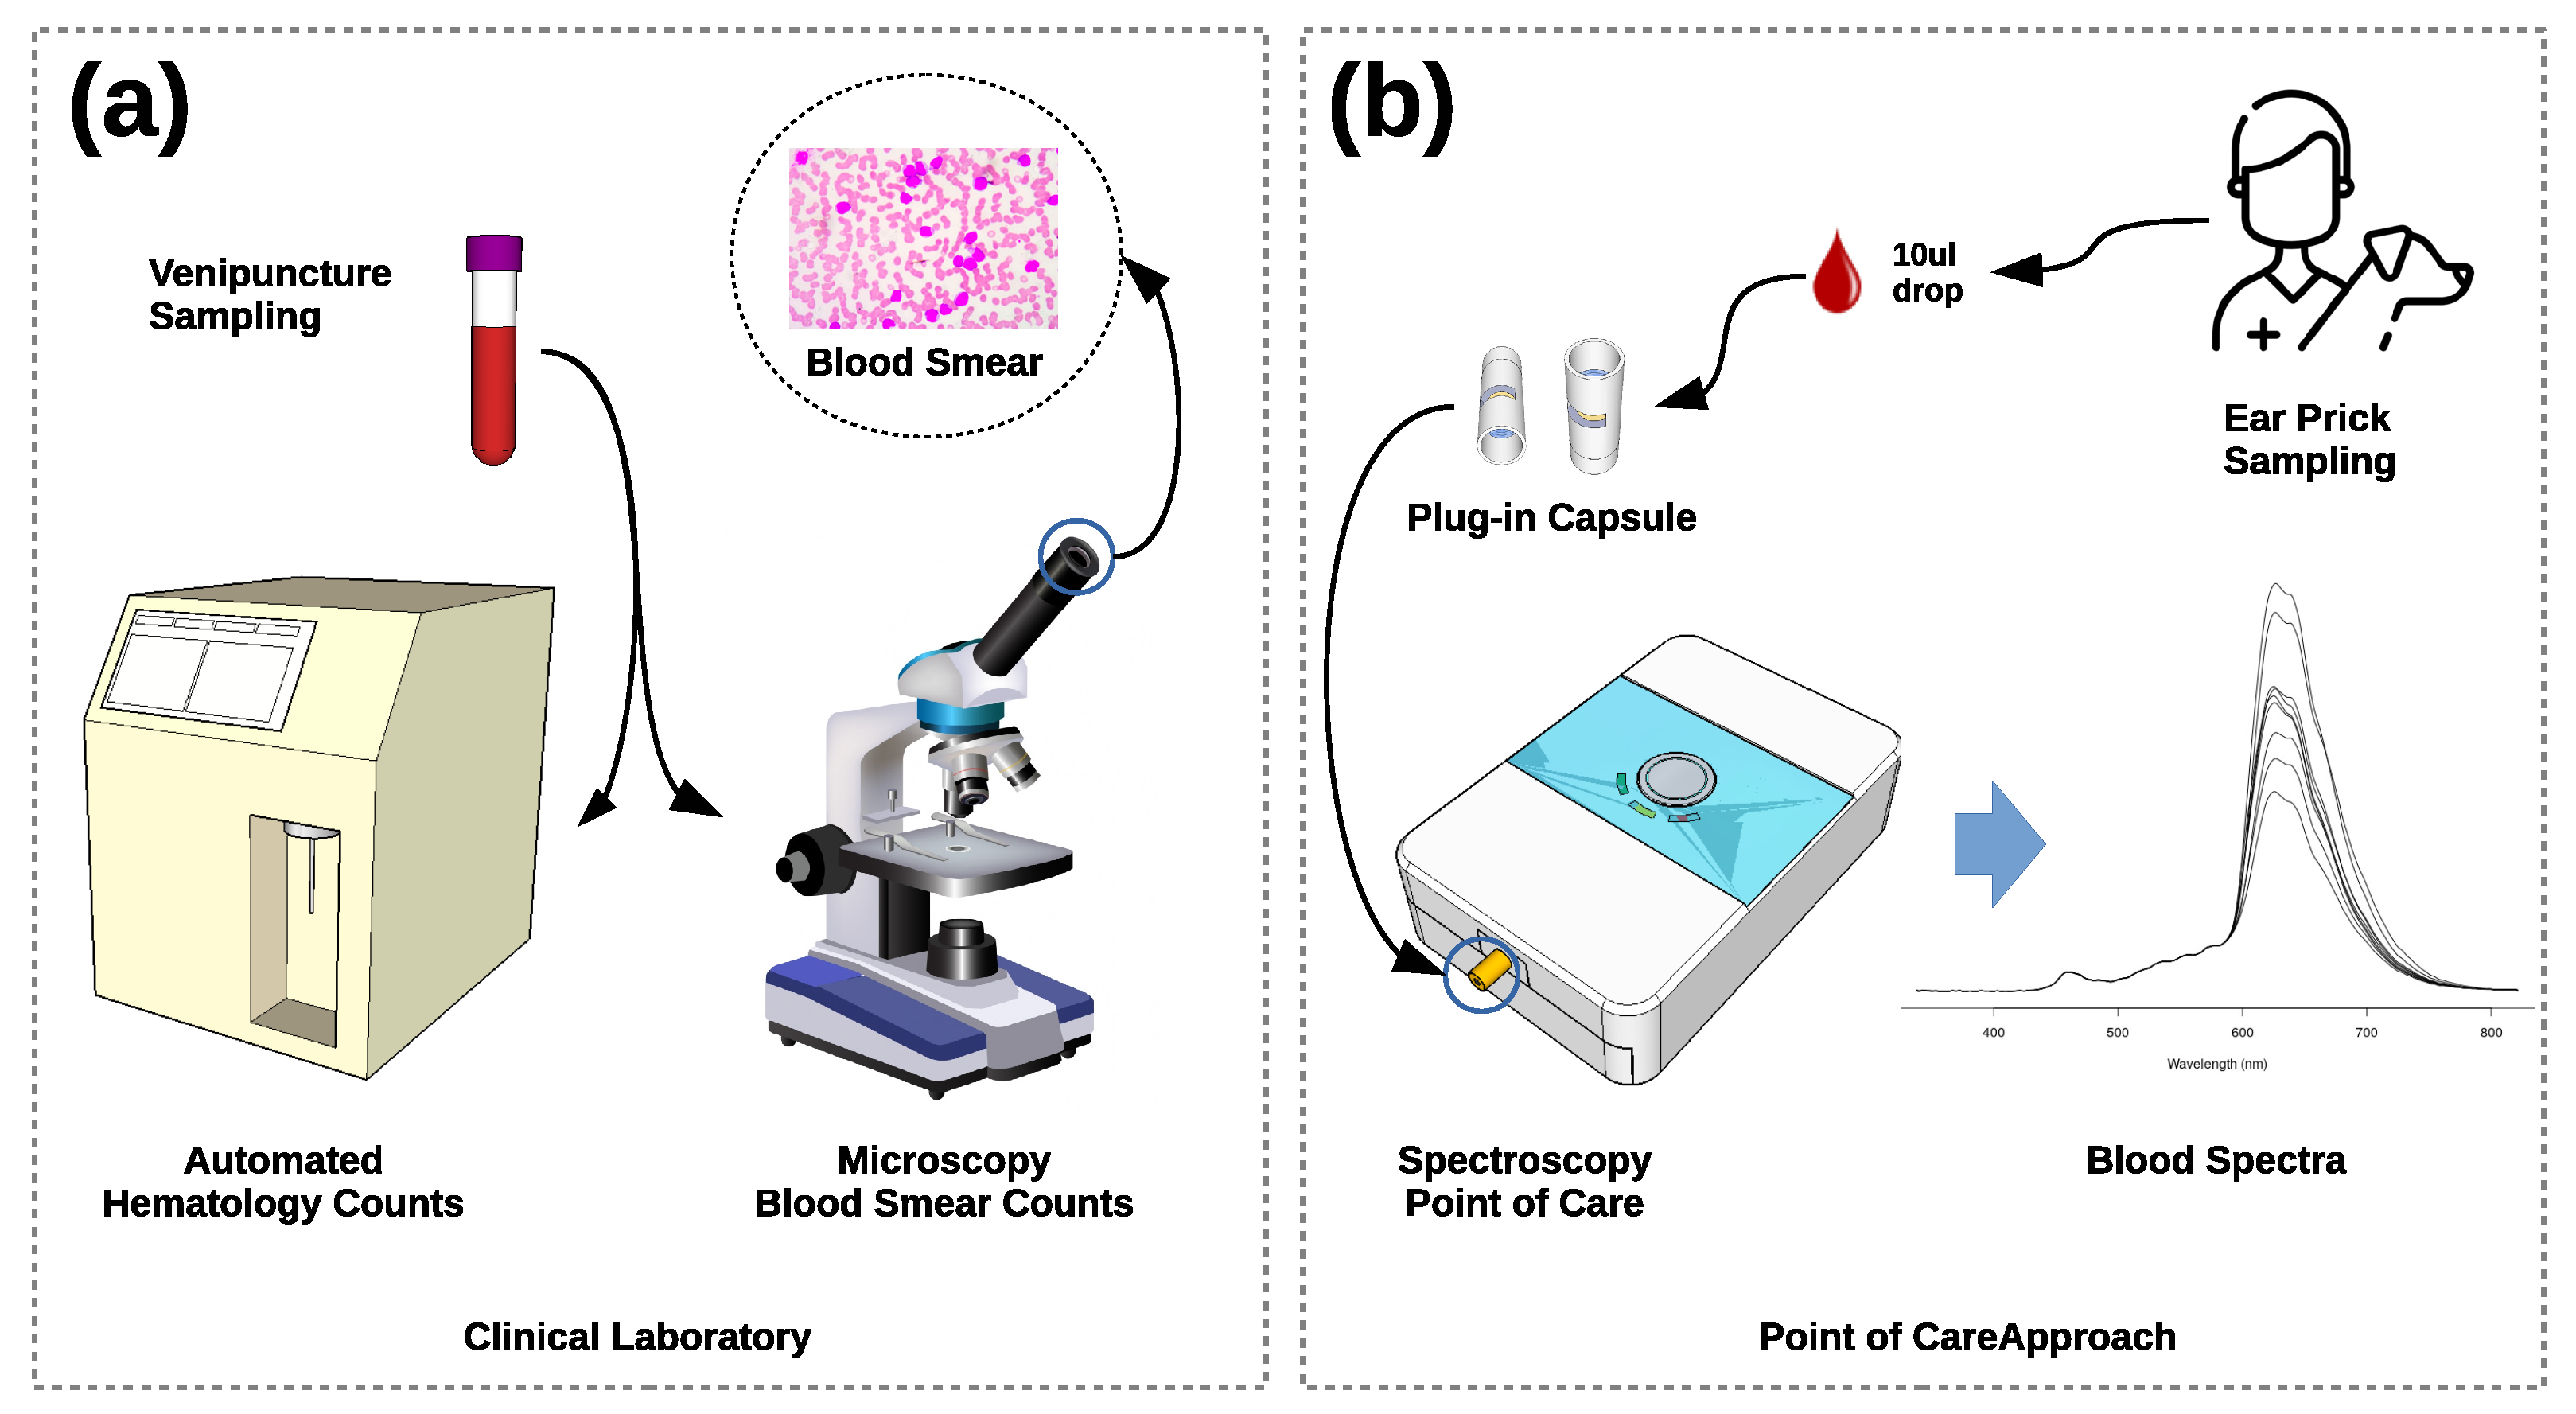
Figure 1. Total white blood cell counts: (a) current laboratory methods—automated cell counting using electric impedance or laser scattering, and manual smear count at the microscope by trained hematologist; and (b) Point-of-care approach—single blood drop spectroscopy counts using artificial intelligence.
Chemproc 05 00077 g001
Figure 2. Total white blood cell counts spectral quantification: (a) PLS and (b) SL-AI.
Chemproc 05 00077 g002
Figure 3. Percentage total error for PLS and SL-AI predictions: (1) ASVCP acceptable error limit (20%) and (2) CLIA acceptable error limit (15%).
Chemproc 05 00077 g003
Table 1. WBC quantification benchmarks for PLS and SL-AI.
MethodSELVR 2 MAPE (%)R Pearson
PLS11.0650.323444.620.5687
SL-AI2.1630.947320.000.9733
Publisher’s Note: MDPI stays neutral with regard to jurisdictional claims in published maps and institutional affiliations.