Abstract
This study outlines the use of an electronic nose as a method for the detection of VOCs as biomarkers of bladder cancer. Here, an AlphaMOS FOX 4000 electronic nose was used for the analysis of urine samples from 15 bladder cancer and 41 non-cancerous patients. The FOX 4000 consists of 18 MOS sensors that were used to differentiate the two groups. The results obtained were analysed using s MultiSens Analyzer and RStudio. The results showed a high separation with sensitivity and specificity of 0.93 and 0.88, respectively, using a Sparse Logistic Regression and 0.93 and 0.76 using a Random Forest classifier. We conclude that the electronic nose shows potential for discriminating bladder cancer from non-cancer subjects using urine samples.
1. Introduction
Bladder cancer (BC) is the eighth most common cancer worldwide. In the UK, there were 12,434 new cases and 6458 fatalities in 2020 [1]. Fortunately, the survival rate for bladder cancer remains good, with almost every three out of four people surviving the disease for one or more years [2]. Even with this high survival rate, there has been no significant improvement over the past ten years. The most common BC screening methods are cystoscopy, urine cytology, and urine tests, including bladder tumour antigen (BTA) test, nuclear matrix protein 22 (NMP22), urinary bladder cancer antigen (UBC), and fibrin degradation products (FDP) [3,4]. Unfortunately, none of these are effective enough for early diagnosis of BC and they are both expensive and invasive [5,6]. Therefore, there is a need for a more disease-specific, non-invasive, highly sensitive and low-cost screening test for BC.
The use of Volatile Organic Compounds (VOCs) has provided a new perspective for the early detection of cancer. The alterations in VOCs emitted from the body reflect the changes inside the body caused by this disease. VOCs can be measured from a range of different biological sources including urine [7], saliva [8], breath [9], faeces [10] and blood [11]. Measuring VOCs can be simple and non-invasive, mapping well onto the needs of a screening test [12]. Different studies that have previously been performed to analyse VOCs to diagnose BC, have mainly focused on urine and faeces [13,14]. The most common approach is to use GC-MS (Gas Chromatography-Mass Spectrometry). However, the analysis time is long (tens of minutes) and it is expensive, both in terms of equipment and running costs [15]. An alternative is to use an electronic nose (eNose), an instrument designed to mimic the human olfactory system. The eNose is widely used in the food and beverage industry [16], environment control, pharmaceutical companies [17] and biomedical applications [18]. Several previous studies have been undertaken for the detection of bladder cancer using the eNose. Van De Goor et al. used breath to distinguish head and neck, colon and bladder cancer using an electronic nose [19]. Another study conducted by Bernabei et al. was able to identify 100% of patients with urinary tract cancer (bladder and prostate cancer combined) from healthy controls [20]. A further study showed that bladder cancer was identified with the use of fluorescence urinary VOCs detection with a sensitivity of 84.2% and a specificity of 87.8% [21].
In our study, we aimed to identify and test the potential of urinary biomarkers to distinguish between BC and non-cancerous groups using an electronic nose. This is the first study conducted using an AlphaMOS FOX 4000 eNose to identify bladder cancer from non-cancerous samples using urinary VOCs.
2. Materials and Methods
2.1. Study Design
A total of 56 patients were recruited at University Hospital Coventry and Warwickshire NHS Trust, UK. This study was approved by Coventry and Warwickshire and North-East Yorkshire NHS Ethics Committees (Ref. 18717 and Ref. 260179). Out of 56 patients, 15 were confirmed with BC, and 41 non-cancerous (symptoms suggestive of but excluded after further investigations). The demographics for these groups are shown in Table 1.

Table 1.
Demographic for the study.
The samples were collected and stored in standard sterile specimen containers and frozen for 2 h at −80 °C. The samples were then shipped to the University of Warwick for testing, where the samples were defrosted in a laboratory fridge at 4 °C and 3 mL of sample aliquoted into 10 mL glass vials [22].
2.2. AlphaMOS FOX 4000 (Toulouse, France)
The AlphaMOS Fox 4000 is an eNose that comprises 18 commercial metal oxide sensors (MOS) distributed in three temperature-controlled chambers. There are 6 p-type sensors and 12 n-type sensors. The output of the sensors is measured as resistance. The FOX 4000 is fitted with a CombiPAL HS-100 auto-sampler using a 2.5 mL gas syringe. In testing, the samples were placed in the autosampler, then were agitated, and heated to 40 °C for 10 min. The headspace was then injected into the eNose at a rate of 200 mL/min into a flow of 150 mL/min of zero air. Each sample was analysed for 180 s by all the 18 MOX sensors.
2.3. Statistical Analysis
The sensor’s responses were extracted using AlphaSoft (AlphaMOS v12.36) and then analysed using a MultiSens Analyzer (JLM Innovation GmbH, Tübingen, Germany) and RStudio (Version 1.4.1106). AlphaSoft is a software product developed to control AlphaMOS instruments. The output generated by the program was processed and exported in ASCII format. These files were further analysed using a MultiSens Analyzer (JLM Innovation GmbH, Germany) for multivariate analysis. Due to the high dimensionality of the data, the maximum change in resistance was extracted per sensor and used as the input features for a PCA (Principal Component Analysis) and an LDA (Linear Discriminant Analysis). The feature matrix was also exported and further processed using a custom analysis pipeline created in RStudio. Here, 10-fold cross-validation was performed where the data was divided into 10 equally sized groups, with nine groups being used for model training and then applied to the 10th group as a test set. This was repeated 10 times until all the samples had been in a test group. SMOTE (Synthetic Minority Over-Sampling Technique) was performed on the data groups due to the high imbalance in the sample size for BC and the non-cancerous group. It generated syntenic balanced, which were then used to train the classifier [23]. This was undertaken inside the training fold so as not to affect the test result. Two classification models were applied to the data, specifically Random Forest (RF) and Sparse Logistic Regression (SLR), which we have successfully used before in similar studies [24]. From the resultant probabilities, statistical parameters were calculated, including Receiver Operator Characteristic (ROC) curve, area under the curve (AUC), sensitivity, specificity, positive predictive value (PPV), and negative predictive value (NPV).
3. Results
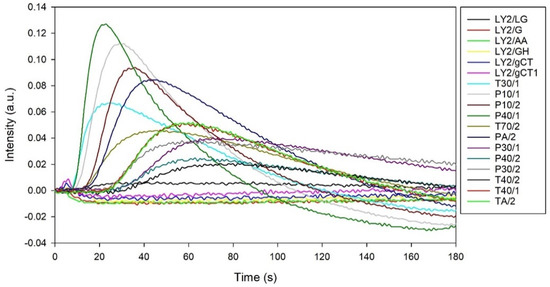
The typical output from the FOX 4000 eNose is shown in Figure 1, where each curve represents the response of a sensor to a BC urine sample. Here, the sensor response is defined as intensity, which is the change in resistance from the baseline divided by the baseline resistance.

Figure 1.
A typical output from AlphaMOS FOX 4000 to a BC urine sample.
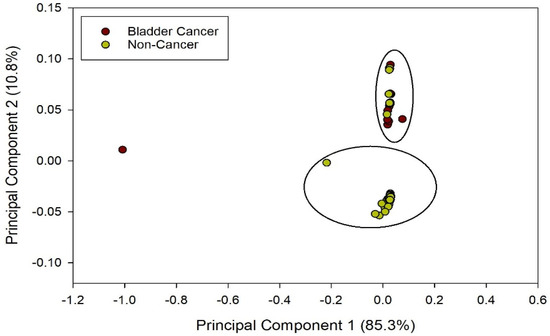
The PCA results obtained from the MultiSens Analyzer are shown in Figure 2. The data shows that most of the sample variance can be plotted in the first principal component (85.3%). Furthermore, there is reasonable separation (though not perfect) between the BC and non-cancerous groups.

Figure 2.
PCA output from BC and non-cancerous groups.
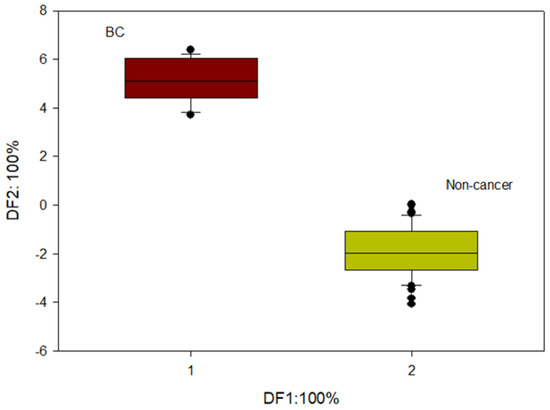
LDA was also performed on the data, as shown in Figure 3, to show the maximum potential separation between BC and Non-cancer samples.

Figure 3.
LDA output from BC and non-cancerous groups.
Finally, output statistical parameters were calculated, the results of which are shown in Table 2.

Table 2.
Statistical output from FOX.
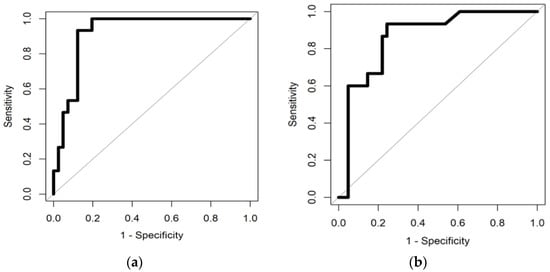
The highest separation between the BC and non-cancerous group was obtained using Sparse Logistic Regression with an AUC (Area Under the Curve) of 0.92. The sensitivity and specificity obtained were 0.93 and 0.88, respectively. The high sensitivity and specificity signify that the SLR correctly predicted 36 out of 41 non-cancerous patients and was able to identify 14 BC patients out of 15.
The RF classifier was able to achieve a sensitivity of 0.93 with a specificity of 0.76. The AUC for this classifier was 0.86. With the RF classifier, the model was able to correctly identify 31 of the non-cancerous samples and 14 BC samples out of 15.
This shows that eNose can distinguish cancer samples from non-cancerous samples. The ROC curve for random forest classifier distinguishing BC and the non-cancerous group is shown in Figure 4.

Figure 4.
(a) illustrates ROC curve distinguishing BC from Non-cancerous group using Sparse Logistic Regression and (b) illustrates ROC curve distinguishing BC from Non-cancerous group using Random Forest classifier.
4. Discussion
In this paper, we have shown that the AlphaMOS FOX4000 Electronic nose was able to distinguish bladder cancer urine samples from non-cancerous samples based on their VOC profile. Our findings prove that eNose can be used to accurately separate these two groups. This is the first study to compare bladder cancer urine samples from non-cancerous samples using this eNose, which has the advantage of being fully automated allowing large numbers of samples to be tested easily.
In our study, we were able to separate the bladder cancer urine samples from the non-cancerous group with a high AUC of 0.92 and 0.86 using SLR and RF classifiers, respectively. For the classification of BC and non-cancerous groups using SLR, the sensitivity and the specificity obtained were 0.93 and 0.88, respectively. The threshold value for classification of the two groups was 0.13 and the p-value was <0.001. For the RF classifier, the sensitivity and specificity obtained were 0.93 and 0.76. The threshold value and p-value were 0.29 and <0.001, respectively.
We found that eNose was able to identify 14 BC samples out of 15, and 36 out of 41 non-cancerous samples using Sparse Logistic Regression classifier. However, our study is limited by the small number of samples, and we did not attempt to identify the specific VOC biomarkers involved. A previous study with a commercial eNose (Sensigent Cyranose 320) also showed high sensitivity and specificity [14], with comparable results to those found here. The sensitivity of eNose highly depends upon the material of the sensors and the environmental conditions, such as humidity and temperature [25]. A further limitation of our study was the lack of healthy controls for comparison. Further investigation is required to understand the specific chemicals associated with separating BC from non-cancer and to test samples from a larger patient group.
Author Contributions
Conceptualization, H.T., J.A.C. and R.P.A.; methodology, H.T. and E.D.; formal analysis, H.T.; investigation, H.T. and E.D.; resources, A.S.B., J.A.C. and R.P.A.; data curation, H.T.; writing—original draft preparation, H.T.; writing—review and editing, H.T., E.D. and J.A.C. visualization, H.T. and J.A.C.; supervision, J.A.C. and R.P.A. All authors have read and agreed to the published version of the manuscript.
Funding
This research received no external funding.
Institutional Review Board Statement
This study was approved by Coventry and Warwickshire and North-East Yorkshire NHS Ethics Committees (Ref. 18717 and Ref. 260179).
Informed Consent Statement
Informed consents were obtained from all subjects involved in the study.
Conflicts of Interest
The authors declare no conflict of interest.
References
- GLOBOCAN. 2020 Estimated Number of Incident Cases, Bladder Cancer, All Ages. Available online: https://gco.iarc.fr (accessed on 9 June 2021).
- Cancer Research UK Bladder Cancer Statistics. Available online: https://www.cancerresearchuk.org/health-professional/cancer-statistics/statistics-by-cancer-type/bladder-cancer#heading-Two (accessed on 9 June 2021).
- DeGeorge, K.C.; Holt, H.R.; Hodges, S.C. Bladder Cancer: Diagnosis and Treatment. Am. Fam. Physician 2017, 96, 507–514. [Google Scholar]
- Lotan, Y.; Svatek, R.S.; Malats, N. Screening for bladder cancer: A perspective. World J. Urol. 2008, 26, 13–18. [Google Scholar] [CrossRef]
- Lotan, Y.; Roehrborn, C.G. Sensitivity and specificity of commonly available bladder tumor markers versus cytology: Results of a comprehensive literature review and meta-analyses. Urology 2003, 61, 109–118. [Google Scholar] [CrossRef]
- Tilki, D.; Burger, M.; Dalbagni, G.; Grossman, H.B.; Hakenberg, O.W.; Palou, J.; Reich, O.; Rouprêt, M.; Shariat, S.F.; Zlotta, A.R. Urine Markers for Detection and Surveillance of Non–Muscle-Invasive Bladder Cancer. Eur. Urol. 2011, 60, 484–492. [Google Scholar] [CrossRef] [PubMed]
- Silva, C.L.; Passos, M.; Câmara, J.S. Investigation of urinary volatile organic metabolites as potential cancer biomarkers by solid-phase microextraction in combination with gas chromatography-mass spectrometry. Br. J. Cancer 2011, 105, 1894–1904. [Google Scholar] [CrossRef] [Green Version]
- Shigeyama, H.; Wang, T.; Ichinose, M.; Ansai, T.; Lee, S.-W. Identification of volatile metabolites in human saliva from patients with oral squamous cell carcinoma via zeolite-based thin-film microextraction coupled with GC–MS. J. Chromatogr. B 2019, 1104, 49–58. [Google Scholar] [CrossRef]
- Boots, A.W.; van Berkel, J.J.B.N.; Dallinga, J.W.; Smolinska, A.; Wouters, E.F.; van Schooten, F.J. The versatile use of exhaled volatile organic compounds in human health and disease. J. Breath Res. 2012, 6, 27108. [Google Scholar] [CrossRef] [PubMed]
- Garner, C.E.; Smith, S.; de Lacy Costello, B.; White, P.; Spencer, R.; Probert, C.S.J.; Ratcliffem, N.M. Volatile organic compounds from feces and their potential for diagnosis of gastrointestinal disease. FASEB J. 2007, 21, 1675–1688. [Google Scholar] [CrossRef] [Green Version]
- Jia, C.; Yu, X.; Masiak, W. Blood/air distribution of volatile organic compounds (VOCs) in a nationally representative sample. Sci. Total Environ. 2012, 419, 225–232. [Google Scholar] [CrossRef]
- Shirasu, M.; Touhara, K. The scent of disease: Volatile organic compounds of the human body related to disease and disorder. J. Biochem. 2011, 150, 257–266. [Google Scholar] [CrossRef] [PubMed] [Green Version]
- Weber, C.M.; Cauchi, M.; Patel, M.; Bessant, C.; Turner, C.; Britton, L.E.; Willis, C.M. Evaluation of a gas sensor array and pattern recognition for the identification of bladder cancer from urine headspace. Analyst 2011, 136, 359–364. [Google Scholar] [CrossRef] [Green Version]
- Heers, H.; Gut, J.M.; Hegele, A.; Hofmann, R.; Boeselt, T.; Hattesohl, A.; Koczulla, A.R. Non-invasive Detection of Bladder Tumors Through Volatile Organic Compounds: A Pilot Study with an Electronic Nose. Anticancer Res. 2018, 38, 833–837. [Google Scholar]
- Zhu, S.; Corsetti, S.; Wang, Q.; Li, C.; Huang, Z.; Nabi, G. Optical sensory arrays for the detection of urinary bladder cancer-related volatile organic compounds. J. Biophotonics 2019, 12, e201800165. [Google Scholar] [CrossRef] [PubMed] [Green Version]
- Ghasemi-Varnamkhasti, M.; Mohtasebi, S.S.; Rodriguez-Mendez, M.L.; Lozano, J.; Razavi, S.H.; Ahmadi, H. Potential application of electronic nose technology in brewery. Trends Food Sci. Technol. 2011, 22, 165–174. [Google Scholar] [CrossRef]
- Wasilewski, T.; Migoń, D.; Gębicki, J.; Kamysz, W. Critical review of electronic nose and tongue instruments prospects in pharmaceutical analysis. Anal. Chim. Acta 2019, 1077, 14–29. [Google Scholar] [CrossRef]
- Dragonieri, S.; Schot, R.; Mertens, B.J.A.; Le Cessie, S.; Gauw, S.A.; Spanevello, A.; Resta, O.; Willard, N.P.; Vink, T.J.; Rabe, K.F.; et al. An electronic nose in the discrimination of patients with asthma and controls. J. Allergy Clin. Immunol. 2007, 120, 856–862. [Google Scholar] [CrossRef] [Green Version]
- Van De Goor, R.; Leunis, N.; Van Hooren, M.R.A.; Francisca, E.; Masclee, A.; Kremer, B.; Kross, K.W. Feasibility of electronic nose technology for discriminating between head and neck, bladder, and colon carcinomas. Eur. Arch. Oto-Rhino-Laryngol. 2017, 274, 1053–1060. [Google Scholar] [CrossRef] [Green Version]
- Bernabei, M.; Pennazza, G.; Santonico, M.; Corsi, C.; Roscioni, C.; Paolesse, R.; Di Natale, C.; D’Amico, A. A preliminary study on the possibility to diagnose urinary tract cancers by an electronic nose. Sens. Actuators B Chem. 2008, 131, 1–4. [Google Scholar] [CrossRef]
- Zhu, S.; Huang, Z.; Nabi, G. Fluorometric optical sensor arrays for the detection of urinary bladder cancer specific volatile organic compounds in the urine of patients with frank hematuria: A prospective case-control study. Biomed. Opt. Express 2020, 11, 1175–1185. [Google Scholar] [CrossRef] [PubMed]
- Esfahani, S.; Wicaksono, A.; Mozdiak, E.; Arasaradnam, R.P.; Covington, J.A. Non-Invasive Diagnosis of Diabetes by Volatile Organic Compounds in Urine Using FAIMS and Fox4000 Electronic Nose. Biosensors 2018, 8, 121. [Google Scholar] [CrossRef] [Green Version]
- Fancy, S.-A.; Rumpel, K. GC-MS-Based Metabolomics BT-Biomarker Methods in Drug Discovery and Development; Wang, F., Ed.; Humana Press: Totowa, NJ, USA, 2008; pp. 317–340. ISBN 978-1-59745-463-6. [Google Scholar]
- Daulton, E.; Wicaksono, A.; Bechar, J.; Covington, J.A.; Hardwicke, J. The Detection of Wound Infection by Ion Mobility Chemical Analysis. Biosensors 2020, 10, 19. [Google Scholar] [CrossRef] [PubMed] [Green Version]
- Wilson, A.D.; Baietto, M. Applications and Advances in Electronic-Nose Technologies. Sensors 2009, 9, 5099–5148. [Google Scholar] [CrossRef] [PubMed]
Publisher’s Note: MDPI stays neutral with regard to jurisdictional claims in published maps and institutional affiliations. |
© 2021 by the authors. Licensee MDPI, Basel, Switzerland. This article is an open access article distributed under the terms and conditions of the Creative Commons Attribution (CC BY) license (https://creativecommons.org/licenses/by/4.0/).