Article

Influence of Surface Treatments on the Electrochemical Performance of Lab-Made 3D-Printed Electrodes

by
Thiago Gabry Barbosa
,
Daniela Nunes da Silva
,
Marcella Matos Cordeiro Borges
,
Scarlat Ohanna Dávila da Trindade
,
Thaís Cristina de Oliveira Cândido
* and
Arnaldo César Pereira
*
Natural Sciences Department, Federal University of São João del Rei, 74 Praça Dom Helvécio, São João del Rei 36301-160, MG, Brazil
*
Authors to whom correspondence should be addressed.
Analytica 2025, 6(1), 9; https://doi.org/10.3390/analytica6010009
Submission received: 31 December 2024 / Revised: 21 February 2025 / Accepted: 28 February 2025 / Published: 4 March 2025

Abstract

:
This study investigated the effect of surface treatments on the electrochemical performance of 3D-printed electrodes for versatile applications. The conductive filament was obtained from a mixture of polylactic acid (PLA) and carbon black (CB) at a 7:3 ratio (PLA/CB) dispersed in acetic acid and dichloroethane (3:1) medium. The treatments used were HNO3, NaOH, DMF (immersion for 30, 30, and 15 min, respectively), and electrochemical activation (amperometry 150 s, 1.8 V). In general, the treatments allow greater exposure of the conductive material and active sites present on the sensor surface. This was confirmed using cyclic voltammetry and electrochemical impedance spectroscopy. The analyses were conducted with a 0.10 M KCl solution containing the redox pair ferricyanide/ferrocyanide 5.00 mmol L−1. Based on the results obtained, the electroactive area, kinetic constant and resistance to electron transfer were determined for each treatment. The treatment in basic medium stood out as the treatment that was most appropriate for the device used in this work. The device was also tested for its potential in the analysis of acetaminophen, demonstrating satisfactory results permitting the application of 3D-SBasic in the analysis of acetaminophen.

Graphical Abstract

1. Introduction

Three-dimensional printing, also known as additive manufacturing, produces three-dimensional objects through the successive deposition of layers of material, making it possible to create innovative products [1,2,3]. This technology has been widely applied in various industrial sectors, such as the automotive, construction, aerospace, and medical industries [4,5,6,7,8,9,10,11].
Advances in 3D printing have enabled its wide application in electrochemistry, making it possible to manufacture customized and low-cost devices. This technology has been particularly used in the development of sensors and biosensors for various applications [12].
In the literature, authors such as Cardoso et al. [13], Cândido et al. [14] and Abdalla and Patel [15] present reviews on sensors and biosensors manufactured by 3D printing. These studies highlight the contributions of technology in the production of electrochemical sensors, enabling the creation of devices with varied shapes, sizes, and geometries.
Three-dimensional printing, which is widely used in prototyping and manufacturing, employs thermoplastic polymers as a raw material. Among them, polylactic acid (PLA) stands out for its accessibility and satisfactory mechanical properties [16]. However, the insulating nature of PLA limits its applications in the manufacture of electronic devices, especially sensors, which require specific electrochemical characteristics, such as electrical conductivity [17]. To overcome this limitation, research has explored the development of PLA-based conductive filaments, through doping processes that modify their electrical properties. This promising approach aims to expand the functionalities of 3D printing by allowing the creation of electronic components integrated directly into the printed structure.
Doping, a fundamental process to confer conductivity to PLA, consists of adding conductive materials to its polymeric matrix, such as metals and carbonaceous materials. Among these, carbonaceous materials are the most used in the production of conductive filaments due to their lower cost and greater availability in relation to metals. Additionally, carbon-based materials are widely used in the development of sensors due to their relevant properties, such as high surface area, good electrical conductivity, high chemical and physical stability, and the ability to accelerate electron transfer [18,19,20,21,22,23].
The investigation of new production routes for conductive filaments has given rise to lab-made filaments, in which the polymer and conductive material act as precursors [24,25]. The method of incorporating the precursor with the aid of solvents stands out due to its feasibility and efficacy in the dispersion of the components [26,27]. In this process, a solvent or a mixture of solvents is used to disperse the polymer and the conductive material, promoting a more homogeneous interaction between them. Generally, the reaction is conducted under reflux (i.e., under agitation and controlled heating), which contributes significantly to a better dispersion of the components, resulting in a reduction in the synthesis time and, consequently, in a more efficient process [24].
Despite the feasibility of the solvent embedding method, the significant proportion of polymeric material to conductive material often results in an unsatisfactory sensor response, limiting its electrochemical performance. To optimize the performance of these sensors, several electrode treatment strategies have been explored [28,29,30,31,32,33,34,35,36,37,38], seeking to increase the surface area, improve electrical conductivity, and introduce active sites that facilitate electrochemical reactions.
In this sense, excess PLA can be physically removed by mechanical polishing and thermal procedures. This type of treatment modifies the surface structure of the electrode, increasing the surface area and number of electrical contacts, thus improving conductivity and stability. Chemical treatments such as the use of acids, bases and solvents modify the surface composition, enabling the insertion of functional groups, resulting in improved interaction with analytes and sensor sensitivity. In addition, electrochemical activation can be combined to modify the surface through the application of potentials or currents, providing the sensor with more electrochemical properties due to the insertion of new active sites. [28,29]
In this work, conductive filaments made in a laboratory composed of PLA, CB (carbon black), and a mixture of acetic acid and dichloroethane solvents (3:1) were obtained. Different activation methodologies (mechanical, solvent, acid, and base polishing) were performed on the 3D-printed electrodes based on the PLA-CB filament. This study was carried out to evaluate the influence of each method on the electrochemical performance of the sensor. In addition, the potential of this device in the analysis of acetaminophen was evaluated.

2. Materials and Methods

2.1. Reagents and Chemicals

Acetic acid, dimethylformamide, potassium ferrocyanide, potassium ferricyanide, and sodium hydroxide were purchased from Sigma-Aldrich (St. Louis, MO, USA); nitric acid was purchased from Dinâmica® Química (São Paulo, Brazil); 1,2-dichloroethane, potassium chloride, sodium monohydrate phosphate, and sodium dihydrate phosphate were purchased from Synth (São Paulo, Brazil); carbon black (VXC72R) was purchased from CABOT© (Mauá, Brazil); polylactic acid pellets were purchased from 3D Lab Industry Ltd. (Belo Horizonte, Brazil). All aqueous solutions were prepared with water purified in a Milli-Q system, and all chemicals were of analytical grade and used as received.

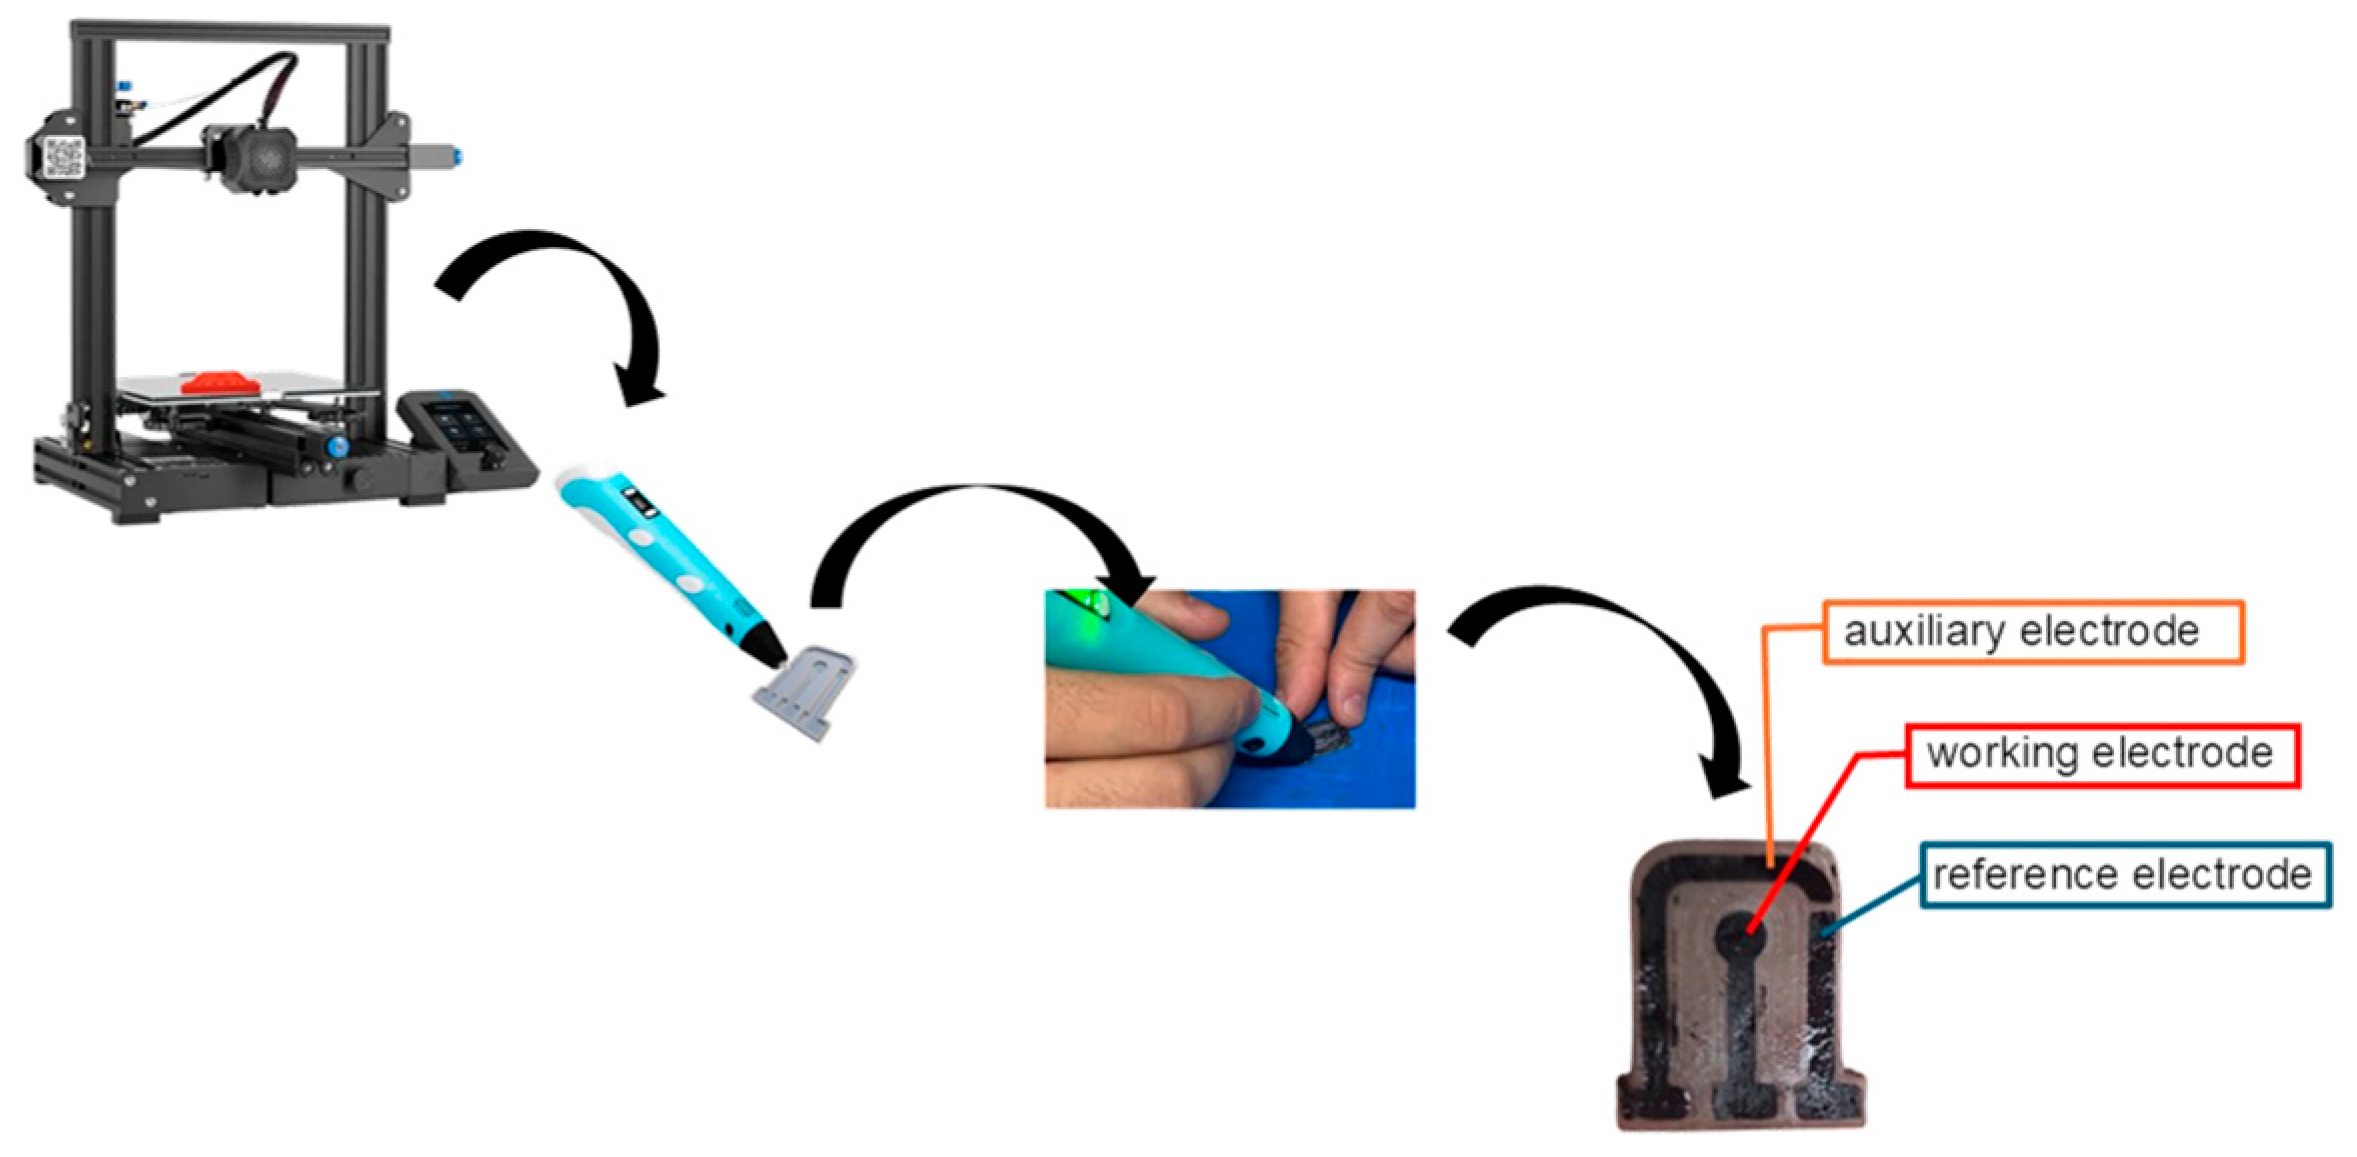
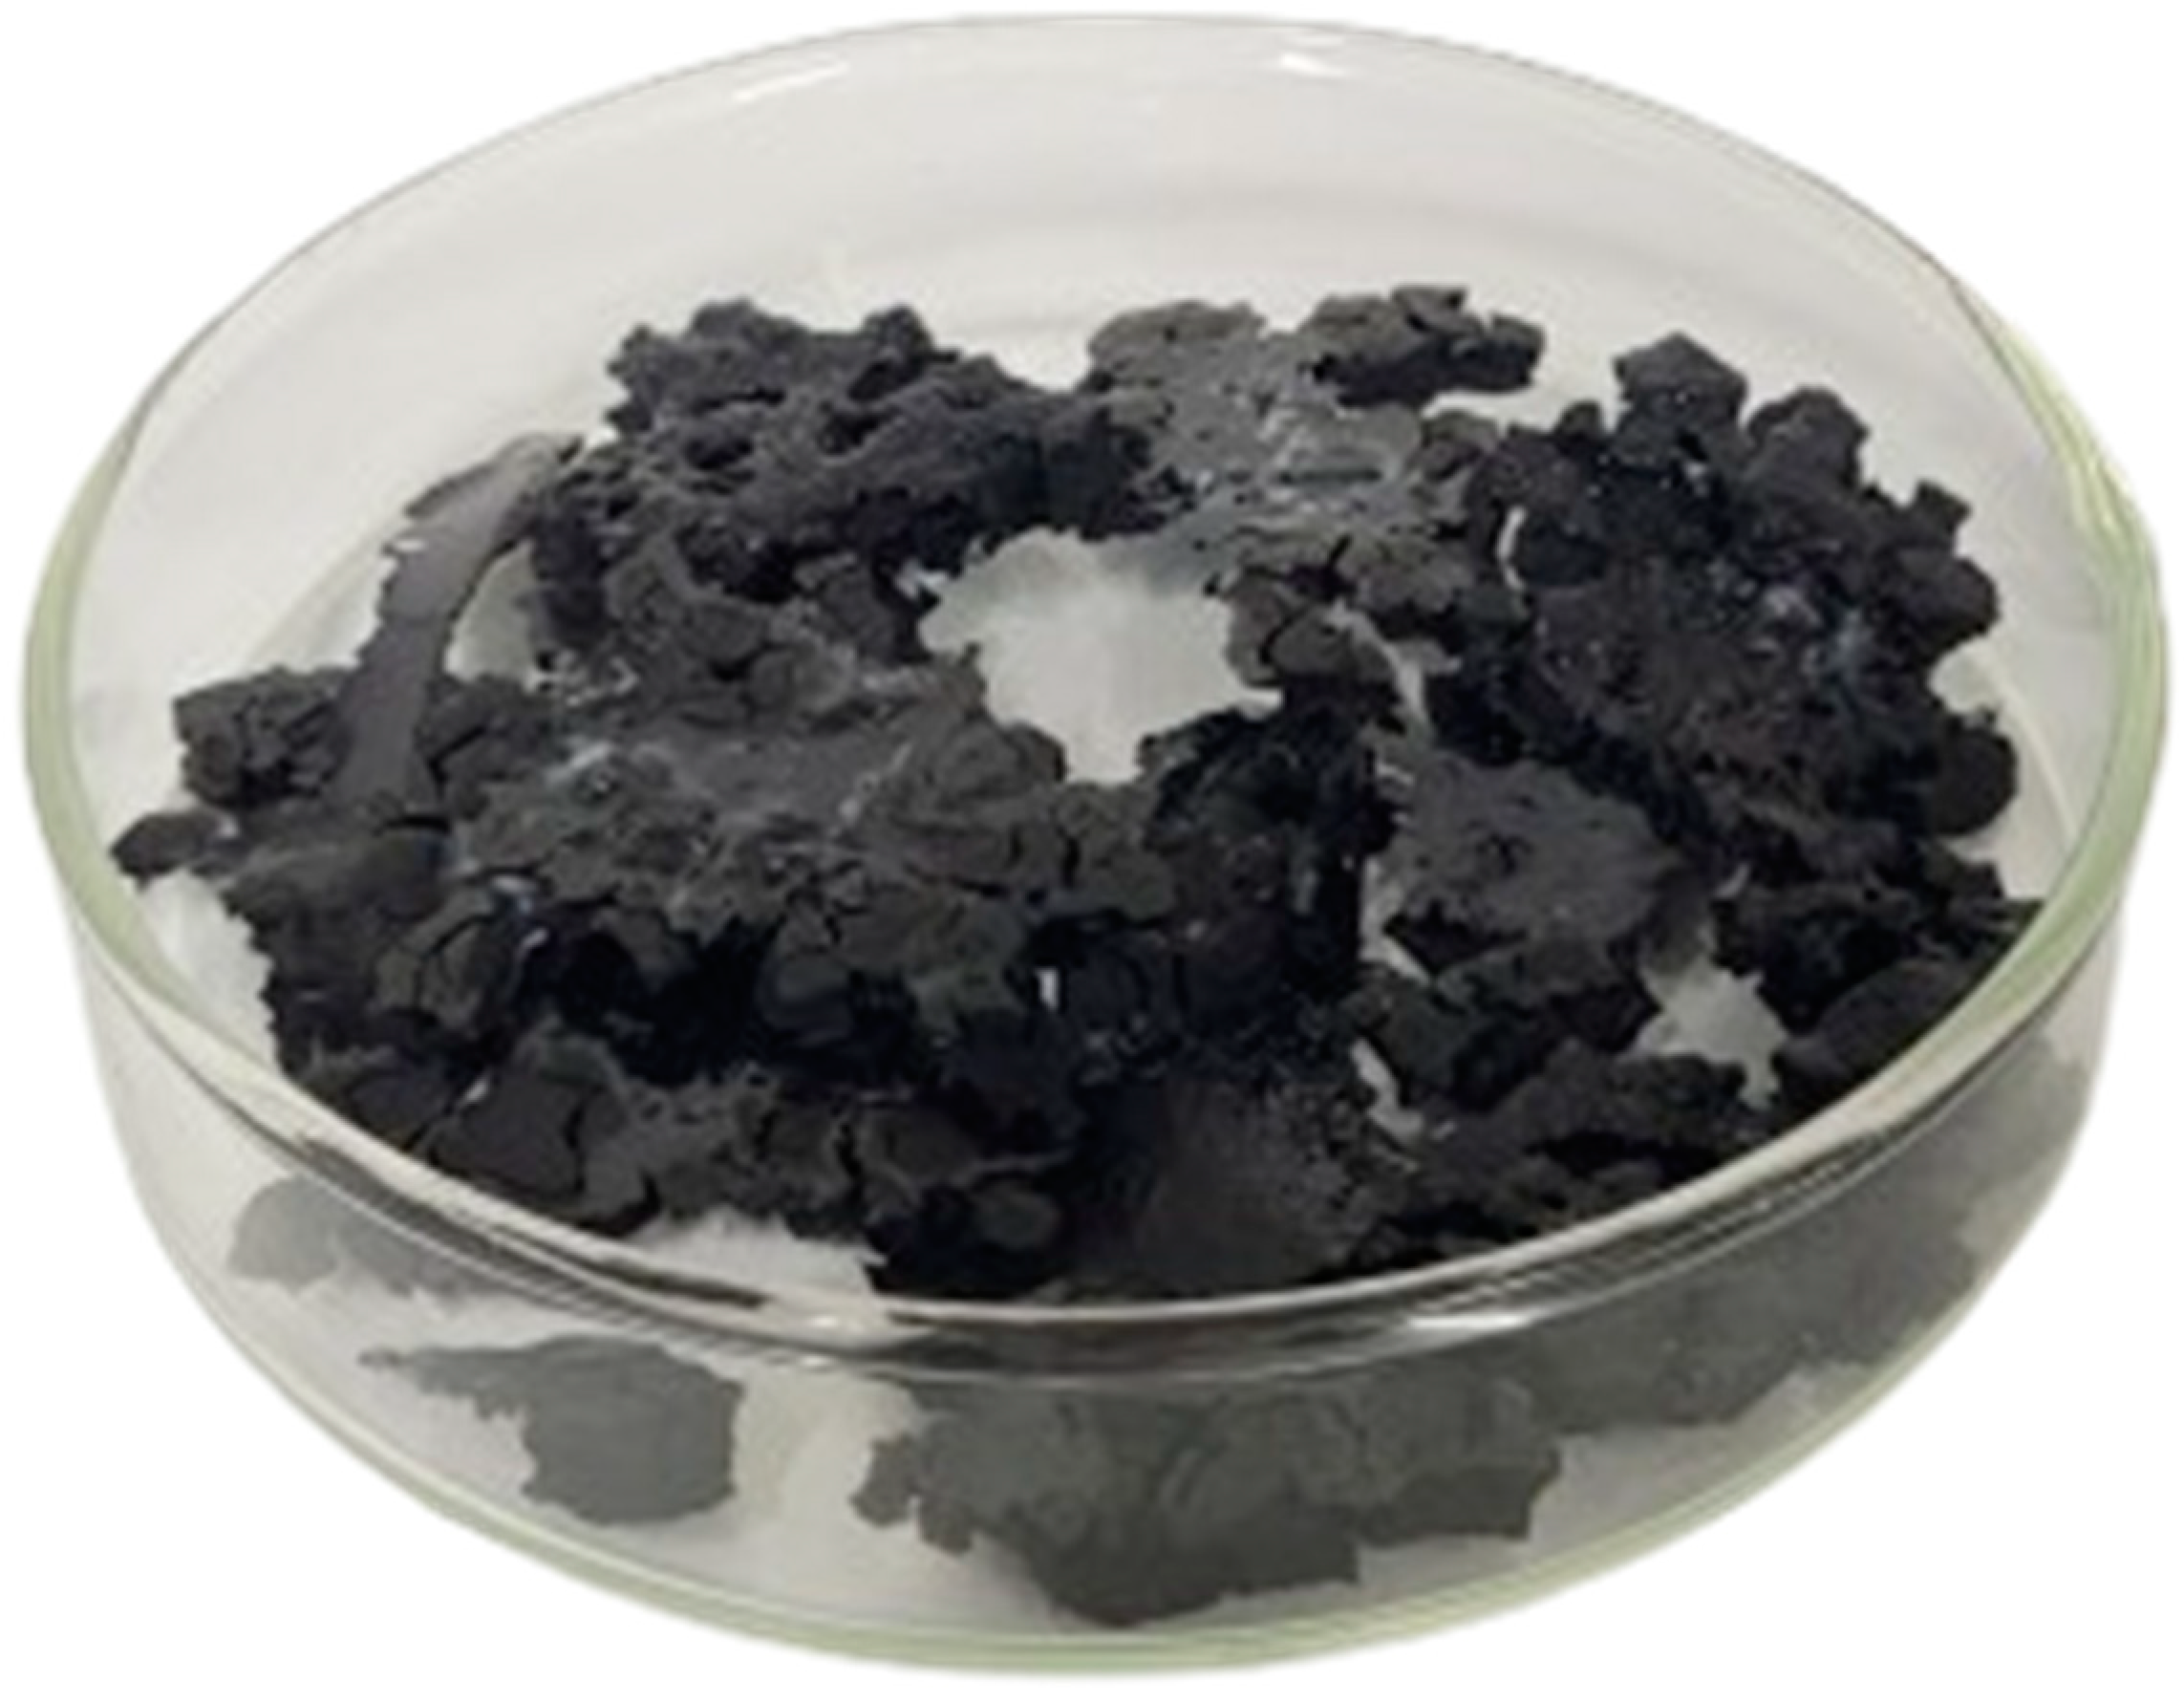
2.2. Manufacture of Composite Filament and CB-PLA Electrodes

CB-PLA filaments were manufactured by adapting the method previously proposed by Stefano et al. [24]. Initially, 15 g of CB was dispersed in 200 mL of acetic acid and 1,2-dichloroethane solvents (3:1 v/v), which underwent magnetic stirring and heating to 70 °C for 30 min. The mixture was kept in a reflux system to prevent solvent escape and under constant stirring for greater homogeneity. Then, 35 g of PLA (ratio 3:7 m/m CB/PLA) was added to the mixture and kept under constant stirring and heating for 3 h. After that, the mixture was poured into a glass container and left to dry at 50 °C in an oven for 12 h. After drying, the composite was cut into small pieces (<1 cm) with the help of scissors, which had been previously cleaned. The pieces were then placed in the Filmaq3D® extruder at a temperature of 170 °C.
To ensure the reproducible fabrication of the electrodes, a deposition holder for the CB-PLA filament was designed using AutoCAD Fusion (version 2.0.21487) and 3D printed with transparent PLA on an Ender 3-V2 printer (table temperature: 60 °C; nozzle temperature: 200 °C; print speed: 50 mm s−1). The resulting bracket features areas for the counter, reference, and work electrodes.
The 3D-printed sensor (counter, reference, and working electrode) was manufactured by hand using CB-PLA filament extruded from a Top Tean Meg 3D printing pen (235 °C, low extrusion ratio). The low extrusion rate optimized material deposition, mitigating bubble formation and ensuring the complete filling of the support structure. After cooling, the sensors were mechanically polished with 320-grit wet sandpaper to obtain smooth and uniform surfaces, standardizing the geometric area and improving electrical conductivity. The printing process is illustrated in Figure 1.

2.3. CB-PLA Electrochemical Sensor Treatment

The electrodes were activated by electrochemical and chemical methods (acid, base, and solvent). Electrochemical activation was conducted in 0.10 mol L−1 phosphate buffer (pH 7.40), applying a potential of +1.8 V for 150 s. The sensor was named 3D-SE. Activation by chemical polishing involved the immersion of the electrodes in different solutions: nitric acid (HNO3) 7.90 mmol L−1 for 15 min (3D-SAcid), sodium hydroxide (NaOH) 1.00 mol L−1 for 30 min (3D-SBasic), and dimethylformamide (DMF) for 15 min (3D-SSolvent). After each chemical immersion, the electrodes were washed with ethanol and dried at room temperature for 12 h.

2.4. Electrochemical Characterization of Sensors

After each treatment, the sensors were analyzed by cyclic voltammetry (CV) and electrochemical impedance spectroscopy (EIS) using an AUTOLAB Potentiostat model PGSTAT204 equipped with an impedance module FRA32M coupled to a microcomputer with NOVA 2.1.7 software. The EIS data were analyzed by applying 10 mV amplitude sinusoidal potential modulation superimposed on the open circuit potential (OCP) of the system. The amplitude and phase angle of the resulting current were recorded at frequencies ranging from 100 kHz to 10 mHz. The kinetic study was performed by applying the VC technique at scan rates in the range of 10–600 mV s–1. The analyses were performed in triplicate in KCl 0.10 mol L−1 in the presence of an equimolar solution of potassium ferrocyanide/potassium ferricianide 5.00 mmol L−1.

3. Results

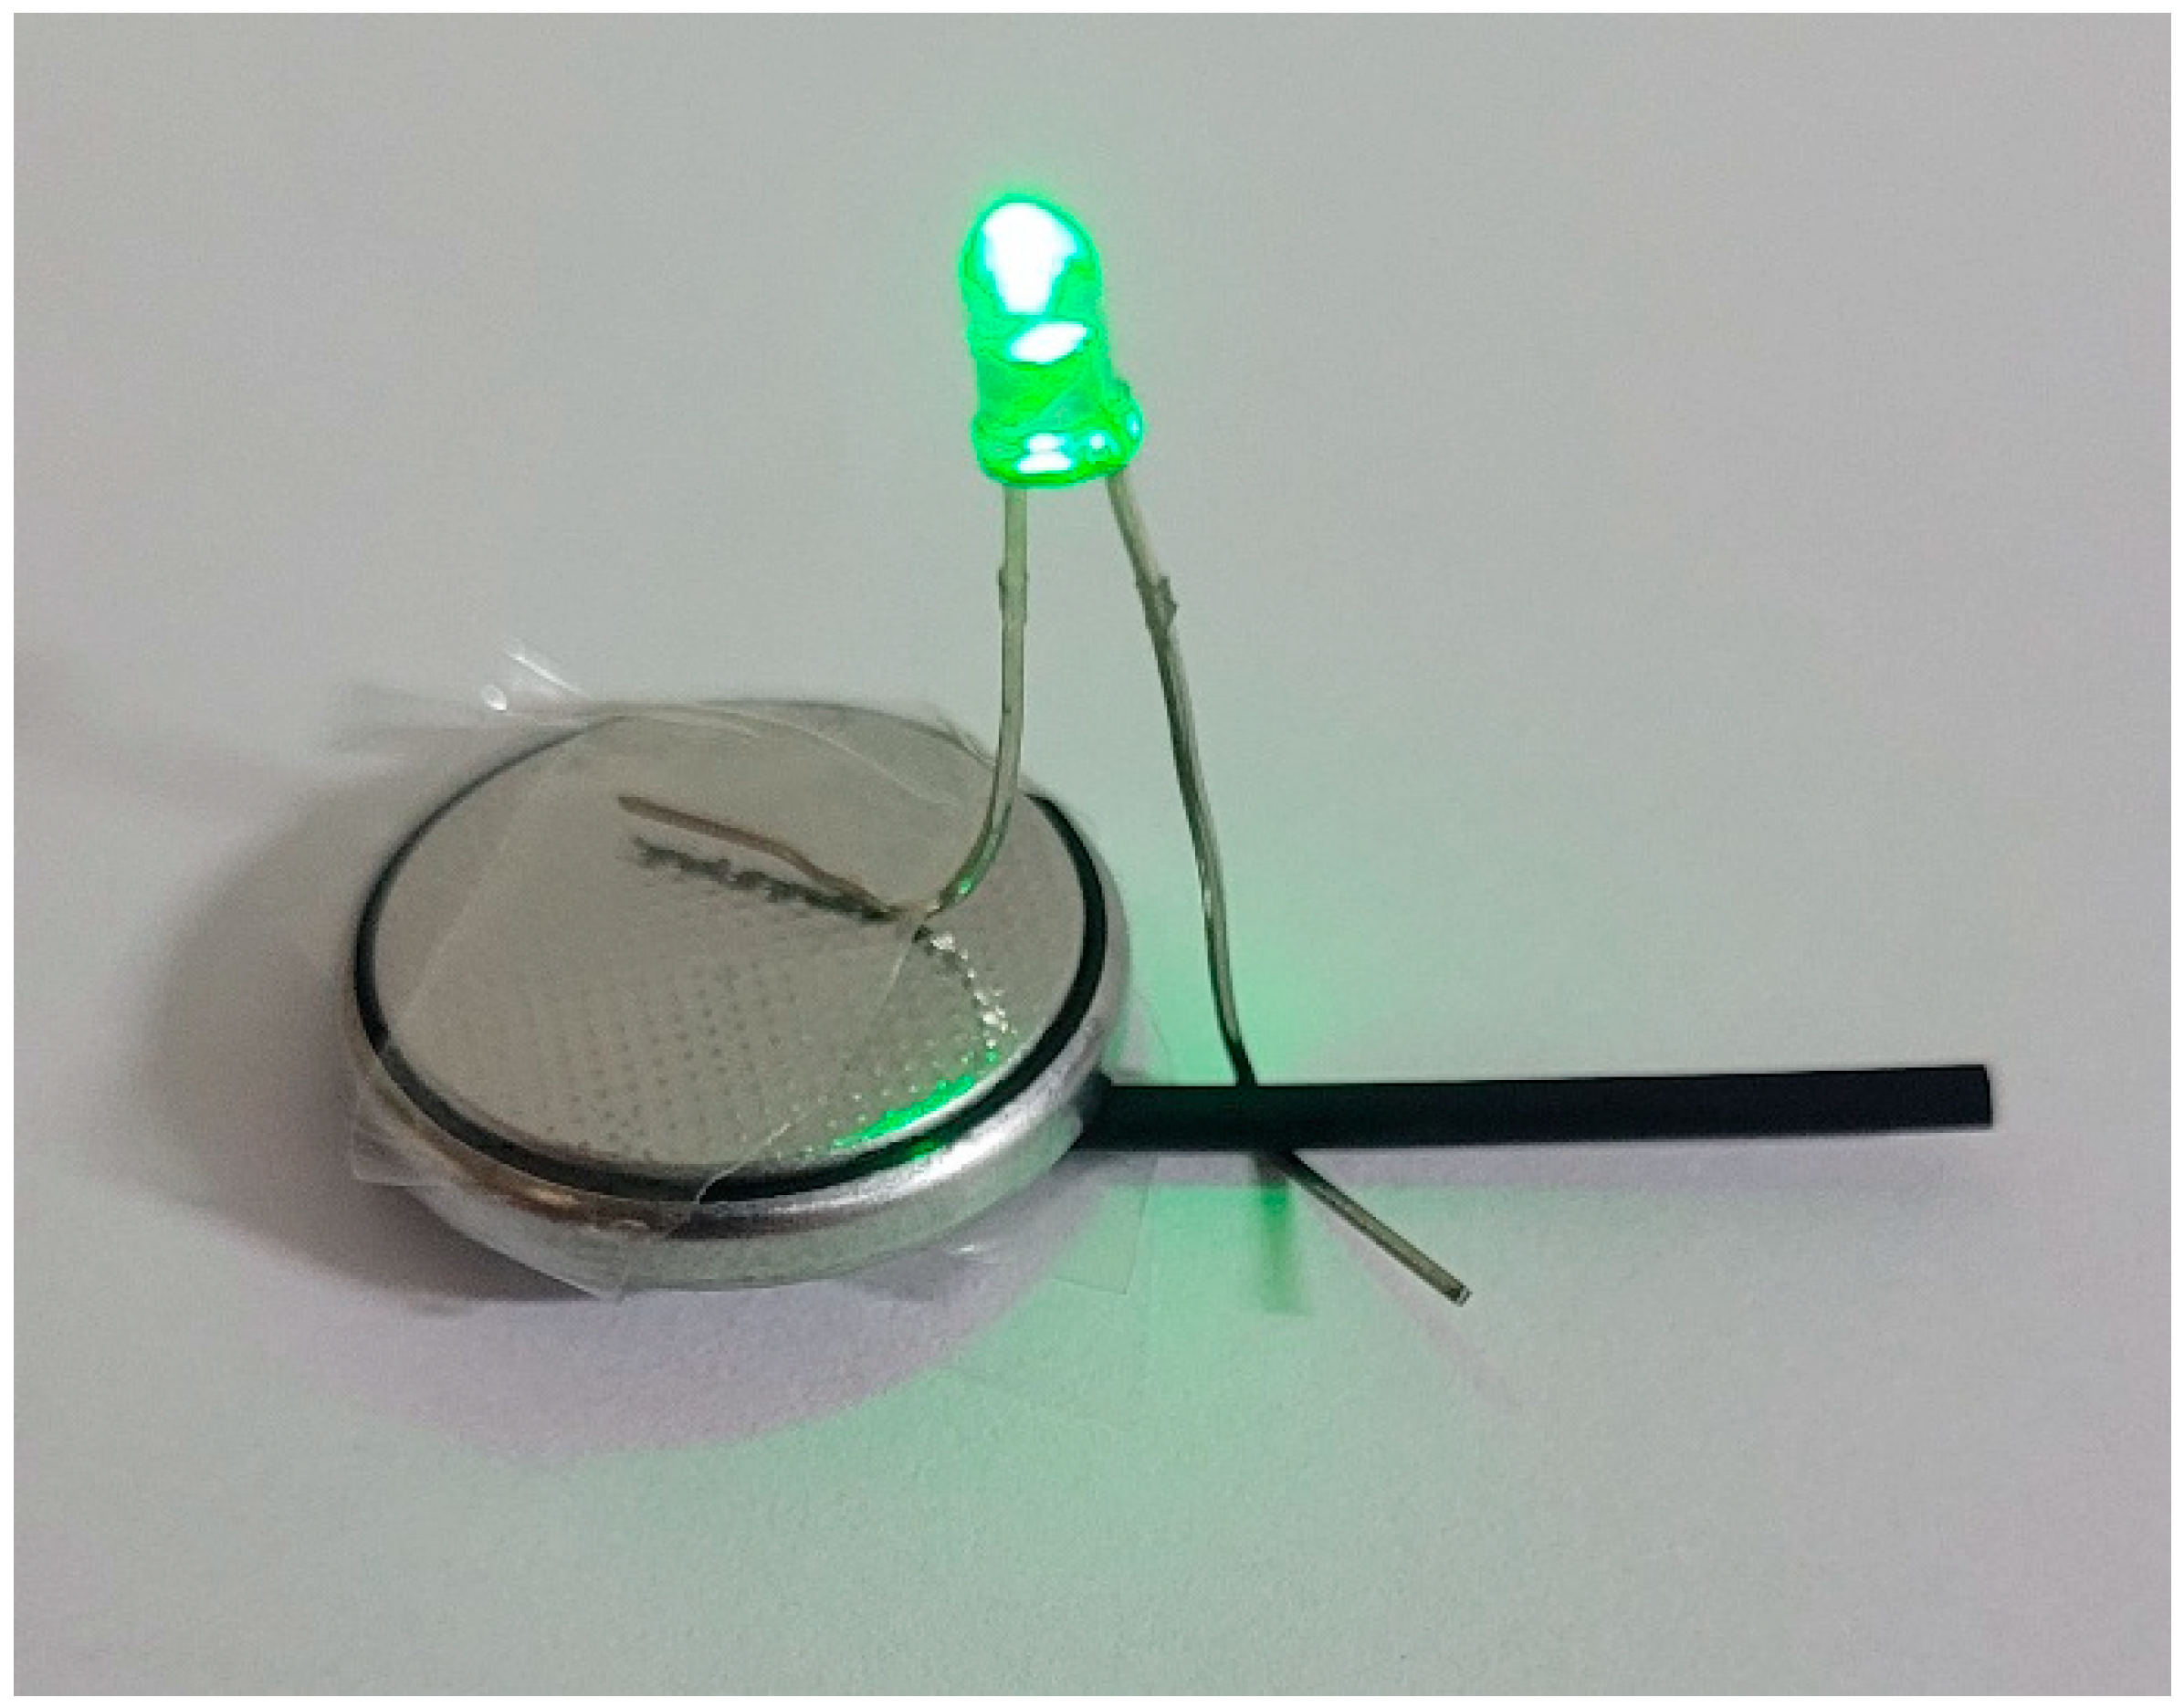
3.1. Manufacture of Conductive Filaments and CB-PLA Electrodes

The filaments manufactured in this work were obtained using the solvent-based method (SM). This method was selected due to its simplicity and greater application when compared to thermal methods, which generally require more-sophisticated equipment and greater infrastructure [24,25,26,27].
In the SM, the choice of one or more solvents is crucial for the effective dispersion of the polymer and conductive material. In the literature, several solvents used for this purpose are reported [39]. In this context, Stefano et al. [24] used acetone and chloroform for PLA and graphite. The main problems involved in the use of these solvents are related to the high toxicity of chloroform and the difficulty in obtaining both solvents. In view of this, there has been an increase in studies concerning the search for alternative solvents, which have less toxicity and are easily accessible. To select suitable alternatives to chloroform and acetone, the Hildebrand–Burke solubility parameter theory [39] was applied, using the PLA solubility parameter as a reference. This theory postulates that optimal solubility occurs when the difference between the total Hildebrand solubility parameter (δt) of the solvent (δ1) and the solute (δ2) is less than or equal to 1.7 (cal cm;−3)1/2, as described by Equation (1):
δ 1 δ 2 1 , 7 c a l c m 3 1 2
Using this approach, it is possible to select solvents that exhibit greater affinity for PLA, to maximize solubilization. The Hansen solubility parameter (δt) of PLA is 21.9 [40]. Based on this, pyridine, acetic acid, and dichloroethane were initially considered as potential solvents, as shown in Table S1. Individual solubility tests revealed that, despite the similarity in δt, pyridine did not solubilize PLA, probably due to the steric impediment of the benzene ring. Acetic acid showed partial solubilization, while dichloroethane completely solubilized PLA over a 24 h period.
To optimize the incorporation of CB and reduce the solubilization time, a 3:1 mixture of acetic acid and dichloroethane was proposed. The ratio was defined by using the geometric method on the Teas graph (Figure S1), which positioned the PLA in a line between the two solvents, resulting in a ratio of 3:1. This mixture promoted the complete solubilization of PLA in less than 1 h. The incorporation of CB into the PLA was conducted under reflux at 70 °C in an oil bath, under constant agitation for total homogenization. The resulting solution was poured into a glass dish and dried at 50 °C in an oven for 12 h to allow for the complete evaporation of the solvent and for the formation of agglomerates (Figure 2). The dried material was cut into small fragments to optimize extrusion and ensure the homogeneity of the filament.
The filament extrusion process was carried out in a Filmaq3D CV Extruder (Filmaq 3D, Curitiba, Brazil) at 170 °C. At this temperature, it was possible to obtain a more homogeneous filament, with an approximate thickness of 1.75 mm, while maintaining the characteristic of polymer flexibility necessary for an efficient printing process. At temperatures above 170 °C, the extruded filament has a more malleable consistency, generating a filament with an irregular thickness. At lower temperatures, it was not possible to extrude the material, due to the clogging of the extrusion nozzle. After obtaining the filaments, a simple qualitative study was carried out to evaluate electrical conductivity. For this, a system was assembled by connecting the filament to a 3 V battery and an LED, and it was possible to observe the emission of light, indicating the passage of electric current (Figure 3).

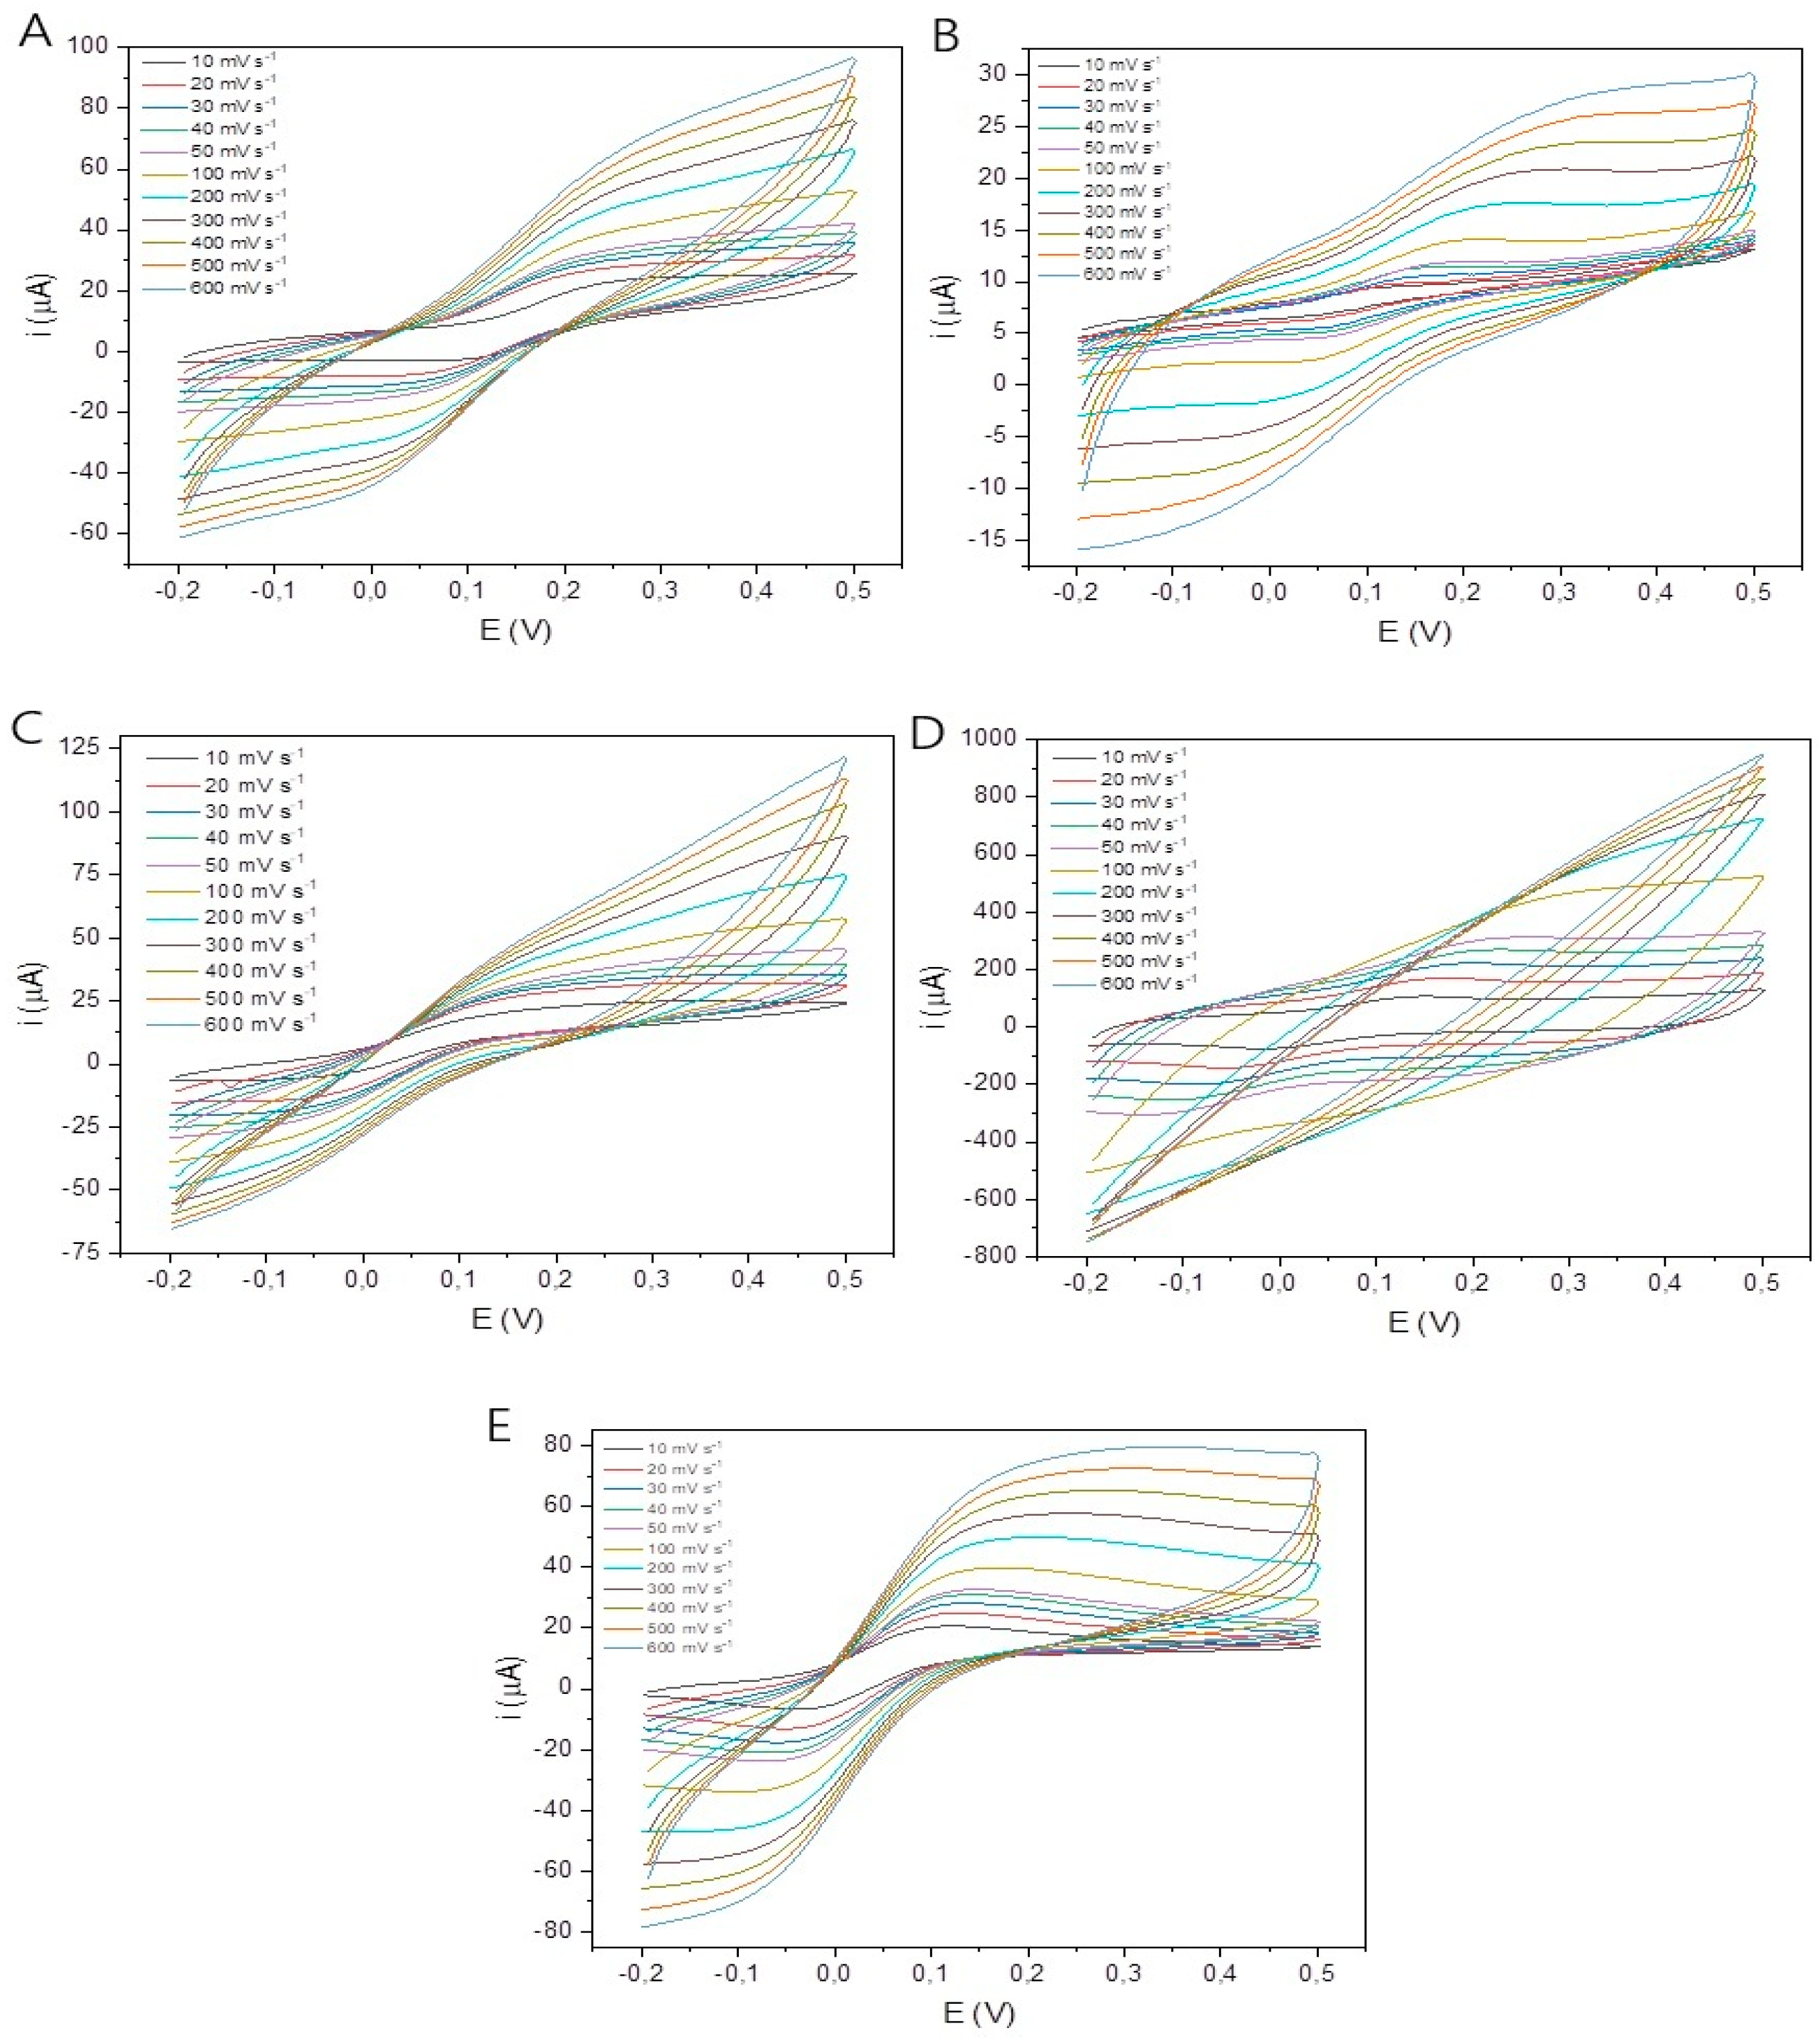
3.2. Electrochemical Characterization of Sensor

After fabrication, the sensors were electrochemically characterized by cyclic voltammetry (CV) and electrochemical impedance spectroscopy (EIS) for comparative evaluation before and after surface treatments. The selected techniques investigated changes in parameters such as the resistance to charge transfer, electroactive area, and heterogeneous kinetic constant, evaluating the influence of the treatments on the electrode–electrolyte interface. Four treatment methods were selected based on the literature: electrochemical activation and chemical polishing with an acid, base, and solvent.
Electrochemical activation is normally used to reduce the graphene present in graphene and PLA filaments, generating functional groups on the electrode surface. Santos et al. [41] demonstrated that this type of treatment also partially removes the polymeric material, exposing the conductive sites and leaving a more homogeneous surface. Solvent treatment has a similar effect to basic treatment and can help remove the remaining non-conductive material that shields the conductive structures. It is worth noting that the distinction between the two treatments is determined by the fact that DMF can remove the polymer through its dissolution [42,43]. Finally, acid treatment aims to oxidize and form oxygenated functional groups on the electrode surface, allowing greater interaction with analytes [42,44,45].
To determine the electroactive area and the kinetic constant, the influence of the CV scan rate on the faradaic process, i.e., in the presence of the redox ferricyanide/ferrocyanide pair, was studied. This process consists of applying the CV technique by varying the scan rate. The voltammograms obtained are illustrated in Figure 4.
Based on the data obtained from the voltammograms, the anodic peak potential (Epa) and cathodic peak potential (Epc) were analyzed, along with the peak potential difference (ΔEP), anodic peak current (Ipa), cathodic peak current (Ipc), and the ratio between peak currents (Ipa/Ipc) for different scan rates (υ) in each sensor. The results of these analyses are presented in Tables S2–S6 (Supplementary Materials).
The redox ferricyanide/ferrocyanide pair has a reversible character, through which it is possible to observe the presence of symmetrical anodic and cathode peaks and a ratio between the cathodic and anodic peak currents that is close to 1 [46,47,48]. However, in a preliminary analysis of the voltammograms demonstrated in Figure 4, it can be observed that as υ increases, both the response current and the distance between the peaks also increase. The observed increase in Ep values reduces the time available for the reaction to reach dynamic equilibrium. Thus, at high scan rates, the initial reversible reactions manifest as quasi-reversible or irreversible. It is noteworthy that at low sweep rates, the system’s dynamic equilibrium is more easily achieved, resulting in reversible or quasi-reversible systems, which indicates the proper performance of the manufactured electrochemical cell.
Skoog et al. propose that one of the conditions for a reaction to be considered reversible is to have a ΔEp ≅ 59 mV (25 °C) [47]. The ΔEp values for the untreated sensor (Table S2) ranged from 139 to 225 mV, higher than the ideal value. The ratio ipa/ipc presented an average of 0.96 ± 0.02. Thus, despite the peaks being symmetrical, the high ΔEp indicates a quasi-reversible system, as demonstrated by Trachioti et al. [49]. In a complementary way, the value of α was determined using Equation (2), since in cases where α is between 0.3 and 0.7, the system is quasi-reversible [47].
The quasi-reversibility characteristic of the system is possibly due to mass transport and interactions with the electrode surface. The same behavior was observed for the 3D-SE sensors (Table S3), 3D-SAcid (Table S4), 3D-SBasic (Table S5), and 3D-SSolvent (Table S6).
Δ E p 2 = 62.5 α m V ( 25   ° C )
When considering the behavior of the systems as quasi-reversible, it is possible to describe them using the modified Randles–Ševčík equation (Equation (3)), thus making it possible to estimate the electrochemically active area of the sensors, as proposed by Trachioti et al. [49] and Washe et al. [50].
i p = ( 2.69 × 10 5 A n 3 2 D R 1 2 C R υ 1 2 ) K ( Λ , α )
where ip is the peak current (A), A is the electrochemically active area (cm2), n is the number of electron moles involved in the redox reaction, D is the diffusion coefficient of the reduced species (cm2/s), CR∞ is the concentration of the reduced species within the solution (mol/cm3), υ is the scan rate (V/s), and K(Λ, α) is the modified dimensionless parameter.
The electrochemically active area of the sensors (Table 1) shows that the 3D sensor has an electrochemically active area approximately 12.3 times smaller than the geometric area of the sensor (12.56 mm2). The small electrochemically active area is possibly due to the high presence of PLA in the conductive filament since PLA is an insulating material that suppresses the number of active sites originating from the CB.
For the sensor treated with HNO3, it was possible to observe an increase in the electroactive area of 6.20 mm2, in comparison to the 3D sensor. This increase is likely due to the formation of oxygenated functional groups on the electrode surface that have contributed to the increase in available active sites. For the NaOH-treated sensor, an increase in the electroactive area of 9.01 mm2, in comparison to the 3D sensor, was observed, which may be related to the fact that the NaOH solution hydrolyzes the PLA present in the 3D sensor, exposing the conductive CB fibers. DMF treatment also exposes nanostructured conductive fibers, but less efficiently when compared to acid and basic treatment.
After estimating the areas, the velocity constant of an electrochemical reaction (k°) was investigated, which upholds the velocity law for chemical reactions. In electrochemistry, k° involves the transfer of electrons through an electrode/solution interface. Each electron transfer process at the electrode/solution interface occurs in a specific way, and depending on this form, there is more-appropriate mathematical modeling to describe the system and find the value of k°. The type of electrochemical system is determined with the help of factors such as its degree of reversibility, the type of redox reactions, and the investigation technique.
As the electrochemical systems formed for the 3D, 3D-SE, 3D-SAcid, 3D-SBasic, and 3D-SSolvent sensors have quasi-reversible characteristics and the analysis technique used was CV, Nicholson’s interpretation of mathematics, Equation (4), is the one that best suits the systems.
Ψ = k °   R T π D F   1 υ
where Ψ is the dimensionless parameter that expresses the degree of reversibility, k° is the heterogeneous kinetic constant (cm/s), R is the gas constant (8.314 J/mol*K), T is the temperature (298 K), D is the diffusion coefficient (cm2/s), F represents Faraday’s constant (96.485 C/mol), and υ is the scan rate (V/s).
The value of Ψ is related to ΔEp (Table S6), and Figure S2 illustrates a graphical representation of this relationship between Ψ and ΔEp. Ψ values were determined using data interpolation based on the values tabulated by Bard and Faulkner [46]. With the values of Ψ, the graphic correlation of these values was performed as a function of the inverse square root of the scan rate and the linear regression of the values (Figures S3–S7). Using the linear regression of these data, the slope of the regression line was determined. This slope reflects how systems respond to changes in scan rates. An increase in slope indicates a greater influence of the scan rate on the value of Ψ, which can be interpreted as greater non-reversibility. By replacing the square root of the inverse of the sweep velocity (√1/υ) in Equation (4) with the slope of the line, the calculation for the k° of electrochemical systems can be developed, obtaining the k° values shown in Table 1.
The k° value for the 3D sensor was shown to be large enough when compared to the values reported in the literature, so that the system is prone to behave reversibly, particularly at a lower scan rate, as observed in Figure S8 [51]. For the 3D-SE, 3D-SAcid, 3D-SBasic, and 3D-SSolvent sensors, despite showing a relationship between peak currents close to the ideal for the system that is reversible and α values close to that of the 3D sensor, the k° values were small when compared to the literature, indicating that even at low speeds the systems for these sensors do not tend to show reversibility.
To investigate the interfacial physicochemical processes, we used EIS, which provides information on the resistivity to charge transfer and the presence of secondary reactions. The analysis of the Nyquist diagrams and the proposition of an equivalent circuit (Figure 5) allowed us to determine the resistance of the systems. In the Nyquist diagrams, the x-axis represents the real (resistive) part, and the y-axis represents the imaginary part (capacitive) [46,52]. The diameter of the semicircle corresponds to the load transfer resistance.
Two equivalent circuits were proposed: the Randles circuit in Figure 5F was used for the 3D sensors, 3D-SE, 3D-SAcid, and 3D-SSolvent, while the equivalent circuit in Figure 5G was used for 3D-SBasic. Using the circuits, the polarization resistance (Rp), uncompensated resistance (RΩ), and non-ideal capacitance (Q) were determined, as represented in Table 1. Rp indicates the sensitivity of the sensor (lower values correspond to higher sensitivity), Q describes the capacitance of the electric double layer (higher values indicate higher charge accumulation), and RΩ represents the charge transfer resistance of the solution [53,54].
For the 3D-SE sensor, the values of polarization resistance, ohmic resistance, and phase constant admittance were higher than those of the untreated sensor. This result suggests that the electrochemical treatment alone did not improve the electrochemical performance of the sensor. The values found for the 3D-SAcid sensor were higher than those for the untreated sensor. 3D-SBasic, the equivalent circuit, presented lower values than the untreated sensor, with the appearance of a capacitive element (C) of 5.08 mF. The increase in Q and the presence of C indicate an accumulation of charges on the surface, which is consistent with the extended voltammograms, and which can be mitigated by increasing the ionic strength of the medium. Finally, for the 3D-SSolvent sensor, the equivalent circuit presented a higher RΩ when compared to the 3D-SBasic sensor, but a lower value than that of the 3D sensor, demonstrating the potential of 3D-SSolvent.
In general, we can observe that this study investigated different surface treatments on 3D-printed sensors to optimize their electrochemical performance. Electrochemical activation proved ineffective, while acid polishing produced properties inferior to those of the original sensor. Polishing with DMF showed similar performance to the untreated sensor. In contrast, basic polishing with NaOH (3D-SBasic) stood out as the most promising treatment, promoting a substantial increase in the electroactive area, a significant reduction in the resistance to electron transfer, and an increase in the reaction speed constant (k°). Although 3D-SBasic shows more capacitive behavior, the benefits regarding its electroactive area and load transfer resistance consolidate it as the best option. Therefore, NaOH polishing is the most effective treatment to improve the electrochemical performance of 3D-printed sensors. Future studies should be conducted to optimize the treatment parameters to minimize capacitive effects.

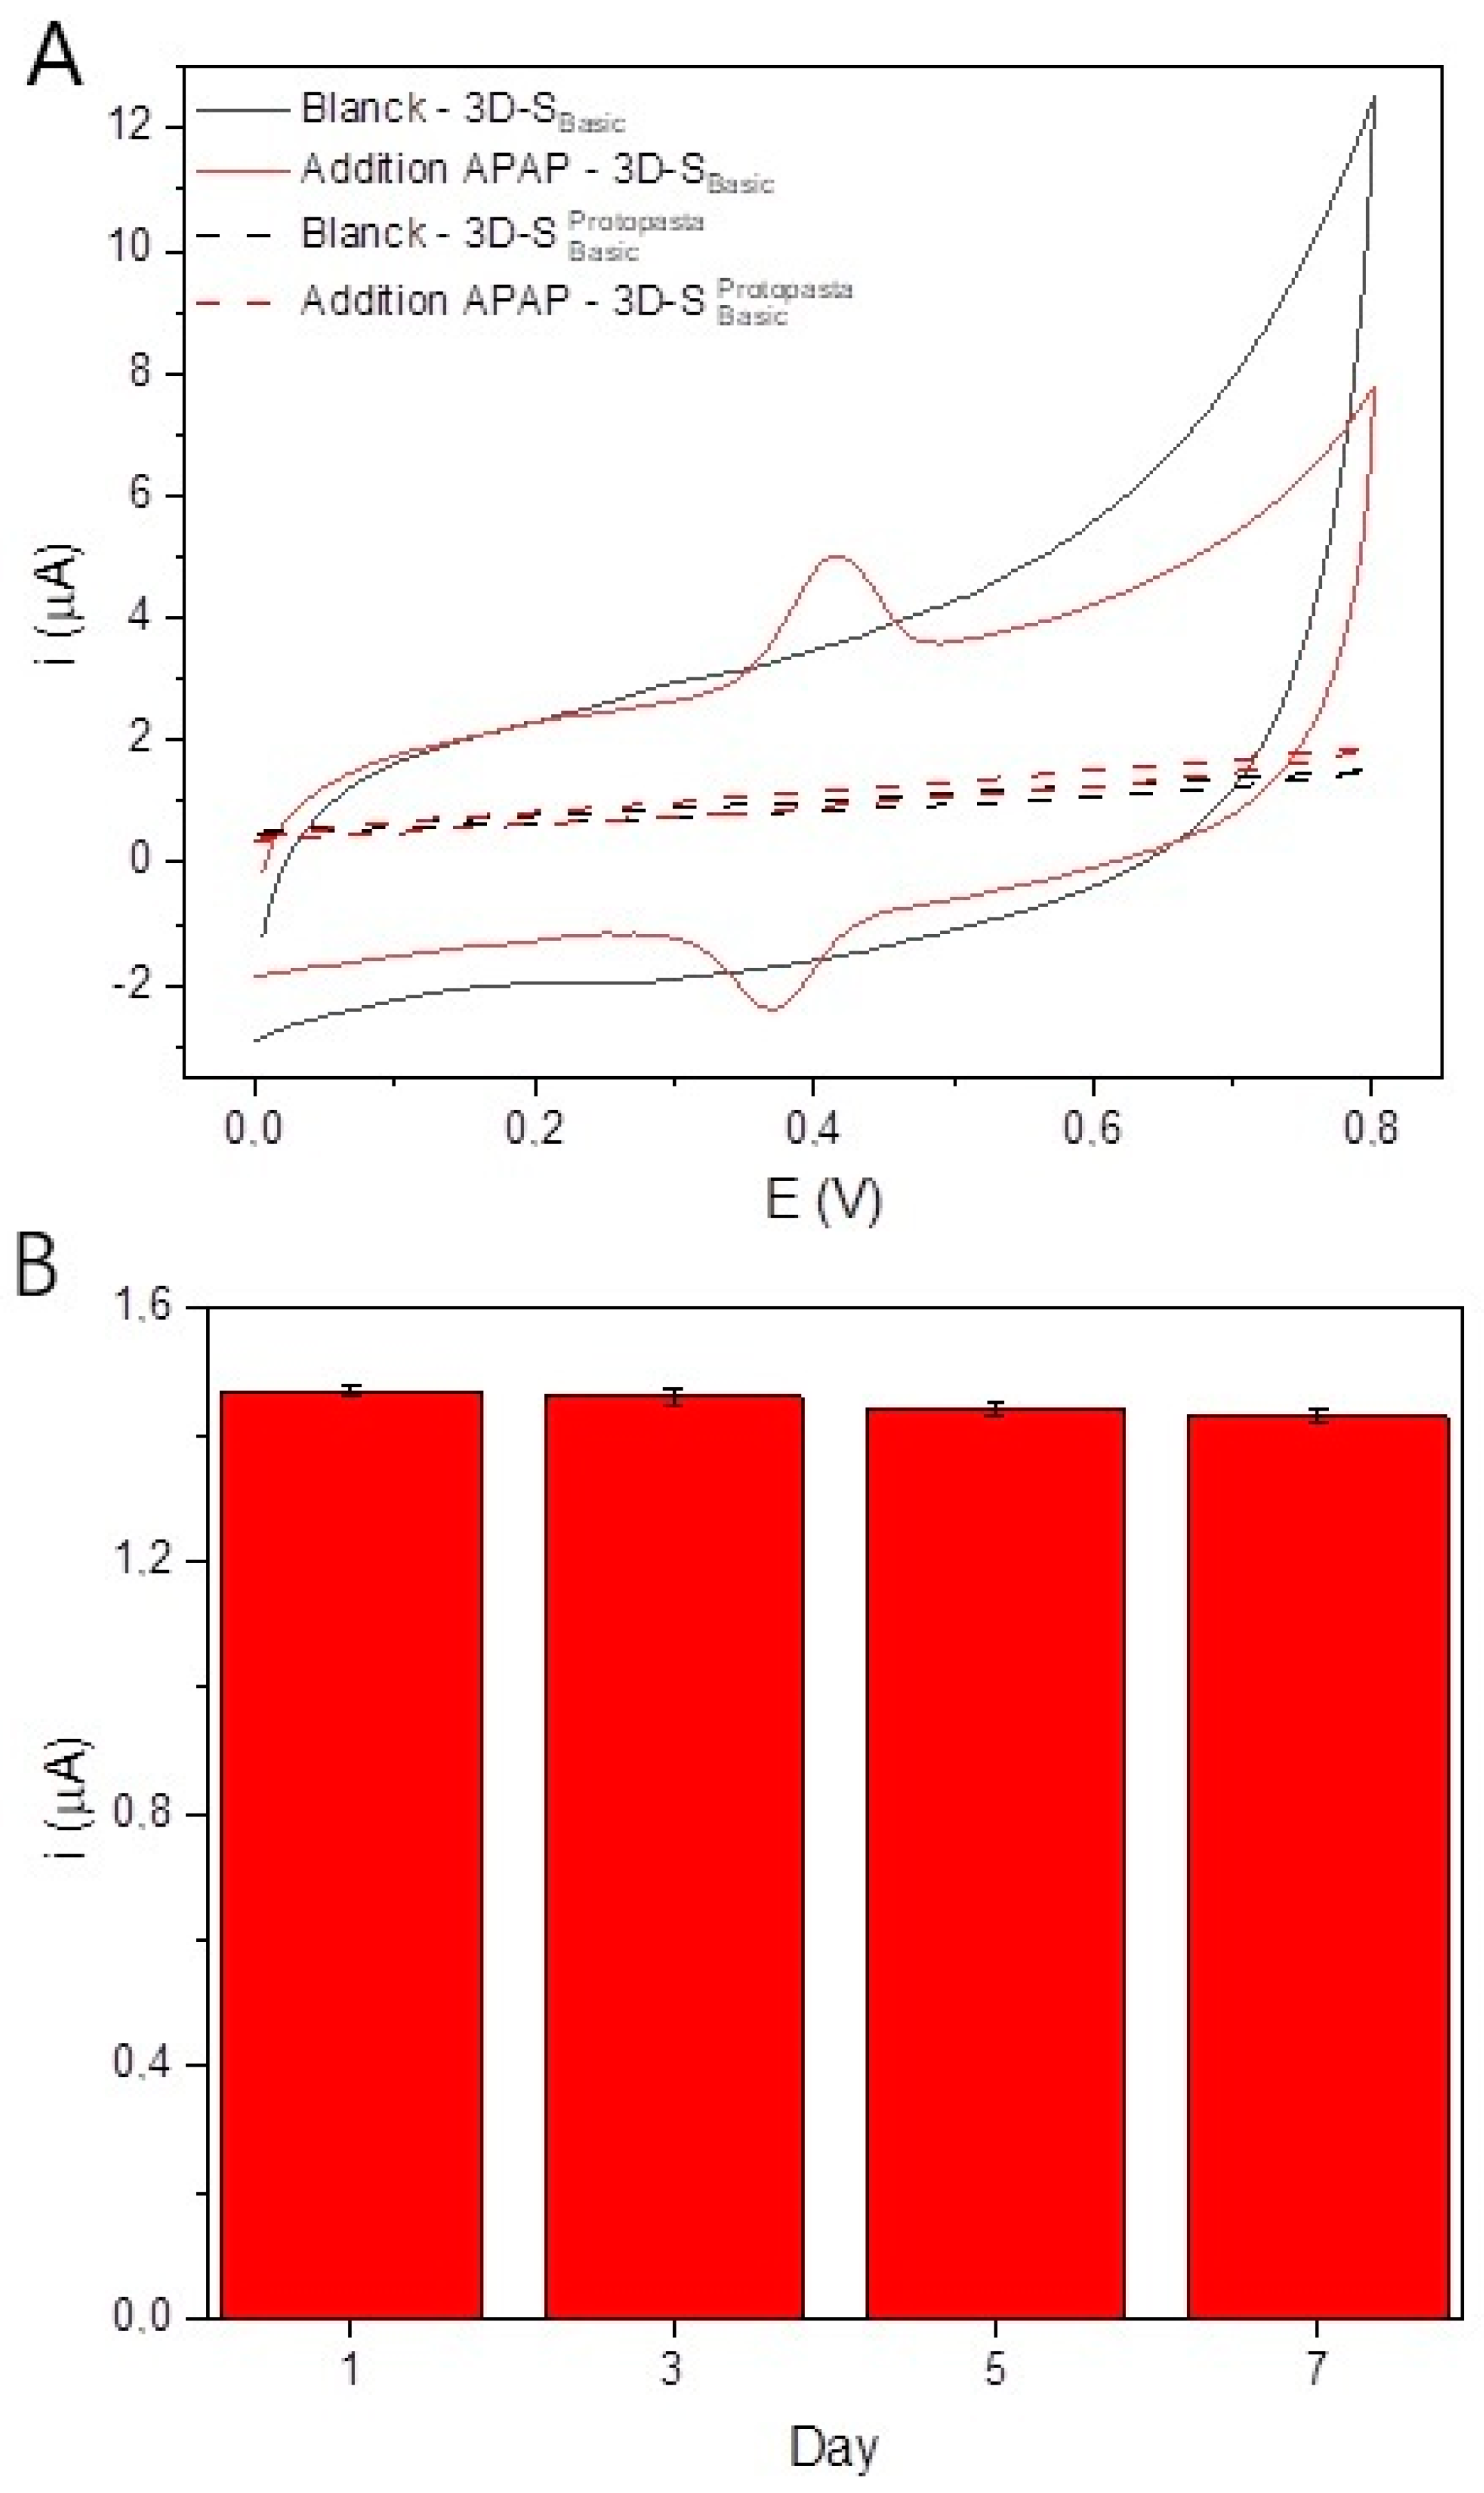
3.3. Evaluation of the Potential of 3D-SBasic

To evaluate the potential of the 3D-SBasic sensor in developing electrochemical sensors, the sensor was applied to the detection of acetaminophen (APAP). The analyses were performed using cyclic voltammetry (CV) in a 0.1 mol L−1, pH 7.00 phosphate buffer solution, in the presence and absence of APAP (10 μmol L−1). A sensor produced with commercial CB-PLA filament (Protopasta), named 3D-SBasicProtopasta, was also evaluated for the determination of APAP. The results obtained are illustrated in Figure 6A. It is possible to observe through the voltammograms (Figure 6A) that the filament developed in this work presents characteristic peaks for APAP, while for the sensor produced with commercial filament, it is not possible to observe the peaks. Therefore, this result suggests the potential application of the proposed sensor.
Sensor stability studies were also conducted. For this purpose, the sensor was stored for 7 days. The results are illustrated in Figure 6B. Through this study, it was observed that there was no significant signal loss in this time interval, indicating that the sensor was stable during this period. Additional studies should be performed to evaluate the long-term stability of the sensor.
A comparative study was carried out for the determination of APAP using conventional electrodes (glass carbon, carbon paste, and platinum disc) and 3D-SBasic. The electrochemical performance of the sensors was evaluated according to their determination of APAP in 0.10 mol L−1 phosphate buffer, pH 7.0, by cyclic voltammetry. For this, successive additions of different concentrations of APAP (5.0–50.0 μmol L−1) were performed. In Table 2, the sensitivity values for each electrode are shown. From the data obtained, it is possible to observe that the 3D-SBasic sensor showed better electrochemical performance compared to the conventional ones. This may be related to the larger area of the 3D-SBasic sensor due to the NaOH treatment.
The electrochemical performance of the proposed sensor was evaluated according to its ability to determine APAP in 0.10 mol L−1 phosphate buffer, pH 7.0, for different APAP concentrations (5.0–50.0 μmol L−1) using the differential pulse voltammetry (DPV) technique. The results are illustrated in Figure 7A. Through the voltammograms, it is possible to observe a gradual increase in the peak current, indicating that the sensor can detect different concentrations of APAP. The anodic peak current was correlated as a function of the APAP concentration to obtain an analytical curve (Figure 7B).
The limits of detection (LOD) and quantification (LOQ) were three and ten times the standard deviation of a blank solution divided by the sensitivity, respectively. The values found were 0.198 μM and 0.659 μM. The sensitivity and LOD found in this study were compared with some sensors reported in the literature for APAP detection (Table 3).
Although the proposed sensor does not have a lower LOD than those found by some studies in the literature, the performance of the 3D-SBasic is promising, since the sensor developed in this work is a disposable sensor, which uses alternative materials in its composition, in addition to not involving superficial modification. Furthermore, it is worth noting that 3D-SBasic has shown promise, indicating that it can be applied in the concentration range of possible APAP poisoning, since 24 h after the ingestion of the drug, the toxic concentration is above 40 μM [66].
Therefore, the results obtained in this work show promise, but further studies are needed to improve the sensor’s performance. The filament production conditions can be optimized by evaluating the ratio between the conductive material and PLA. Although the basic treatment with NaOH significantly improved the electroactive area and resistance to electron transfer, evaluating the treatment time and concentration may further enhance the electrochemical response. To study modifications on the sensor’s surface due to the treatment, characterizations using such methods as scanning electron microscopy, atomic force microscopy, and Raman will be evaluated. Finally, it is expected that this work can contribute to advancements in the development of 3D-printed sensors obtained from laboratory-fabricated filaments, with their low cost and alternative materials to commercial ones.

4. Conclusions

The conductive filament developed by mixing carbon black and PLA and solubilizing with acetic acid and dichloroethane is promising. The combination of solvents for the solubilization of PLA proved to be adequate, promoting the total homogenization of the mixture. The conductivity study confirmed the electron-conducting characteristic of the proposed filament. The surface treatments employed enabled the improvement of the electrochemical performance of the sensors, with NaOH being considered the best treatment. The applicability of the 3D-printed device was evaluated using CV, showing adequate sensitivity for acetaminophen determination. Therefore, the presented study hopes to contribute to the development of 3D-printed sensors with filaments made in the laboratory. Furthermore, the effectiveness of surface treatments was evidenced, which can improve the electrochemical performance of these sensors, thus contributing to the development of more efficient and versatile devices.

Supplementary Materials

The following supporting information can be downloaded at: https://www.mdpi.com/article/10.3390/analytica6010009/s1, Table S1: Hildebrand total parameter for different solvents; Table S2: Electrochemical parameters of 3D sensors; Table S3: Electrochemical parameters of 3D-SE; Table S4: Electrochemical parameters of 3D-SAcid; Table S5: Electrochemical parameters of 3D-SBasic.; Table S6: Electrochemical parameters of 3D-SSolvent; Table S7: Variation of ΔEp with Ψ at 25˚C, which provides data correlating to k°, is the 32 basis for a Nicholson method for estimating k° in quasi-reversible system; Figure S1: Teas graph, (red PLA, black Acetic acid and blue dichloroethane). A proportion of mixture of 3 acetic acid and 1 dichloroethane can be located on a line connect-65 ing the two liquids, at a distance equal to the ratio of the mixture to solubilize the PLA; Figure S2: Graphical representation of the relationship between Ψ and ΔEp, for redox pair ferricyanide/ferrocyanide; Figure S3: Peak separation plotted as a function of the square root of the scan rate in the presence of 5 mmol L−1 of [Fe(CN)6]4−/3− 0.1 mol L−1 KCl to 3D sensor; Figure S4: Peak separation plotted as a function of the square root of the scan rate in the presence of 5 mmol L−1 of [Fe(CN)6]4−/3− 0.1 mol L−1 KCl to 3D-SE; Figure S5: Peak separation plotted as a function of the square root of the scan rate in the presence of 5 mmol L−1 of [Fe(CN)6]4−/3− 0.1 mol L−1 KCl to 3D-SAcid; Figure S6: Peak separation plotted as a function of the square root of the scan rate in the presence of 5 mmol L−1 of [Fe(CN)6]4−/3− 0.1 mol L−1 KCl to 3D-SBasic; Figure S7: Peak separation plotted as a function of the square root of the scan rate in the presence of 5 mmol L−1 of [Fe(CN)6]4−/3− 0.1 mol L−1 KCl to 3D-SSolvent; Figure S8: Cyclic voltammograms, varying the scan rate from 10 mV s−1 to 50 mV s−1, in the presence of 5 mmol L−1 of [Fe(CN)6]4−/3− 0.1 mol L−1 KCl. (A) 3D sensor; (B) 3D-SE; (C) 3D-SAcid; 203 (D) 3D-SBasic; (E) 3D-SSolvent.

Author Contributions

T.G.B., D.N.d.S. and T.C.d.O.C. contributed to the conceptualization of the work; T.G.B., D.N.d.S., M.M.C.B., T.C.d.O.C. and S.O.D.d.T. contributed to the development of the filament and sensors used; T.G.B. contributed to the analysis used; T.G.B., T.C.d.O.C. and A.C.P. contributed to the general writing and revision of the manuscript. All authors have read and agreed to the published version of the manuscript.

Funding

This research received funding related to the processes: CEX—APQ-00679-22 FAPEMIG, 305360/2022-1 CNPq, and 465571/2014-0 INCT-DATREM.

Data Availability Statement

Data are contained within the article.

Acknowledgments

Fundação de Amparo à Pesquisa do Estado de Minas Gerais (FAPEMIG), Conselho Nacional de Desenvolvimento Científico e Tecnológico (CNPq), Coordenação de Aperfeiçoamento de Pessoal de Nível Superior (CAPES), Instituto Nacional de Tecnologias Alternativas para Detecção, Avaliação Toxicológica e Remoção de Contaminantes Emergentes e Radioativos (INCT-DATREM) and Universidade Federal de São João del Rei (UFSJ).

Conflicts of Interest

The authors declare no conflicts of interest.

References

  1. Wang, L.; Jiang, S.; Zhang, S. Mapping technological trajectories and exploring knowledge sources: A case study of 3D printing technologies. Technol. Forecast. Soc. Change 2020, 161, 120251. [Google Scholar] [CrossRef]
  2. Al Salaheen, M.; Alaloul, W.S.; Ali Musarat, M.; Johari, M.A.B.; Alzubi, K.M.; Alawag, A.M. Women career in construction industry after industrial revolution 4.0 norm. J. Open Innov. Technol. Mark. Complex. 2024, 10, 100277. [Google Scholar] [CrossRef]
  3. Praveena, B.A.; Lokesh, N.; Buradi, A.; Santhosh, N.; Praveena, B.L.; Vignesh, R. A comprehensive review of emerging additive manufacturing (3D printing technology): Methods, materials, applications, challenges, trends and future potential. Mater. Today Proc. 2022, 52, 1309–1313. [Google Scholar] [CrossRef]
  4. Mohanavel, V.; Ashraff Ali, K.S.; Ranganathan, K.; Allen Jeffrey, J.; Ravikumar, M.M.; Rajkumar, S. The roles and applications of additive manufacturing in the aerospace and automobile sector. Mater. Today Proc. 2021, 47, 405–409. [Google Scholar] [CrossRef]
  5. Shakor, P.; Nejadi, S.; Paul, G.; Malek, S. Review of Emerging Additive Manufacturing Technologies in 3D Printing of Cementitious Materials in the Construction Industry. Front. Built Environ. 2019, 4, 85. [Google Scholar] [CrossRef]
  6. Hojati, M.; Li, Z.; Memari, A.M.; Park, K.; Zahabi, M.; Nazarian, S.; Duarte, J.P.; Radlińska, A. 3D-printable quaternary cementitious materials towards sustainable development: Mixture design and mechanical properties. Results Eng. 2022, 13, 100341. [Google Scholar] [CrossRef]
  7. Yu, Q.; Zhang, M.; Bhandari, B.; Li, J. Future perspective of additive manufacturing of food for children. Trends Food Sci. Technol. 2023, 136, 120–134. [Google Scholar] [CrossRef]
  8. Millan, M.G.D.; de la Torre, M.G.M.V. 3D food printing: Technological advances, personalization and future challenges in the food industry. Int. J. Gastron. Food Sci. 2024, 37, 100963. [Google Scholar] [CrossRef]
  9. Alami, A.H.; Olabi, A.G.; Alashkar, A.; Alasad, S.; Aljaghoub, H.; Rezk, H.; Abdelkareem, M.A. Additive manufacturing in the aerospace and automotive industries: Recent trends and role in achieving sustainable development goals. Ain Shams Eng. J. 2023, 14, 102516. [Google Scholar] [CrossRef]
  10. Careri, F.; Khan, R.H.U.; Todd, C.; Attallah, M.M. Additive manufacturing of heat exchangers in aerospace applications: A review. Appl. Therm. Eng. 2023, 235, 121387. [Google Scholar] [CrossRef]
  11. Bozkurt, Y.; Karayel, E. 3D printing technology; methods, biomedical applications, future opportunities and trends. J. Mater. Res. Technol. 2021, 14, 1430–1450. [Google Scholar] [CrossRef]
  12. Abdalla, A.; Patel, B.A. 3D Printed Electrochemical Sensors. Annu. Rev. Anal. Chem. 2021, 14, 47–63. [Google Scholar] [CrossRef]
  13. Cardoso, R.M.; Kalinke, C.; Rocha, R.G.; dos Santos, P.L.; Rocha, D.P.; Oliveira, P.R.; Janegitz, B.C.; Bonacin, J.A.; Richter, E.M.; Munoz, R.A.A. Additive-manufactured (3D-printed) electrochemical sensors: A critical review. Anal. Chim. Acta 2020, 118, 73–91. [Google Scholar] [CrossRef] [PubMed]
  14. Cândido, T.C.O.; Silva, D.N.d.; Borges, M.M.C.; Barbosa, T.G.; Trindade, S.O.D.d.; Pereira, A.C. 3D-Printed Electrochemical Sensors: A Comprehensive Review of Clinical Analysis Applications. Analytica 2024, 5, 552–575. [Google Scholar] [CrossRef]
  15. Abdalla, A.; Patel, B.A. 3D-printed electrochemical sensors: A new horizon for measurement of biomolecules. Curr. Opin. Electrochem. 2020, 20, 78–81. [Google Scholar] [CrossRef]
  16. Zhou, X.; Deng, J.; Fang, C.; Lei, W.; Song, Y.; Zhang, Z.; Huang, Z.; Li, Y. Additive manufacturing of CNTs/PLA composites and the correlation between microstructure and functional properties. J. Mater. Sci. Technol. 2021, 60, 27–34. [Google Scholar] [CrossRef]
  17. Luo, Y.; Xu, Z.; He, X.L.; Tang, X.P.; Wu, N.Y.; Huang, D.; Dong, M.; Huang, J. Electrical gas sensors based on metal–organic frameworks for breath diagnosis. Microchem. J. 2024, 199, 109992. [Google Scholar] [CrossRef]
  18. Li, W.K.; Shi, Y.-P. Recent advances of carbon materials on pesticides removal and extraction based determination from polluted water. Trends Anal. Chem. 2024, 171, 117534. [Google Scholar] [CrossRef]
  19. Wan, X.; Du, H.; Tuo, D.; Qi, X.; Wang, T.; Wu, J.; Li, G. UiO-66/Carboxylated Multiwalled Carbon Nanotube Composites for Highly Efficient and Stable Voltammetric Sensors for Gatifloxacin. ACS Appl. Nano Mater. 2023, 6, 19403–19413. [Google Scholar] [CrossRef]
  20. Wang, T.; Guo, W.; Xia, Y.; Zhu, Y.; Chen, L.; Zhang, Y.; Li, G. Bimetallic UiO-66(Zr/Ce) MOF encapsulated reduced graphene oxide nanocomposite for voltametric detection of trace Lomefloxacin residues in milk. J. Food Compos. Anal. 2025, 139, 107086. [Google Scholar] [CrossRef]
  21. Zouaoui, F.; Menassol, G.; Ducros, C.; Mailley, P.; Thomas, Y. Electrochemical sensors based on amorphous carbon electrode: A review. Microchem. J. 2025, 209, 112650. [Google Scholar] [CrossRef]
  22. Raoof, J.B.; Darvishnejad, F.; Ghani, M. A sensitive electrochemical sensor based on polyoxometalates@carbon spheres-multi-walled carbon nanotubes-β-cyclodextrin composite modified carbon paste electrode for simultaneous determination of some phenolic compounds in environmental samples. Microchem. J. 2025, 208, 112548. [Google Scholar] [CrossRef]
  23. Joshi, A.; Slaughter, G. Electrochemical carbon-based sensors for non-enzymatic uric acid sensing. Microchem. J. 2025, 208, 112331. [Google Scholar] [CrossRef]
  24. Stefano, J.S.; Silva, L.R.G.; Rocha, R.G.; Brazaca, L.C.; Richter, E.M.; Muñoz, R.A.A.; Janegitz, B.C. New conductive filament ready-to-use for 3D-printing electrochemical (bio)sensors: Towards the detection of SARS-CoV-2. Anal. Chim. Acta 2022, 1191, 339372. [Google Scholar] [CrossRef]
  25. Dul, S.; Fambri, L.; Pegoretti, A. Fused Deposition Modelling with ABS–Graphene Nanocomposites. Compos. Part. A Appl. Sci. Manuf. 2016, 85, 181–191. [Google Scholar] [CrossRef]
  26. Lopes, C.E.C.; De Faria, L.V.; Araújo, D.A.G.; Richter, E.M.; Paixão, T.R.L.C.; Dantas, L.M.F.; Muñoz, R.A.A.; Da Silva, I.S. Lab-Made 3D-Printed Electrochemical Sensors for Tetracycline Determination. Talanta 2023, 259, 124536. [Google Scholar] [CrossRef] [PubMed]
  27. Musenich, L.; Berardengo, M.; Avalle, M.; Haj-Ali, R.; Sharabi, M.; Libonati, F. Anisotropic Mechanical and Sensing Properties of Carbon Black-Polylactic Acid Nanocomposites Produced by Fused Filament Fabrication. Smart Mater. Struct. 2024, 33, 095010. [Google Scholar] [CrossRef]
  28. Rocha, D.P.; Rocha, R.G.; Castro, S.V.F.; Trindade, M.A.G.; Munoz, R.A.A.; Richter, E.M.; Angnes, L. Posttreatment of 3D-printed Surfaces for Electrochemical Applications: A Critical Review on Proposed Protocols. Electrochem. Sci. Adv. 2022, 2, e2100136. [Google Scholar] [CrossRef]
  29. Novotný, F.; Urbanová, V.; Plutnar, J.; Pumera, M. Preserving Fine Structure Details and Dramatically Enhancing Electron Transfer Rates in Graphene 3D-Printed Electrodes via Thermal Annealing: Toward Nitroaromatic Explosives Sensing. ACS Appl. Mater. Interfaces 2019, 11, 35371–35375. [Google Scholar] [CrossRef]
  30. João, A.F.; Rocha, R.G.; Matias, T.A.; Richter, E.M.; Flávio, S.; Petruci, J.; Muñoz, R.A.A. 3D-Printing in Forensic Electrochemistry: Atropine Determination in Beverages Using an Additively Manufactured Graphene-Polylactic Acid Electrode. Microchem. J. 2021, 167, 106324. [Google Scholar] [CrossRef]
  31. Singh Shergill, R.; Perez, F.; Abdalla, A.; Anil Patel, B. Comparing Electrochemical Pre-Treated 3D Printed Native and Mechanically Polished Electrode Surfaces for Analytical Sensing. J. Electroanal. Chem. 2022, 905, 115994. [Google Scholar] [CrossRef]
  32. Redondo, E.; Muñoz, J.; Pumera, M. Green Activation Using Reducing Agents of Carbon-Based 3D Printed Electrodes: Turning Good Electrodes to Great. Carbon 2021, 175, 413–419. [Google Scholar] [CrossRef]
  33. Negahdary, M.; do Lago, C.L.; Gutz, I.G.R.; Buoro, R.M.; Durazzo, M.; Angnes, L. Developing a nanomaterial-based 3D-printed platform: Application as a cancer aptasensor via detection of heat shock protein 90 (HSP90). Sens. Actuators B Chem. 2024, 409, 135592. [Google Scholar] [CrossRef]
  34. Veloso, W.B.; Ataide, V.N.; Rocha, D.P.; Nogueira, H.P.; De Siervo, A.; Angnes, L.; Muñoz, R.A.A.; Paixão, T.R.L.C. 3D-Printed Sensor Decorated with Nanomaterials by CO2 Laser Ablation and Electrochemical Treatment for Non-Enzymatic Tyrosine Detection. Microchim. Acta 2023, 190, 63. [Google Scholar] [CrossRef] [PubMed]
  35. Siqueira, G.P.; Rocha, R.G.; Nascimento, A.B.; Richter, E.M.; Muñoz, R.A.A. Portable Atmospheric Air Plasma Jet Pen for the Surface Treatment of Three-Dimensionally (3D)-Printed Electrodes. Anal. Chem. 2024, 96, 15852–15858. [Google Scholar] [CrossRef]
  36. Zhong, L.; Liao, M.; Ou, J.; Yang, Y.; Wen, J.; Jiang, Y.; Yang, H.; Dai, X.; Wang, L. Gold particles modified 3D printed carbon black nanonetwork electrode for improving the detection sensitivity of dopamine. Microchem. J. 2024, 201, 110630. [Google Scholar] [CrossRef]
  37. Lee, S.H.; Kim, I.Y.; Song, W.S. Biodegradation of Polylactic Acid (PLA) Fibers Using Different Enzymes. Macromol. Res. 2014, 22, 657–663. [Google Scholar] [CrossRef]
  38. Tokiwa, Y.; Calabia, B.P. Biodegradability and Biodegradation of Poly(Lactide). Appl. Microbiol. Biotechnol. 2006, 72, 244–251. [Google Scholar] [CrossRef] [PubMed]
  39. Burke, J. Solubility Parameters: Theory and Application. AIC Book Pap. Group Annu. 1984, 3, 13–58. [Google Scholar]
  40. Abbott, S. Chemical compatibility of poly(lactic acid): A practical framework using Hansen solubility parameters. In Poly(lactic acid): Synthesis, Structures, Properties, Processing, and Applications; Auras, R., Lim, L.T., Selke, S.E.M., Tsuji, H., Eds.; John Wiley & Son, Inc.: Hoboken, NJ, USA, 2010; pp. 83–95. [Google Scholar] [CrossRef]
  41. dos Santos, P.L.; Katic, V.; Loureiro, H.C.; dos Santos, M.F.; dos Santos, D.P.; Formiga, A.L.B.; Bonacin, J.A. Enhanced performance of 3D printed graphene electrodes after electrochemical pre-treatment: Role of exposed graphene sheets. Sens. Actuators B Chem. 2019, 281, 837–848. [Google Scholar] [CrossRef]
  42. Kalinke, C.; Neumsteir, N.V.; Aparecido, G.O.; Ferraz, T.V.B.; dos Santos, P.L.; Janegitz, B.C.; Bonacin, J.A. Comparison of activation processes for 3D printed PLA-graphene electrodes: Electrochemical properties and application for sensing of dopamine. Analyst 2020, 145, 1207. [Google Scholar] [CrossRef] [PubMed]
  43. Gusmão, R.; Browne, M.P.; Sofer, Z.; Pumera, M. The capacitance and electron transfer of 3D-printed graphene electrodes are dramatically influenced by the type of solvent used for pre-treatment. Electrochem. Commun. 2019, 102, 83–88. [Google Scholar] [CrossRef]
  44. Sharma, A.; Faber, H.; Khosla, A.; Anthopoulos, T.D. 3D printed electrochemical devices for bio-chemical sensing: A review. Mater. Sci. Eng. R Rep. 2023, 156, 100754. [Google Scholar] [CrossRef]
  45. Silva, V.A.O.P.; Fernandes-Junior, W.S.; Rocha, D.P.; Stefano, J.S.; Munoz, R.A.A.; Bonacin, J.A.; Janegitz, B.C. 3D-printed reduced graphene oxide/polylactic acid electrodes: A new prototyped platform for sensing and biosensing applications. Biosens. Bioelectron. 2020, 170, 112684. [Google Scholar] [CrossRef] [PubMed]
  46. Bard, A.J.; Faulkner, L.R. Electrochemical Methods: Fundamentals and Applications, 2nd ed.; John Wiley & Sons: New York, NY, USA, 2001. [Google Scholar]
  47. Skoog, D.A.; West, D.M.; Holler, J. Fundamentals of Analytical Chemistry, 9th ed.; Cengage Learnin: Singapore, 2014. [Google Scholar]
  48. Brett, C.M.A.; Brett, A.M.O. Electrochemistry: Principles, Methods and Applications; Oxford University Press: Oxford, UK, 1993. [Google Scholar]
  49. Trachioti, M.G.; Lazanas, A.C.; Prodromidis, M.I. Shedding light on the calculation of electrode electroactive area and heterogeneous electron transfer rate constants at graphite screen-printed electrodes. Microchim. Acta 2023, 190, 251. [Google Scholar] [CrossRef]
  50. Washe, A.P.; Lozano-Sánchez, P.; Bejarano-Nosas, D.; Katakis, I. Facile and versatile approaches to enhancing electrochemical performance of screen printed electrodes. Electrochim. Acta. 2013, 91, 166–172. [Google Scholar] [CrossRef]
  51. Tanimoto, S.; Ichimura, A. Discrimination of Inner- and Outer-Sphere Electrode Reactions by Cyclic Voltammetry Experiments. J. Chem. Educ. 2013, 90, 778–781. [Google Scholar] [CrossRef]
  52. Ma, Y.; Wang, X.; Yuan, H.; Chang, G.; Zhu, J.; Dai, H.; Wei, X. Review of electrochemical impedance spectroscopy in fault diagnosis for proton exchange membrane fuel cells. Renew. Sustain. Energy Rev. 2025, 211, 115226. [Google Scholar] [CrossRef]
  53. Chang, C.; Wang, S.; Tao, C.; Jiang, J.; Jiang, Y.; Wang, L. An improvement of equivalent circuit model for state of health estimation of lithium-ion batteries based on mid-frequency and low-frequency electrochemical impedance spectroscopy. Measurement 2022, 202, 111795. [Google Scholar] [CrossRef]
  54. Finšgar, M.; Xhanari, K.; Petovar, B. Copper-film electrodes for Pb(II) trace analysis and a detailed electrochemical impedance spectroscopy study. Microchem. J. 2019, 147, 863–871. [Google Scholar] [CrossRef]
  55. Sadeghi, M.; Shabani-Nooshabadi, M. High sensitive titanium/chitosan-coated nanoporous gold film electrode for electrochemical determination of acetaminophen in the presence of piroxicam. Prog. Org. Coat. 2021, 151, 106100. [Google Scholar] [CrossRef]
  56. Gu, H.; Shui, X.; Zhang, Y.; Zeng, T.; Yang, J.; Wu, Z.; Zhang, X.; Yang, N. Porous carbon scaffolded Fe-based alloy nanoparticles for electrochemical quantification of acetaminophen and rutin. Carbon 2024, 221, 118954. [Google Scholar] [CrossRef]
  57. Ghadirinataj, M.; Hassaninejad-Darzi, S.K.; Emadi, H. An electrochemical nanosensor for simultaneous quantification of acetaminophen and acyclovir by ND@Dy2O3-IL/CPE. Electrochim. Acta 2023, 450, 142274. [Google Scholar] [CrossRef]
  58. Ahmed, J.; Faisal, M.; Alsareii, S.A.; Jalalah, M.; Alsaiari, M.; Harraz, F.A. Mn2O3 nanoparticle-porous silicon nanocomposite based amperometric sensor for sensitive detection and quantification of Acetaminophen in real samples. Ceram. Int. 2023, 49, 933–943. [Google Scholar] [CrossRef]
  59. Pereira, A.C.S.; Silva, D.N.; Porto, L.S.; Pereira, A.C. Development of electrochemical biosensor based on nanostructured carbon materials for paracetamol determination. Electroanalysis 2020, 32, 1905–1913. [Google Scholar] [CrossRef]
  60. Chen, Y.; Liu, L.; Yan, X.; Li, K.; Deng, D.; He, H.; Lei, Y.; Luo, L. Electrochemical sensor based on Ni3S2-MoS2 hollow nanospheres for sensitive detection of acetaminophen. Microchem. J. 2025, 208, 112487. [Google Scholar] [CrossRef]
  61. Jiang, J.; Ding, D.; Wang, J.; Lin, X.; Diao, G. Three-dimensional nitrogen-doped graphene-based metal-free electrochemical sensors for simultaneous determination of ascorbic acid, dopamine, uric acid, and acetaminophen. Analyst 2021, 146, 964. [Google Scholar] [CrossRef]
  62. Yang, K.; Yang, H.; Zheng, Y.; Chen, H.; Liu, W.; Yang, X. Electrochemical sensor based on cobalt single-atom anchored porous carbon composite for sensitive detection of acetaminophen. Microchem. J. 2024, 203, 110874. [Google Scholar] [CrossRef]
  63. Sriprasertsuk, S.; Mathias, S.C.; Varcoe, J.R.; Crean, C. Polypyrrole-coated carbon fibre electrodes for paracetamol and clozapine drug sensing. J. Electroanal. Chem. 2021, 897, 115608. [Google Scholar] [CrossRef]
  64. Kozak, J.; Tyszczuk-Rotko, K.; Wójciak, M.; Sowa, I. Electrochemically Activated Screen-Printed Carbon Sensor Modified with Anionic Surfactant (aSPCE/SDS) for Simultaneous Determination of Paracetamol, Diclofenac and Tramadol. Materials 2021, 14, 3581. [Google Scholar] [CrossRef]
  65. Yang, H.; Dai, X.; Liao, M.; Ou, J.; Yang, Y.; Wan, M.; Zhou, J.; Wang, L. Spherical covalent organic framework and gold nanoparticles modified 3D-printed nanocarbon electrode for the sensor of acetaminophen. Microchem. J. 2023, 189, 108547. [Google Scholar] [CrossRef]
  66. Rumack, B.H.; Matthew, H. Acetaminophen poisoning and toxicity. Pediatrics 1975, 55, 871–876. [Google Scholar] [CrossRef] [PubMed]
Figure 1. Schematic of the process of manufacturing CB-PLA electrodes.
Analytica 06 00009 g001
Figure 2. CB-PLA film was obtained after incorporating carbon black into PLA and drying it in an oven at 50 °C for 12 h.
Analytica 06 00009 g002
Figure 3. CB/PLA filament conductivity experiment using an LED.
Analytica 06 00009 g003
Figure 4. Cyclic voltammograms, varying the scan rate from 10 mV s−1 to 600 mV s−1: (A) 3D sensor; (B) 3D-SE; (C) 3D-SAcid; (D) 3D-SBasic; (E) 3D-SSolvent., in the presence of 5.00 mmol L−1 of [Fe(CN)6]4−/3− and 0.10 mol L−1 KCl.
Analytica 06 00009 g004
Figure 5. Nyquist diagram for (A) 3D sensor, (B) 3D-SE, (C) 3D-SAcid, (D) 3D-SBasic, and (E) 3D-SSolvent for a system containing an equimolar mixture of 5.00 mmol L−1 [Fe(CN)6]4−/3− in 0.10 mol L−1 KCl. (F) Randles equivalent circuit for 3D sensor, 3D-SE, 3D-SAcid, and 3D-SSolvent. (G) Equivalent circuit for 3D-SBasic.
Analytica 06 00009 g005
Figure 6. (A) Cyclic voltammograms for 3D-Sbasic (solid line) and 3D-SbasicProtopasta (dashed line) in the presence and absence of APAP and (B) stability study for the 3D-basic. Experimental conditions: 0.10 mol L−1 phosphate buffer, pH 7.00, 10.0 μmol L−1 APAP.
Analytica 06 00009 g006
Figure 7. (A) Differential pulse voltammograms of APAP (5.0–50.0 µmol L−1). (B) Calibration curve. Experimental conditions: 0.10 mol L−1 phosphate buffer, pH 7.00.
Analytica 06 00009 g007
Table 1. Electrochemical parameters for sensors before and after activation treatments.
SensorαElectrochemical Area (mm2)K° (cm s−1)RΩ (Ω)Rp (Ω)Q
3D sensor0.401.02 ± 0.030.001534151.002000.0023.9 μS s0.279
3D-SE0.500.20 ± 0.010.000403462.003990.008.75 μS s0.657
3D-SAcid0.307.22 ± 0.270.000139642.003670.0041.30 μS s0.537
3D-SBasic0.5010.03 ± 0.420.000529276.00118.0020.60 μS s0.500
3D-SSolvent0.405.62 ± 0.130.000442500.001600.0045.03 μS s0.763
α: load transfer coefficient; k°: heterogeneous kinetic constant; RΩ: uncompensated resistance; Rp: polarization resistance; Q: non-ideal capacitance.
Table 2. Sensitivity of APAP with different electrodes.
SensorSensitivity (μA/μM)
3D-SBasic0.20809
Glass Carbon0.03633
Carbon Paste0.02444
Platinum Disc0.00282
Table 3. Comparative study of different sensors reported in the literature for determining APAP.
SensorSensitivity (μA/μM)LOD (μM)[Ref.]
SG-CS-TiNPGF a0.4860.10[55]
FeCo@C/GCE b38.225.9 × 10−4[56]
ND@Dy2O3-IL/CPE c-0.031[57]
Mn2O3@PSi/GCE d0.0580.033[58]
MWCNT-LAC/GCE e0.3397.00[59]
Ni3S2-MoS2/GCE f-0.093[60]
3D-NG/DMF/ GCE g-0.020[61]
Co-N-C@PC/GCE h5.120.0341[62]
PPy.SDS i14.734.00[63]
SPCE/SDS j0.440.0148[64]
3DE/Au/COF k0.1700.076[65]
3D-SBasic0.5190.198This work
a Gold electrode (SD) and nano-porous gold film (NPGF) electrode modified with titanium (Ti) and chitosan (CS), b glass carbon electrode (GCE) modified with porous carbon composites doped with iron and cobalt (FeCo@C), c nanodiamond decorated dysprosium oxide and ionic liquid (IL)-modified carbon paste electrode (ND@Dy2O3-IL/CPE), d Mn2O3-embedded mesoporous silicon (Mn2O3@PSi) nanocomposite-fabricated glassy carbon electrode (GCE), e glass carbon electrode modified with multiwalled carbon nanotube and laccase enzyme immobilized by covalent cross-linking (MWCNT-LAC/GCE), f glass carbon electrode modified with Ni3S2-MoS2 hollow nanospheres, g glass carbon electrode (GCE) modified with three-dimensional nitrogen-doped graphene (3D-NG) dispersed in DMF, h glass carbon electrode (GCE) modified with cobalt single-atom anchored porous carbon (Co-N-C@PC) composites, i polypyrrole (PPy) electropolymerized onto carbon fibers in the presence of sodium dodecyl sulfate (SDS), j screen-printed carbon electrode (SPCE) modified with sodium dodecyl sulfate (SDS), k 3D-printed sensor activated with DMF (3DE) modified with gold nanoparticles (Au) and spherical covalent organic structure (COF).
Disclaimer/Publisher’s Note: The statements, opinions and data contained in all publications are solely those of the individual author(s) and contributor(s) and not of MDPI and/or the editor(s). MDPI and/or the editor(s) disclaim responsibility for any injury to people or property resulting from any ideas, methods, instructions or products referred to in the content.

