
Performance of Spectrophotometric and Fluorometric DNA Quantification Methods

 ,
, 
 and
and
Abstract
:1. Introduction
2. Materials and Methods
2.1. Materials
2.2. Spectrophotometric DNA Quantification
Measurements with the NanoDrop Instrument
2.3. Fluorometric DNA Quantifcation
2.3.1. Measurement with the AccuGreen High Sensitivity Kit
2.3.2. Measurement with the AccuClear Ultra High Sensitivity Kit
2.3.3. Measurements with the Qubit dsDNA HS Assay Kit
2.4. Statistical Analysis
3. Results
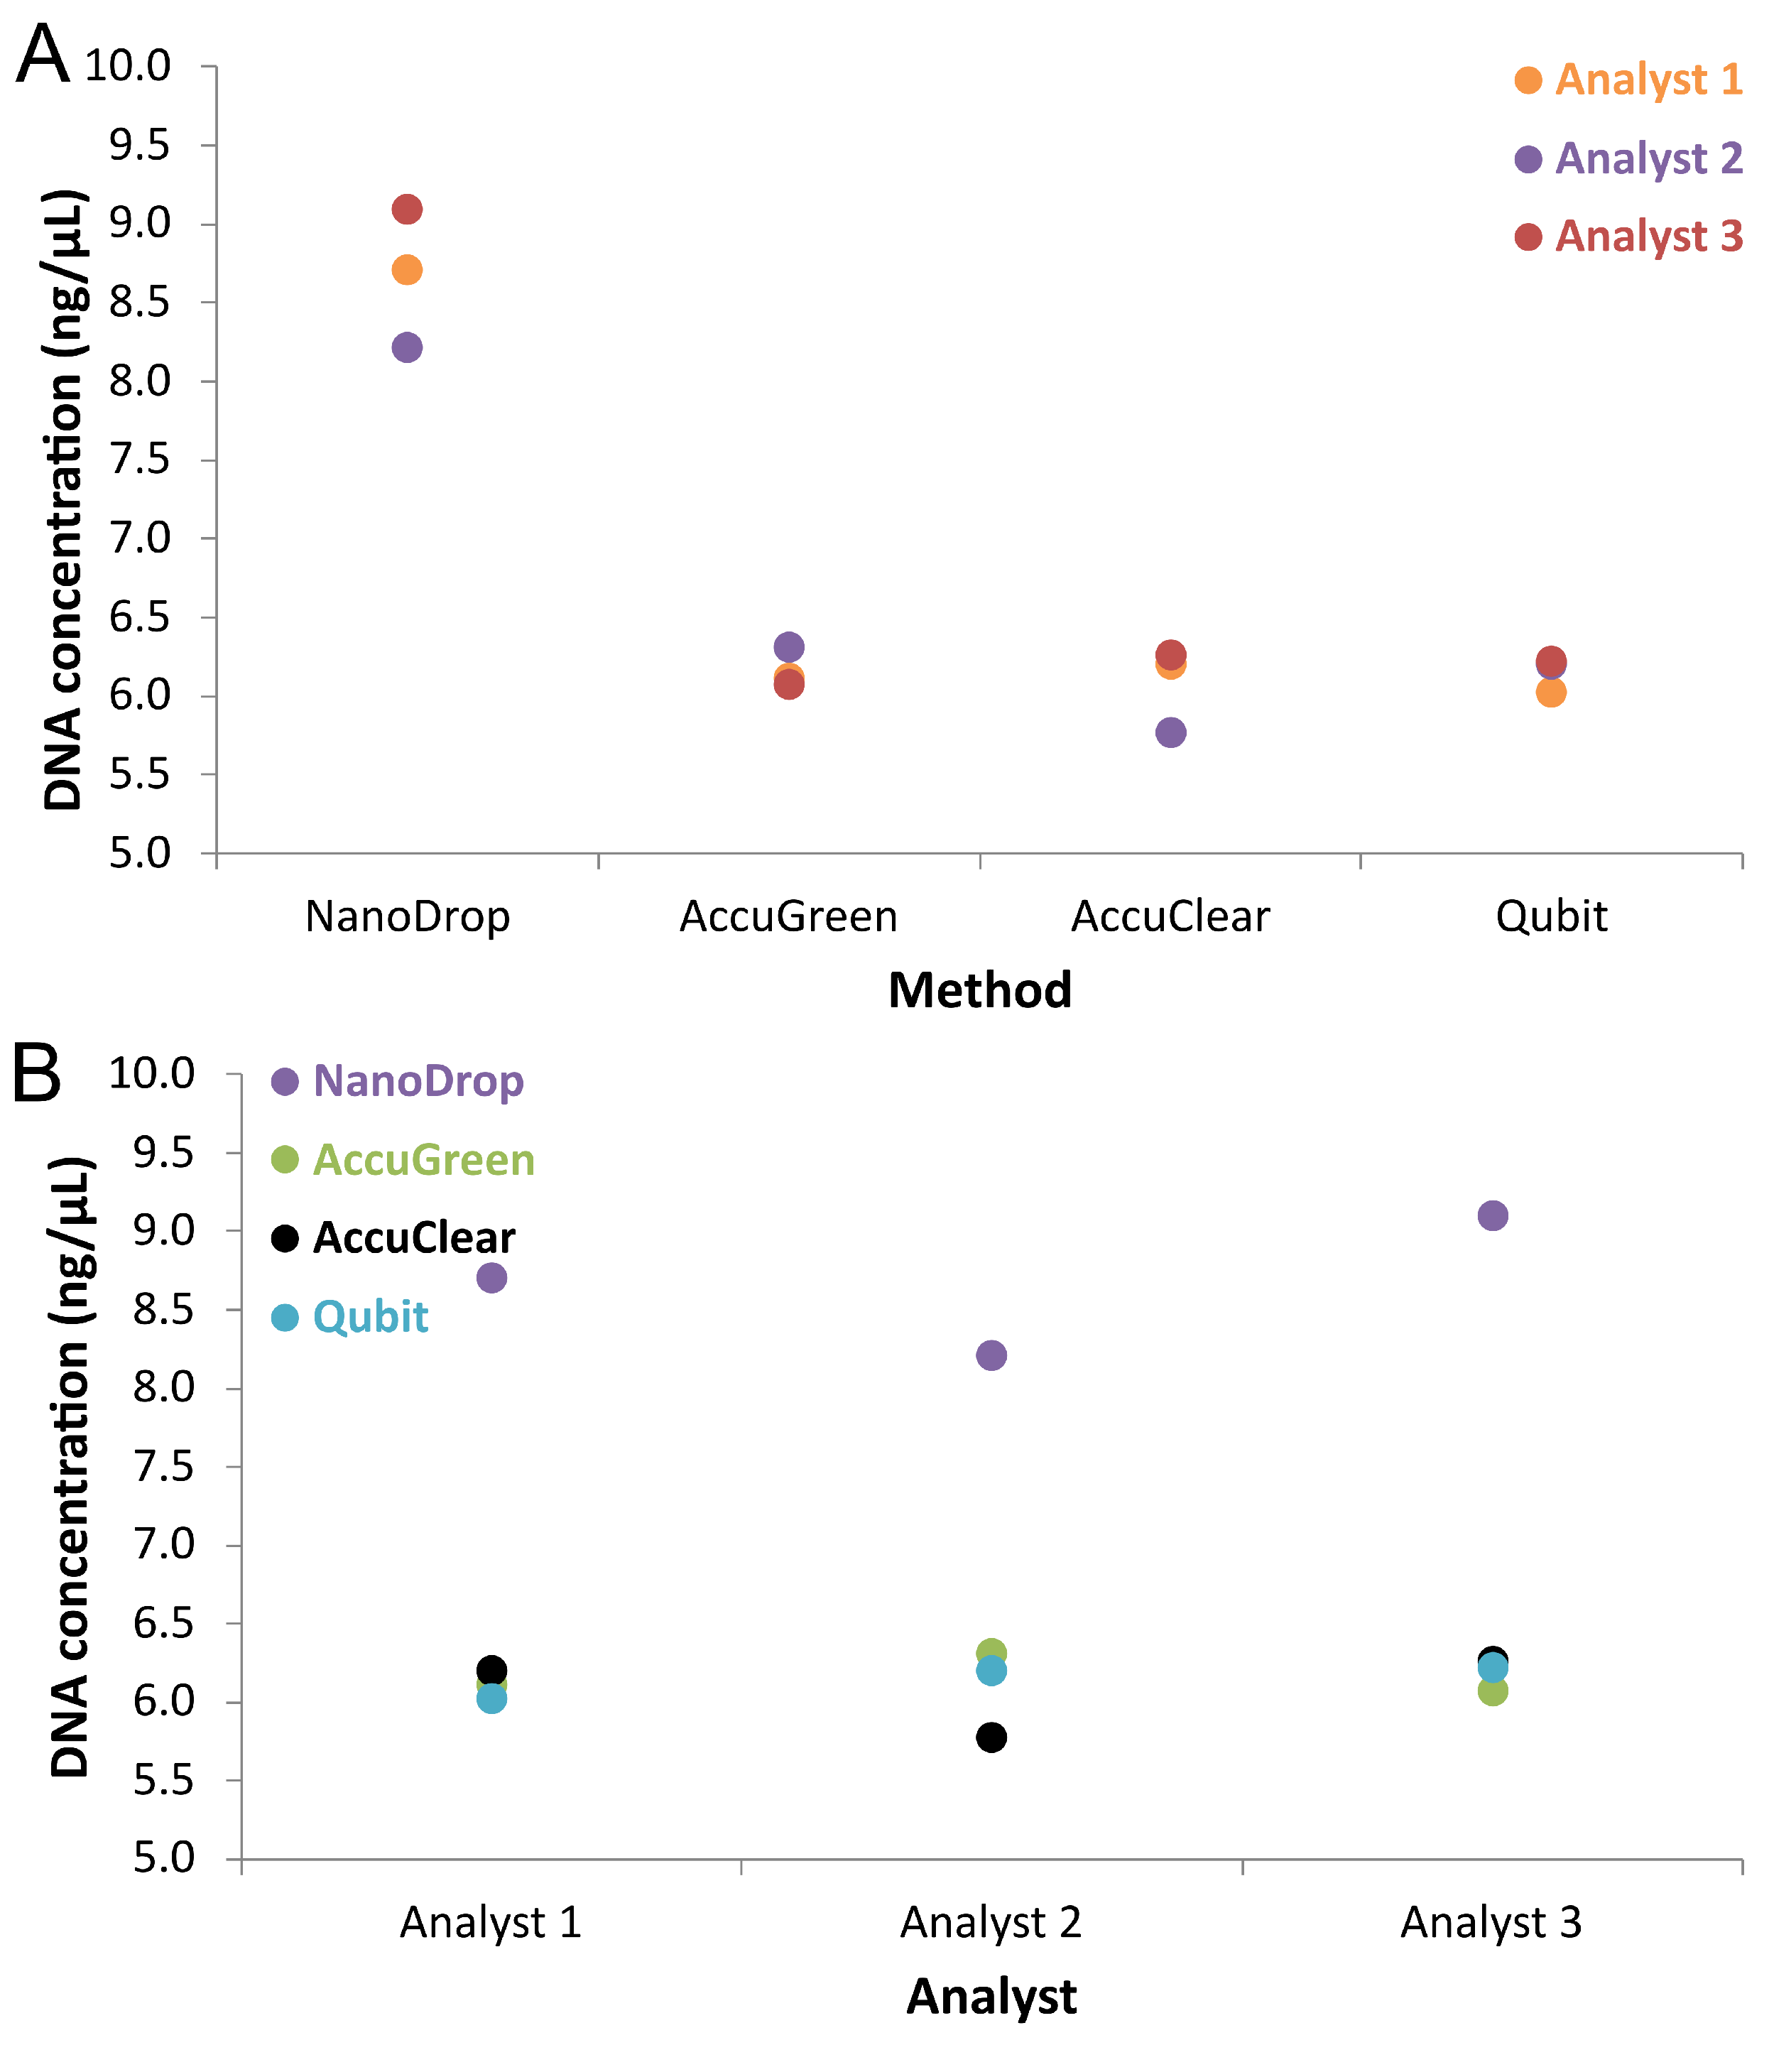
3.1. Spectrophotometric DNA Quantification
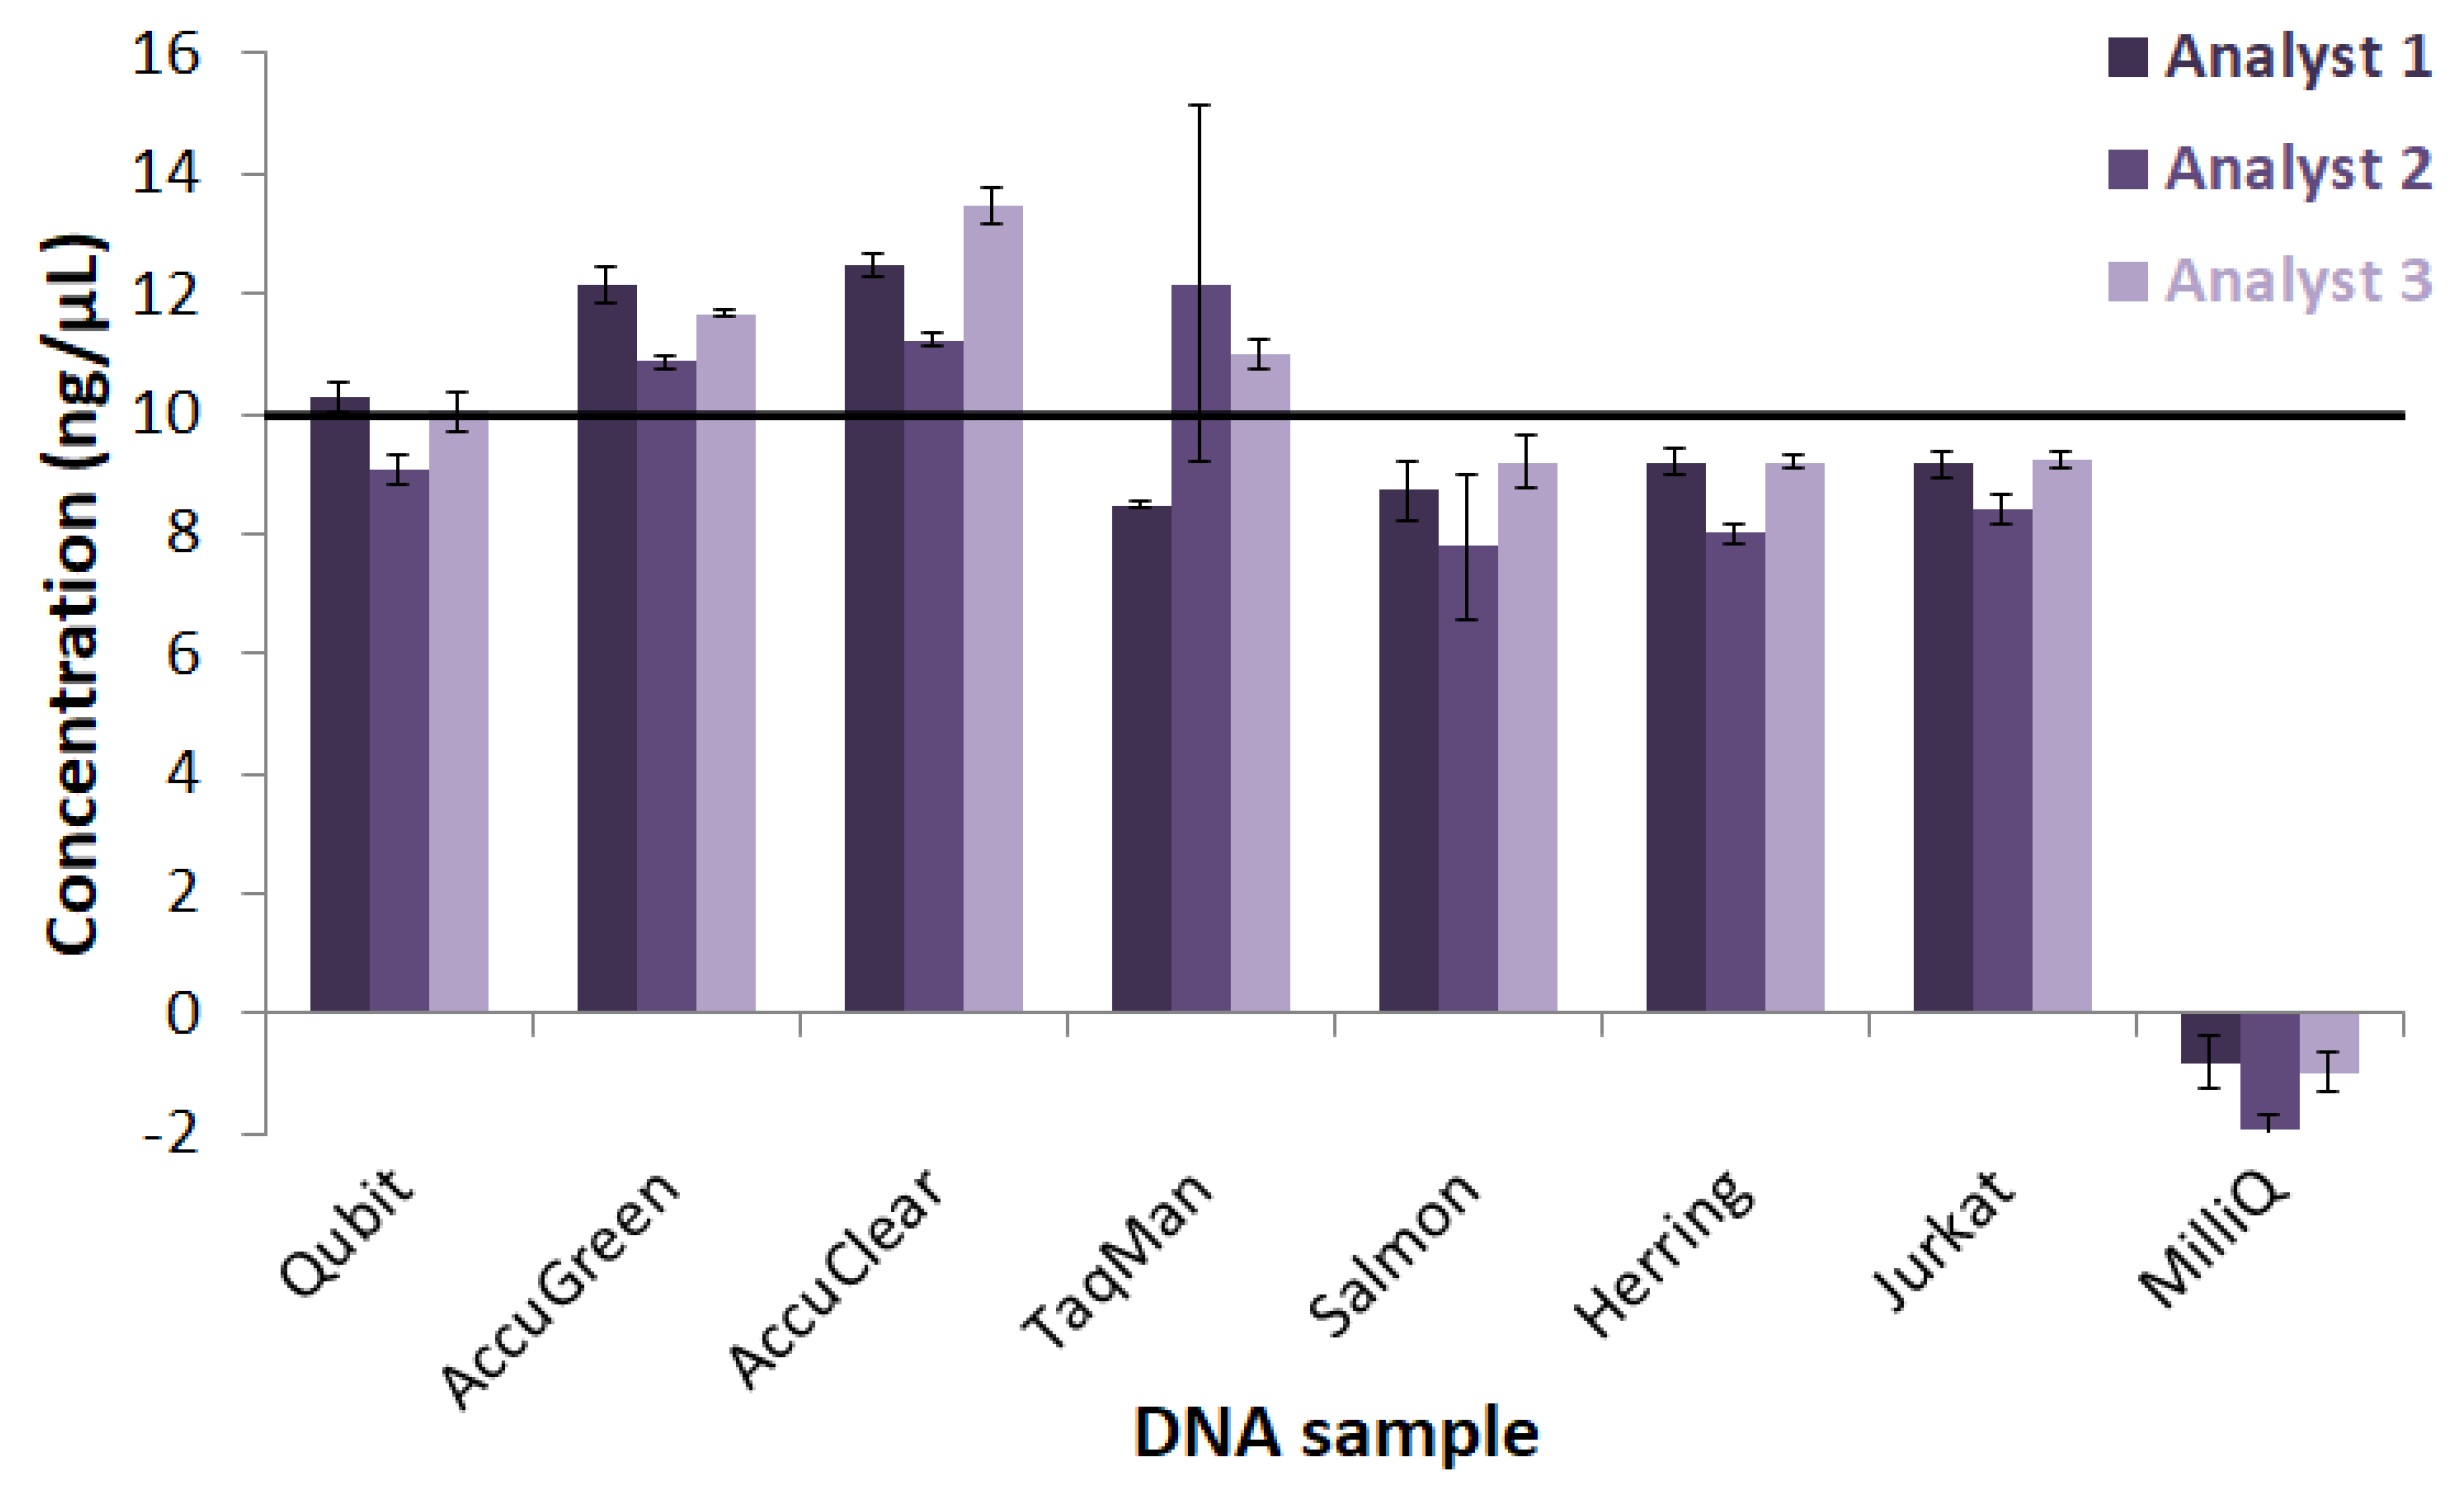
Measurements with the NanoDrop Instrument
3.2. Fluorometric DNA Quantification
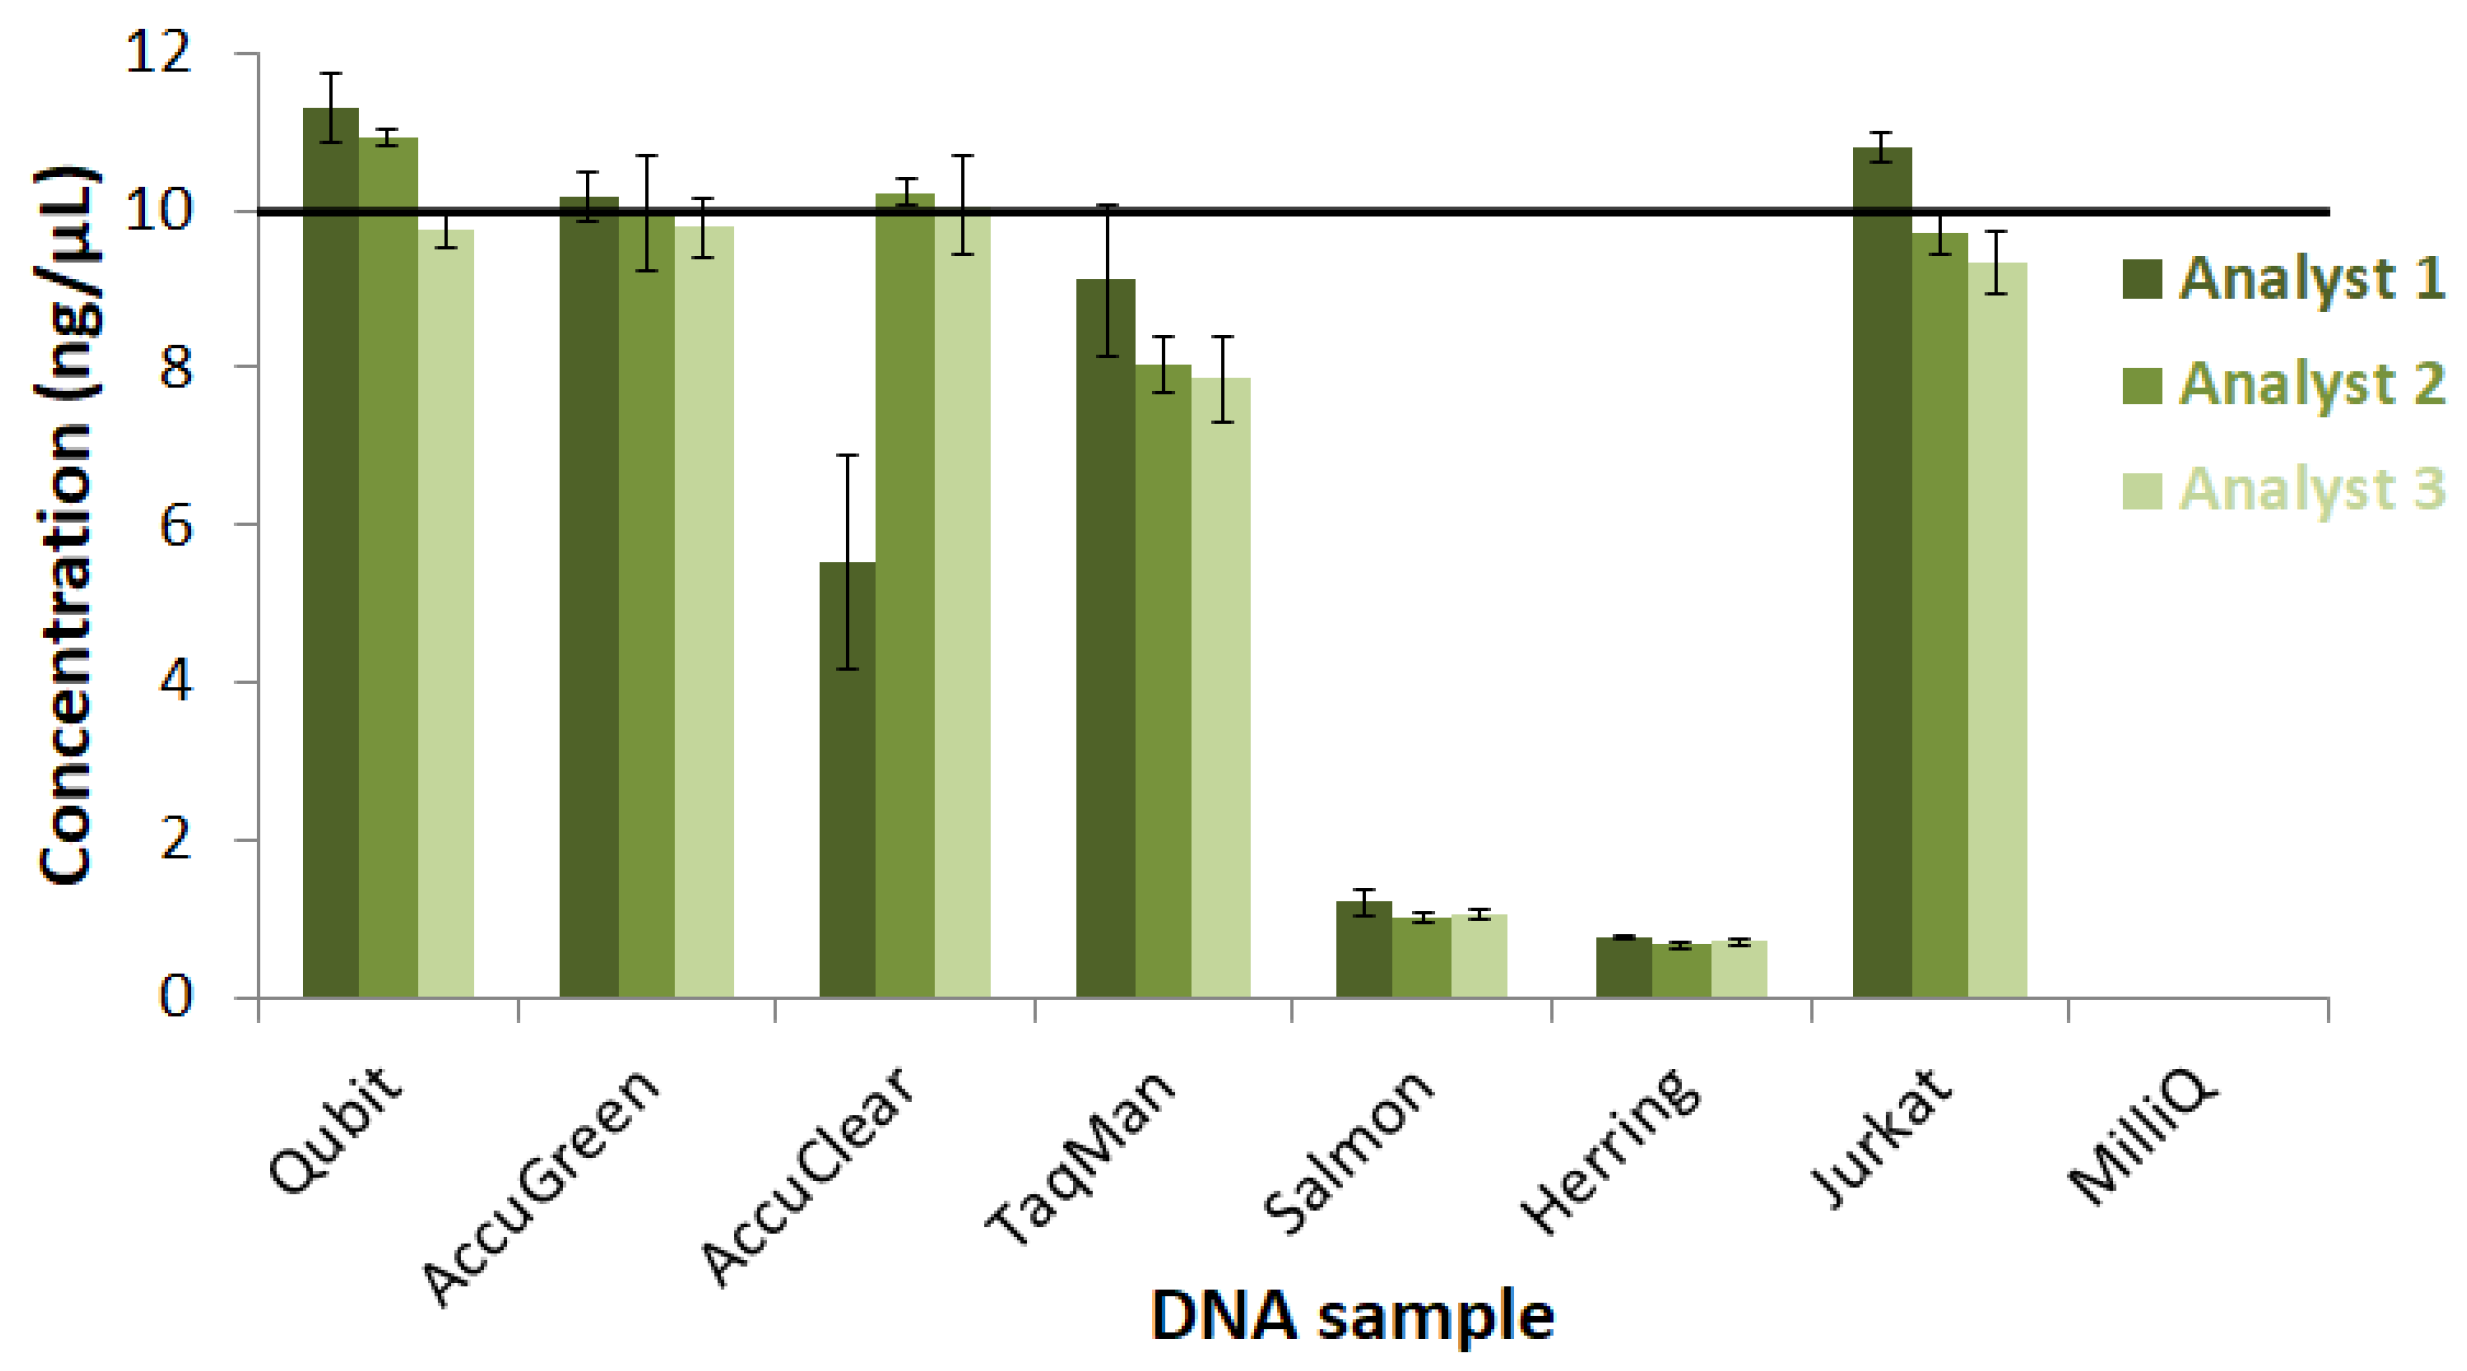
3.2.1. Measurement with the AccuGreen High Sensitivity Kit
3.2.2. Measurement with the AccuClear Ultra High Sensitivity Kit
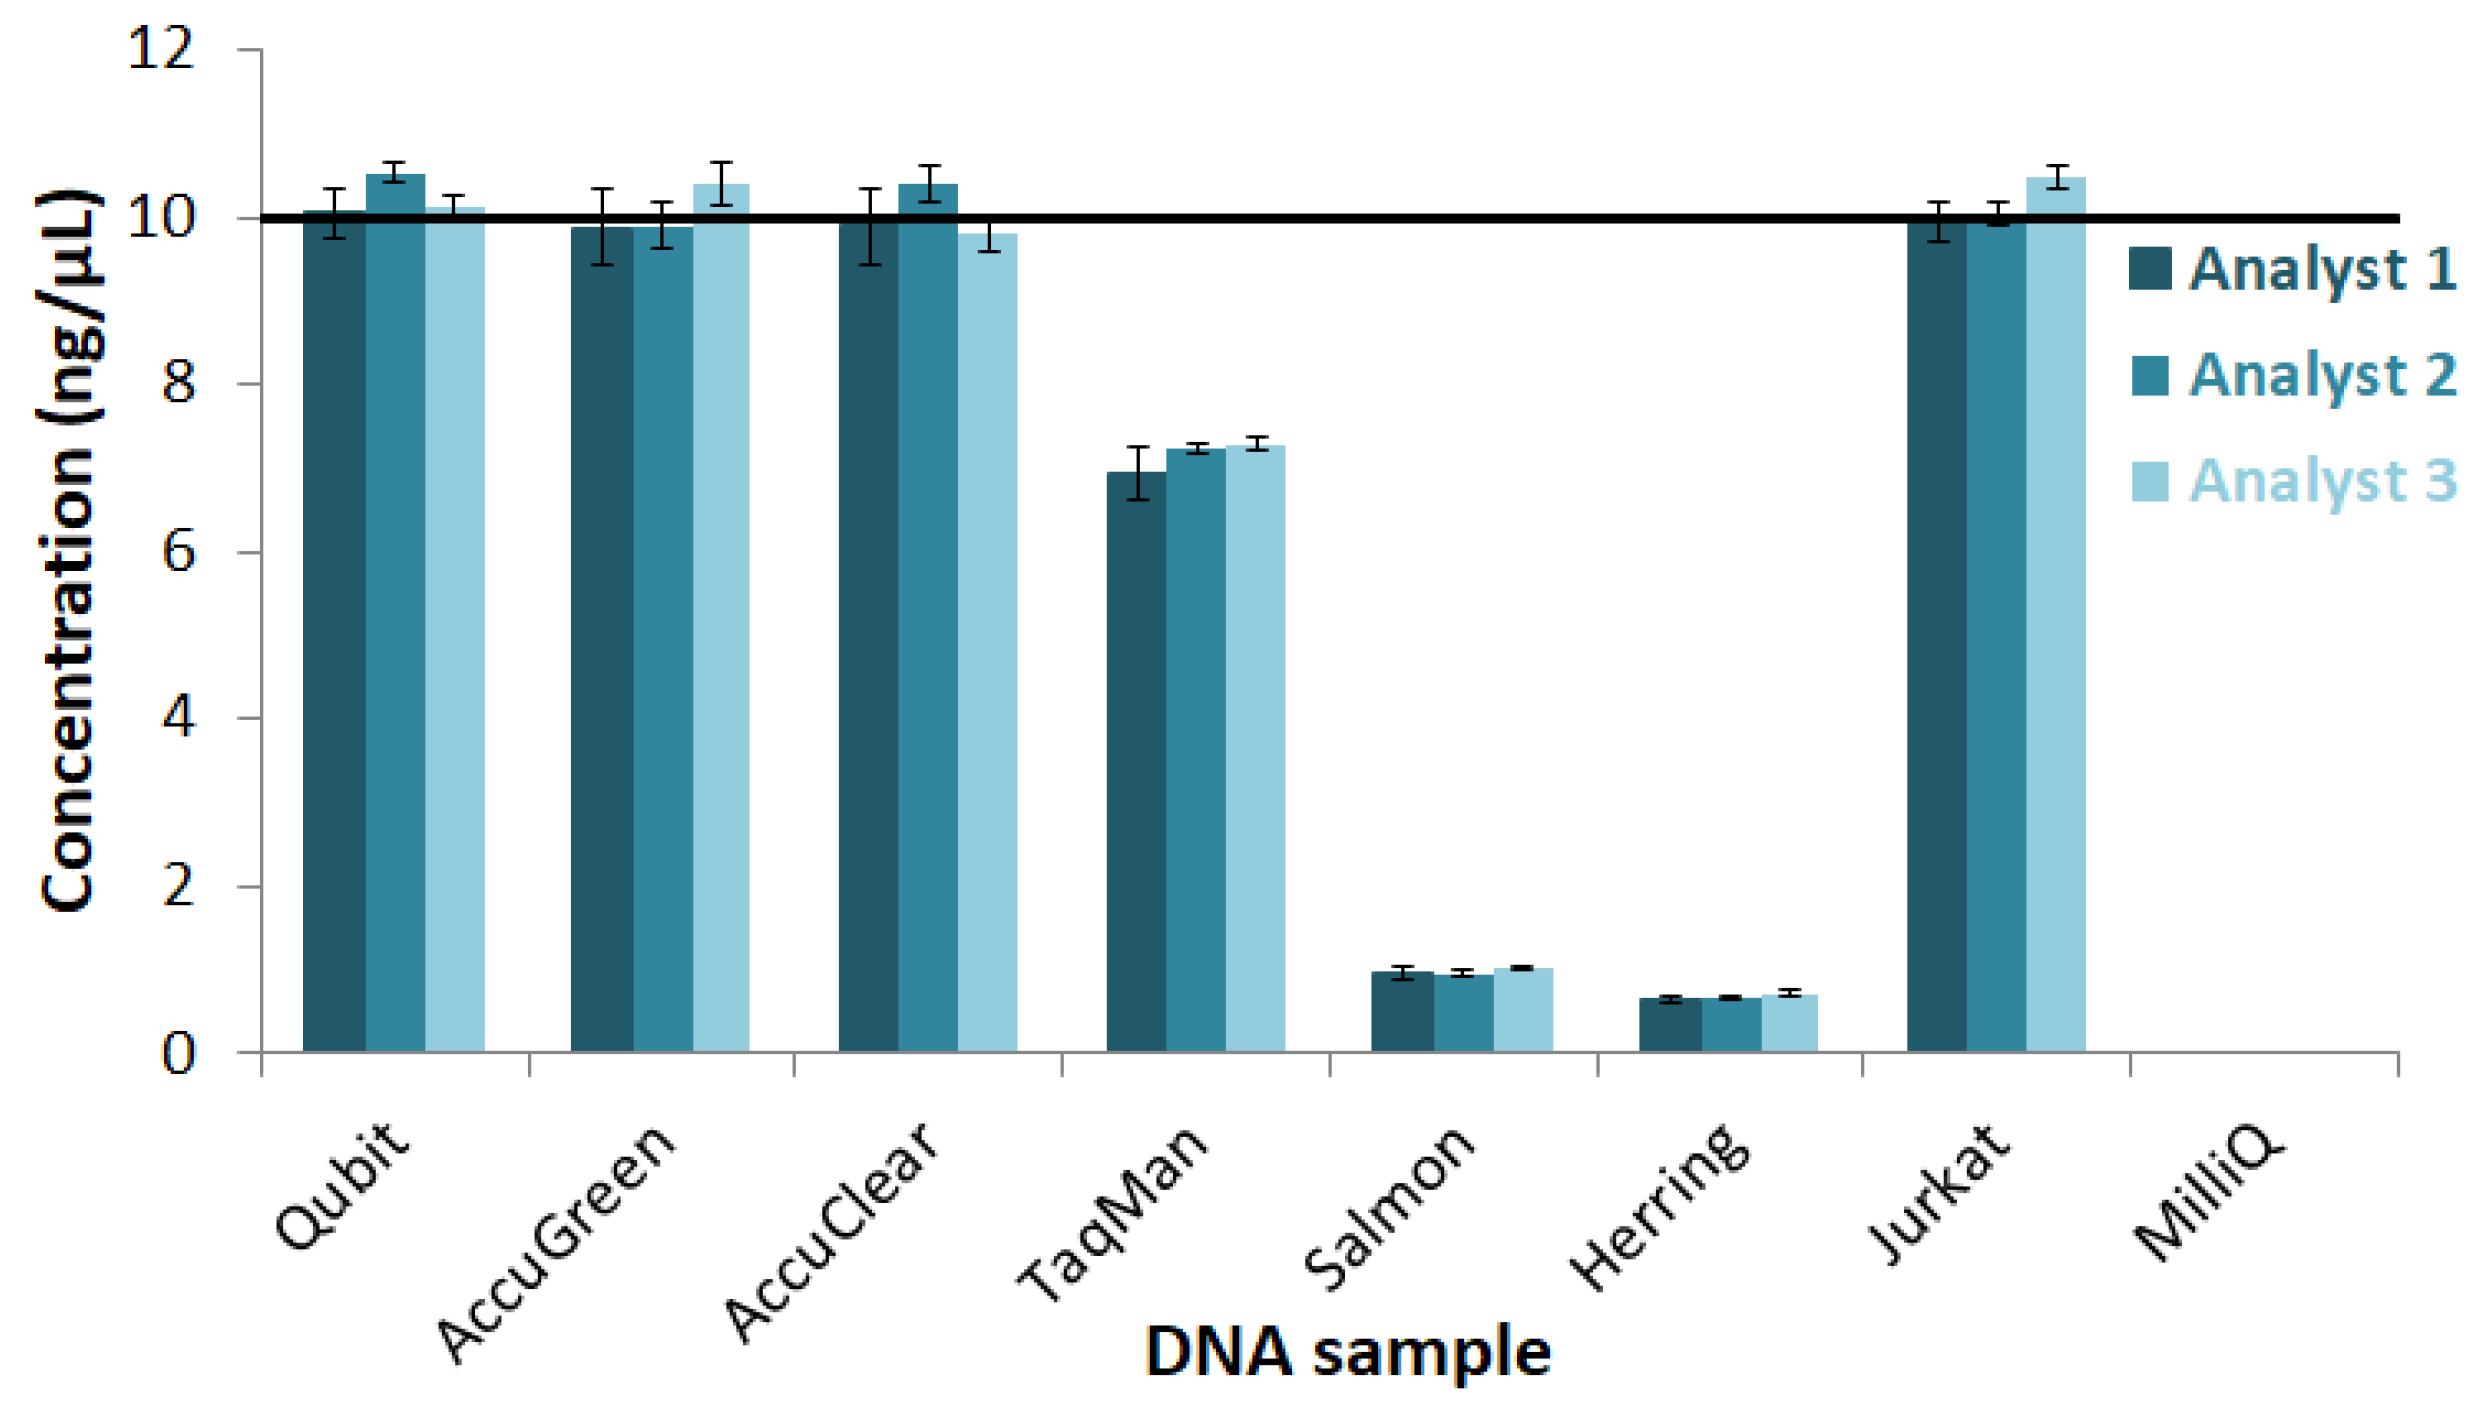
3.2.3. Measurements with the Qubit dsDNA HS Assay Kit
3.2.4. Statistical Analysis
4. Discussion
5. Conclusions
Author Contributions
Funding
Institutional Review Board Statement
Informed Consent Statement
Data Availability Statement
Conflicts of Interest
Abbreviations
| ANOVA | Analysis of variance |
| DNA | Deoxyribonucleic acid |
| dsDNA | Double-stranded DNA |
| PCR | Polymerase chain reaction |
| qPCR | Quantitative PCR |
| RNA | Ribonucleic acid |
| ssDNA | Single-stranded DNA |
| UV | Ultraviolet |
Appendix A. ANOVA Analysis

| DATASET | NanoDrop | |||||
|---|---|---|---|---|---|---|
| 1 | 2 | 3 | ||||
| Qubit | 10.3 | 9.1 | 10.0 | |||
| AccuGreen | 12.1 | 10.9 | 11.7 | |||
| AccuClear | 12.5 | 11.2 | 13.5 | |||
| TaqMan | 8.5 | 12.2 | 11.0 | |||
| Salmon | 8.7 | 7.8 | 9.2 | |||
| Herring | 9.2 | 8.0 | 9.2 | |||
| Jurkat | 9.2 | 8.4 | 9.2 | |||
| MilliQ | −0.8 | −1.9 | −1.0 | |||
| ANOVA: one-way | ||||||
| DESCRIPTION | ||||||
| Groups | Count | Sum | Mean | Variance | ||
| 1 | 8 | 69.7 | 8.7125 | 17.04982143 | ||
| 2 | 8 | 65.7 | 8.2125 | 19.33553571 | ||
| 3 | 8 | 72.8 | 9.1 | 18.94 | ||
| ANOVA | ||||||
| Sources | SS | df | MS | F | p value | F crit |
| Between groups | 3.1675 | 2 | 1.58375 | 0.085878343 | 0.918026473 | 3.466800112 |
| Within groups | 387.2775 | 21 | 18.44178571 | |||
| Total | 390.445 | 23 | ||||
| F < F crit: No significant difference. | ||||||
| DATASET | AccuGreen | |||||
|---|---|---|---|---|---|---|
| 1 | 2 | 3 | ||||
| Qubit | 11.3 | 10.9 | 9.8 | |||
| AccuGreen | 10.2 | 10.0 | 9.8 | |||
| AccuClear | 5.5 | 10.2 | 10.1 | |||
| TaqMan | 9.1 | 8.0 | 7.9 | |||
| Salmon | 1.2 | 1.0 | 1.0 | |||
| Herring | 0.8 | 0.7 | 0.7 | |||
| Jurkat | 10.8 | 9.7 | 9.3 | |||
| MilliQ | 0.0 | 0.0 | 0.0 | |||
| ANOVA: one-way | ||||||
| DESCRIPTION | ||||||
| Groups | Count | Sum | Mean | Variance | ||
| 1 | 8 | 48.9 | 6.1125 | 23.51553571 | ||
| 2 | 8 | 50.5 | 6.3125 | 23.37839286 | ||
| 3 | 8 | 48.6 | 6.075 | 21.31928571 | ||
| ANOVA | ||||||
| Sources | SS | df | MS | F | p value | F crit |
| Between groups | 0.260833 | 2 | 0.130416667 | 0.005735692 | 0.994282283 | 3.466800112 |
| Within groups | 477.4925 | 21 | 22.7377381 | |||
| Total | 477.7533 | 23 | ||||
| F < F crit: No significant difference. | ||||||
| DATASET | AccuClear | |||||
|---|---|---|---|---|---|---|
| 1 | 2 | 3 | ||||
| Qubit | 9.8 | 9.6 | 10.4 | |||
| AccuGreen | 10.4 | 7.9 | 10.6 | |||
| AccuClear | 10.2 | 8.4 | 10.8 | |||
| TaqMan | 8.7 | 8.0 | 7.0 | |||
| Salmon | 0.5 | 1.0 | 0.6 | |||
| Herring | 0.6 | 1.0 | 0.6 | |||
| Jurkat | 9.7 | 10.2 | 10.1 | |||
| MilliQ | −0.3 | 0.1 | 0.0 | |||
| ANOVA: one-way | ||||||
| DESCRIPTION | ||||||
| Groups | Count | Sum | Mean | Variance | ||
| 1 | 8 | 49.6 | 6.2 | 24.45714 | ||
| 2 | 8 | 46.2 | 5.775 | 18.33929 | ||
| 3 | 8 | 50.1 | 6.2625 | 25.01982 | ||
| ANOVA | ||||||
| Sources | SS | df | MS | F | p value | F crit |
| Between groups | 1.125833 | 2 | 0.562917 | 0.024902 | 0.975434 | 3.4668 |
| Within groups | 474.7138 | 21 | 22.60542 | |||
| Total | 475.8396 | 23 | ||||
| F < F crit: No significant difference. | ||||||
| DATASET | Qubit | |||||
|---|---|---|---|---|---|---|
| 1 | 2 | 3 | ||||
| Qubit | 10.0 | 10.5 | 10.1 | |||
| AccuGreen | 9.9 | 9.9 | 10.4 | |||
| AccuClear | 9.9 | 10.4 | 9.8 | |||
| TaqMan | 6.9 | 7.2 | 7.3 | |||
| Salmon | 1.0 | 1.0 | 1.0 | |||
| Herring | 0.6 | 0.6 | 0.7 | |||
| Jurkat | 9.9 | 10.0 | 10.5 | |||
| MilliQ | 0.0 | 0.0 | 0.0 | |||
| ANOVA: one-way | ||||||
| DESCRIPTION | ||||||
| Groups | Count | Sum | Mean | Variance | ||
| 1 | 8 | 48.2 | 6.025 | 21.79928571 | ||
| 2 | 8 | 49.6 | 6.2 | 23.15714286 | ||
| 3 | 8 | 49.8 | 6.225 | 23.03357143 | ||
| ANOVA | ||||||
| Sources | SS | df | MS | F | p value | F crit |
| Between groups | 0.19 | 2 | 0.095 | 0.004191793 | 0.995817813 | 3.466800112 |
| Within groups | 475.93 | 21 | 22.66333333 | |||
| Total | 476.12 | 23 | ||||
| F < F crit: No significant difference. | ||||||
| NanoDrop | AccuGreen | AccuClear | Qubit | ||||||||||||
|---|---|---|---|---|---|---|---|---|---|---|---|---|---|---|---|
| 1 | 2 | 3 | 1 | 2 | 3 | 1 | 2 | 3 | 1 | 2 | 3 | Sample | |||
| Qubit | 10.3 | 9.1 | 10.0 | 11.3 | 10.9 | 9.8 | 9.8 | 9.6 | 10.4 | 10.0 | 10.5 | 10.1 | 10.15 | ||
| AccuGreen | 12.1 | 10.9 | 11.7 | 10.2 | 10.0 | 9.8 | 10.4 | 7.9 | 10.6 | 9.9 | 9.9 | 10.4 | 10.31666667 | ||
| AccuClear | 12.5 | 11.2 | 13.5 | 5.5 | 10.2 | 10.1 | 10.2 | 8.4 | 10.8 | 9.9 | 10.4 | 9.8 | 10.20833333 | ||
| TaqMan | 8.5 | 12.2 | 11.0 | 9.1 | 8.0 | 7.9 | 8.7 | 8.0 | 7.0 | 6.9 | 7.2 | 7.3 | 8.483333333 | ||
| Salmon | 8.7 | 7.8 | 9.2 | 1.2 | 1.0 | 1.0 | 0.5 | 1.0 | 0.6 | 1.0 | 1.0 | 1.0 | 2.833333333 | ||
| Herring | 9.2 | 8.0 | 9.2 | 0.8 | 0.7 | 0.7 | 0.6 | 1.0 | 0.6 | 0.6 | 0.6 | 0.7 | 2.725 | ||
| Jurkat | 9.2 | 8.4 | 9.2 | 10.8 | 9.7 | 9.3 | 9.7 | 10.2 | 10.1 | 9.9 | 10.0 | 10.5 | 9.75 | ||
| MilliQ | −0.8 | −1.9 | −1.0 | 0.0 | 0.0 | 0.0 | −0.3 | 0.1 | 0.0 | 0.0 | 0.0 | 0.0 | −0.325 | ||
| 8.7125 | 8.2125 | 9.1 | 6.1125 | 6.3125 | 6.075 | 6.2 | 5.775 | 6.2625 | 6.025 | 6.2 | 6.225 | 6.767708333 | |||
| Method | Analyst | ||||||||||||||
| NanoDrop | AccuGreen | AccuClear | Qubit | 1 | 2 | 3 | |||||||||
| Qubit | 9.8 | 10.7 | 9.9 | 10.2 | 10.4 | 10.0 | 10.1 | ||||||||
| AccuGreen | 11.56666667 | 10.0 | 9.6 | 10.1 | 10.7 | 9.7 | 10.6 | ||||||||
| AccuClear | 12.4 | 8.6 | 9.8 | 10.0 | 9.5 | 10.1 | 11.1 | ||||||||
| TaqMan | 10.56666667 | 8.3 | 7.9 | 7.1 | 8.3 | 8.9 | 8.3 | ||||||||
| Salmon | 8.566666667 | 1.1 | 0.7 | 1.0 | 2.9 | 2.7 | 3.0 | ||||||||
| Herring | 8.8 | 0.7 | 0.7 | 0.6 | 2.8 | 2.6 | 2.8 | ||||||||
| Jurkat | 8.933333333 | 9.9 | 10.0 | 10.1 | 9.9 | 9.6 | 9.8 | ||||||||
| MilliQ | −1.233333333 | 0.0 | −0.1 | 0.0 | −0.3 | −0.5 | −0.3 | ||||||||
| 8.675 | 6.166666667 | 6.079166667 | 6.15 | 6.8 | 6.6 | 6.9 | |||||||||
| WORKING TABLE | |||||||||||||||
| a | b | m | n | ||||||||||||
| 4 | 3 | 8 | 96 | ||||||||||||
| count | SS | df | MS | ||||||||||||
| Total | 1 | 1936.669896 | 95 | 20.3859989 | |||||||||||
| A (Method) | 24 | 116.5119792 | 3 | 38.83732639 | |||||||||||
| B (Analyst) | 32 | 1.352708333 | 2 | 0.676354167 | |||||||||||
| C (Sample) | 12 | 1558.075729 | 7 | 222.582247 | |||||||||||
| AB Bet | 8 | 121.2561458 | 11 | 11.02328598 | |||||||||||
| A × B | 3.391458333 | 6 | 0.565243056 | ||||||||||||
| AC Bet | 3 | 1893.703229 | 31 | 61.08720094 | |||||||||||
| A × C | 219.1155208 | 21 | 10.43407242 | ||||||||||||
| BC Bet | 4 | 1566.972396 | 23 | 68.1292346 | |||||||||||
| B × C | 7.543958333 | 14 | 0.538854167 | ||||||||||||
| A × B × C | 30.67854167 | 42 | 0.730441468 | ||||||||||||
| ANOVA | |||||||||||||||
| SS | df | MS | F | p-value | Fcrit | ||||||||||
| A (Method) | 116.5119792 | 3 | 38.83732639 | 3.722164 | 0.027287 | 3.072467 | |||||||||
| A × C | 219.1155208 | 21 | 10.43407242 | ||||||||||||
| B (Analyst) | 1.352708333 | 2 | 0.676354167 | 1.255171 | 0.315213 | 3.738892 | |||||||||
| B × C | 7.543958333 | 14 | 0.538854167 | ||||||||||||
| A × B | 3.391458333 | 6 | 0.565243056 | 0.773838 | 0.594905 | 2.323994 | |||||||||
| A × B × C | 30.67854167 | 42 | 0.730441468 | ||||||||||||
| C (Sample) | 1558.075729 | 7 | 222.582247 | ||||||||||||
| Method | F > F crit: Significant difference. | ||||||||||||||
| Analyst | F < F crit: No significant difference. | ||||||||||||||
| Method × Analyst | F < F crit: No significant difference. | ||||||||||||||
| COVARIANCE MATRIX | ANALYST × METHOD | |||||||||||||
|---|---|---|---|---|---|---|---|---|---|---|---|---|---|---|
| ND1 | ND2 | ND3 | AG1 | AG2 | AG3 | AC1 | AC2 | AC3 | Q1 | Q2 | Q3 | |||
| 17.05 | 16.74 | 17.52 | 11 | 13.31 | 12.88 | 13.63 | 10.94 | 13.86 | 12.94 | 13.32 | 13.18 | 13.87 | ||
| 16.74 | 19.34 | 18.66 | 13.07 | 14.31 | 13.98 | 15.19 | 12.43 | 14.2 | 13.41 | 13.86 | 13.82 | 14.92 | ||
| 17.52 | 18.66 | 18.94 | 11.35 | 13.86 | 13.55 | 14.48 | 11.65 | 14.12 | 13.22 | 13.68 | 13.48 | 14.54 | ||
| 11 | 13.07 | 11.35 | 23.52 | 21.7 | 20.47 | 22.11 | 19.69 | 21.83 | 20.74 | 21.26 | 21.61 | 19.03 | ||
| 13.31 | 14.31 | 13.86 | 21.7 | 23.38 | 22.28 | 23.77 | 20.33 | 24.04 | 22.48 | 23.21 | 23.06 | 20.48 | ||
| 12.88 | 13.98 | 13.55 | 20.47 | 22.28 | 21.32 | 22.79 | 19.35 | 22.97 | 21.46 | 22.13 | 22.02 | 19.6 | ||
| 13.63 | 15.19 | 14.48 | 22.11 | 23.77 | 22.79 | 24.46 | 20.73 | 24.46 | 22.86 | 23.56 | 23.52 | 20.96 | ||
| 10.94 | 12.43 | 11.65 | 19.69 | 20.33 | 19.35 | 20.73 | 18.34 | 20.74 | 19.54 | 20.16 | 20.15 | 17.84 | ||
| 13.86 | 14.2 | 14.12 | 21.83 | 24.04 | 22.97 | 24.46 | 20.74 | 25.02 | 23.32 | 24.03 | 23.92 | 21.04 | ||
| 12.94 | 13.41 | 13.22 | 20.74 | 22.48 | 21.46 | 22.86 | 19.54 | 23.32 | 21.8 | 22.45 | 22.38 | 19.72 | ||
| 13.32 | 13.86 | 13.68 | 21.26 | 23.21 | 22.13 | 23.56 | 20.16 | 24.03 | 22.45 | 23.16 | 23.02 | 20.32 | ||
| 13.18 | 13.82 | 13.48 | 21.61 | 23.06 | 22.02 | 23.52 | 20.15 | 23.92 | 22.38 | 23.02 | 23.03 | 20.27 | ||
| 13.87 | 14.92 | 14.54 | 19.03 | 20.48 | 19.6 | 20.96 | 17.84 | 21.04 | 19.72 | 20.32 | 20.27 | 18.55 | ||
| 7.867 | 6.503 | 7.663 | −3.34 | −2.48 | −2.03 | −2.65 | −2.21 | −2.5 | −2.1 | −2.32 | −2.4 | |||
| 6.503 | 8.048 | 7.744 | −2.33 | −2.54 | −1.98 | −2.14 | −1.78 | −3.21 | −2.67 | −2.83 | −2.82 | |||
| 7.663 | 7.744 | 8.401 | −3.67 | −2.61 | −2.05 | −2.48 | −2.18 | −2.91 | −2.49 | −2.63 | −2.78 | |||
| −3.34 | −2.33 | −3.67 | 4.005 | 0.743 | 0.386 | 0.663 | 1.37 | 0.302 | 0.544 | 0.462 | 0.867 | |||
| −2.48 | −2.54 | −2.61 | 0.743 | 0.973 | 0.75 | 0.876 | 0.565 | 1.065 | 0.835 | 0.958 | 0.866 | |||
| −2.03 | −1.98 | −2.05 | 0.386 | 0.75 | 0.668 | 0.774 | 0.458 | 0.873 | 0.687 | 0.762 | 0.704 | |||
| −2.65 | −2.14 | −2.48 | 0.663 | 0.876 | 0.774 | 1.08 | 0.475 | 1.005 | 0.728 | 0.825 | 0.837 | #A | 4 | |
| −2.21 | −1.78 | −2.18 | 1.37 | 0.565 | 0.458 | 0.475 | 1.212 | 0.41 | 0.535 | 0.551 | 0.594 | #B | 3 | |
| −2.5 | −3.21 | −2.91 | 0.302 | 1.065 | 0.873 | 1.005 | 0.41 | 1.483 | 1.111 | 1.214 | 1.157 | GG numerator | 1351 | |
| −2.1 | −2.67 | −2.49 | 0.544 | 0.835 | 0.687 | 0.728 | 0.535 | 1.111 | 0.913 | 0.963 | 0.947 | GG denominator | 5674 | |
| −2.32 | −2.83 | −2.63 | 0.462 | 0.958 | 0.762 | 0.825 | 0.551 | 1.214 | 0.963 | 1.064 | 0.983 | GG epsilon | 0.238 | |
| −2.4 | −2.82 | −2.78 | 0.867 | 0.866 | 0.704 | 0.837 | 0.594 | 1.157 | 0.947 | 0.983 | 1.05 | |||
| 30.45 | 4.017 | 1.476 | 0.613 | 0.137 | 0.047 | 0.026 | ||||||||
| NanoDrop | AccuGreen | AccuClear | Qubit | Analyst 1 | Analyst 2 | Analyst 3 | ||||||||
| NanoDrop | 17.90722222 | 13.04 | 13.39 | 13.43 | Analyst 1 | 18.33678571 | 18.2 | 18.65 | ||||||
| AccuGreen | 13.0368254 | 21.9 | 21.87 | 22 | Analyst 2 | 18.19821429 | 18.3 | 18.67 | ||||||
| AccuClear | 13.39146825 | 21.87 | 22.19 | 22.34 | Analyst 3 | 18.64674107 | 18.67 | 19.28 | ||||||
| Qubit | 13.43444444 | 22 | 22.34 | 22.63 | 18.39391369 | 18.39 | 18.86 | means | ||||||
| 14.44249008 | 19.7 | 19.95 | 20.1 | means | 18.33678571 | 18.3 | 19.28 | variance | ||||||
| 17.90722222 | 21.9 | 22.19 | 22.63 | variance | ||||||||||
| EPSILON | METHODS | EPSILON | ANALYST | |||||||||||
| # Groups | 4 | # Groups | 3 | |||||||||||
| Means of var | 21.15703869 | Means of var | 18.63832961 | |||||||||||
| Matrix mean | 18.54852 | Matrix mean | 18.54852 | |||||||||||
| SS matrix | 5787.246376 | SS matrix | 3097.357059 | |||||||||||
| SS row means | 1398.750839 | SS row means | 1032.291337 | |||||||||||
| GG numerator | 108.8698673 | GG numerator | 0.072590953 | |||||||||||
| GG denominator | 306.0045449 | GG denominator | 0.075163632 | |||||||||||
| GG epsilon | 0.355778596 | GG epsilon | 0.965772291 | |||||||||||
| # Subjects | 8 | # Subjects | 8 | |||||||||||
| # Groups | 4 | # Groups | 3 | |||||||||||
| GG epsilon | 0.355778596 | GG epsilon | 0.965772291 | |||||||||||
| HF numerator | 6.538686298 | HF numerator | 13.45235666 | |||||||||||
| HF denominator | 17.79799264 | HF denominator | 10.13691083 | |||||||||||
| HF epsilon | 0.367383358 | HF epsilon | 1 | |||||||||||
| Lower bound | 0.333333333 | Lower bound | 0.5 | |||||||||||
| ANOVA | |||||||
|---|---|---|---|---|---|---|---|
| Sources of Variation | SS | df | MS | F | p-value | F | |
| A (Method) | Sphericity | 116.5 | 3 | 38.83732639 | 3.722163775 | 0.027287316 | 3.072466986 |
| GG | 116.5 | 1.067 | 109.1615034 | 3.722163775 | 0.095021447 | 5.591447851 | |
| HF | 116.5 | 1.102 | 105.7133524 | 3.722163775 | 0.095021447 | 5.591447851 | |
| Lower Bound | 116.5 | 1 | 116.5119792 | 3.722163775 | 0.095021447 | 5.591447851 | |
| A × C (Error) | Sphericity | 219.1 | 21 | 10.43407242 | |||
| GG | 219.1 | 7.471 | 29.32743157 | ||||
| HF | 219.1 | 7.715 | 28.40104811 | ||||
| Lower Bound | 219.1 | 7 | 31.30221726 | ||||
| B (Analyst) | Sphericity | 1.353 | 2 | 0.676354167 | 1.255171081 | 0.315212719 | 3.738891832 |
| GG | 1.353 | 1.932 | 0.700324676 | 1.255171081 | 0.282838366 | 4.667192732 | |
| HF | 1.353 | 2 | 0.676354167 | 1.255171081 | 0.315212719 | 3.738891832 | |
| Lower Bound | 1.353 | 1 | 1.352708333 | 1.255171081 | 0.299527953 | 5.591447851 | |
| B × C (Error) | Sphericity | 7.544 | 14 | 0.538854167 | |||
| GG | 7.544 | 13.52 | 0.55795157 | ||||
| HF | 7.544 | 14 | 0.538854167 | ||||
| Lower Bound | 7.544 | 7 | 1.077708333 | ||||
| A × B | Sphericity | 3.391 | 6 | 0.565243056 | 0.773837576 | 0.594904763 | 2.323993797 |
| Lower Bound | 3.391 | 1 | 3.391458333 | 0.773837576 | 0.408214928 | 5.591447851 | |
| A × B × C (Error) | Sphericity | 30.68 | 42 | 0.730441468 | |||
| Lower Bound | 30.68 | 7 | 4.38264881 | ||||
| C (Sample) | 1558 | 7 | 222.582247 | ||||
| Total | 1937 | 95 | 20.3859989 | ||||
References
- Nicklas, J.; Buel, E. Quantification of DNA in forensic samples. Anal. Bioanal. Chem. 2003, 376, 1160–1167. [Google Scholar] [CrossRef] [PubMed]
- Nielsen, K.; Smidt Mogensen, H.; Hedman, J.; Niederstätter, H.; Parson, W.; Morling, N. Comparison of five DNA quantification methods. Forensic Sci. Int. Genet. 2008, 2, 226–230. [Google Scholar] [CrossRef] [PubMed]
- Li, Z.; Zhang, P.; Yang, B.; Liu, J.; Xi, H.; Zhang, D.; Yamaguchi, Y. High throughput DNA concentration determination system based on fluorescence technology. Sens. Actuators B Chem. 2021, 328, 128904. [Google Scholar] [CrossRef]
- O’Neill, M.; McPartlin, J.; Arthure, K.; Riedel, S.; McMillan, N. Comparison of the TLDA with the Nanodrop and the reference Qubit system. J. Phys. Conf. Ser. 2011, 307, 012047. [Google Scholar] [CrossRef]
- Thermo Fisher Scientific. NanoDrop 2000c UV-Vis Spectrophotometer. Available online: http://www.nanodrop.com/Productnd2000coverview.aspx (accessed on 16 November 2020).
- Thermo Fisher Scientific. Qubit Fluorometric Quantitation. Available online: http://www.thermofisher.com/nl/en/home/industrial/spectroscopy-elemental-isotope-analysis/molecular-spectroscopy/fluorometers/qubit.html# (accessed on 16 November 2020).
- Biotium. AccuGreen High Sensitivity dsDNA Quantitation Kit. Available online: http://biotium.com/product/accugreen-high-sensitivity-dsdna-quantitation-kit/ (accessed on 6 November 2020).
- Biotium. AccuClear Ultra High Sensitivity dsDNA Quantitation Kit with 7 DNA Standards. Available online: http://biotium.com/product/accuclear-ultra-high-sensitivity-dsdna-quantitation-kit-with-7-dna-standards/ (accessed on 6 November 2020).
- Haque, K.; Pfeiffer, R.; Beerman, M.; Struewing, J.; Chanock, S.; Bergen, A. Performance of high-throughput DNA quantification methods. BMC Biotechnol. 2003, 3, 20. [Google Scholar] [CrossRef] [PubMed]
- Simbolo, M.; Gottardi, M.; Corbo, V.; Fassan, M.; Mafficini, A.; Malpeli, G.; Lawlor, R.; Scarpa, A. DNA qualification workflow for next generation sequencing of histopathological samples. PLoS ONE 2013, 8, e62692. [Google Scholar] [CrossRef] [PubMed]
- Nakayama, Y.; Yamaguchi, H.; Einaga, N.; Esumi, M. Pitfalls of DNA quantification using DNA-binding fluorescent dyes and suggested solutions. PLoS ONE 2016, 11, e0150528. [Google Scholar]
- He, H.J.; Stein, E.; DeRose, P.; Cole, K. Limitations of methods for measuring the concentration of human genomic DNA and oligonucleotide samples. Biotechniques 2018, 64, 59–68. [Google Scholar] [CrossRef] [PubMed]
- Sedlackova, T.; Repiska, G.; Celec, P.; Szemes, T.; Minarik, G. Fragmentation of DNA affects the accuracy of the DNA quantitation by the commonly used methods. Biol. Proced. Online 2013, 15, 5. [Google Scholar] [CrossRef] [PubMed]
- Hussing, C.; Kampmann, M.L.; Mogensen, H.S.; Børsting, C.; Morling, N. Quantification of massively parallel sequencing libraries—A comparative study of eight methods. Sci. Rep. 2018, 8, 1110. [Google Scholar] [CrossRef] [PubMed]
- Li, X.; Wu, Y.; Zhang, L.; Cao, Y.; Li, Y.; Li, J.; Zhu, L.; Wu, G. Comparison of three common DNA concentration measurement methods. Anal. Biochem. 2014, 451, 18–24. [Google Scholar] [CrossRef] [PubMed]
- Masago, K.; Fujita, S.; Oya, Y.; Takahashi, Y.; Matsushita, H.; Sasaki, E.; Kuroda, H. Comparison between Fluorimetry (Qubit) and Spectrophotometry (NanoDrop) in the Quantification of DNA and RNA Extracted from Frozen and FFPE Tissues from Lung Cancer Patients: A Real-World Use of Genomic Tests. Medicina 2021, 57, 1375. [Google Scholar] [CrossRef] [PubMed]
- Ponti, G.; Maccaferri, M.; Manfredini, M.; Kaleci, S.; Mandrioli, M.; Pellacani, G.; Ozben, T.; Depenni, R.; Bianchi, G.; Pirola, G.M.; et al. The value of fluorimetry (Qubit) and spectrophotometry (NanoDrop) in the quantification of cell-free DNA (cfDNA) in malignant melanoma and prostate cancer patients. Clin. Chim. Acta 2018, 479, 14–19. [Google Scholar] [CrossRef] [PubMed]
- Khetan, D.; Gupta, N.; Chaudhary, R.; Shukla, J.S. Comparison of UV spectrometry and fluorometry-based methods for quantification of cell-free DNA in red cell components. Asian J. Transfus. Sci. 2019, 13, 95. [Google Scholar] [CrossRef] [PubMed]
- Zaiontz, C. Real Statistics Using Excel. Available online: http://www.realstatistics.com (accessed on 5 July 2020).
- Carvalho, J.; Negrinho, R.; Azinheiro, S.; Garrido-Maestu, A.; Barros-Velázquez, J.; Prado, M. Novel approach for accurate minute DNA quantification on microvolumetric solutions. Microchem. J. 2018, 138, 540–549. [Google Scholar] [CrossRef]
- O’Brien, R.; Kaiser, M. MANOVA method for analyzing repeated measures designs: An extensive primer. Psychol. Bull. 1985, 97, 316. [Google Scholar] [CrossRef] [PubMed]

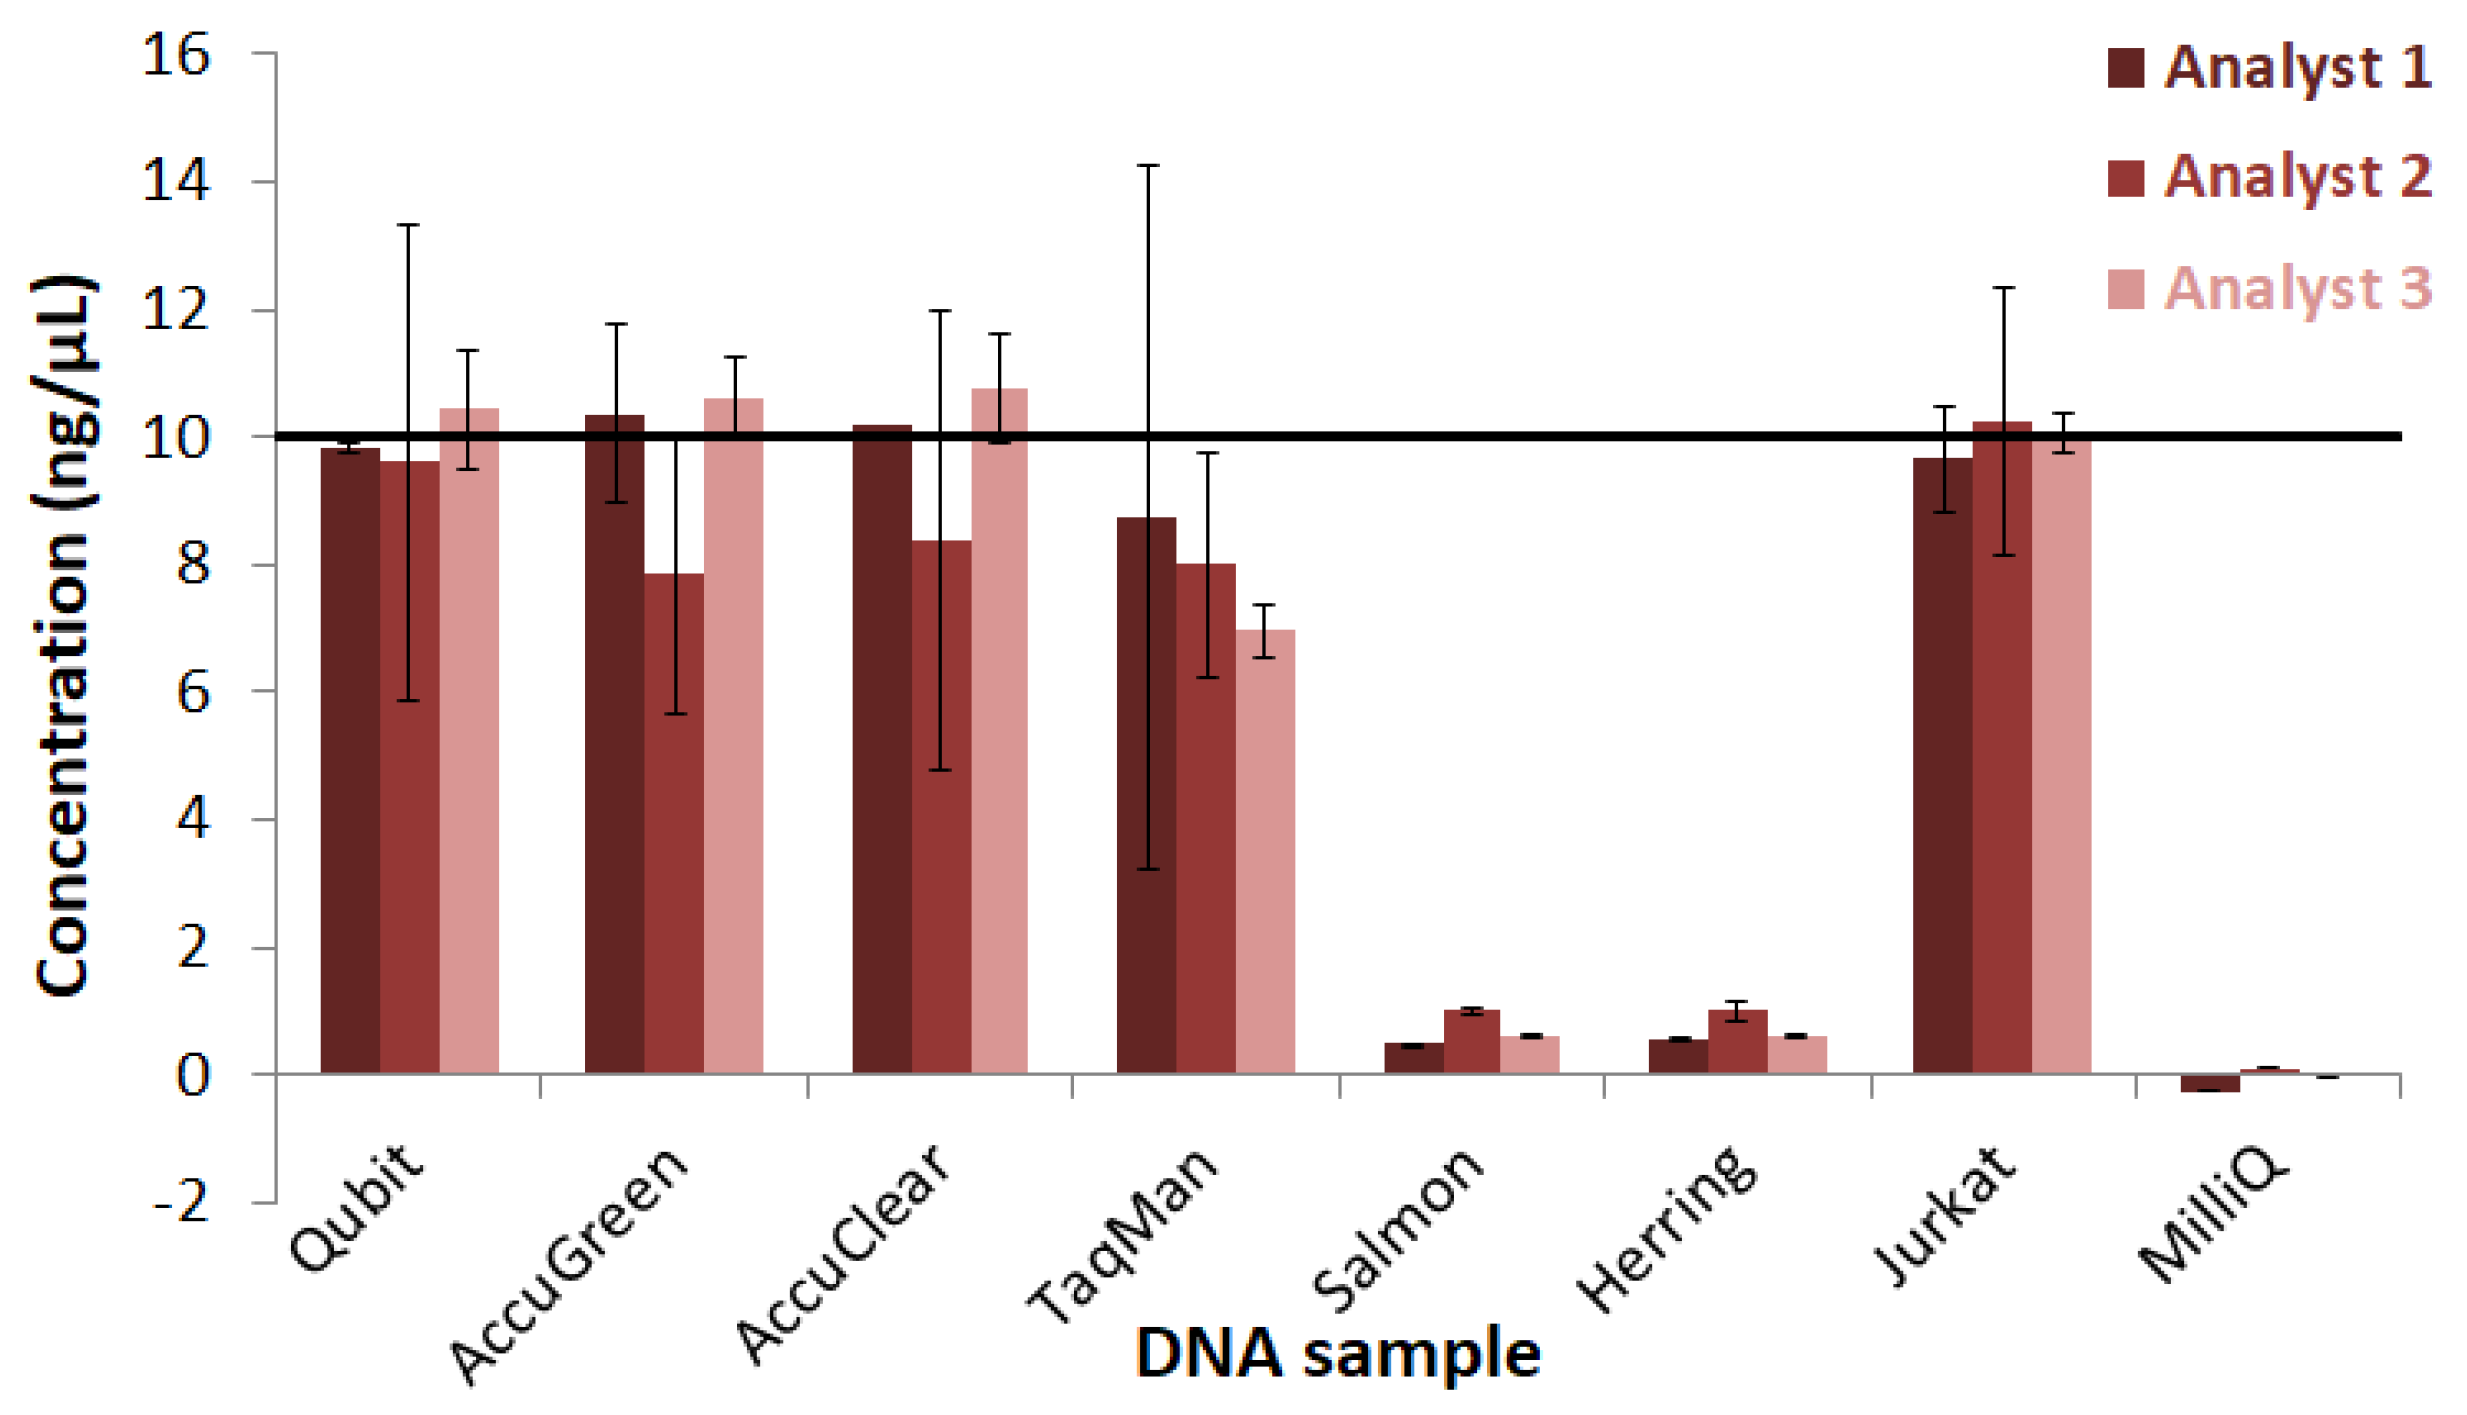


| Spectrophotometric | Fluorometric | |||||||||||
|---|---|---|---|---|---|---|---|---|---|---|---|---|
| Nanodrop | AccuGreen | AccuClear | Qubit | |||||||||
| Sample | 1 | 2 | 3 | 1 | 2 | 3 | 1 | 2 | 3 | 1 | 2 | 3 |
| Qubit (Q) | 10.3 ± 0.3 | 9.1 ± 0.2 | 10.0 ± 0.3 | 11.3 ± 0.4 | 10.9 ± 0.1 | 9.8 ± 0.2 | 9.8 ± 0.1 | 9.6 ± 3.7 | 10.4 ± 1.0 | 10.0 ± 0.3 | 10.5 ± 0.1 | 10.1 ± 0.1 |
| AccuGreen (AG) | 12.1 ± 0.3 | 10.9 ± 0.1 | 11.7 ± 0.1 | 10.2 ± 0.3 a | 10.0 ± 0.7 | 9.8 ± 0.4 | 10.4 ± 0.4 | 7.9 ± 2.2 | 10.6 ± 0.6 | 9.9 ± 0.5 | 9.9 ± 0.3 | 10.4 ± 0.3 |
| AccuClear (AC) | 12.5 ± 0.2 | 11.2 ± 0.1 | 13.5 ± 0.3 | 5.5 ± 1.4 | 10.2 ± 0.2 | 10.1 ± 0.6 | 10.2 b | 8.4 ± 3.6 | 10.8 ± 0.8 | 9.9 ± 0.4 | 10.4 ± 0.2 | 9.8 ± 0.6 |
| TaqMan (TM) | 8.5 ± 0.1 | 12.2 ± 3.0 | 11.0 ± 0.3 | 9.1 ± 0.9 | 8.0 ± 0.3 | 7.9 ± 0.6 | 8.7 ± 5.6 | 8.0 ± 1.8 | 7.0 ± 0.4 | 6.9 ± 0.3 | 7.3 ± 0.3 | 7.2 ± 0.1 |
| Salmon (S) | 8.7 ± 0.5 | 7.8 ± 1.2 | 9.2 ± 0.5 | 1.2 ± 0.2 | 1.0 ± 0.1 | 1.0 ± 0.1 | 0.5 ± 0.0 | 1.0 ± 0.1 | 0.6 ± 0.0 | 1.0 ± 0.1 | 1.0 ± 0.0 | 1.0 ± 0.0 |
| Herring (H) | 9.2 ± 0.2 | 8.0 ± 0.2 | 9.2 ± 0.1 | 0.8 ± 0.0 | 0.7 ± 0.0 | 0.7 ± 0.0 | 0.6 ± 0.0 | 1.0 ± 0.2 | 0.6 ± 0.0 | 0.6 ± 0.0 | 0.6 ± 0.0 | 0.7 ± 0.0 |
| Jurkat (J) | 9.2 ± 0.2 | 8.4 ± 0.3 | 9.2 ± 0.2 | 10.8 ± 0.2 | 9.7 ± 0.3 | 9.3 ± 0.4 | 9.7 ± 0.8 | 10.2 ± 2.1 | 10.1 ± 0.3 | 9.9 ± 0.2 | 10.0 ± 0.1 | 10.5 ± 0.3 |
| MilliQ (M) | −0.8 ± 0.4 | −1.9 ± 0.3 | −1.0 ± 0.3 | ≤0.05 | ≤0.05 | ≤0.05 | −0.3 ± 0.0 | 0.1 ± 0.0 | 0.0 ± 0.0 | ≤0.05 | ≤0.05 | ≤0.05 |
Publisher’s Note: MDPI stays neutral with regard to jurisdictional claims in published maps and institutional affiliations. |
© 2022 by the authors. Licensee MDPI, Basel, Switzerland. This article is an open access article distributed under the terms and conditions of the Creative Commons Attribution (CC BY) license (https://creativecommons.org/licenses/by/4.0/).
Share and Cite
Bruijns, B.; Hoekema, T.; Oomens, L.; Tiggelaar, R.; Gardeniers, H. Performance of Spectrophotometric and Fluorometric DNA Quantification Methods. Analytica 2022, 3, 371-384. https://doi.org/10.3390/analytica3030025
Bruijns B, Hoekema T, Oomens L, Tiggelaar R, Gardeniers H. Performance of Spectrophotometric and Fluorometric DNA Quantification Methods. Analytica. 2022; 3(3):371-384. https://doi.org/10.3390/analytica3030025
Chicago/Turabian StyleBruijns, Brigitte, Tina Hoekema, Lisa Oomens, Roald Tiggelaar, and Han Gardeniers. 2022. "Performance of Spectrophotometric and Fluorometric DNA Quantification Methods" Analytica 3, no. 3: 371-384. https://doi.org/10.3390/analytica3030025
APA StyleBruijns, B., Hoekema, T., Oomens, L., Tiggelaar, R., & Gardeniers, H. (2022). Performance of Spectrophotometric and Fluorometric DNA Quantification Methods. Analytica, 3(3), 371-384. https://doi.org/10.3390/analytica3030025