1. Introduction
Even though nuclear energy cannot be classified as completely “carbon neutral”, nuclear power plants have a significantly lower environmental impact than fossil fuel power plants, as well as some hydroelectric and renewable energy plants [
1]. Electricity production through nuclear power represents a sustainable approach to reducing ecological disruption and mitigating global warming. Sustainability of nuclear energy production can be further enhanced by optimizing nuclear waste management. This includes strategies to reduce the final waste volume and minimize associated carbon emissions. The HYPEX
® process has been developed for these purposes [
2]. It involves the conversion of spent ion exchange resins (IEXs) into a stable wasteform through an initial grinding step of the resin, followed by immobilization in a geopolymer matrix. Exhausted IEXs constitute a significant fraction of the radioactive waste produced by the nuclear industry, as they are used to control the primary cooling water chemistry of Light Water Reactors (LWRs) [
3]. Geopolymers were selected for HYPEX
® due to their superior chemical and physical properties compared to conventional cement-based matrices, which exhibit limited suitability with organic materials and high-salt content waste, such as resins [
4]. In particular, geopolymers offer enhanced chemical and physical durability, as well as superior thermal stability compared to cement [
5]. Moreover, wasteforms produced with geopolymers have demonstrated higher mechanical strength and reduced leachability relative to cement-based alternatives [
6]. Another advantage of using geopolymers instead of conventional cement lies in their greater sustainability. Several studies in the literature have demonstrated that replacing cement with geopolymers can reduce CO
2 emissions by at least 50 to 70% [
7,
8,
9].
Given the numerous advantages mentioned above, a metakaolin-based geopolymer was designed for the HYPEX
® process to stabilize spent IEXs into a durable wasteform. Since this material is intended for nuclear applications, ensuring the long-term stability and reproducibility of its physical and chemical properties is crucial. To achieve this, it is necessary to maintain consistent raw material quality over time, provided that the process conditions are well-defined and kept constant [
10]. The chemicals used in HYPEX
®, specifically sodium hydroxide and water glass, are standard industrial products, and consistent quality over the years is ensured. In contrast, metakaolin is obtained through the calcination of kaolin, a material occurring in nature, the properties of which can vary depending on the source of the raw material [
11] and the specific calcination process employed [
12].
In this study, two batches of the same commercial metakaolin were investigated. Their physical properties (specific surface area measured by the Brunauer–Emmett–Teller (BET) method) and chemical composition (analyzed via X-Ray Fluorescence (XRF)) were evaluated and compared to the manufacturer’s declared values. As the geopolymers resulting from the two batches showed different mechanical performance, the assessment of the physical properties and chemical composition of metakaolin turned out to be necessary but was not sufficient for characterizing the precursor powder to achieve geopolymers with consistent mechanical performance. However, in nuclear applications, waste conditioning matrices must meet strict and predefined criteria, particularly in terms of mechanical stability and containment capacity [
13,
14]. These properties must remain stable and reproducible over time and across production batches to ensure long-term safety and regulatory compliance.
The aim of this study is to develop a practical approach to ensure the consistency of geopolymer matrices intended for radioactive waste conditioning. The temperature evolution was measured during the geopolymerization early stage and qualitatively correlated with key properties of the final geopolymers, such as compressive strength, leaching resistance, and water permeability. The monitoring of the temperature evolution, requiring only low-cost equipment and a simple testing procedure, is here proposed as a KPI for the consistency of the geopolymer properties. The proposed KPI is well-suited for use as a routine quality control method in industrial environments and will allow testing of small-scale laboratory samples as a proxy to verify the preservation of the desired properties during the scale-up process.
The geopolymer properties are primarily influenced by the reactivity of the precursor powder [
15], the pH of the alkaline activating solution, and the initial water content [
16]. While pH and water content are relatively easy to assess and control, the intrinsic reactivity of the precursor remains more elusive. Several studies have attempted to fully correlate the chemical–physical properties of the powder, such as those derived from XRD, XRF, PSD, BET, NMR, and other techniques (see the Materials and Methods Section) with its reactivity but without conclusive results [
17]. The most reliable approach to assess the actual reactivity has proven to be a direct experimental investigation, either through isothermal calorimetry [
18] or by monitoring the early temperature evolution during the geopolymerization process [
19]. Calorimetric analyses are widely used to investigate the reactivity of metakaolin and its relative influence compared to other synthesis parameters, such as the pH of the activating solution and the initial water content. However, these measurements are typically carried out under isothermal conditions, which fail to capture the actual thermal evolution of the system. In reality, the temperature can spontaneously rise by up to 80 °C during the early stages of geopolymerization [
20], strongly influencing both reaction kinetics and matrix formation [
21]. Following the approach originally proposed by Davidovits et al. [
19], the route of monitoring the actual temperature evolution over the first 24 h of geopolymerization was chosen here. The thermal evolution during the first geopolymerization stage is indeed critical for the development of atomic bonds and the resulting microstructure. However, unlike Davidovits et al. [
19], who used an external curing at 80 °C, for the first time, here, adiabatically insulated samples were employed. This configuration indeed provides a more realistic representation of the geopolymerization process, especially when scaled up in 220-liter drums, as required in nuclear waste conditioning applications. To identify the dominant parameters governing the temperature evolution during geopolymerization, a lumped parameter model was developed. This model enabled the identification of key variables that must be preserved during the scale-up process (from laboratory scale to industrial-scale drums) in order to maintain a consistent thermal evolution throughout curing and thus achieve comparable final properties in the geopolymer.
The novelty of this work lies in the development of a practical technique based on reactivity assessment, with the potential to significantly reduce both experimental time and cost in the large-scale production of geopolymers. This methodology offers a practical and cost-effective means of selecting suitable metakaolin powders.
2. Materials and Methods
The experimental campaign focused on aluminosilicate-based geopolymers synthesized by activating a commercial metakaolin (labelled B) using an alkaline solution composed of sodium and silicate ions (chemical composition: SiO2 27.5 ± 0.5 wt%, Na2O 8.0 ± 0.1 wt%, H2O 64.5 ± 1.3 wt%). Metakaolin is an alumina silicate oxide powder conventionally expressed as 2SiO2 · Al2O3. Nevertheless, silicium and aluminum fractions may change depending on the kaolin extraction clay composition, as the presence of impurities such as iron, titanium, calcium, and phosphate oxide. Two separate production batches (B1 and B2) of, nominally, the same metakaolin (i.e., the same commercial brand from the same manufacturer) were analyzed for chemical composition through X-Ray Fluorescence (XRF) using Energy-Dispersive X-Ray Fluorescence (EDXRF) at AlfatestLAB (Milan, Italy), and their specific surface area was measured via the Brunauer–Emmett–Teller (BET) method, using a Tristar (Micromeritics, AlfatestLAB).
A full characterization of the metakaolin precursor would ideally involve several complementary techniques, such as SEM-EDS (Energy Dispersive X-ray Spectroscopy (EDS)–Scanning Electron Microscopy (SEM)), Nuclear Magnetic Resonance (NMR), X-ray Diffraction (XRD), and Particle Size Distribution (PSD). However, in the context of this study, a targeted selection of analyses was carried out, aimed primarily at ensuring the consistency of the starting material and assessing its reactivity potential in geopolymer synthesis. To determine the average chemical composition of the metakaolin, XRF was employed. XRF is a standardized, low-cost, and sensitive method capable of detecting elements at ppm levels. It is particularly suitable for industrial applications and provides reliable bulk compositional data, in contrast to techniques such as SEM-EDS, which are more focused on local morphology or surface-level chemical variation, and whose detection limits are typically around 0.1% [
22]. The specific surface area, a key parameter that could influence reactivity, was measured using BET analysis. Unlike PSD, which provides information on particle dimensions but not on accessibility to the activating solution, BET allows for an estimation of the actual contact area available for reaction across both macro and nano scales. As previously reported by [
23], it is the specific surface area rather than the particle size distribution that governs the pozzolanic reactivity of metakaolin. XRD was not included, as it offers limited insight into metakaolin reactivity: due to its largely amorphous nature, thermally activated kaolinite (i.e., metakaolin) yields broad, featureless humps in the diffractogram, which remain unchanged even after significant dissolution in alkaline media, as reported by [
24]. Similarly, solid-state NMR techniques, although informative, do not provide conclusive metrics for reactivity, as shown in previous works [
17,
25]. Moreover, note that the investigation of the physical and/or chemical reasons for the observed differences in reactivity is beyond the scope of the present work.
Therefore, BET and XRF were considered adequate for a preliminary characterization of the metakaolin with respect to its reactivity, allowing us to verify the consistency of the starting material across different batches. The XRF analysis indicates that the two batches of the same commercial metakaolin exhibit a comparable chemical composition, as shown in
Table 1. The specific surface area of both batches was assessed using BET technology, revealing values of 13,610 ± 71 m
2/g for B1 and 14,100 ± 41 m
2/g for B2, which are consistent with the declared value of 14,000 m
2/g.
Four different formulations for the samples of B1 and B2 were prepared, each with a distinct water-to-solid ratio (W/S): W1/S = 0.48, W2/S = 0.54, W3/S = 0.59, and W4/S = 0.65. The lowest of these values corresponds to the minimum amount of water required to achieve acceptable manual workability. A total of 24 samples were produced.
Table 2 shows the fundamental atomic ratio of each formulation.
Metakaolin was vigorously mixed with the alkaline solution for 5 min to ensure homogeneity of the final paste (
Figure 1a). Only for specimens realized for the leaching test, 2.9 g of SrCl
2-H
2O was dissolved into the alkaline solution prior to the metakaolin addition; this tiny amount, accounting for less than 0.03% of the total mass, does not influence final geopolymer chemo-physical properties but acts as a tracer only.
The fresh geopolymer paste was then cast into cylindrical plastic molds (100 mm diameter × 100 mm height) (see
Figure 1b). These molds were then placed inside a polystyrene enclosure with 50 mm thick walls to provide thermal insulation (
Figure 1c). This setup maintained an almost adiabatic environment during the first 24 h of curing, while the semi-hermetic conditions preserved high humidity throughout the process. Note that a temperature probe (Elitech Tlog EC, supplied by Elitech, San Jose, CA, USA, with a working range from −85 °C to 150 °C and a precision of 0.5 °C) was inserted into the center of each specimen immediately after casting to measure the temperature evolution during early curing (the temperature rise during the first 5 min of mixing was not recorded) (see
Figure 1d). The internal temperature was recorded continuously over the first 24 h to monitor the exothermic behavior associated with the geopolymerization process.
After a curing period of 21 days at 25 °C in dry conditions, the following tests were conducted to characterize the materials in terms of mechanical strength, chemical stability, permeability, and thermal behavior:
Water Permeability: After the curing period, the geopolymer samples were submerged in water at 25 °C and atmospheric pressure. The water uptake of each specimen was monitored by periodically measuring its weight every 10 days. Once two consecutive measurements showed no further increase in weight, the sample was considered saturated. In parallel, the external volume of each specimen was measured after each immersion step using a caliper to confirm the absence of macroscopic volumetric expansion during the tests.
Strontium Leachability: To assess Sr
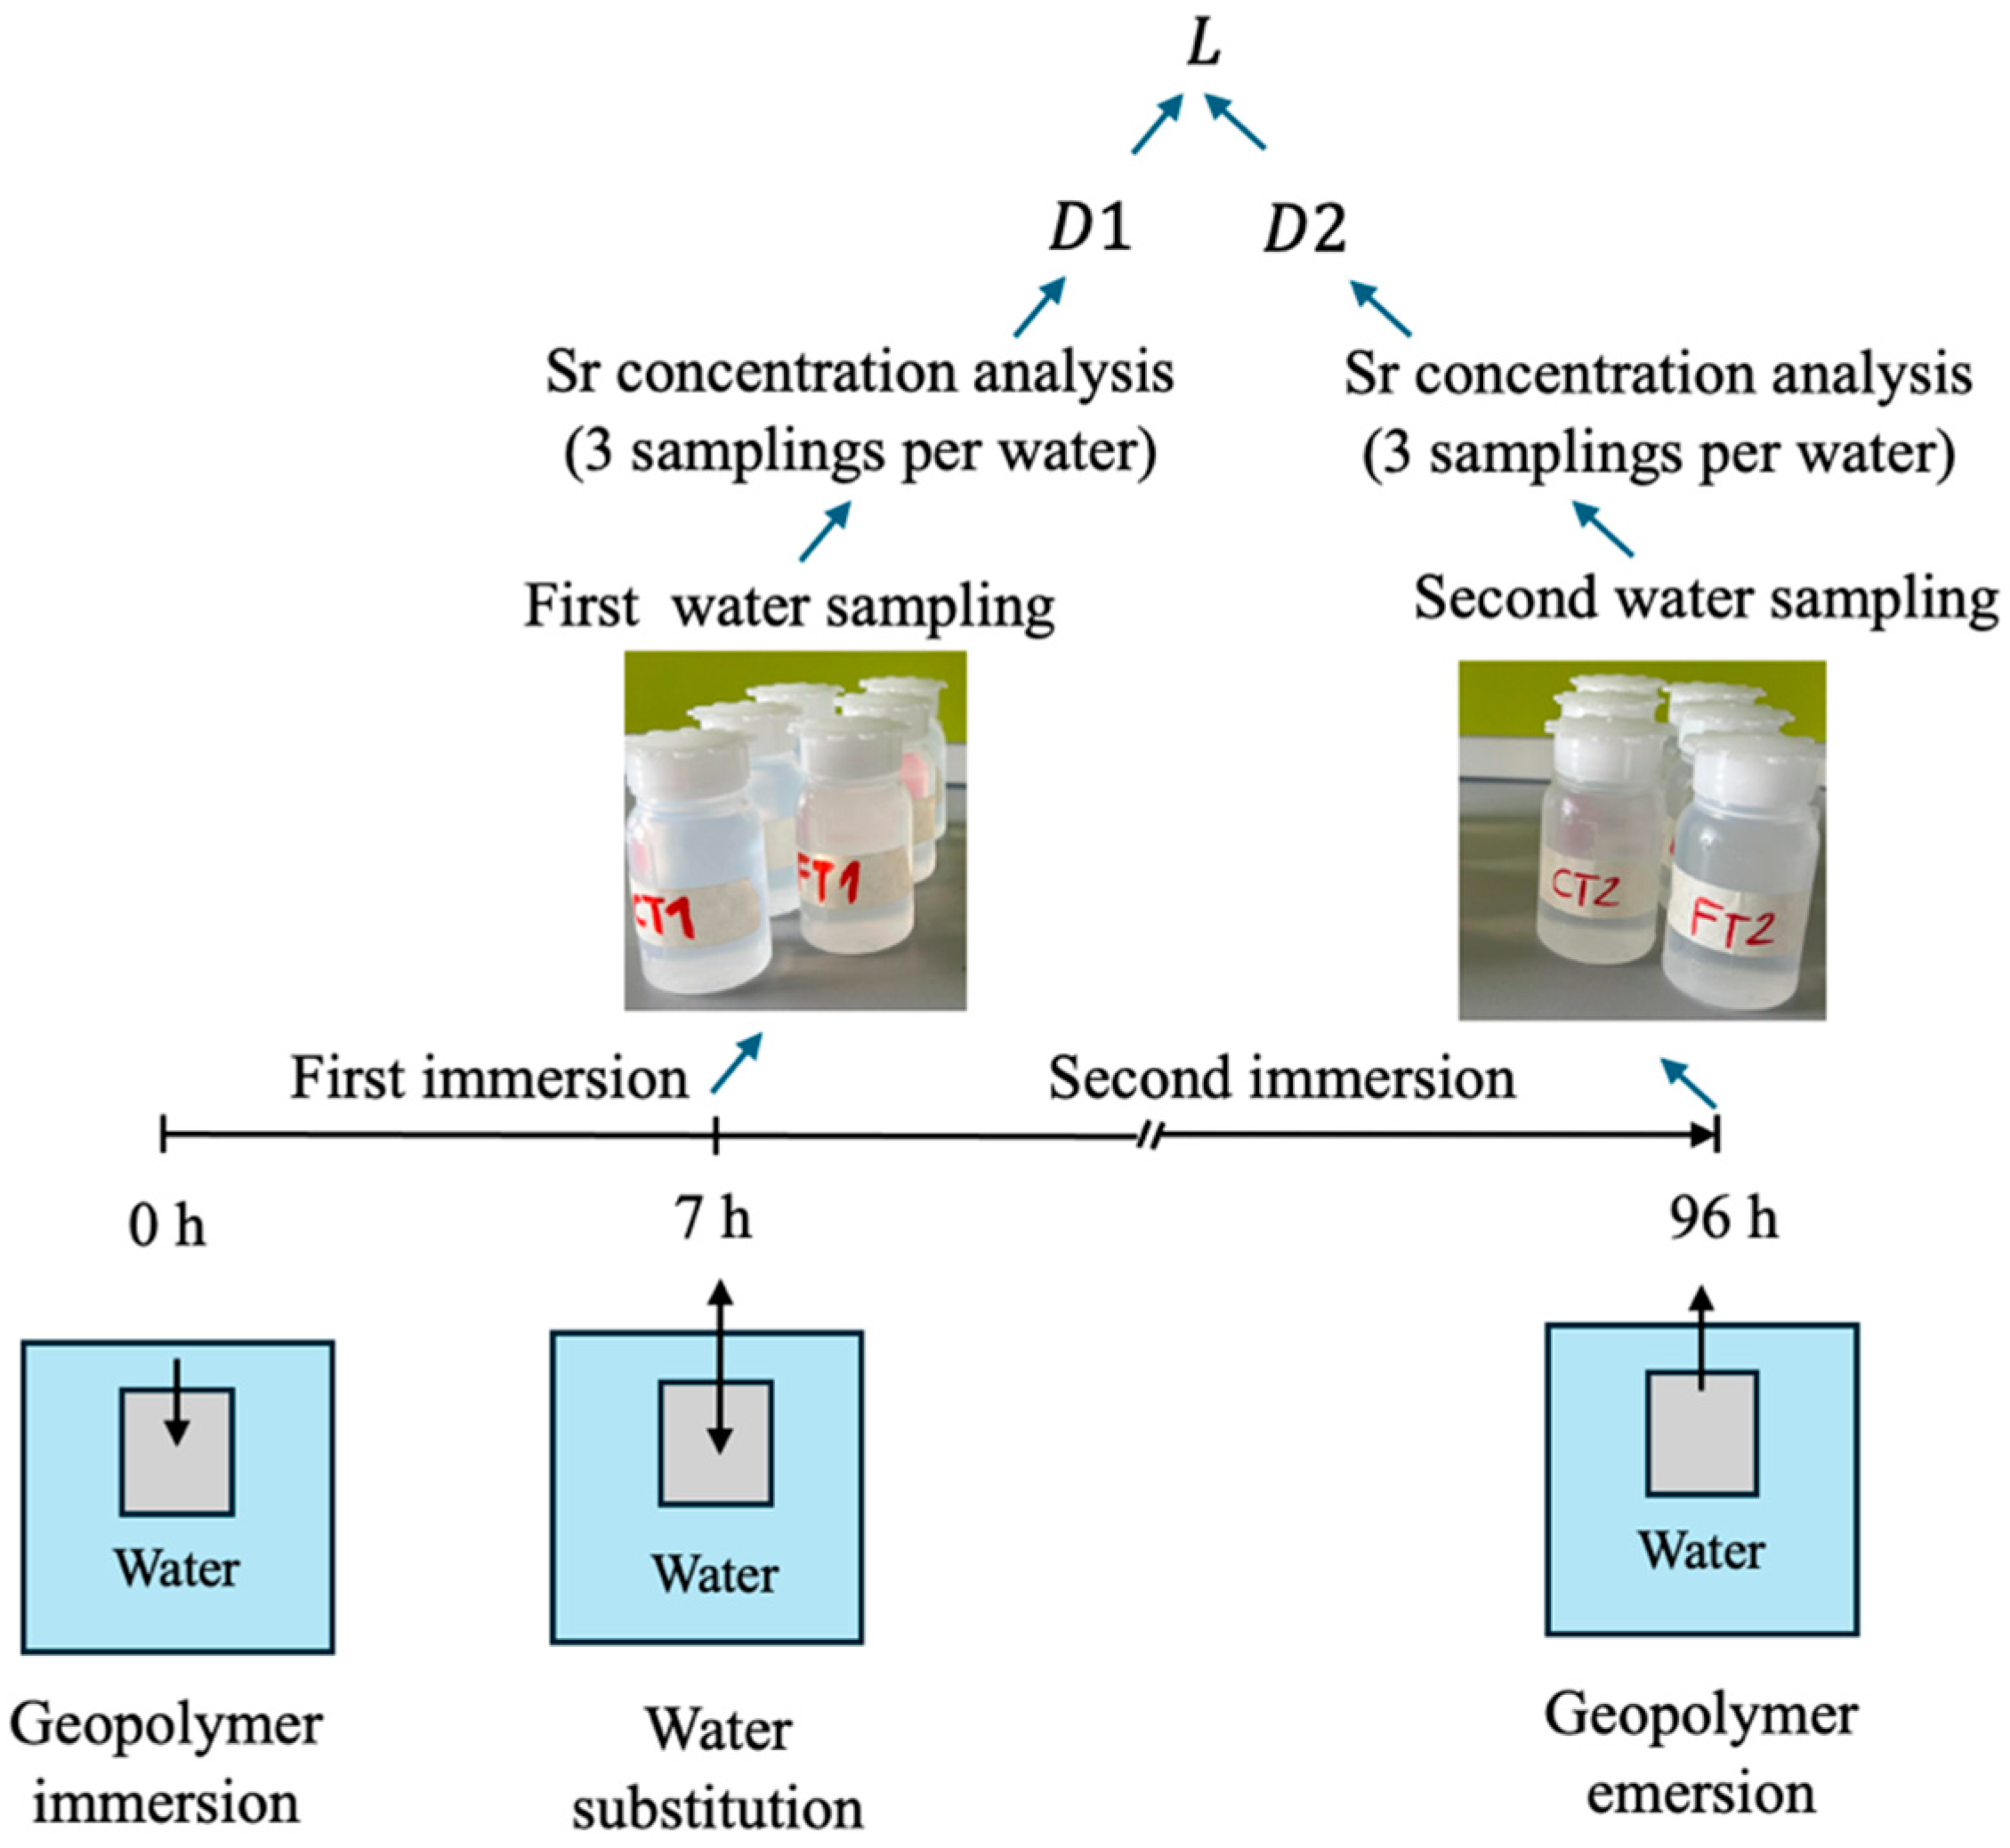
2+ release, a leaching test was carried out at the Department of Applied Science and Technology, Politecnico di Torino. A schematic representation of the test setup is provided in
Figure 2. Samples were immersed in a fixed volume of demineralized water for defined time intervals. After 7 h, the first water aliquots were collected, the leachant (water) was then replaced, and second aliquots were collected 96 h after the initial immersion. Sr
2+ concentrations in the leachates were determined by Inductively Coupled Plasma-Mass Spectrometry (ICP-MS); three samplings per water sample were performed to improve statistical reliability. The diffusion coefficient of strontium was calculated based on the initial Sr content in the matrix and the cumulative amount released into the solution, according to Equation (1) [
26]:
In Equation (1), is the initial quantity of strontium in the matrix in grams. is the amount of strontium released in the n water sample in grams. is the duration of the n immersion intervals in seconds. and are the final and initial absolute times of that interval, both expressed in seconds.
The final diffusion coefficient
was calculated as the arithmetic mean of the individual coefficients (Equation (2)), and the leachability index
is defined by Equation (3). Since the total immersion time was 96 h, the calculated
value represents the short-term leachability index, in accordance with [
26]:
A modified version of the ANSI/ANS-16.1-2019 protocol [
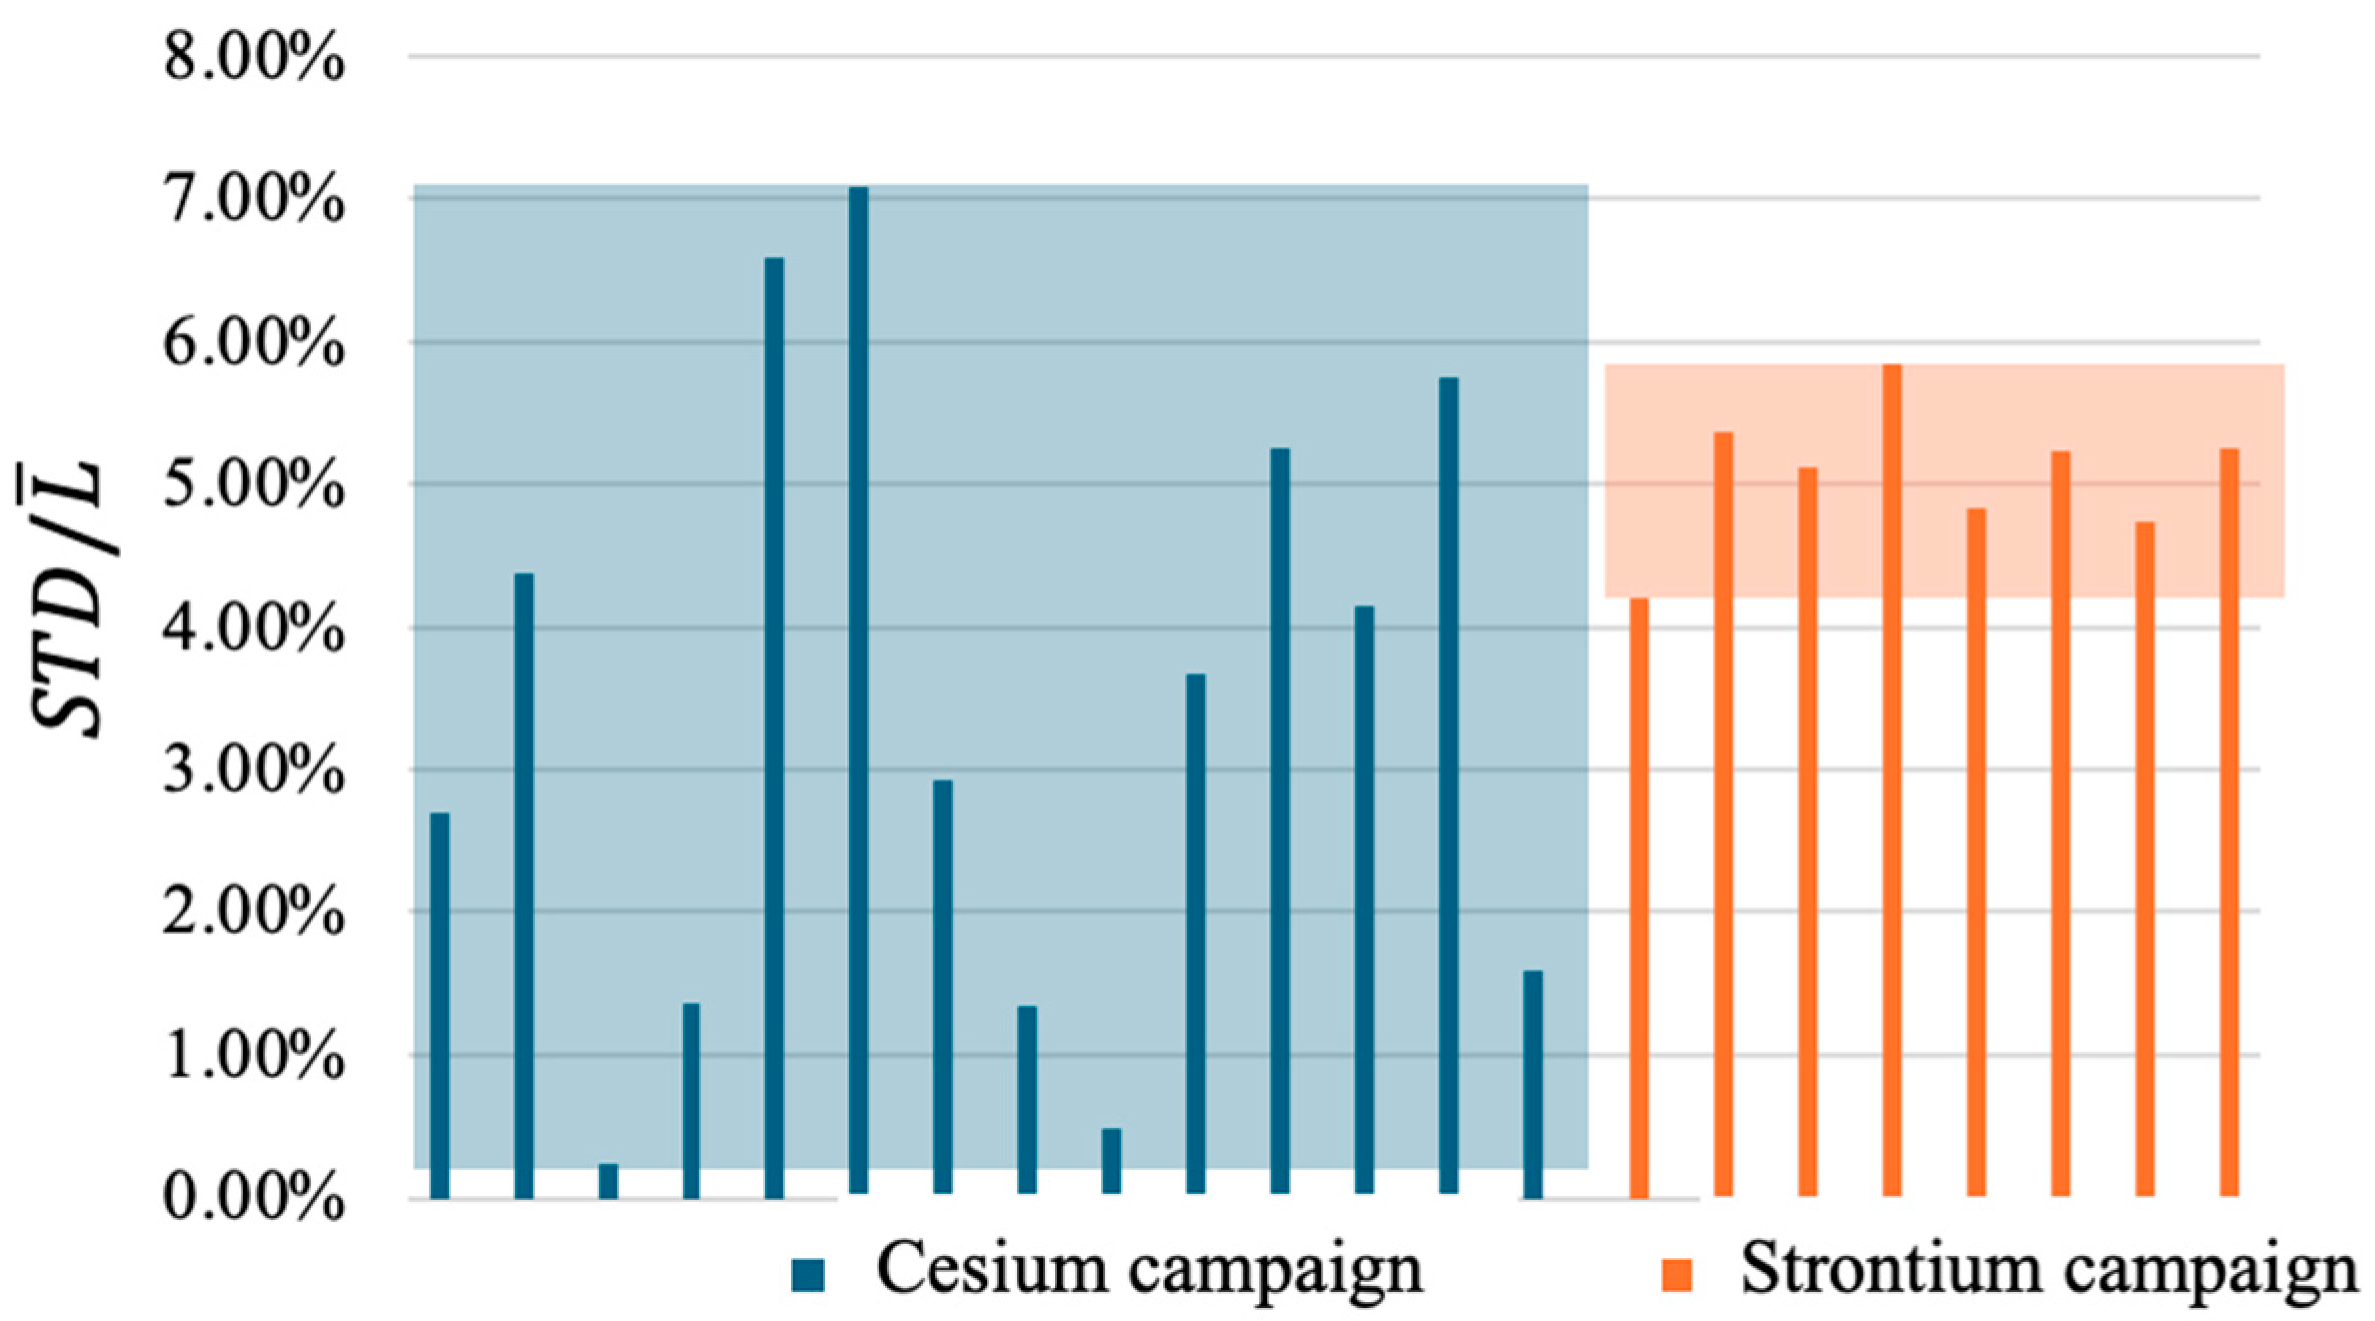
26] was adopted, employing two leachate samplings instead of the standard six as part of a preliminary study. This choice was based on prior tests on the same geopolymer matrix, performed using the full protocol, which showed negligible variability in the calculated diffusion coefficients. As shown in
Figure 3, the standard deviation-to-mean ratios
remain consistently low. Specifically,
Figure 3 compares
values from the present Sr campaign with those from a previous in-house Cs campaign conducted on the same geopolymer using six sampling intervals (0–2, 2–7, 7–24, 24–48, 48–72, and 72–96 h), yielding six leaching indices (L
1–L
6). To validate the two-sample approach, STD values were calculated for all possible L
n–L
m (n,m ∈ 1,2,3,4,5,6]; n ≠ m) pairs. The resulting
values for Sr (4.19–5.84%) fall within the Cs range (0.23–7.08%), supporting the applicability of the simplified method for reliable leaching index estimation.
Moreover, although the leaching index depends on the specific ion, particularly its mobility within the wetted matrix, the uncertainty associated with different immersion times (
is primarily governed by the adequacy of the diffusion model in describing actual transport mechanisms. In this context, uncertainties are mainly influenced by the matrix structure rather than the ion species [
27]. As a result,
values obtained for different ions (e.g., strontium and cesium) within the same matrix are comparable and meaningful.
Compressive Strength: mechanical resistance was evaluated in accordance with the UNI EN 12390-3 standard [
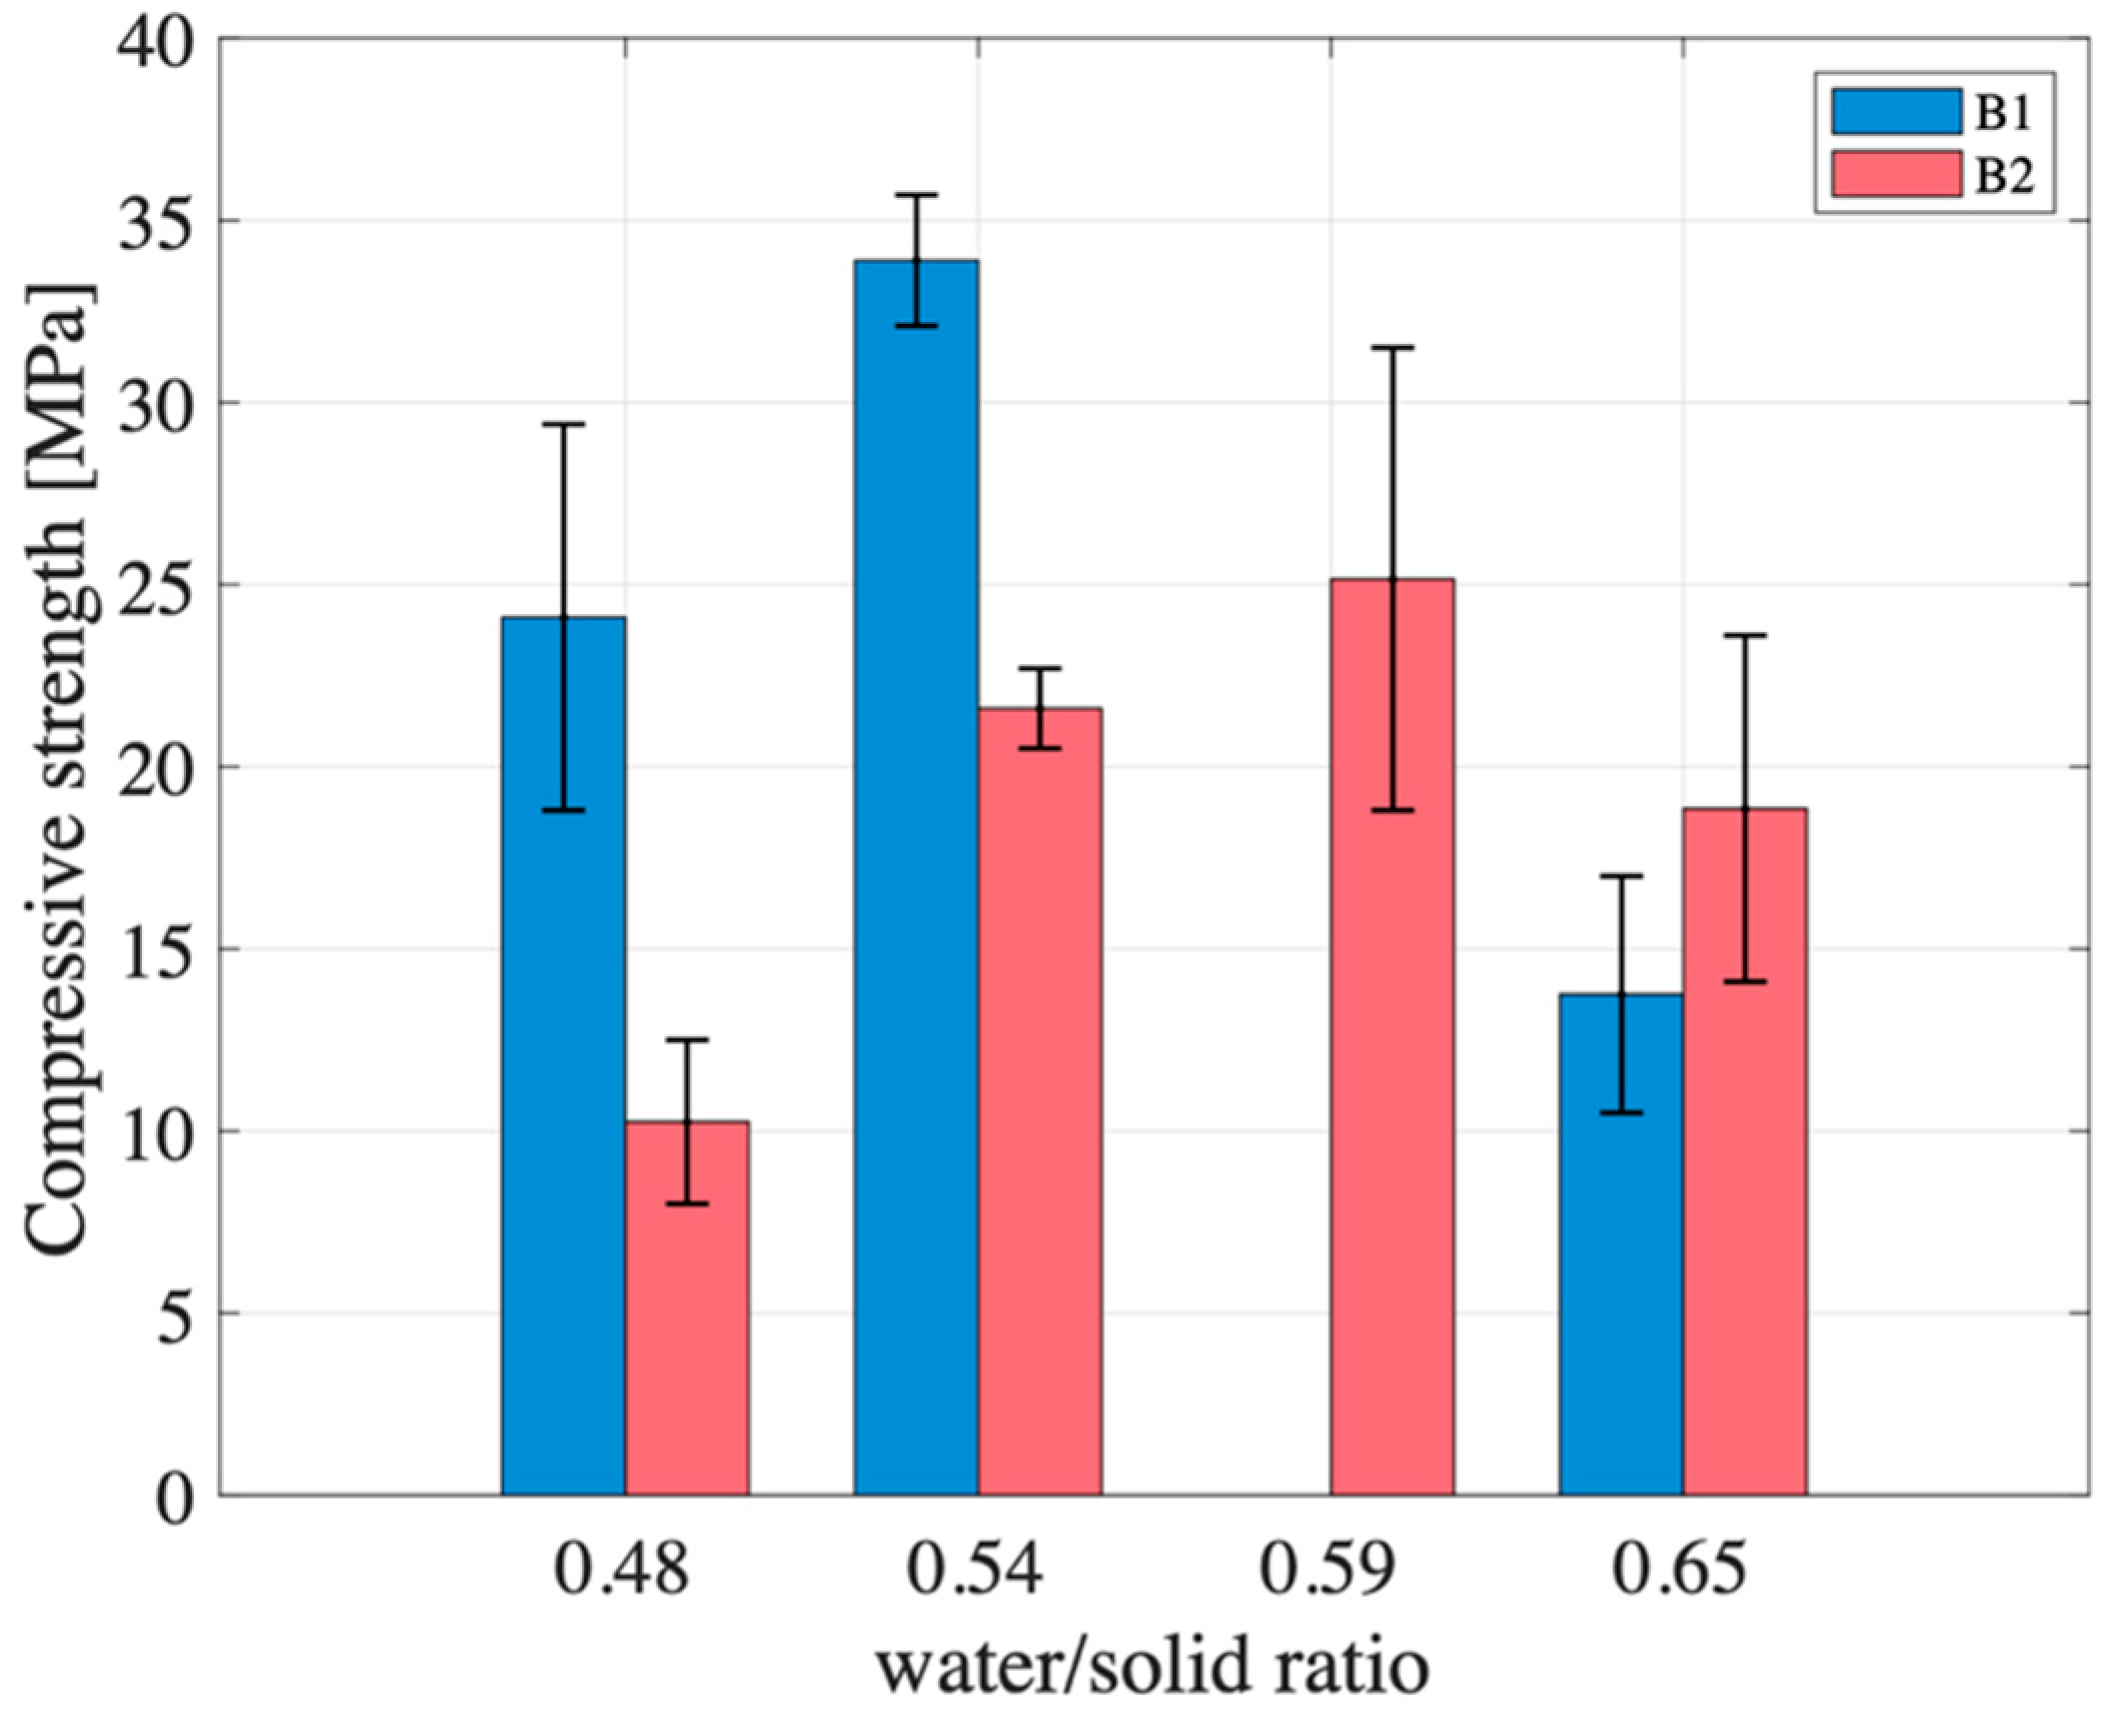
28]. In view of budget constraints, the experiments were conducted by Tecno-Piemonte S.p.A., an accredited Italian laboratory specialized in cement certification, on only two specimens from each formulation. The error bar associated with the measurement represents the standard deviation calculated from the performed measurements. The deviation from planarity after surface grinding (i.e., the flattening of specimen ends to ensure proper load application) was below 3%, ensuring relevant compressive strength test results.
4. Discussion of Experimental Results
Although the two tested metakaolin powders, B1 and B2, exhibit similar chemical composition and BET surface area, the resulting geopolymers showed markedly different thermal evolution and mechanical behavior under identical formulation conditions, while water permeability and leachability remain comparable. These differences are attributed to intrinsic variations in powder reactivity, which influence the early-stage geopolymerization dynamics and, ultimately, the development of the material’s structure and strength.
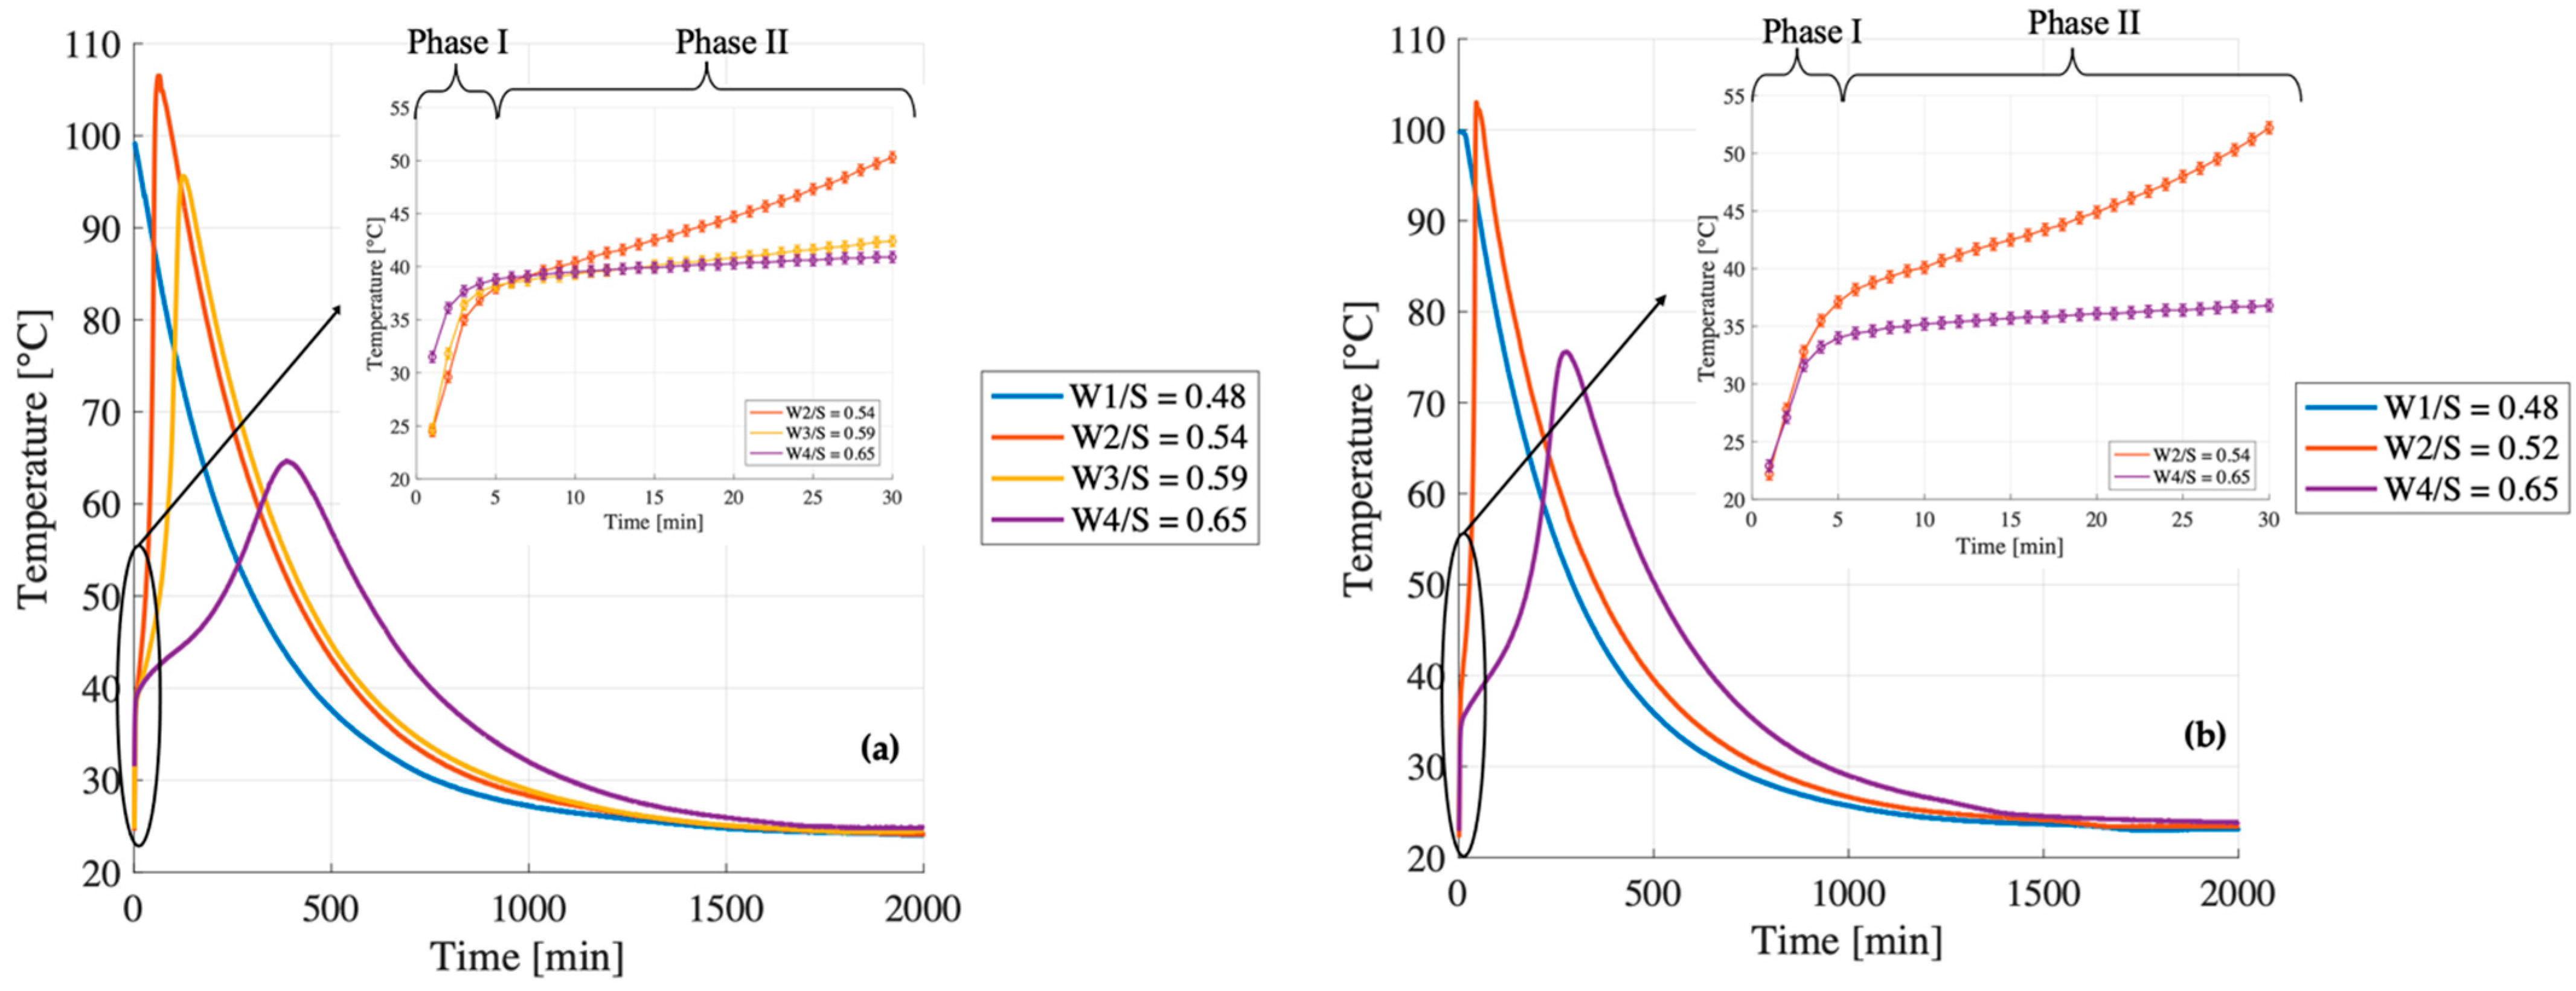
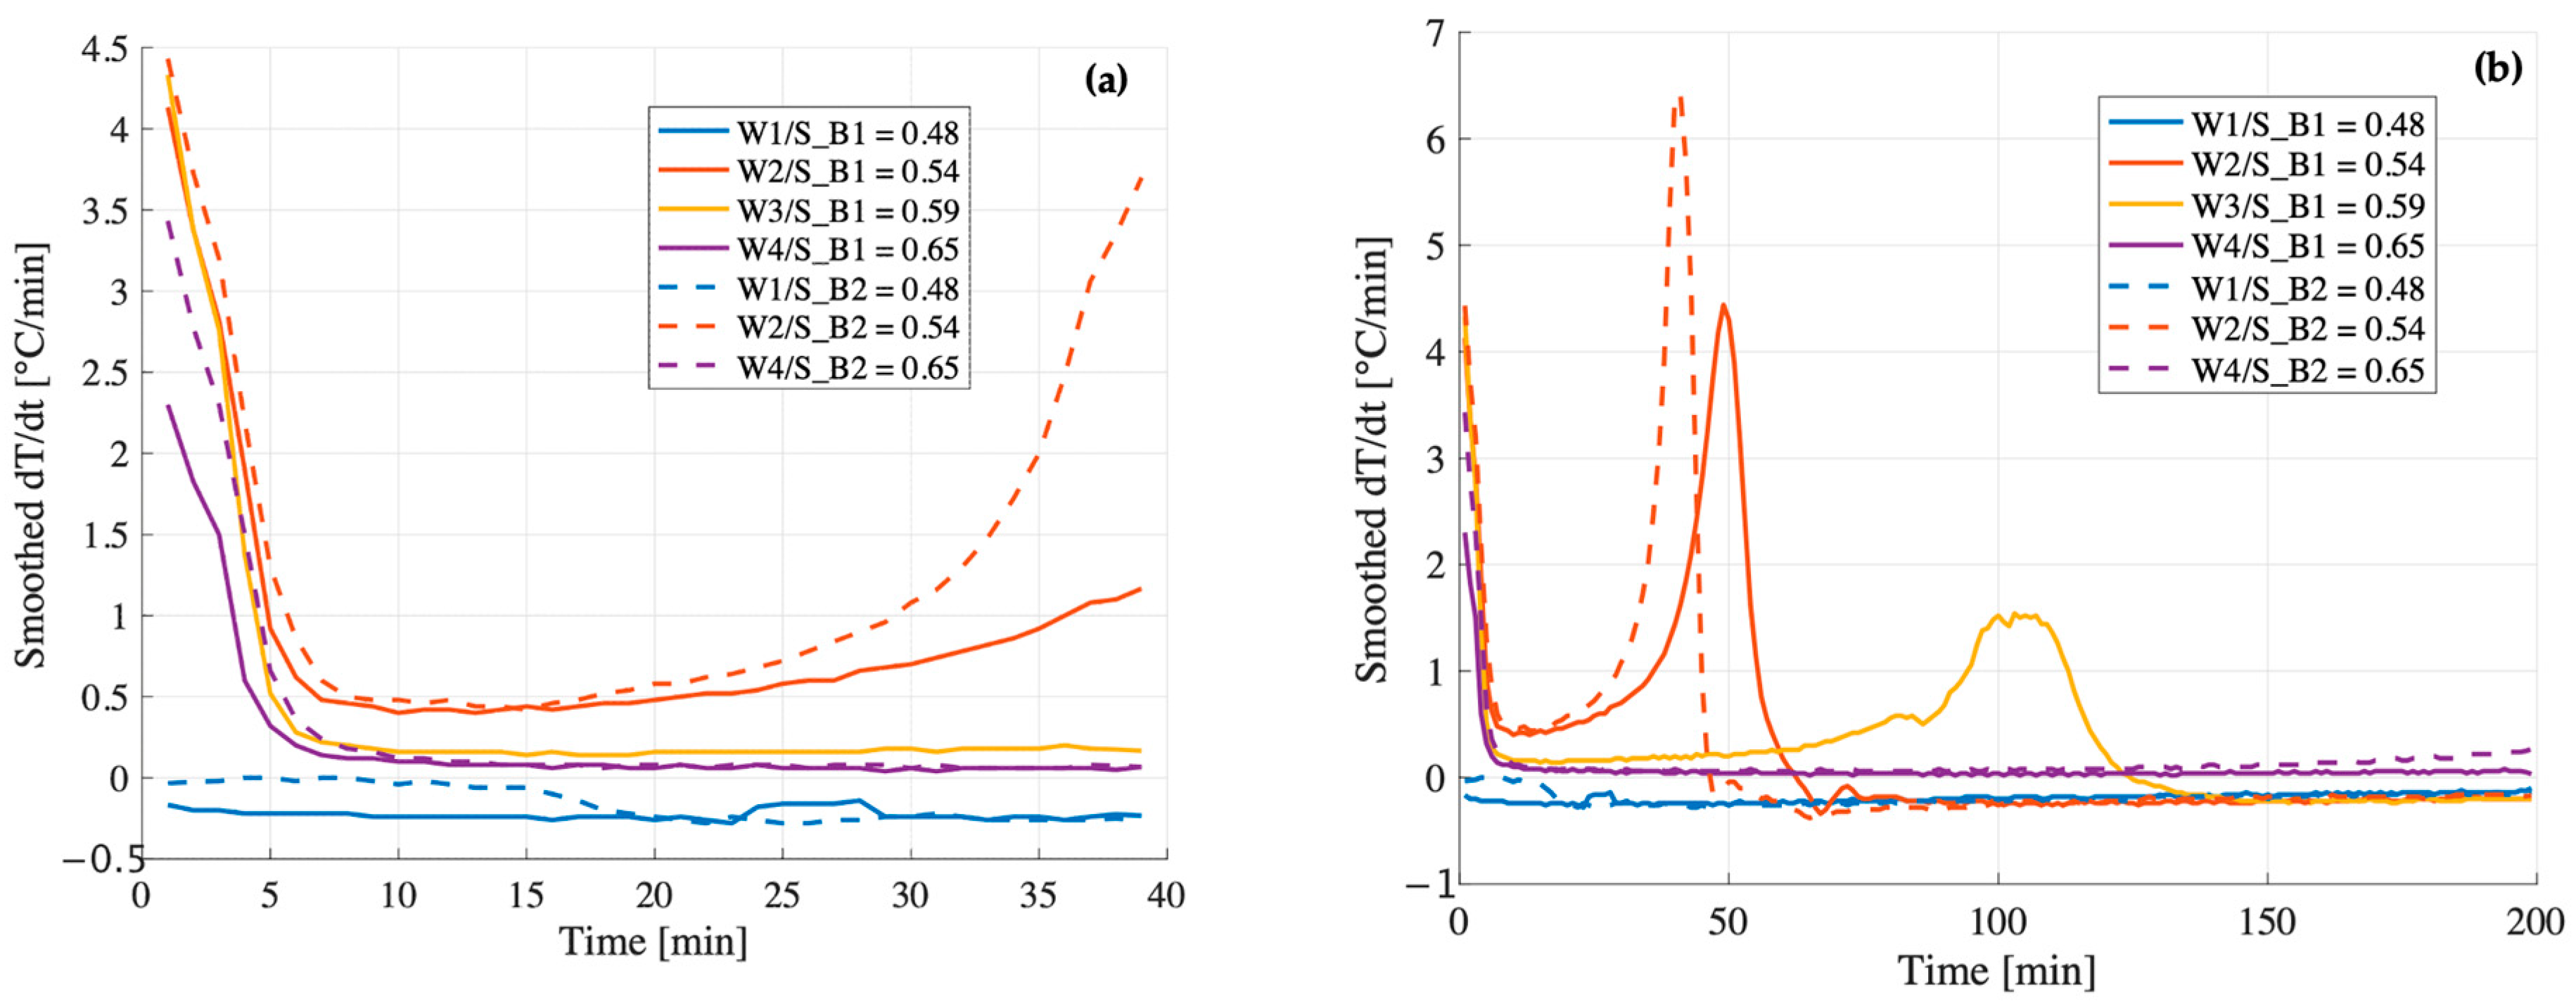
At W/S = 0.48, the compressive strength of B1 exceeds that of B2 by more than a factor of two (24 MPa vs. 10 MPa). Although both samples reach peak temperatures close to 100 °C within the first 5 min (mixing time) and follow similar trajectories after the first 15 min (
Figure 7a,b), their early-stage thermal behavior differs significantly. In B1, the temperature derivative (
Figure 8a) becomes slightly negative shortly after the initial peak, suggesting that the system is no longer generating heat and begins to cool down. This cooling phase avoids further evaporation and enables the incorporation of the required structural water within the geopolymer gel.
In contrast, B2 exhibits a flat derivative immediately after the peak (
Figure 8b), indicating a stagnation phase in which the temperature remains stable at 100 °C for approximately 15 min. Under adiabatic conditions, this suggests that the released heat is not being used to sustain the reaction but is instead consumed by the evaporation of free water. As this water is lost before it can be incorporated into the gel network, the system fails to achieve the ionic and molecular balance necessary to form a strong, cohesive matrix. This early-stage depletion of available water is likely the primary factor contributing to the significantly lower compressive strength observed in B2.
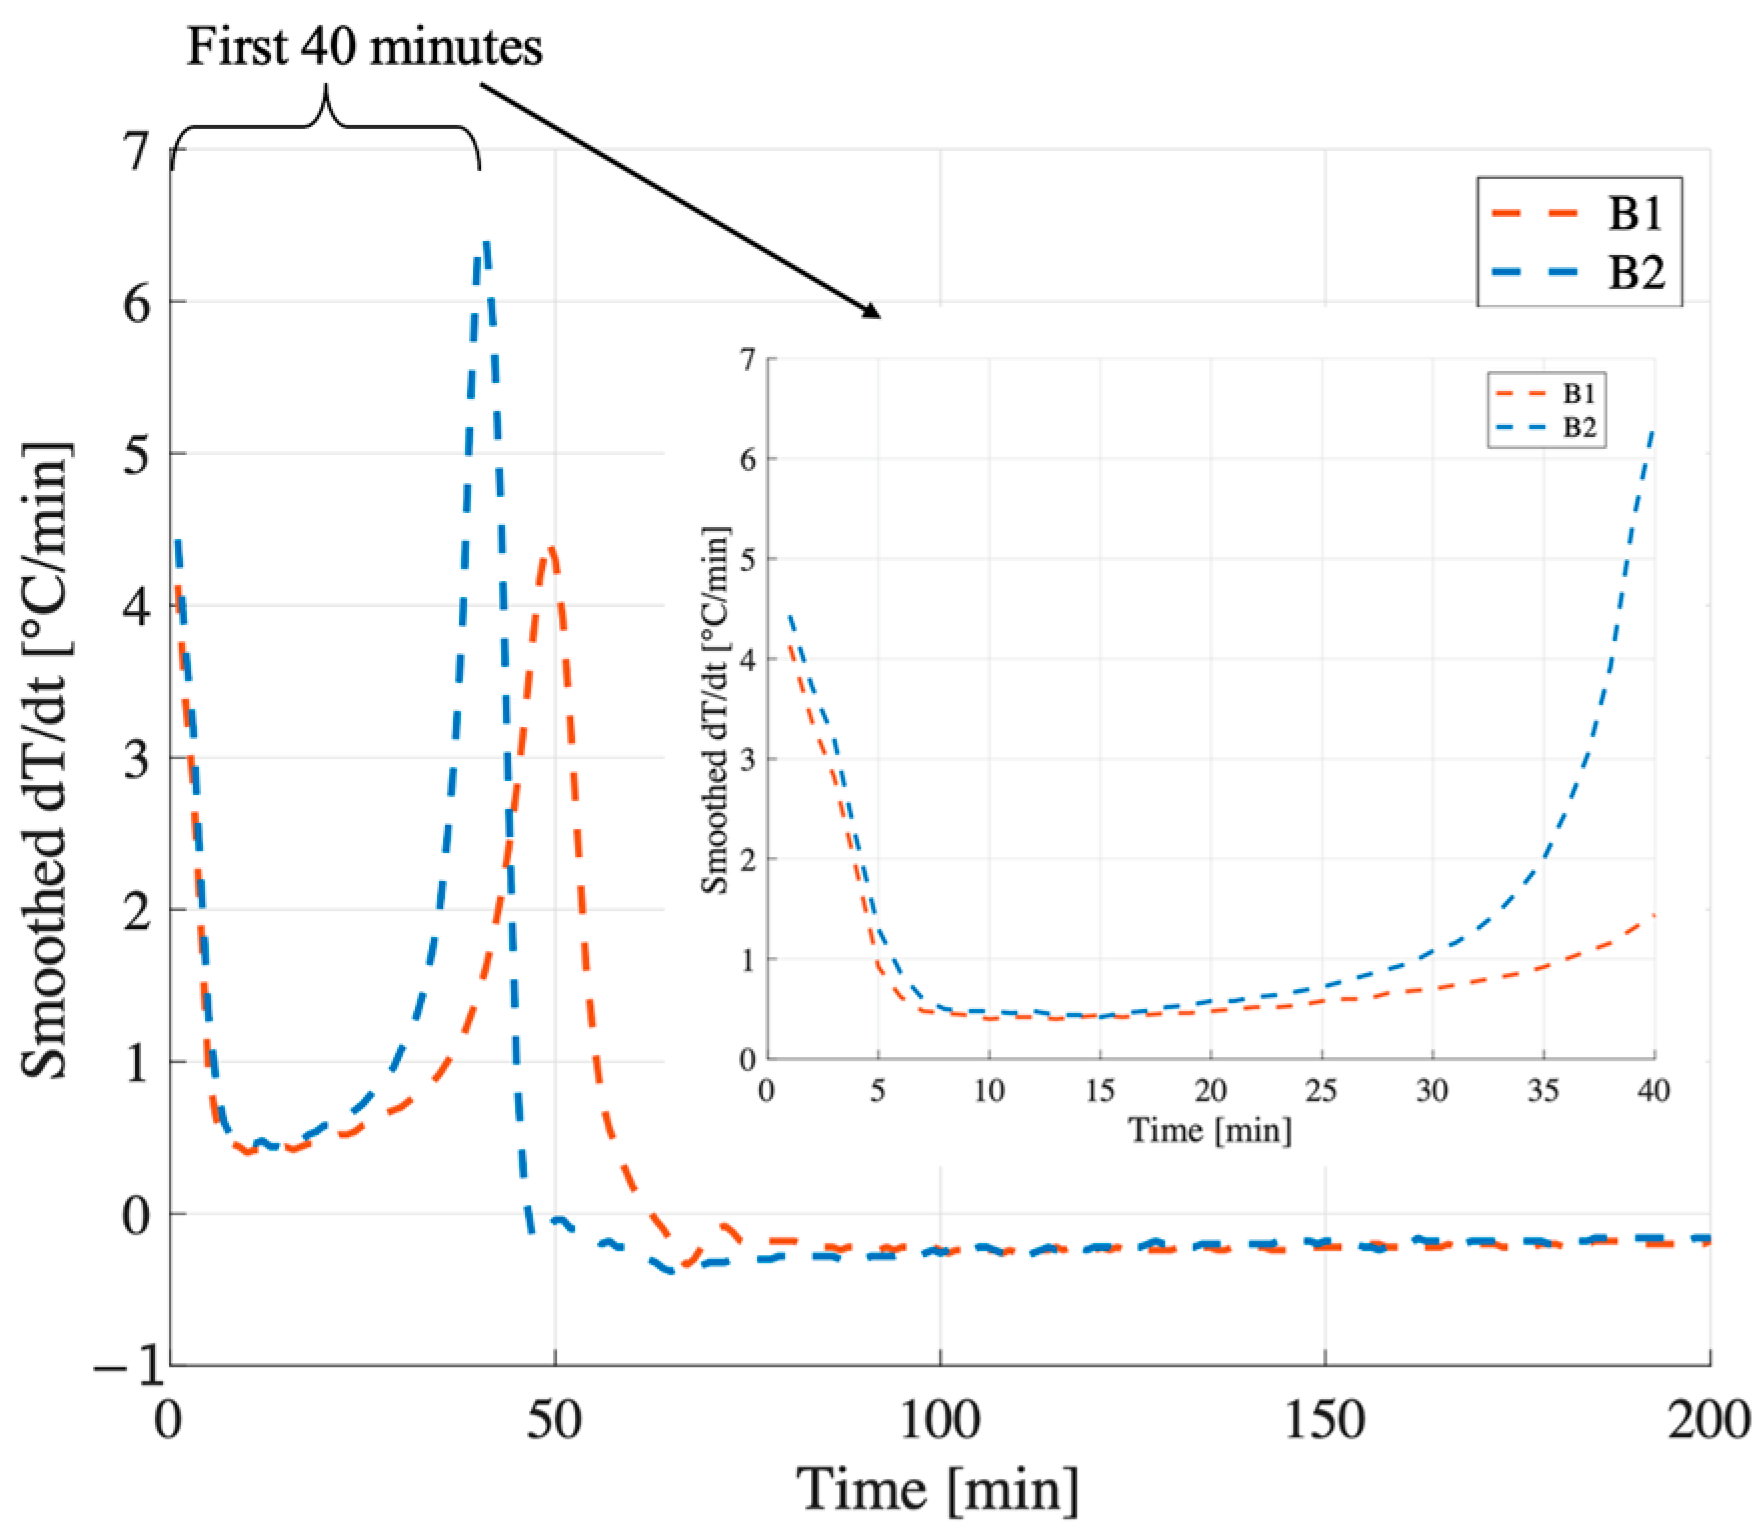
At W/S = 0.54, the compressive strength of B1 remains significantly higher than that of B2 (34 MPa vs. 22 MPa). Both systems display similar initial behavior in terms of temperature evolution and derivative. Their early reaction kinetics appear nearly identical, indicating comparable rates of dissolution and early condensation. However, their trajectories begin to diverge after approximately 20 min (
Figure 9). In both cases, the temperature derivative increases again after the initial drop, indicating a secondary stage of thermal evolution, possibly related to the oligomer production. Notably, this secondary increase is more pronounced and sharper in B2, with the second peak of the derivative exceeding the first one (
Figure 9). This behavior may reflect a more heterogeneous and irregular reaction environment, which could hinder the formation of a continuous and uniform geopolymer network, ultimately resulting in reduced mechanical strength. In contrast, B1 exhibits a more gradual and moderate increase in the derivative, with the second peak reaching a magnitude comparable to the first. This smoother thermal evolution indicates a more uniform reaction process, which likely promotes the formation of a coherent and well-integrated geopolymer network, ultimately contributing to the higher mechanical performance observed.
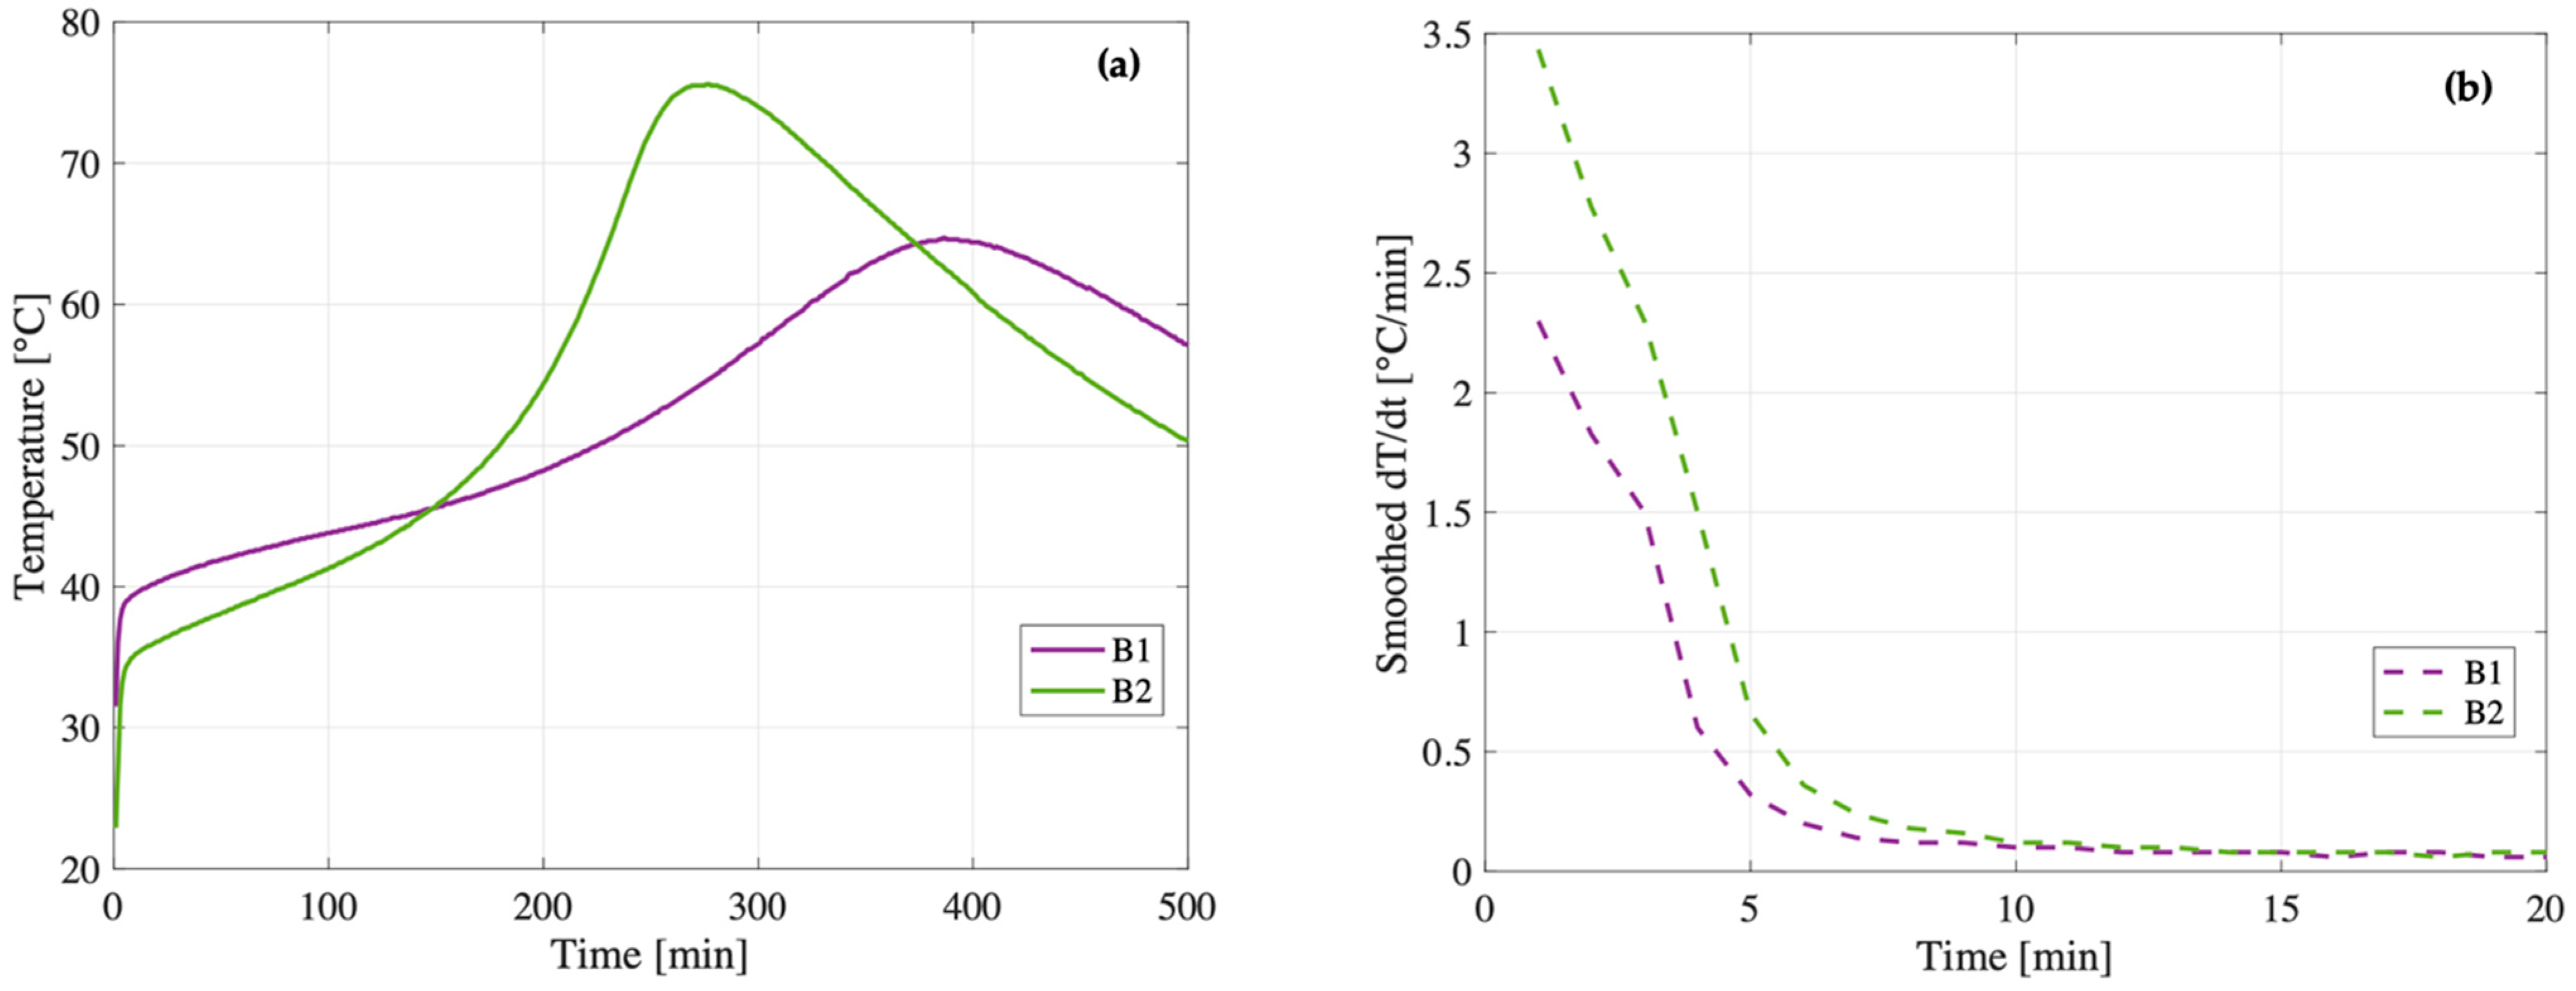
At W/S = 0.65, the trend reverses: the compressive strength of B2 (19 MPa) surpasses that of B1 (14 MPa). The smoothed temperature derivatives (
Figure 10b) reveal a key distinction during the early dissolution phase: within the first 5 min, B2 exhibits a significantly higher thermal rate of change (dT/dt) compared to B1. This indicates a more vigorous and rapid initial reaction, suggesting that the metakaolin in B2 dissolves more effectively when more water is available. This observation is consistent with the main temperature evolution (
Figure 10a), in which B2 reaches a higher maximum temperature (75.6 °C vs. 64.7 °C), reinforcing the idea that the system is globally more reactive. The combination of fast initial dissolution and strong thermal evolution likely promotes the formation of a more homogeneous and better cross-linked geopolymer matrix, ultimately resulting in improved mechanical performance.
Unfortunately, no meaningful comparison can be drawn between the two metakaolin batches at a W/S ratio of 0.59 due to the absence of experimental data for B2. Nevertheless, an analysis of B1 across different W/S ratios reveals a clear trend: increasing the water content results in a delayed onset of the second thermal peak (
Figure 8b), typically associated with the formation of oligomeric species. This delay suggests that higher dilution affects the condensation kinetics, shifting the energy release related to the oligomerization phase to later stages of the reaction.
Macro void analysis (
Table 4) further indicates that higher water content (W/S = 0.59 and 0.65) results in lower void fractions, attributed to easier bubble escape in low-viscosity pastes. Across all W/S ratios, B2 shows slightly more voids than B1, likely due to its higher reactivity. This is supported by the data in
Figure 8a, where a steeper initial temperature derivative (dT/dt) is observed for B2 compared to B1 under the same formulation conditions.
5. A Simplified Model for the Sample Temperature Evolution
Beyond experimental observations, a simplified semi-analytical model has been developed to describe and attempt to explain the thermal phenomena taking place during geopolymerization, such as heat generation, heat dissipation, and temperature variation over time (
Figure 11). By fitting the model to the experimental temperature evolution, it is possible to find the fundamental parameters to preserve during the scaling-up process from sample size to real case drum size (200 liters).
5.1. Thermal Dissipation
The thermal power P1 that the drum dissipates to the surrounding environment is represented in Equation (6)
In Equation (6),
is the surface area of the drum, while
and
are the temperatures of the drum surface and the surrounding environment, respectively. Since the heat generation caused by geopolymerization is spatially homogeneous within the sample in almost adiabatic conditions, the temperature is also assumed to be spatially uniform inside the sample, and the superficial temperature coincides with the average temperature of the sample.
is the overall heat transfer coefficient of the system; it considers conduction with the underlying floor and the convection with the surrounding stagnant air (Equations (7) and (8)). Even though the convection coefficient depends on temperature, it is constant for simplicity (evaluated at the average temperature):
represents the contact area of the sample with the bottom (
), the side (
) and top (
), respectively. The parameter
is the thermal conductivity,
and
are the convection coefficients with the side and above surface of the sample, and
is the thickness of the bottom layer (
Figure 6). The ratios
,
and
are size-independent but dependent on the shape of the sample; therefore,
is size-independent.
5.2. Heat Production
Geopolymerization can be considered a succession of three consecutive reactions (the data regarding heat release and the kinetics of geopolymerization were derived from the studies of [
31,
32], which provide a detailed characterization of the reaction mechanisms and their thermodynamic evolution):
- (1)
First, OH
- ions of the alkaline solution break down the bonds of SiO
2 and Al
2O
3 of the metakaolin powder, forming silicium and aluminum ions/complexes (Equation (9)). The dissolution rate is dictated by the basicity and temperature of the solution. Moderate heat is released (15–20 kJ/kg of metakaolin):
- (2)
Si and Al ions relocate to form oligomers (Equation (10)). Energy is released due to the formation of new stable Si-O-Al bonds (Na
+ ions balance Al
+3 in the Si
+4-based structure), releasing H
2O molecules. Most of the total heat is released (350–450 kJ/kg). The process takes from minutes to hours, depending on temperature and pH. The viscosity of the mixture increases, and water evaporation might occur:
- (3)
Oligomers bind together to form long and braided N-A-S-H chains. New Si-O-Al bonds are formed, and moderate energy is released (30–70 kJ/kg) over a long period of time (from hours to days). The solution hardens, and the solid matrix starts to form.
A precise model of all the above reactions requires the knowledge of all the kinetics parameters (reaction constants, reaction activation energies, and orders of the reactions) and a complex mathematical resolving algorithm, which are out of the scope of this work. Therefore, the phenomenon is simplistically approximated as a first-order reaction compared to metakaolin. Even if the temperature varies from 30 °C up to 100 °C, the kinetic reaction constant c is considered temperature independent and calculated at the average value to provide an explicit solution of the equation. The evolution of the mass of the metakaolin powder
can be described by Equation (11), where
is a macroscopic parameter that quantifies the reaction rate of the geopolymerization:
giving as the solution, Equation (12):
The power released
can be then evaluated following Equation (13):
where
is the energy released in the reaction per unit mass of powder, and
is the specific constant of the geopolymerization reaction, which quantifies the power released per unit mass of metakaolin. The heat generation from the geopolymerization reaction is, therefore, spatially homogeneous, and it exponentially decays over time.
5.3. Energy Balance
The increase in thermal energy of the system is described by Equation (14), where
is the mass of the water solution,
is the heat capacity of the system,
is the heat capacity of the metakaolin powder, and
is the heat capacity of the water solution:
The thermal capacity of water is dominant, so the metakaolin thermal capacity can be neglected [
33]. Defining the parameter
as the weight ratio between the solution mass and the metakaolin powder mass, Equations (15) and (16) are derived:
Equations (17) and (18) describe the thermal balance of the drum during the formation of the geopolymer:
Naming
and introducing the parameters
(Equation (19)) and
(Equation (20)) for compactness, we get Equations (21) and (22):
Equation (23) shows the solution of the first-order differential equation, considering the initial condition (
):
Note that the parameter represents the ratio between heat dissipation and thermal inertia, whereas represents the heat generation over thermal inertia, and quantifies the geopolymerization reaction rate. Both and are intensive parameters, namely:
depends only on the metakaolin used. If the same batch is used, remains the same.
depends on the metakaolin used and the initial water content W/S. If the same recipe is used, is preserved.
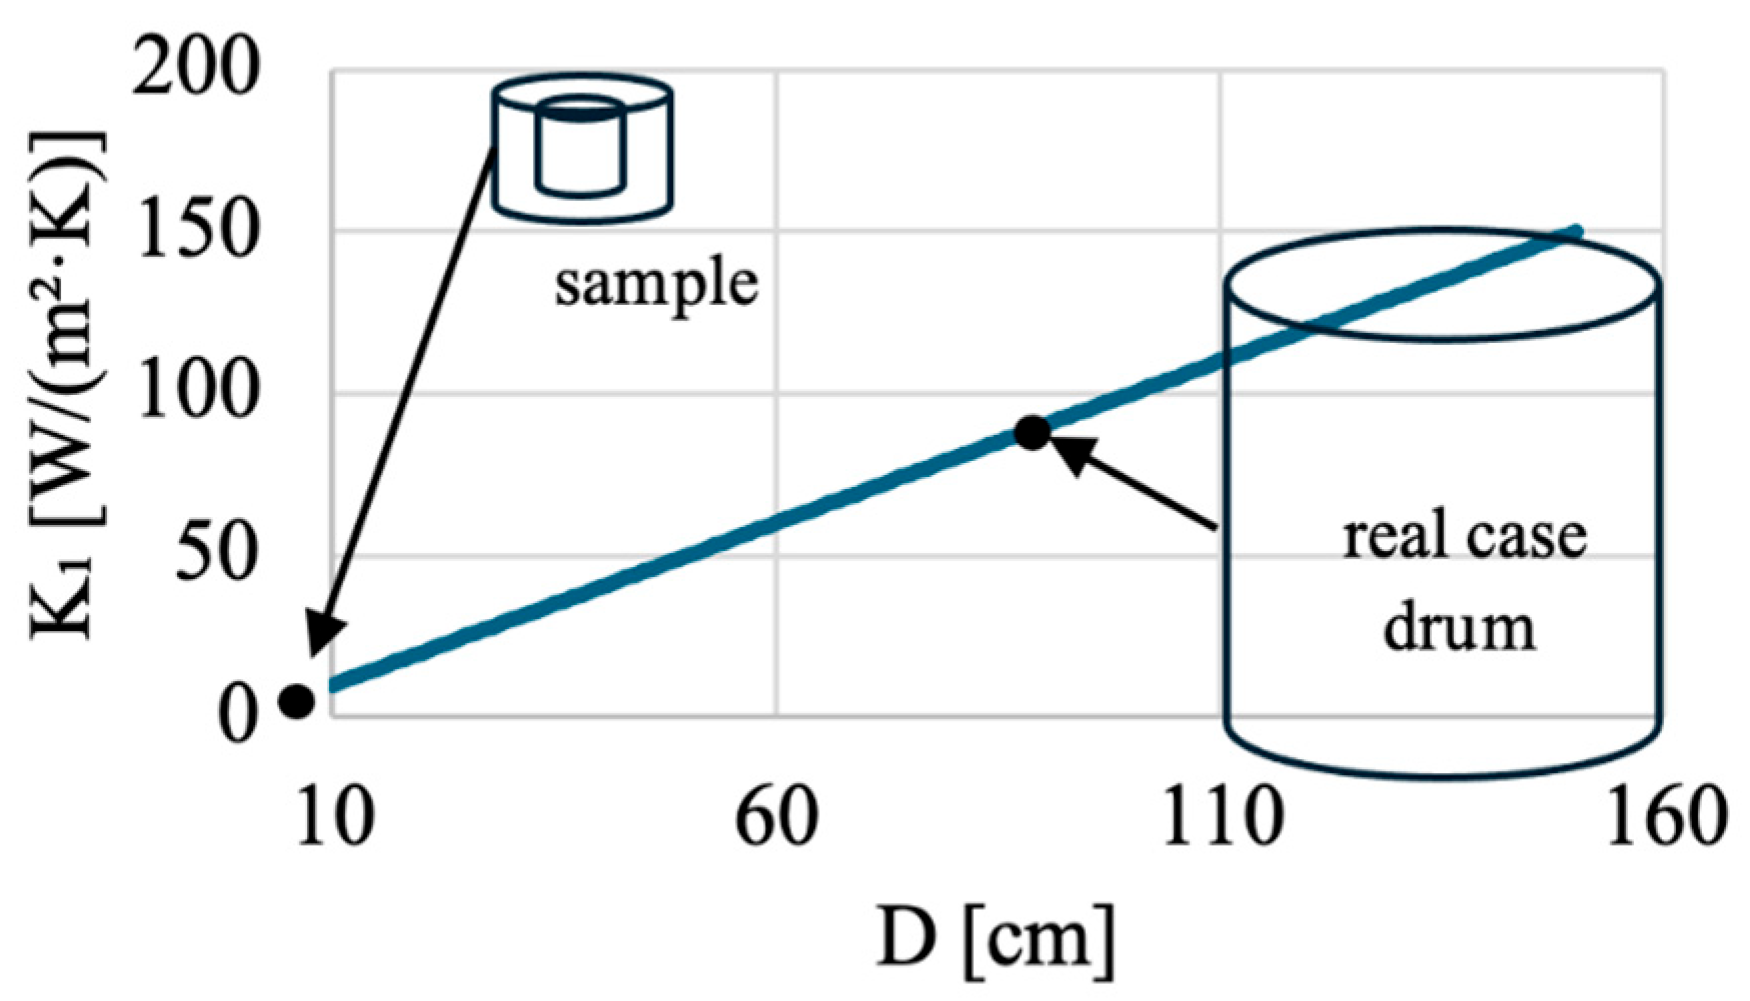
Neither nor depends on the scale of the sample, while depends on the initial water content and the scale of the samples. The temperature evolution and the final geopolymer of real-case drums can be replicated with a smaller sample, as long as the three parameters , and are kept constant during the scale-up.
5.4. Comparison of the Model with Experiments
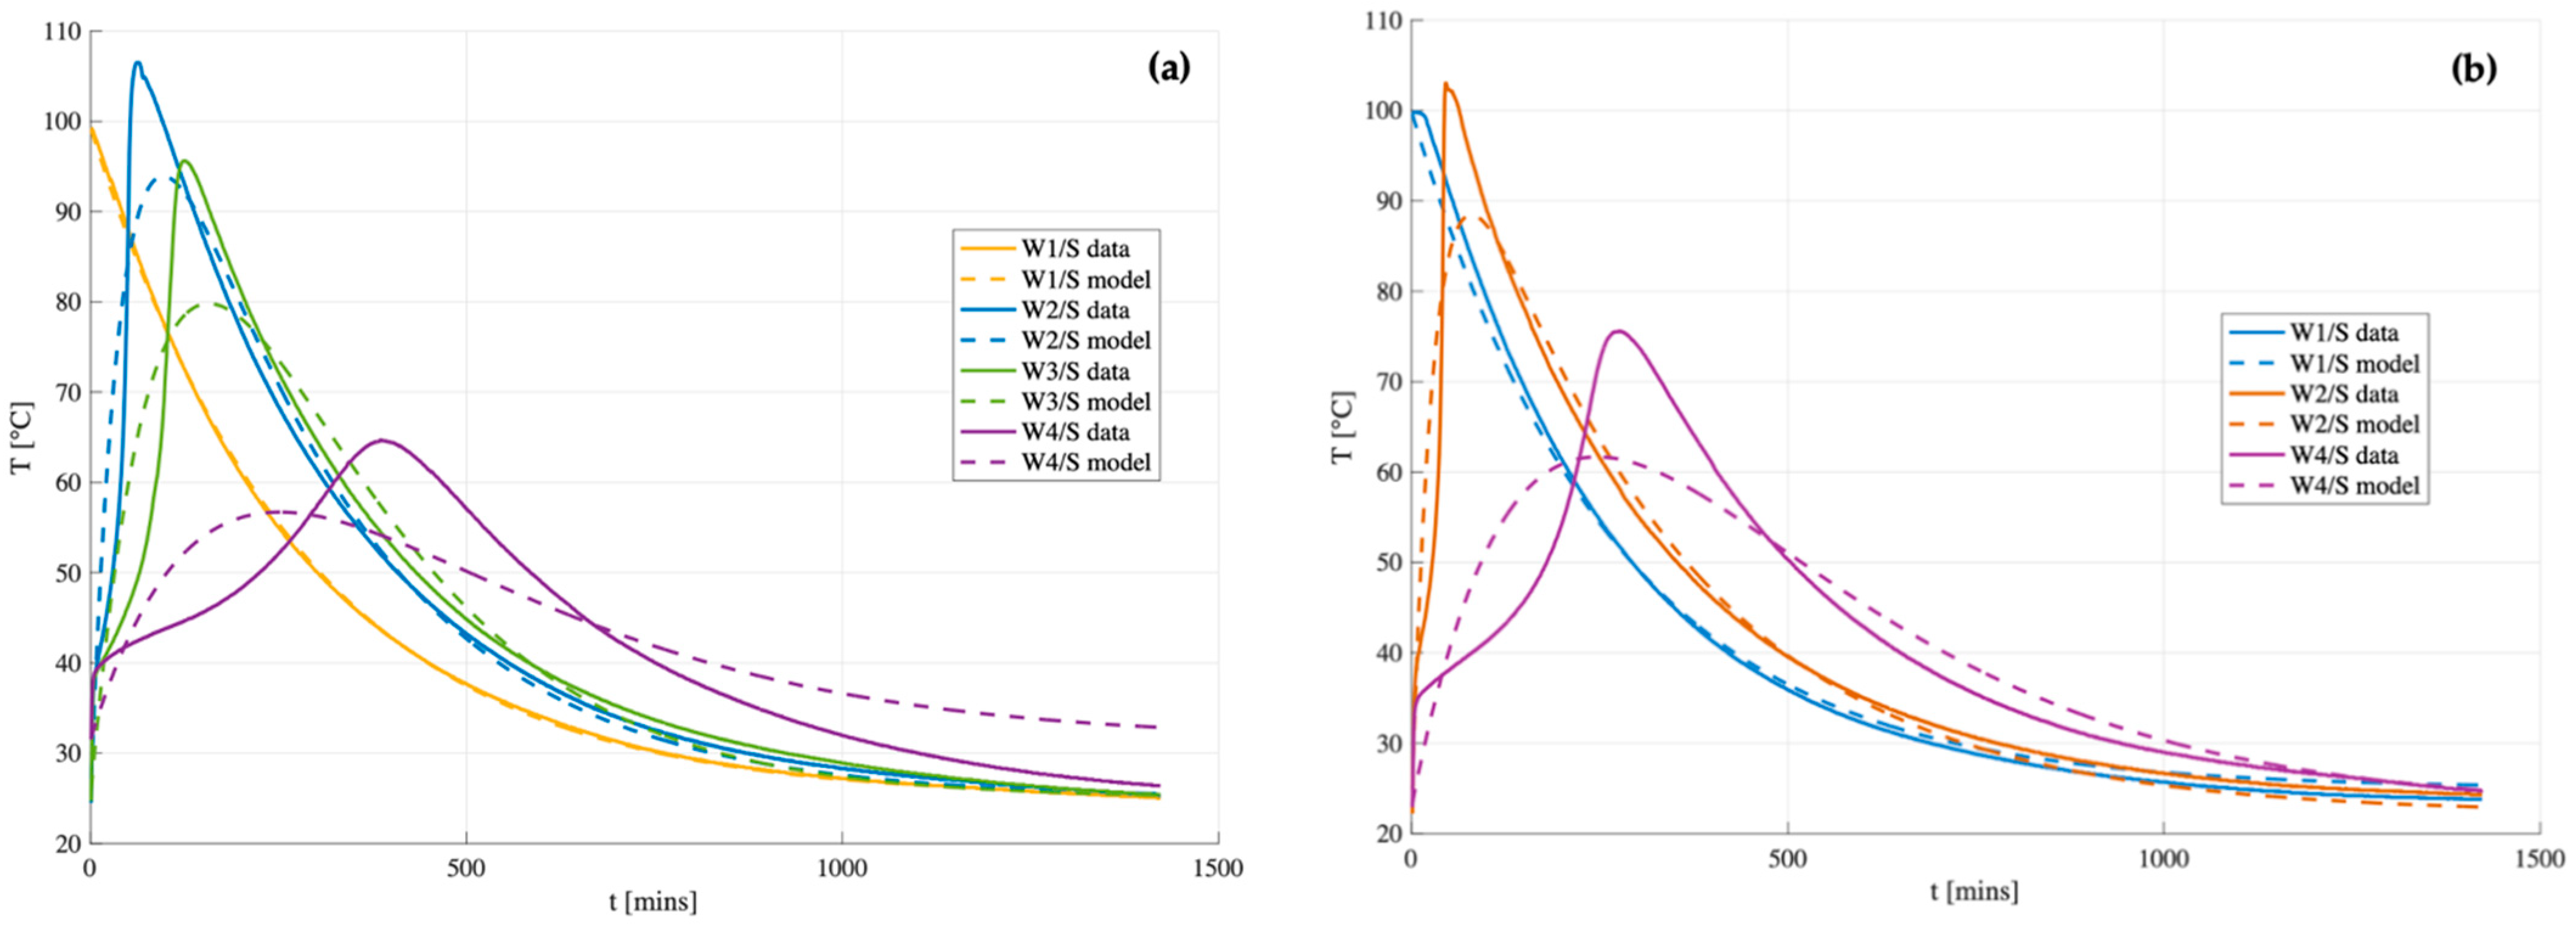
The model described above was compared to the experimental data of B1 and B2 geopolymers (
Figure 12) by best fitting the parameters
and
using the ordinary least squares (OLS) method over the full-time domain (from 0 to 1400 s) via the Excel Solver function. Once the optimal values of
and
were identified, the corresponding kinetic parameters
and
were derived for each case study, as summarized in
Table 5.
The results indicate a general qualitative agreement between the model and the measurement for samples with low water content (W/S 0.48 and W/S= 0.54), where temperature rises rapidly. However, the thermal runaway observed during Phase II is not captured by the model, likely due to the assumption of a temperature-independent reaction rate constant (). As a result, the model shows poor performance for matrices with higher water content (W/S = 0.59 and W/S = 0.65). Furthermore, experimental heat losses appear to be greater than those predicted by the model, leading to a steeper temperature decrease. This discrepancy is attributed to the fact that the global heat transfer coefficient () is temperature-dependent in reality, whereas it is assumed to be constant in the model.
For samples with W/S = 0.48, the peak temperature is reached rapidly during the paste mixing stage (within the first 5 min), prior to the insertion of the temperature probe. As a result, no data are available for Phases I and II, and only Phase III (the cooling phase) is used for model fitting. Under the assumption that the reaction is complete after the first 5 min, the probe records only the subsequent cooling behavior, allowing for the estimation of the global heat transfer coefficient
, as reported in
Table 5. The
values obtained for the two samples are very similar, as expected, given their comparable geometry and identical cooling conditions.
It is observed that in matrices with lower water content (W/S = 0.54), and thus more pronounced temperature evolution, both and (the reaction specific constant) are higher than those computed for W/S = 0.65. This suggests a faster energy release and a more efficient heat dissipation. The coefficient , on the other hand, is temperature-independent and remains nearly constant across the samples. This indicates that the reaction rate of metakaolin is largely unaffected by temperature and water content and appears to be similar for both B1 and B2. Dividing by yields the energy released per unit mass of metakaolin (Equation (13)), which serves as a useful indicator of the system’s exothermicity. The results show that higher water content correlates with lower energy release, while B2 exhibits greater energy release than B1, further supporting its higher reactivity. It should be noted, however, that the model represents a simplified approximation of the system and is not intended to reproduce the detailed thermal evolution of all reaction phases. Rather, it provides a reliable estimate of the average matrix temperature during geopolymerization as a function of key formulation parameters, such as water content.
5.5. Scale-Up Principle
The values of and of Equation (23), evaluated by fitting the experimental temperature evolution of a lab scale drum with the model described above, can be used to figure out a scaling-up methodology for the 220-L drum.
During the scaling up, the value of
must be preserved (Equation (24)) to keep the same temperature evolution during geopolymer formation. If the same geopolymer formulation is used (consistent with keeping the same
and
parameters), and the initial water content (
) and the density (
) of the geopolymer are preserved, and Equation (24) simplifies to Equation (25). If the proportions of the drums are preserved (
), it further simplifies to Equation (26).
Figure 13 shows that the smaller the sample is, the more insulated it must be:
6. Conclusions
Two batches of metakaolin were experimentally evaluated (considering water content, leachability, compressive strength, and temperature evolution during geopolymerization) to assess the reproducibility of geopolymer properties under identical processing conditions. Although the two batches exhibited nearly identical chemical composition and BET surface area, the resulting geopolymers showed marked differences in mechanical performance. In contrast, only modest differences were observed in water permeability, and no significant variation was detected in strontium leaching between specimens from the two batches. Despite the limited number of samples in this study, it is confirmed that ensuring reproducibility at larger production scales requires more than simply controlling chemical composition, surface area, processing parameters, and alkaline solution formulation.
The analysis of temperature evolution during geopolymerization, along with its time derivatives, reveals that differences in metakaolin reactivity play a key role in determining the final compressive strength. In order to achieve consistent chemo-mechanical properties in the final product, an essential requirement under the Radioactive Waste Acceptance Criteria for national disposal repositories, the selected metakaolin must also exhibit a similar thermal evolution during geopolymerization. To qualitatively predict the final compressive strength, temperature monitoring in the geopolymerization early stage has been proven to be a reliable, low-cost KPI, requiring only the insertion of a temperature probe into the fresh geopolymer paste and a 24 h observation period.
A simplified lumped model for the temperature evolution during geopolymerization, accounting for heat generation, dissipation, and accumulation, has been shown to qualitatively reproduce the measured temperature evolution during the geopolymerization early stage. The model is characterized by three key parameters ( and ), which represent the effects of the system scale, the water content, and the metakaolin reaction rate, respectively. Parameters and depend only on the formulation and the precursor batch and remain invariant across scales if the same recipe and metakaolin are used. Since reproducing the same temperature evolution during geopolymerization ensures consistent thermomechanical properties in the final geopolymer, preserving parameter , which is influenced by thermal dissipation and thermal inertia of the system, enables the replication of industrial curing evolution under lab-scale conditions.
This study suggests a rational framework for predicting the scalability and thermal behavior of geopolymers under near-adiabatic curing, ensuring that observed reactivity and mechanical properties are transferable to real-case large-scale applications. Experiments with full-scale drums could be replaced with properly insulated smaller samples, targeting, for the same metakaolin, the same value of the parameter . These insights are particularly relevant for processes such as the HYPEX® one, which aims to produce chemically stable and mechanically robust wasteforms for radioactive waste conditioning. To guarantee long-term reproducibility and quality of the geopolymer matrices used in HYPEX®, careful control of precursor reactivity, alongside chemical and physical parameters, must be implemented consistently across all production scales.
Future studies will focus in detail on expanding the database used in the present study by adding measurements on additional specimens from the same batches and data from different metakaolin batches to confirm the statistical significance of the presented results. A second line of future development concerns the model and aims to improve its quantitative agreement with the experiments, accounting for the sequential chemical reactions occurring during geopolymerization and considering the temperature dependence of the overall heat transfer coefficient.

