1. Introduction
It is recognized that any accidental release of radioactive materials from a nuclear power plant poses a potential risk, and this is considered during the facility’s design. Furthermore, security breaches can trigger emergency protocols within and outside a nuclear power plant (NPP) [
1]. However, responding to such incidents presents a significant challenge due to the initial lack of reliable information, particularly during the first days of the crisis. This information gap increases the likelihood of making incorrect decisions that could lead to costly remediation efforts. These actions may worsen the situation in various areas, including infrastructure, finances, politics, and public health. As a result, risk is a critical factor in the decision-making process, and it can be tailored to fit each specific scenario. For this study, the risk is addressed as a circumstance that could potentially harm the health of the population living near an NPP.
This research assessed the potential radiological hazards of the off-site release of radioactive material from an NPP. To achieve this, computational analytical models were applied as they enable the identification of possible health risks leading to the development of effective radiation safety measures. This study took a conservative approach to evaluate the consequences of a hypothetical accident at a Small Modulated Reactor (SMR) Pressurized Water Reactor (PWR) power plant without delving into the underlying causes that led to the accident’s occurrence. SMRs are emerging as a promising option for advanced energy technology, meeting safety, efficiency, and sustainability requirements in line with current nuclear power technology [
1]. The modular design of SMRs makes them versatile and easy to install in locations that pose challenges to traditional nuclear reactors. They may also provide a solution to energy generation challenges in hard-to-reach areas. Furthermore, their manufacturing cost and relatively short construction period make them an attractive option from an operational standpoint [
1].
This study’s hypothesis proposes that conservative computational modeling may be a valuable tool for conducting radiological risk assessments. The first few hours to days after an event can significantly affect the outcome. When accurate information is limited during the initial phase of a crisis response, a conservative radiological risk assessment is necessary to estimate immediate consequences. Based solely on simulated data, this study aimed to support decision making under an initial lack of accurate information. While prospective studies addressing similar problems considering actual data are desirable, this approach is beyond the scope of this work. Our approach is expected to be valuable in developing effective strategies for managing crises during the early evaluation phases under limited information.
This study utilized a Small Modular Reactor (SMR) as a model; however, the methodology and findings can be extrapolated to various types of nuclear power plants. This research was primarily concerned with the preliminary evaluation of the dispersion of radioactive substances and the potential impact on the environment, encompassing human populations and critical infrastructures.
Ultimately, this study’s main contribution lies in the possibility of using accessible computational resources to provide initial information in the face of a radiological or nuclear event that poses risks to the population.
2. Methodology
2.1. Computational Simulation I—Reactor Inventory
The simulation commences by depicting an inventory release from an SMR-type PWR reactor powered by 16 MWe (50 MWt) that was affected by instabilities, resulting in an accident that causes the release of radioactive materials. However, this study does not delve into the events that triggered the off-site release due to the inventory release. The accident was simulated using computer methods, considering a fuel enrichment level of 20% and computing the radionuclide inventory using the code SCALE (KENO VI and T6-DEPL) [
2]. The simulation assumed that the reactor operated at maximum capacity for two uninterrupted years, causing the Zircaloy-4 cladding to reach a temperature that exceeded its design specifications. This resulted in cavities that could potentially lead to physical ruptures due to the failure of the reactor’s neutron absorber control bars and bore water injection timing [
3]. The model also assumed that gaseous fission products were released into the atmosphere in puffs, with an initial contamination plume observable for ten minutes and projected for the next four days.
2.2. Computational Simulation II—Off-Site Release and Threat
The Lawrence Livermore Laboratory developed the HotSpot in the USA and used a simulation incorporating an analytical solution model to study a Gaussian dispersion of contaminants in three-dimensional space. The code’s interface is user-friendly, allowing for the input of relevant variables for a given study. To achieve greater accuracy, simulations should be conducted within a 10 km range, although range estimates can be made for inaction plumes that extend beyond hundreds of kilometers. This study considered a simulation routine that includes three radionuclides of biological significance, Cs-137, I-131, and Sr-90, identified by the software SCALE and combined in the mixed source term (
Table 1) for the HotSpot calculations.
To determine the threat posed by radiation doses and preferred wind directions, HotSpot Health Physics codes version 3.1.2 was used for computer simulations. The simulations account for local atmospheric stability, represented by the Pasquill–Gifford classes (PG classes) [
4] and variations in wind direction. This enables an evaluation of the impact of contaminated plumes in several directions, allowing for the identification of the most probable affected zones. This study assumed that the individual being modeled remains stationary downwind at an exact location throughout the passage of the radioactive plume, with a 10 min standard release duration [
5]. The HotSpot code, which simulates the spread of a contamination plume, assumed that the individual remained stationary at the specified locations during the 10 min observation period in this study. This analytical calculation, without real-time parameter adjustments or numerical simulations, provides adequate data for producing conservative forecasts. While less precise than results from numerical models such as Computational Fluid Dynamics (CFD), these forecasts can still offer valuable and timely guidance for initial response measures.
This study determined the worst-case scenario by varying the wind direction and selecting the direction under the highest total effective equivalent dose (TEDE) forecast. The wind speed was considered to be 3.0 m/s, which is identifiable in all PG classes. The data generated by the simulation form the basis of an assessment methodology that enables consequence modeling.
This study aimed to investigate the effects of an accidental release of radioactive materials from a reactor’s core inventory on the risk of cancer development and the challenges involved in responding to the early stages of the incident. The radioactive material responsible for the radiation dose can either be internal or external, and the total effective dose equivalent (TEDE) is the sum of the effective dose equivalent (EDE) from external exposure and the committed effective dose equivalent (CEDE) from internal exposure, which is the source of risk. The four main routes of contamination are inhalation, ingestion, injection, and absorption through the skin and eyes (mucosa). External exposure refers to radiation exposure from radioactive materials in the soil or air or adhering to clothing or body surfaces [
6]. On the other hand, internal exposure may occur due to ingesting radioactive materials with food, breathing (inhalation), skin absorption, penetration through a wound, and the administration of radiopharmaceuticals. This study considered a four-day timeframe during which food must be consumed outside contaminated areas or from safe zones. No effects from contaminated food chains were considered in this study.
The Hotspot code processes input data within a 10 min observation window from the release event. Unlike numerical models, Hotspot freezes the parameters and then provides a prognosis for 4 days (as per this study). This operational mode ensures the almost instant availability of results, despite the highly associated uncertainties and the conservative nature of the simulation.
The TEDE is the most comprehensive expression of the combined dose from all applicable delivery pathways, and the concept was first introduced by the US Nuclear Regulatory Commission (NRC) in line with the definition provided by the International Commission on Radiological Protection (ICRP) for effective dose equivalents [
7,
8].
The use of the TEDE to assess cancer risk based on these factors may not meet all the requirements for a comprehensive radiation risk assessment, but it can still be useful for making initial risk comparisons. The concept of an effective dose is typically used to predict cancer risk in general, based on reference models rather than for individual subjects, as is performed in the field of medical physics [
9].
It is considered that radioactive material may have been released into the external environment through the existing venting system in the reactor building, which is 10 m above ground. This material is expected to form a plume of contamination from the NPP and be carried by the wind. To determine the wind direction that could cause the highest TEDE, we simulated both the wind direction and the atmospheric stability conditions (PG classes) in combination with using HotSpot. Our analysis identified the SSW direction as the most conservative (higher values of TEDE). After the event, the selected source term [
10] included Cs-137, I-131, and Sr-90. The radioactive isotope Sr-90 has a lengthy biological half-life (approximately 18 years) within the human body. Because of its chemical resemblance to calcium, it builds up in bones and emits radiation to the bone marrow, making it highly radioactive. Also, compared to volatile radioisotopes of Cs-137 released into the atmosphere, non-volatile Sr-90 emission has been estimated to be two orders lower [
11]. Evaluating Sr-90 in the event of a nuclear disaster can be considered crucial not because of the external exposure it may produce, but because of its ability to enter the human body through the food chain at later stages following an off-site nuclear release.
The boundaries of the radioactive plumes were defined and categorized based on specific limits based on the EPA [
6] and Thaul S and colleagues’ findings [
12]. For this study, these limits were inner (700 mSv, deterministic effects expected), middle (100 mSv, requiring emergency action), and outer (50 mSv, considering evacuation). The HotSpot code considers PG class variations ranging from extremely unstable (class A) to extremely stable (class F).
Table 1 presents the primary input data for the HotSpot simulation, which assume a default sampling time of 10 min. It is worth noting that as the sampling time increases, the source term concentrations downwind decrease, as pointed out by Slade [
13]. To be cautious, our calculations assume the time of the highest expected concentrations. HotSpot features a specific module for inputting meteorological data, which calculates the 95th percentile of the TEDE distribution in each of the 16 sectors of wind directions (22.5° per sector). As this study does not refer to a particular site, only HotSpot’s library data were used for an example of their application. The sequential data file of HotSpot’s internal library contains hourly meteorological data for the year 2000 at the U.S. Department of Energy’s Savannah River Site (SRS). Based on this, HotSpot can output that the 95th percentile of the TEDE for the wind direction sector of 22.5° 1 km to the north (sector 1) results in a radiation dose of 2 mSv. This means that the TEDE in sector 1 at a radial distance downwind of 1 km would exceed 2 mSv in only 5% of the hourly meteorological observations.
The PG classes in the HotSpot routines are determined according to the criteria proposed by Turner and colleagues [
14], which consider aspects of solar radiation that can be affected by cloud cover. These classifications are widely used in meteorological studies. In HotSpot’s algorithmic calculations, wind speed and the local PG class are the main variables. In the context of contamination plume propagation, the HotSpot routines calculate the standard deviation (σ
θ) for the wind slope (in radians) for each direction. This value is used to characterize the wind direction variability, which is the primary variable used to categorize PG classes [
14].
2.3. Radiological Risk Evaluation (Solid Cancer Risk)
This study evaluated the risk of developing solid cancer from whole-body exposure to radiation doses ranging from 100 to 700 mSv. The aim was to demonstrate the application of the assessment proposal. Other models for stochastic effects are also accessible, covering various exposure ranges [
6]. These models may be utilized as needed to substitute the model evaluated in this study.
Based on the Japanese Radiation Effects Research Foundation (RERF) model from 1996 [
15], Equation (1) is presented. The HotSpot TEDE calculation was utilized as input data to solve the relative risk equation for solid cancers. It pertains to whole-body doses and values below 4 Sv, which is the average lethal dose leading to death in 50% of the exposed human population within 30 days (LD
50/30) without any medical assistance [
16].
Here, r0(a,s) is the basic incidence rate of morbidity in the potentially affected population in the absence of irradiation, αS is the age-specific linear excess relative risk per Gy being considered, 0.45 (Gy−1) and 0.77 (Gy−1) for male and female, respectively. D is the dose (Gy), e is the age (years) at exposure, and β is the coefficient determining the modifying effect of age at exposure, considered as −0.026 (y−1) for both sexes.
The level of risk associated with radiation exposure, as measured by the relative risk (RR), can be influenced by local atmospheric stability (PG classes) due to the varying concentration of radioactive material, which determines the TEDE. As an example of the application of risk levels assessment, Equation (1) focuses on two age groups—young (20) and elderly (70)—as these groups show more significant variations in RR when the age group is considered to be isolated.
In estimating the areas of plumes or zones of interest, HotSpot is a valuable tool that provides a proportional factor to determine the potential size of affected populations. This is calculated by multiplying the area of the zone of interest by the local population density, which is assumed to be constant for conservativeness. The calculations may include changes in regional atmospheric variables (PG classes) using an atmospheric data file provided by HotSpot. A standard deviation (SD) calculation for each location and PG class was introduced to evaluate how local atmospheric stability affects the radiological risk. Equation (2) outlines the method used to calculate the SD.
Here, n is the number of PG classes involved.
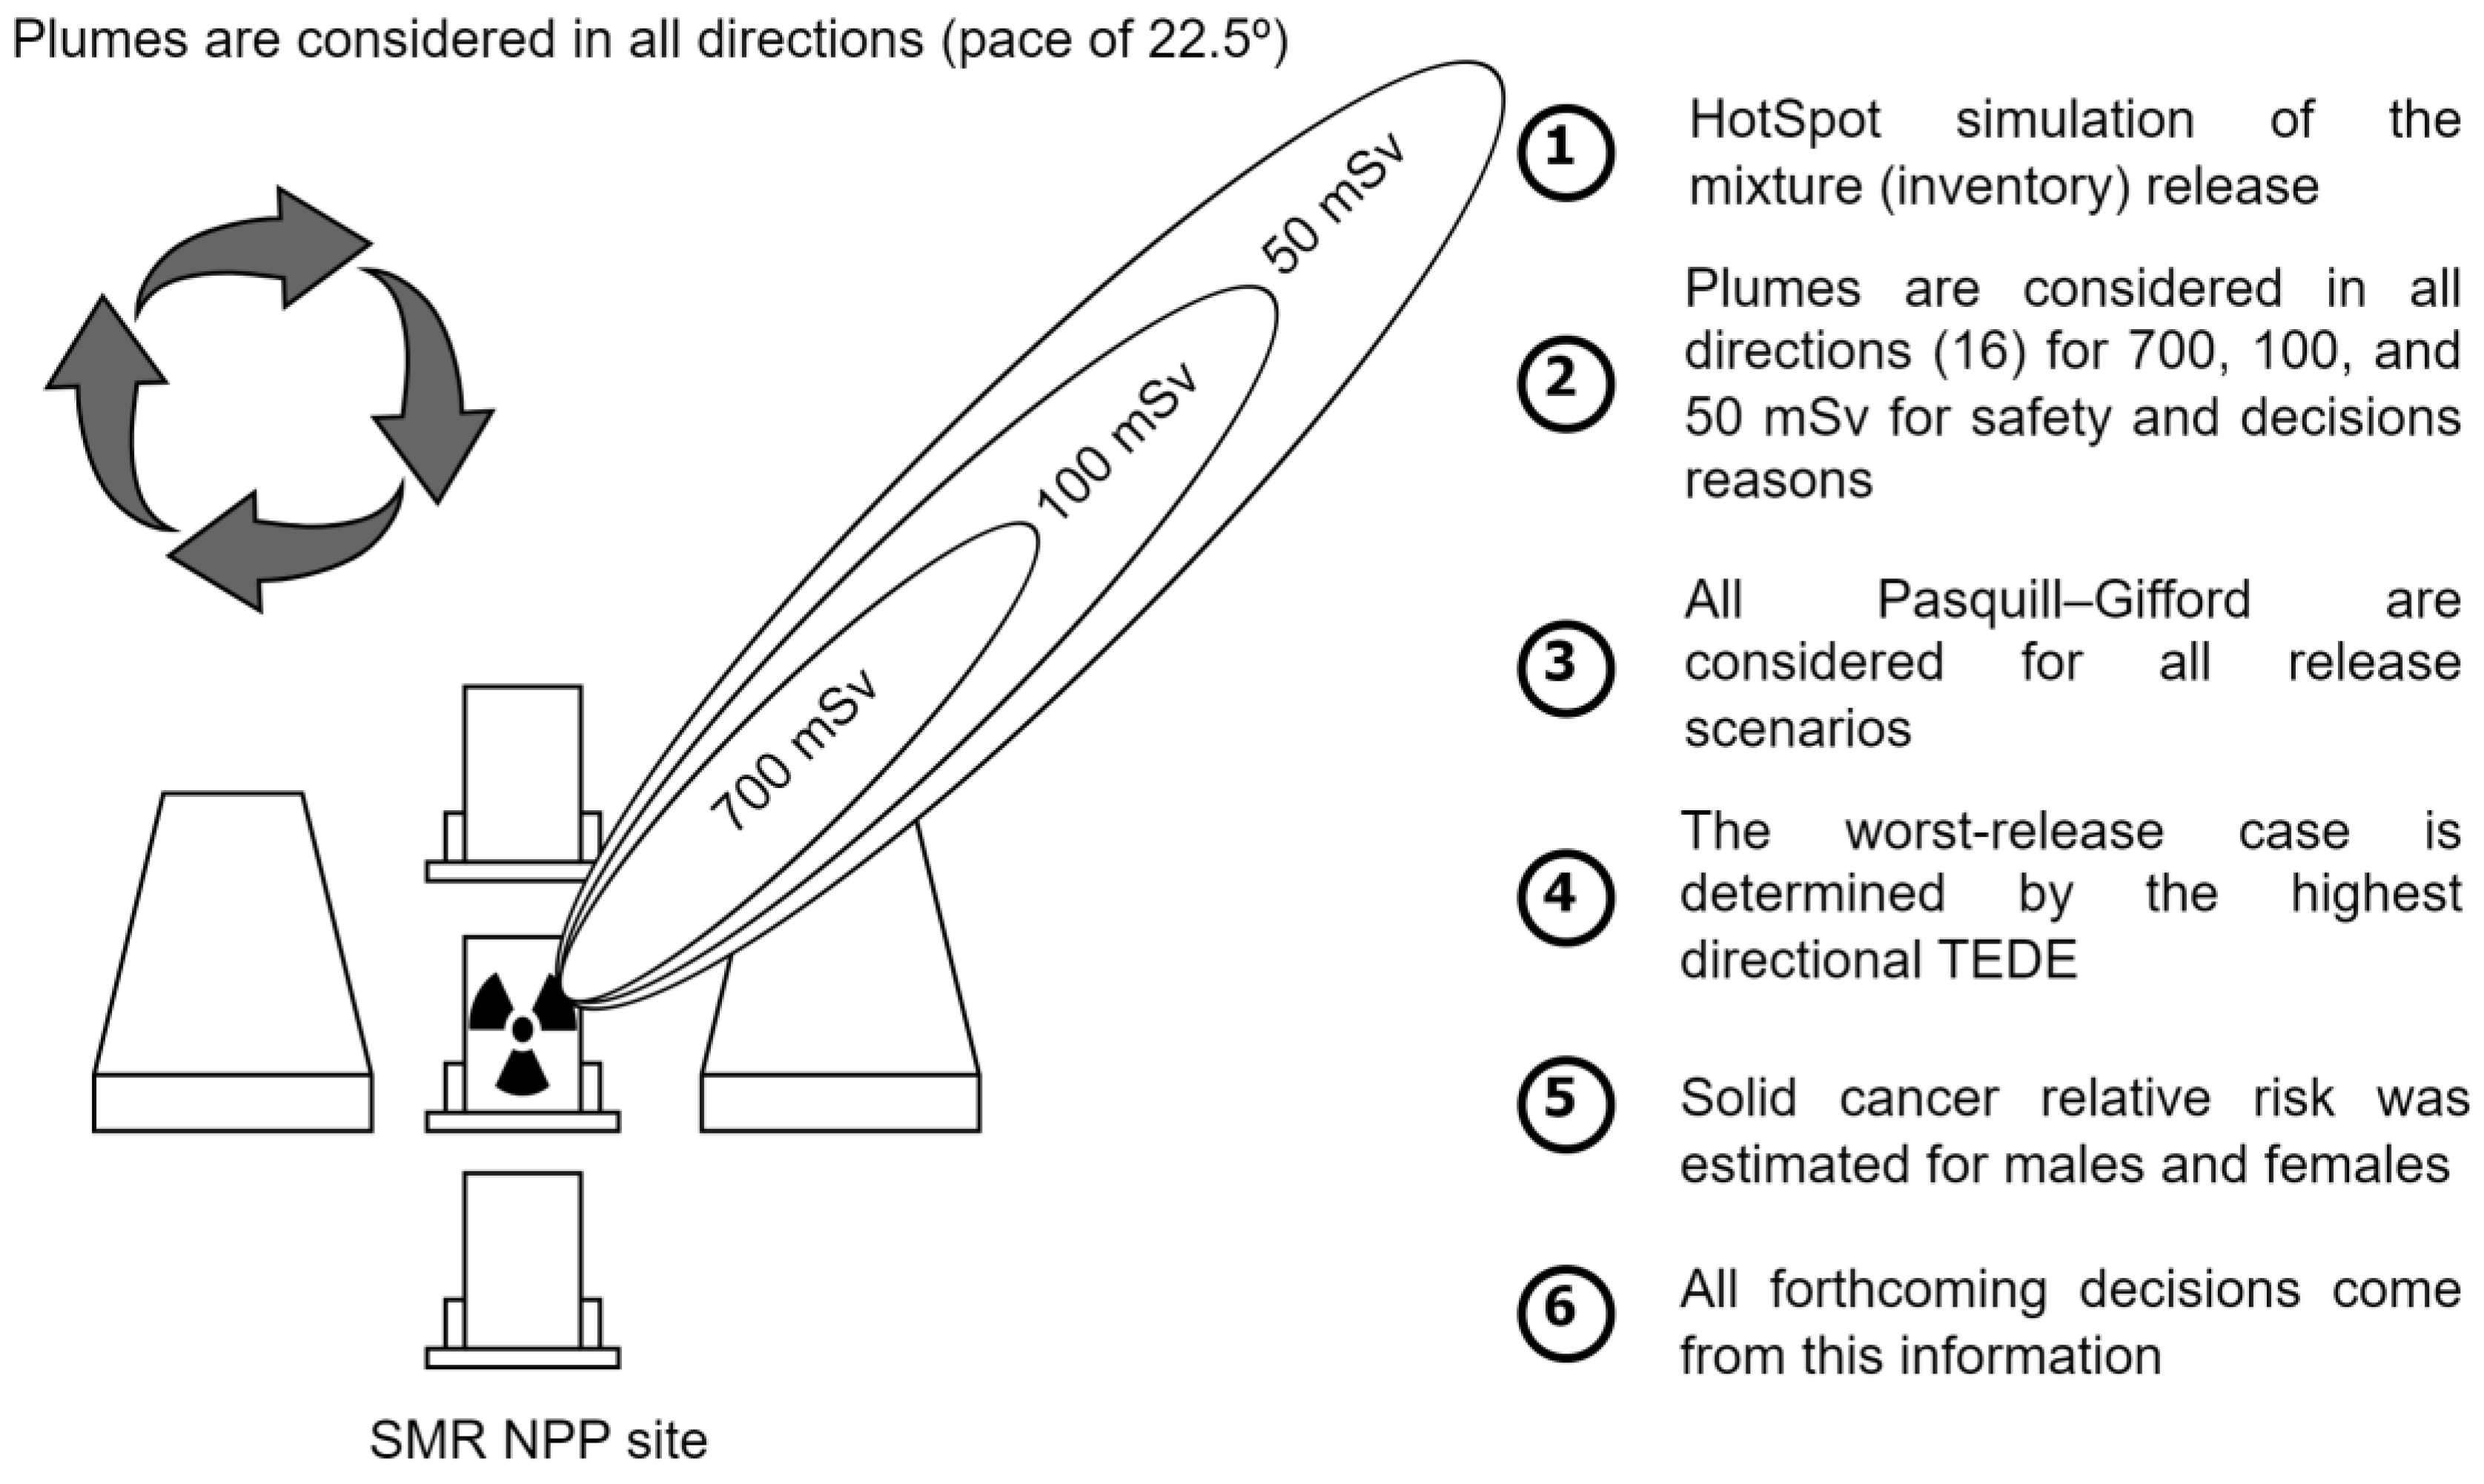
The methodology employed in this study is summarized and illustrated in
Figure 1, which showcases the SMR power plant in the vicinity through building illustrations. It is crucial to note that the buildings depicted are only for representation purposes and were not considered in the analytical calculations of HotSpot regarding the dispersion of the radioactive contamination plume.
3. Results and Discussion
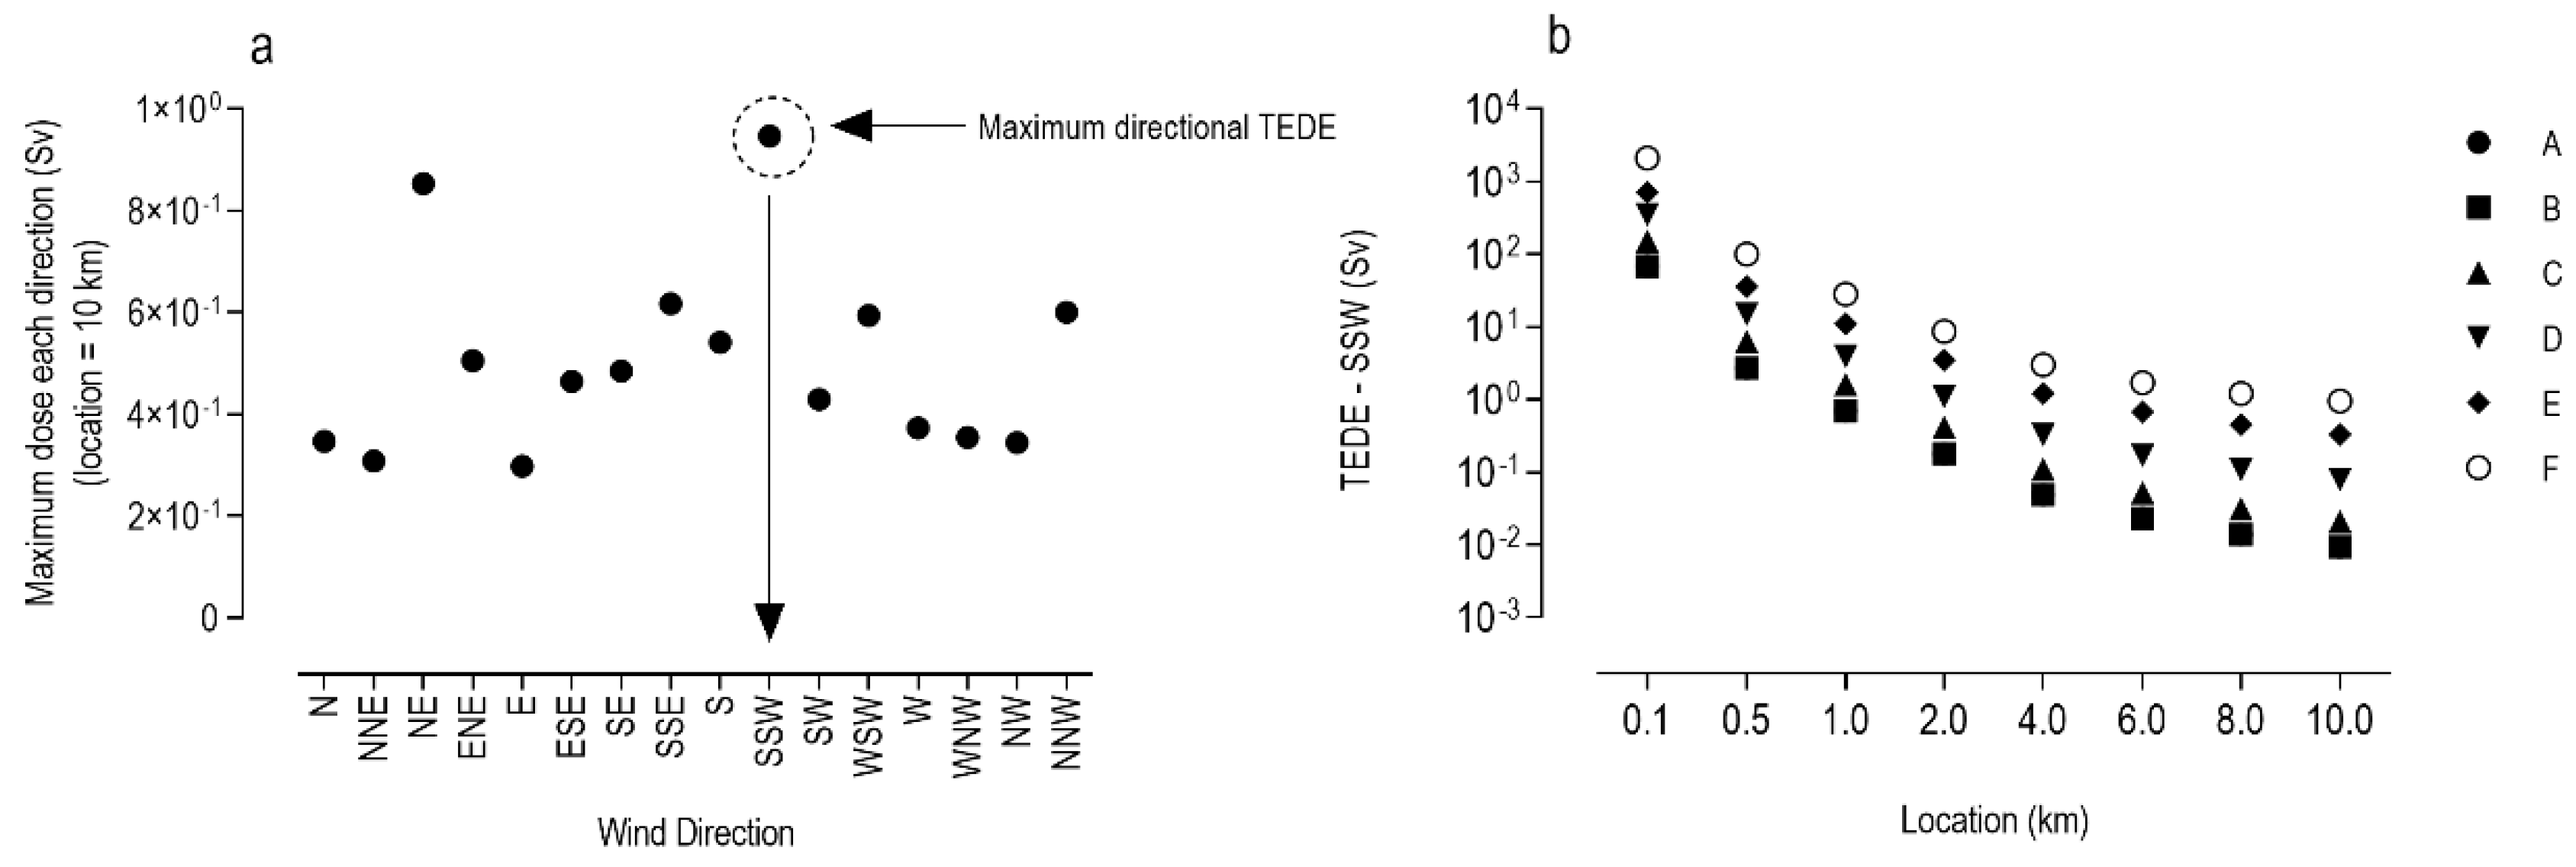
Figure 2a displays the maximum expected TEDE for each wind direction, while
Figure 2b focuses on the wind direction, SSW, that exhibited the highest TEDE value. This figure also shows the connection between the TEDE, location, and PG classes. Notably, due to similar atmospheric conditions, the results for PG classes A and B appear to overlap in
Figure 2b. The SSW wind direction may pose the highest threat, so it was chosen for modeling purposes. For constructing path structures for first responders, the wind direction E (East) poses the least risk and presents an interesting alternative. While access structures and pathways for accident response (local roads) should avoid SSW driving, evacuation routes may consider prioritizing the E (east) wind direction to minimize the risk of contamination. Merely considering the wind direction and potential variations in pollutant levels along its potential routes is insufficient for selecting a secure direction. One must also consider the impact of urban infrastructure on the retention of pollutants, the materials used in the construction, and the occupancy rate, among other relevant factors.
Figure 2b depicts the TEDE calculated for the SSW wind direction. It shows that as the contaminated plumes move away from the release site, the TEDE is reduced but under the significant influence of the PG classes. At longer distances, the impact of local weather conditions becomes more apparent. The distance between the graphic symbols representing each PG class verifies this. At a distance of 10 km, there is a significant difference in the TEDE, which is lessened by approximately two orders of magnitude. This information is essential for defining priorities, resource allocation, and logistics and offering the most appropriate type of assistance in each zone based on the prediction of public health risks introduced in this study based on the relative risk (RR).
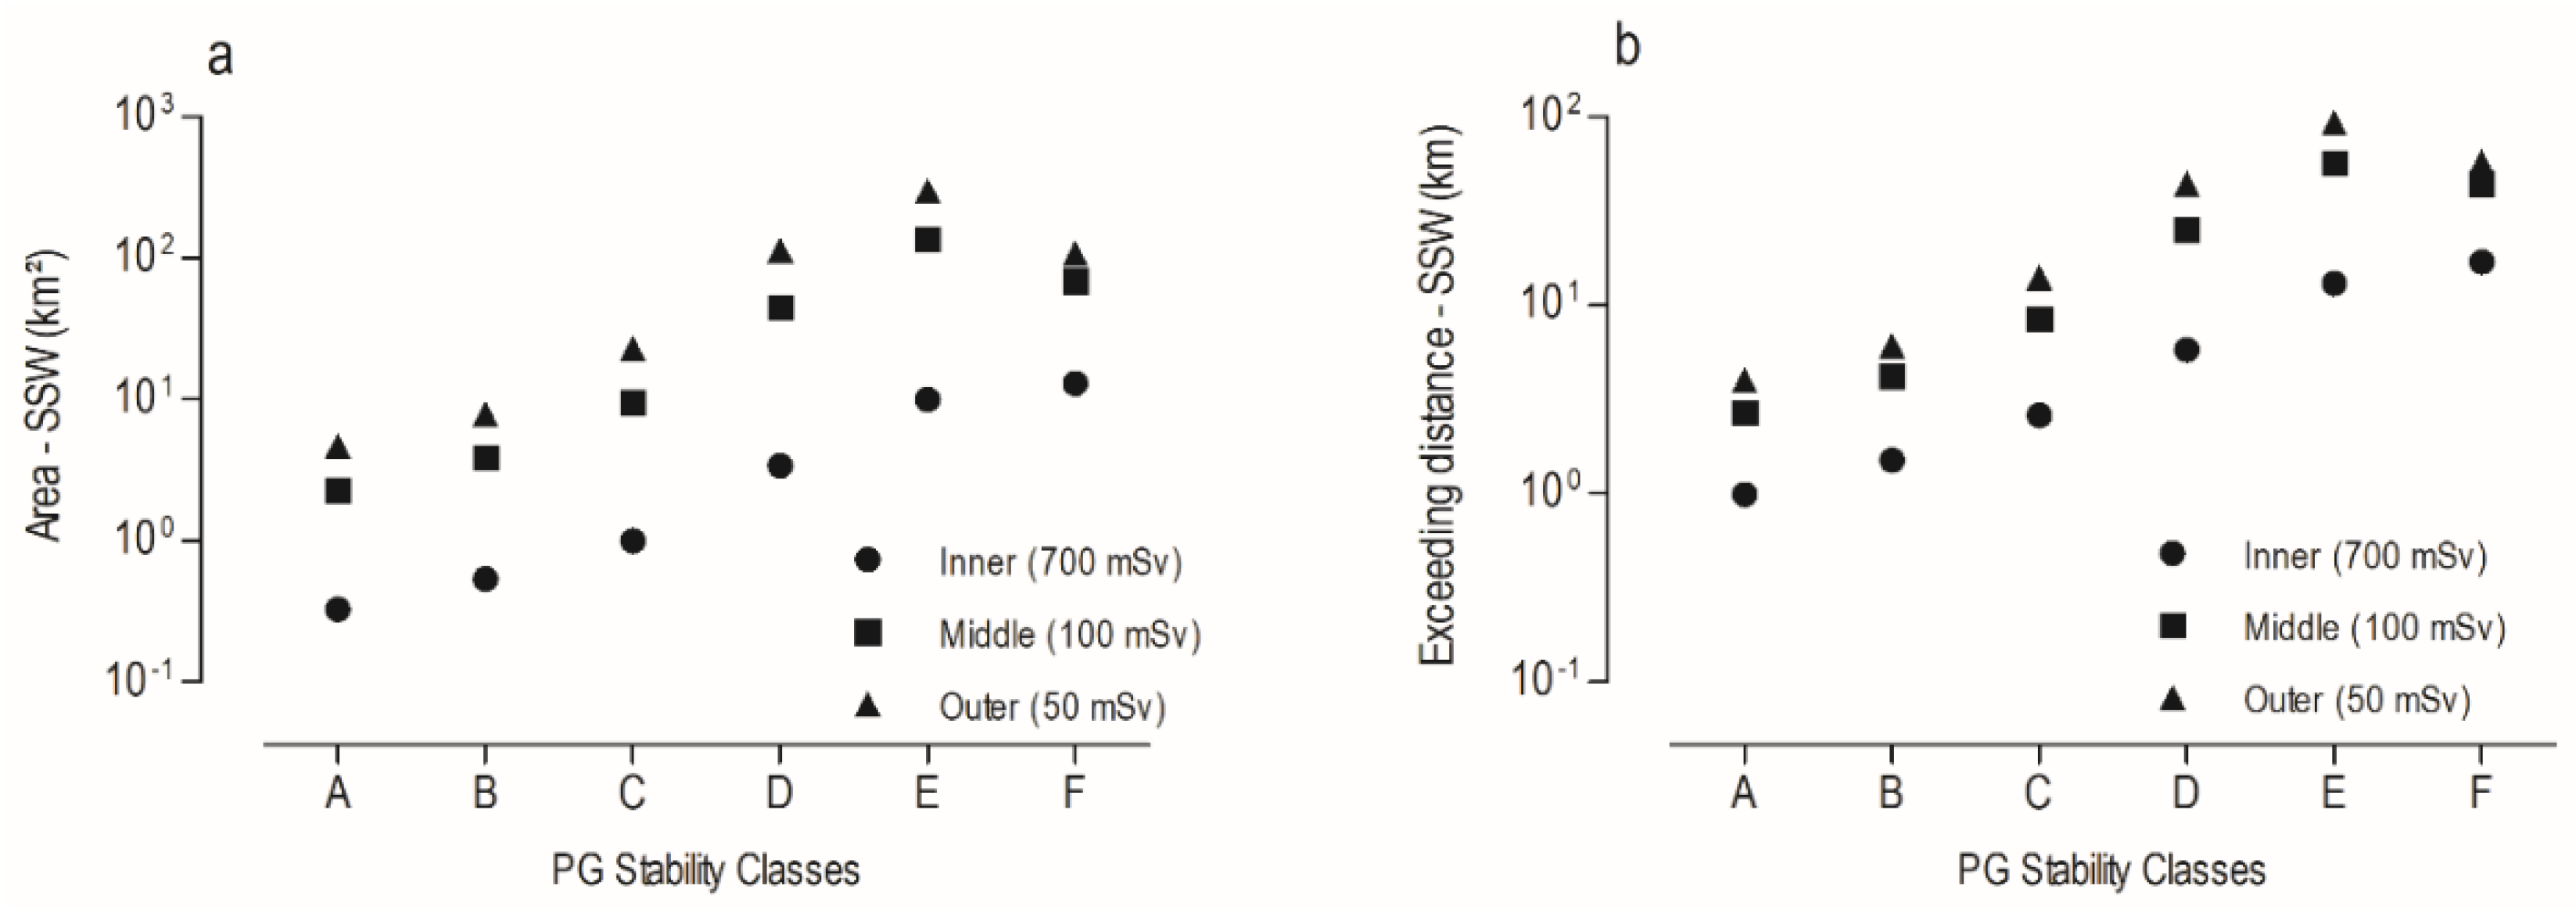
Figure 3a showcases the plume areas for the three zones of concern (700, 100, and 50 mSv) for every PG class, whereas
Figure 3b displays the furthest extent reached by the plumes in each PG class for each zone.
Figure 3a shows how the zones of interest (700, 100, and 50 mSv) evolve depending on the PG classes. Each zone (inner, middle, and outer) may experience significant variations, with the inner zone (700 mSv) posing the highest risk of deterministic effects independently of the age group [
10].
Figure 3b provides data on the plume range for each zone (inner, middle, and outer), with the inner zone distances varying within the 1 to 10 km range. Furthermore, PG classes may change during the response time, possibly leading to changes in the response strategy. Local atmospheric conditions play a critical role in determining the highest-risk groups.
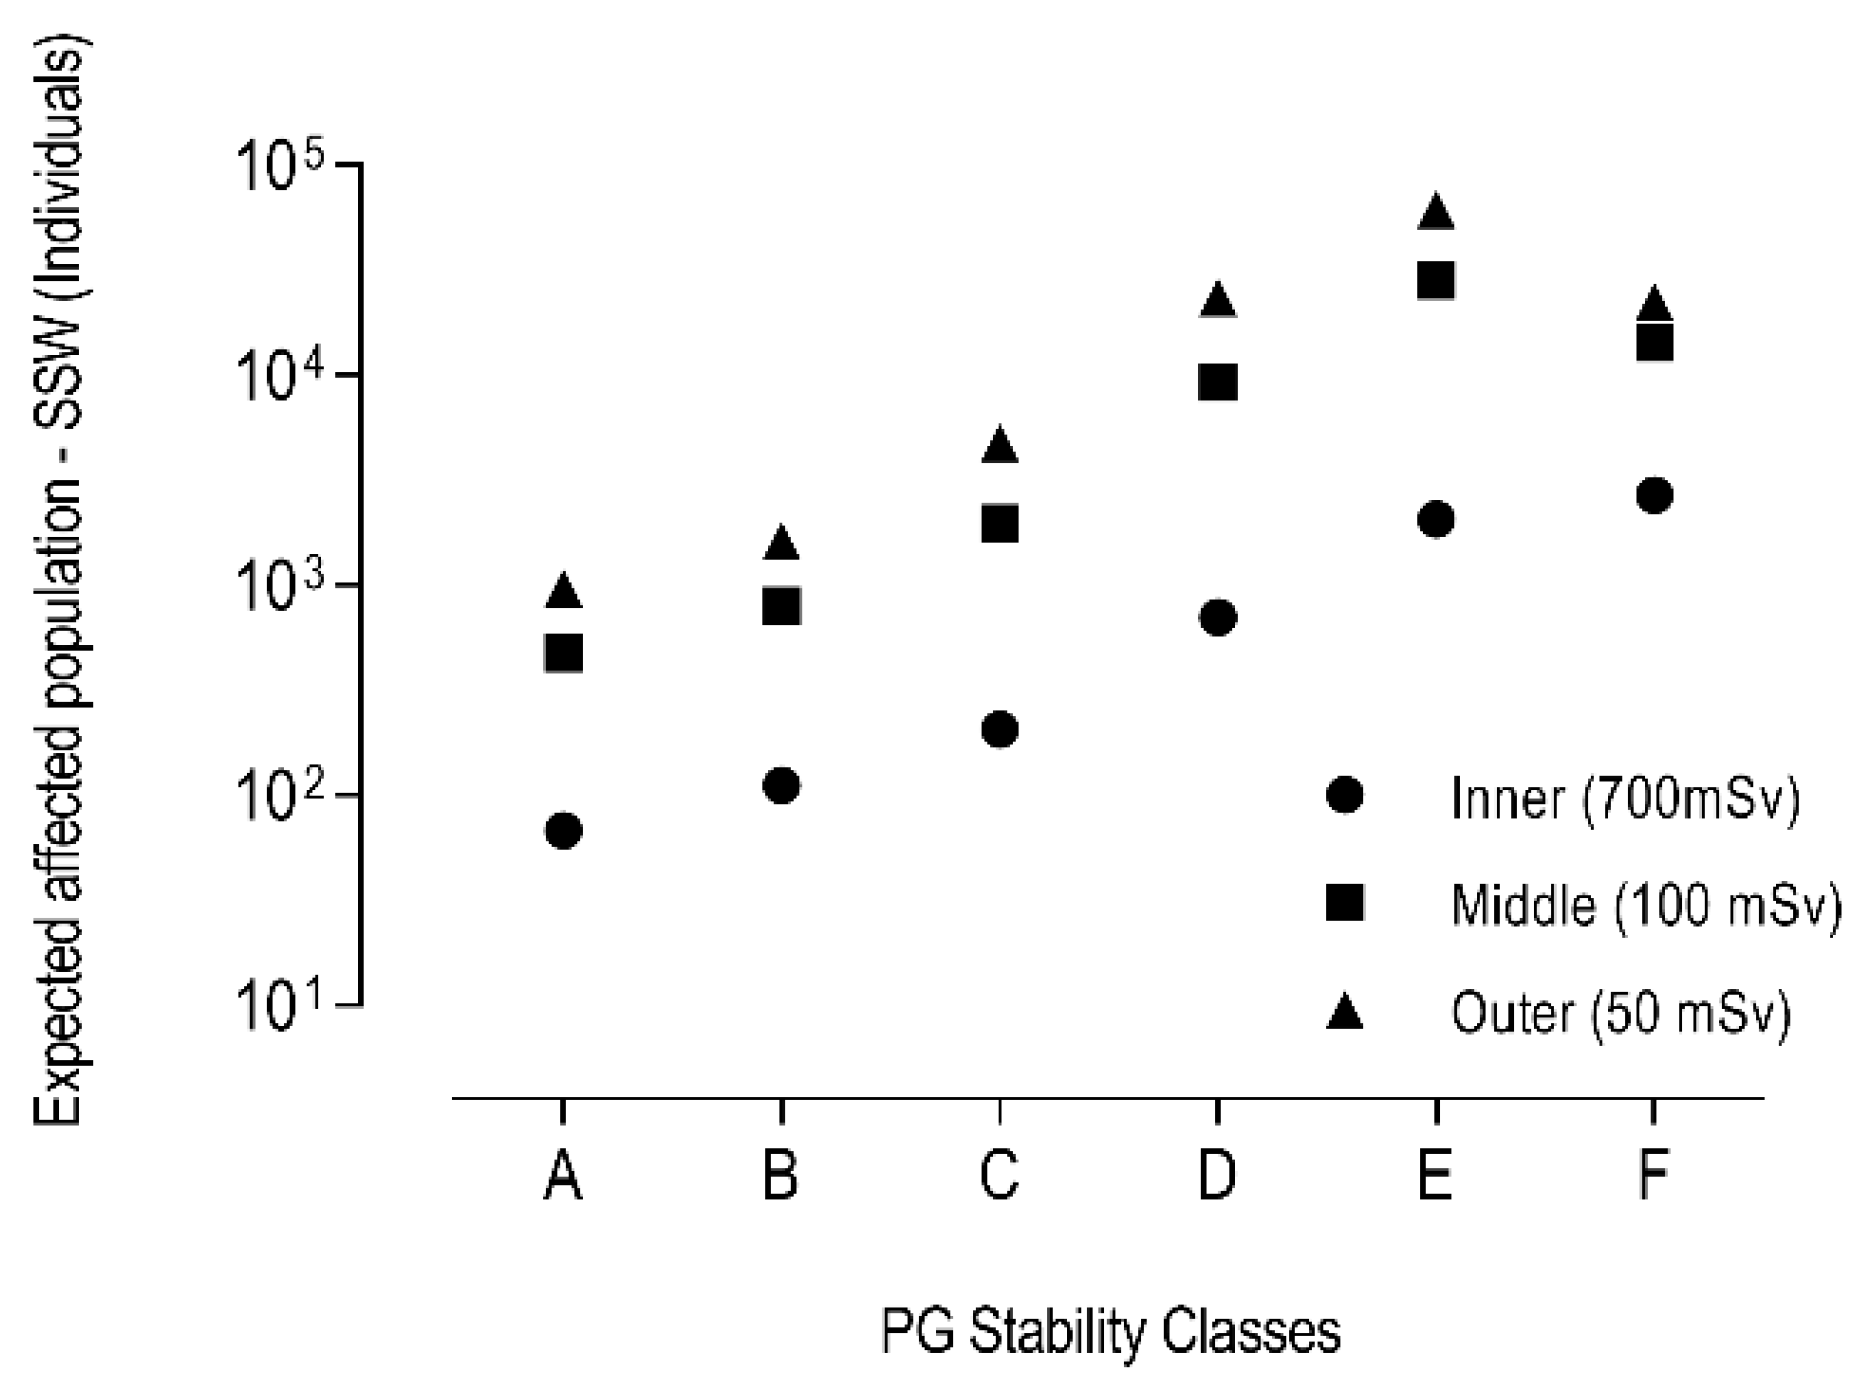
Figure 4 shows the potentially affected population within the zones of interest (700, 100, and 50 mSv) for all PG classes.
Figure 5a reflects the ongoing high population density estimated in the affected areas. Upon a closer examination of the TEDE in the SSW direction, it is clear that a change in PG class from A to F can result in a tenfold increase in threat (TEDE) in the same direction. These variations may not be evenly distributed, resulting in maximum TEDE levels that increase the risk for personnel and the public. To aid in understanding the level of sex equity in risk, a male-to-female ratio of the RR was implemented. A ratio closer to 1 indicates a higher degree of equity and can assist in prioritizing selection and boarding during evacuations. However, the impact of PG classes on the ratio varies by location. PG classes D, E, and F, within a range of 0.5 to 2.0 km, show an increased risk for females when the RR ratio is >1. Beyond 2 km, all PG classes pose higher risks for females.
Figure 5a,b depict the male-to-female RR ratio for solid cancer development caused by radiological exposure at 20 and 70 years for all PG locations and classes.
Figure 5 shows the male-to-female ratio for two age groups, 20 and 70, which can help develop evacuation plans for high-threat zones.
Figure 5a indicates that changes in PG class do not affect high-dose risks, and males are at a higher risk than females as the male-to-female ratio is higher than 1. In these zones, the TEDE is so high that epidemiological equations cannot predict the risks, making short-term mortality a significant concern.
Figure 5b illustrates that males of advanced age more than 4 km from the release site exhibit distinct ratios. This observed difference may be attributable to age-related biological factors and specific health conditions. Acknowledging that these factors may introduce biases that must be considered when making decisions is imperative. In
Figure 6, you will find the standard deviation (SD) calculations for relative risk (RR) based on PG classes and location for two specific age groups. Despite the inherent uncertainties in the assessment process of relative risk (RR), the information and insights provided by the data and behavior of the forecasts in
Figure 5a,b can significantly assist in making decisions concerning location, age, and sex.
Figure 6 illustrates the assessment of PG classes’ impact on the risk ratios seen in
Figure 5. The findings reveal that the standard deviation indicates a more significant influence of environmental conditions on both age groups, specifically up to a distance of 2 km. Beyond this point, the effect diminishes, and at 6 km, it reaches parity for both male and female models. However, beyond 6 km, the PG classes’ influence on the risk ratios becomes more critical for younger individuals, counteracting the trend of the previous stage. This valuable insight can aid in outlining effective evacuation prioritization strategies. The main information contained in
Figure 2,
Figure 3,
Figure 4 and
Figure 5 can be summarized as follows:
- (a)
Details about the most critical case for directional TEDE and its impact on the expected TEDE at each location of interest in the wind direction with the highest exposure estimate (
Figure 2).
- (b)
An estimation of the effect of variations in local atmospheric stability classes on radiological exposures at each position and in the wind direction with the greatest impact on the TEDE (
Figure 2).
- (c)
An estimation of the evolution of the areas of each contaminated plume under isodoses of 700, 100, and 50 mSv and over their ranges, considering the major axes of the ellipses in the preferred direction (
Figure 3).
- (d)
An estimation of the size of the affected population within the contaminated plumes for each isodose and PG class (
Figure 4).
- (e)
An analysis of the relative risk ratio (RR) in the male-to-female direction based on ages and the classes of local atmospheric stability. A wider data amplitude indicates a stronger local environmental influence on the risks, while an RR relationship closer to unity indicates a lower effect of sex on radiological risk.
Through applying mathematical interpretations, improved strategies may be devised to minimize health hazards and cut down on costs.
Table 2 illustrates the TEDE outcomes based on each PG class for all distances from the release point. It pinpoints the locations where Equation (1) is applicable, given that the TEDE is below 4 Sv for whole-body exposure—the results overview how the different PG classes impact the estimated TEDE at each location.
Based on the information in
Table 2, it is evident that as PG classes progress from A to F, the ability to predict epidemics diminishes, resulting in an increased need for evacuations due to higher TEDE exposure. The areas near 0.1 km for PG class A and 6 km for PG class F exhibit the highest exposure levels and should receive priority attention. On the other hand,
Table 2 also presents sectors where immediate deterministic effects are expected (TEDE > 4 Sv) for all PG classes. During the initial response phase, changes in PG classes may occur, which can impact the estimated exposure levels. On the contrary, based on radioepidemiology prognosis, certain areas may not currently experience imminent health risks or expected harm. Nevertheless, variations in PG classes may impact planning and logistical factors, especially in light of the possible extension of directly impacted regions.
This study yields findings that could serve as a fundamental rationale for potential future research in essential areas, such as (a) expanding studies to cover other types of radiological risk; (b) incorporating the calculation of doses from the food chain, including potential long-term health effects; (c) taking non-fixed meteorological conditions into account in cases where the study is conducted for a specific location; and (d) developing a more comprehensive framework for such calculations, with clearly defined criteria for what should be calculated and why.


