Article

Swelling of Highly Neutron Irradiated Beryllium and Titanium Beryllide

1
Karlsruhe Institute of Technology, Institute for Applied Materials, 76344 Karlsruhe, Germany
2
Nuclear Research and Consultancy Group, 1755 ZG Petten, The Netherlands
3
The European Joint Undertaking for ITER and the Development of Fusion Energy, 08019 Barcelona, Spain
*
Author to whom correspondence should be addressed.
J. Nucl. Eng. 2022, 3(4), 398-408; https://doi.org/10.3390/jne3040026
Submission received: 20 October 2022 / Revised: 22 November 2022 / Accepted: 23 November 2022 / Published: 28 November 2022

Abstract

:
The swelling of beryllium and titanium beryllide after irradiation at 70–750 °C to neutron fluences of (0.25–8) · 1022 cm−2 (E > 1 MeV) was measured using methods of immersion, dimension, and helium pycnometry. Dependences of the swelling on the irradiation temperature and neutron dose were plotted and analyzed. The dose dependences show linear dependences of the swelling for all irradiation temperatures except 70 °C, where the swelling rate varies, depending on increasing neutron dose. Be-7Ti shows much less swelling than pure Be. Irradiation at 430–750 °C to neutron fluence of 1.82 · 1022 cm−2 (E > 1 MeV) leads to swelling of Be at about 50%; for Be-7Ti, it is 2.7%. The microstructure study shows that the formation of bubbles and pores in beryllium occurs much more intense than in titanium beryllide.

1. Introduction

Beryllium-based materials, both pure beryllium and intermetallic compounds such as beryllides, possess unique nuclear physical properties, which currently allows them to be widely used as reflectors and moderators [1,2,3,4] in material testing nuclear reactors (beryllium) and as neutron multipliers in the future projects of European Helium Cooled Pebble Bed (HCPB) concept of ITER (beryllium and titanium beryllide as pebbles or blocks) and DEMO (titanium beryllide) blankets [5,6,7,8,9,10]. Beryllium transmutes under neutron irradiation into helium and tritium [11] that causes dimensional instability of beryllium products due to swelling. The swelling of neutron-irradiated uranium fuel was discovered in the early 1950s [12]. Barnes [13] suggested and developed a model of the gas bubble swelling of crystal materials, which contain transmuted inert gases such as helium. The first evidence of beryllium swelling dates back to the late 1950s and the early 1960s [11,14,15]. Goltsev [16] and Sernyaev [17] summarized and systematized the most important data on long-term radiation testing of beryllium in nuclear reactors, including the swelling behavior. However, even presently, there are no sufficient results to describe the swelling phenomena from the designer point of view, i.e., to predict the swelling behavior of beryllium-based materials under high-dose neutron irradiation.
The publications [18,19,20,21] recognized correlations between beryllium swelling on irradiation temperature and neutron dose. Goltsev [16] noted that at low-temperature irradiation, the gas atoms are practically immobile in beryllium. Therefore, the swelling S can be determined by the expression:
S = 8.2 × 10⁻²⁵ × F,
where F, cm−2 is the fast neutron fluence, E > 0.85 MeV. This correlation is based on the results obtained after irradiation at 60 °C, but it can be also used in the temperature range when helium atoms are in the supersaturated solid solution, which means that the swelling linear correlates not only with the fast neutron fluence, but with the helium content as well. However, experimental data obtained later show that the correlation factor 8.2 × 10⁻²⁵ % · cm2 may not be valid for all beryllium materials used. For example, the swelling of modern beryllium grades which have fine grains, a more isotropic structure, and a lower content of impurities, has a lower value compared to that predicted by (1) [17].
Sannen [19] found a correlation between swelling S and helium content CHe for beryllium irradiated in the BR2 reactor at temperatures of 40–50 °C to fast neutron fluences of 0.97 · 1022 cm−2, 2.98 · 1022 cm−2, 4.67 · 1022 cm−2 (E > 1 MeV) corresponding 3850, 13,500, 20,000 appm of He productions, accordingly, followedby annealing at 473–1073 K for 1 h:
S = (1.19 ± 0.07) × 10−4 CHe + (1.20 ± 0.03) × 10−19 CHe2 × T4,
where S, % is the swelling, CHe, appm is the helium content, T, °C—the annealing temperature. This correlation includes two distinctive parts: a first linear part representing the neutron fluence-induced low-temperature swelling and a second part reflecting the enhancement of the swelling by the post-irradiation annealing process.
Beeston [20] investigated beryllium irradiated in the EBR-II reactor at temperatures of 427–550 °C to fluence of 1.2 · 1022 cm−2 (E > 1 MeV) (1850 appm He). The swelling S can be represented by the equation:
S = 1.83 × 10−58 × F2 × T4,
where F, cm−2 is the fluence of fast neutrons with E > 1 MeV, T, K is the irradiation temperature. Compared to (2), this correlation covers the higher temperature region at fast neutron fluences up to 1.2 · 1022 cm−2 (E > 1 MeV). At high temperatures, when helium and tritium mobility is high enough for the consolidation of gases into large bubbles, the swelling must increase both during high-temperature irradiation and during high-temperature annealing following low-temperature irradiation.
Sernyaev [17,21] suggested an expression for beryllium swelling S at high irradiation temperatures:
S = M × T × exp(−E/4kT) × F3/2,
where M, cm3/K is a structure-sensitive factor which varies from 0.31 · 10−34 to 1.65 · 10−34, T, K is the irradiation temperature, F, cm−2 is the fast neutron fluence, E > 0.85 MeV, k, eV/K is the Boltzmann constant, E, eV is 2.1 ± 0.1, the activation energy. Based on the performed experiments, it was concluded that to minimize the swelling of beryllium, the extruded materials with an oxygen level of about 3% and a grain size of 10–20 µm can be recommended.
There is only one work [22] dedicated to the swelling of titanium beryllide. The swelling values of TiBe12 irradiated in the HFR at 467 °C to neutron fluence of 6.94 · 1021 cm−2 (E > 1 MeV) and at 600 °C to neutron fluence of 8.07 · 1021 cm−2 (E > 1 MeV) are 0.08 and 0.28%, accordingly.
This review of the performed investigations on beryllium swelling under neutron irradiation and the available correlations for the swelling dependences on irradiation temperature and neutron dose shows the absence of beryllium swelling data at high irradiation parameters (temperature, dose). Of course, more experimental data on beryllium and titanium beryllide swelling is required to elucidate this issue. In this study, new results on swelling of modern beryllium grades and titanium beryllide irradiated in a wide range of temperatures and neutron doses are represented.

2. Materials and Methods

Four kinds of beryllium-based materials were investigated (see Table 1) including two grades (HE-56 grade fabricated by the hot extrusion (HE) and VHP-400 grade fabricated by the vacuum hot pressing (VHP) in UMP, Oskemen, Kazakhstan) as well as cast Be and Be-7Ti supplied by NGK, Nagoya, Japan. The HE-56 specimens have the shape of cylinders with sizes of Ø6 × 8 mm, the VHP-400 specimens were discs Ø10 × 4 mm, the cast Be and Be-7Ti specimens were pellets Ø8 × 2 mm.
The specimens were irradiated in material testing reactors CM-3, BOR-60, and HFR. The irradiation parameters are shown in Table 2.
The swelling of irradiated beryllium-based specimens was measured using immersion, dimension, and helium pycnometry methods. The immersion method includes measurements of weights of the specimens in both air and liquid (water or ethanol), calculation of density before and after irradiation and calculation of swelling S by the equation:
S = [(dinit − dirr)/dirr] × 100%,
where dinit, g/cm3—density before irradiation, dirr, g/cm3—density after irradiation.
The dimension method can be used in the case of the regular shape (cylinder, pellet) cylinders or pellets of the specimens. The measurements of their dimensions before and after irradiation allow us to calculate both specimen volumes and then to calculate the swelling S:
S = ((Virr − Vinit)/Virr) × 100%,
where Vinit is the specimen volume before irradiation, Virr is the specimen volume after irradiation.
The helium pycnometry method allows us to measure volumes of both non-irradiated and irradiated specimens using the relation:
Vs = Vc + Vr/(1 − P1/P2),
where Vs is the specimen volume, Vc is the volume of the empty specimen chamber, Vr is the reference volume, P1 is the first pressure in the sample chamber only, P2 is the second pressure after expansion of the gas into the combined volumes of the specimen chamber and the reference chamber.
In principle, all of these methods for swelling measurements of irradiated beryllium-based specimens result in close swelling values. However, for dimension and immersion methods in cases when an oxidation of the specimen surface or presence of numerous open channels [23] is observed, the swelling can have the slightly different values. Moreover, a comparison of the results after swelling measurements by immersion and helium pycnometry methods allows us to reach conclusions about availability of open and closed porosity in the irradiated specimen.

3. Results

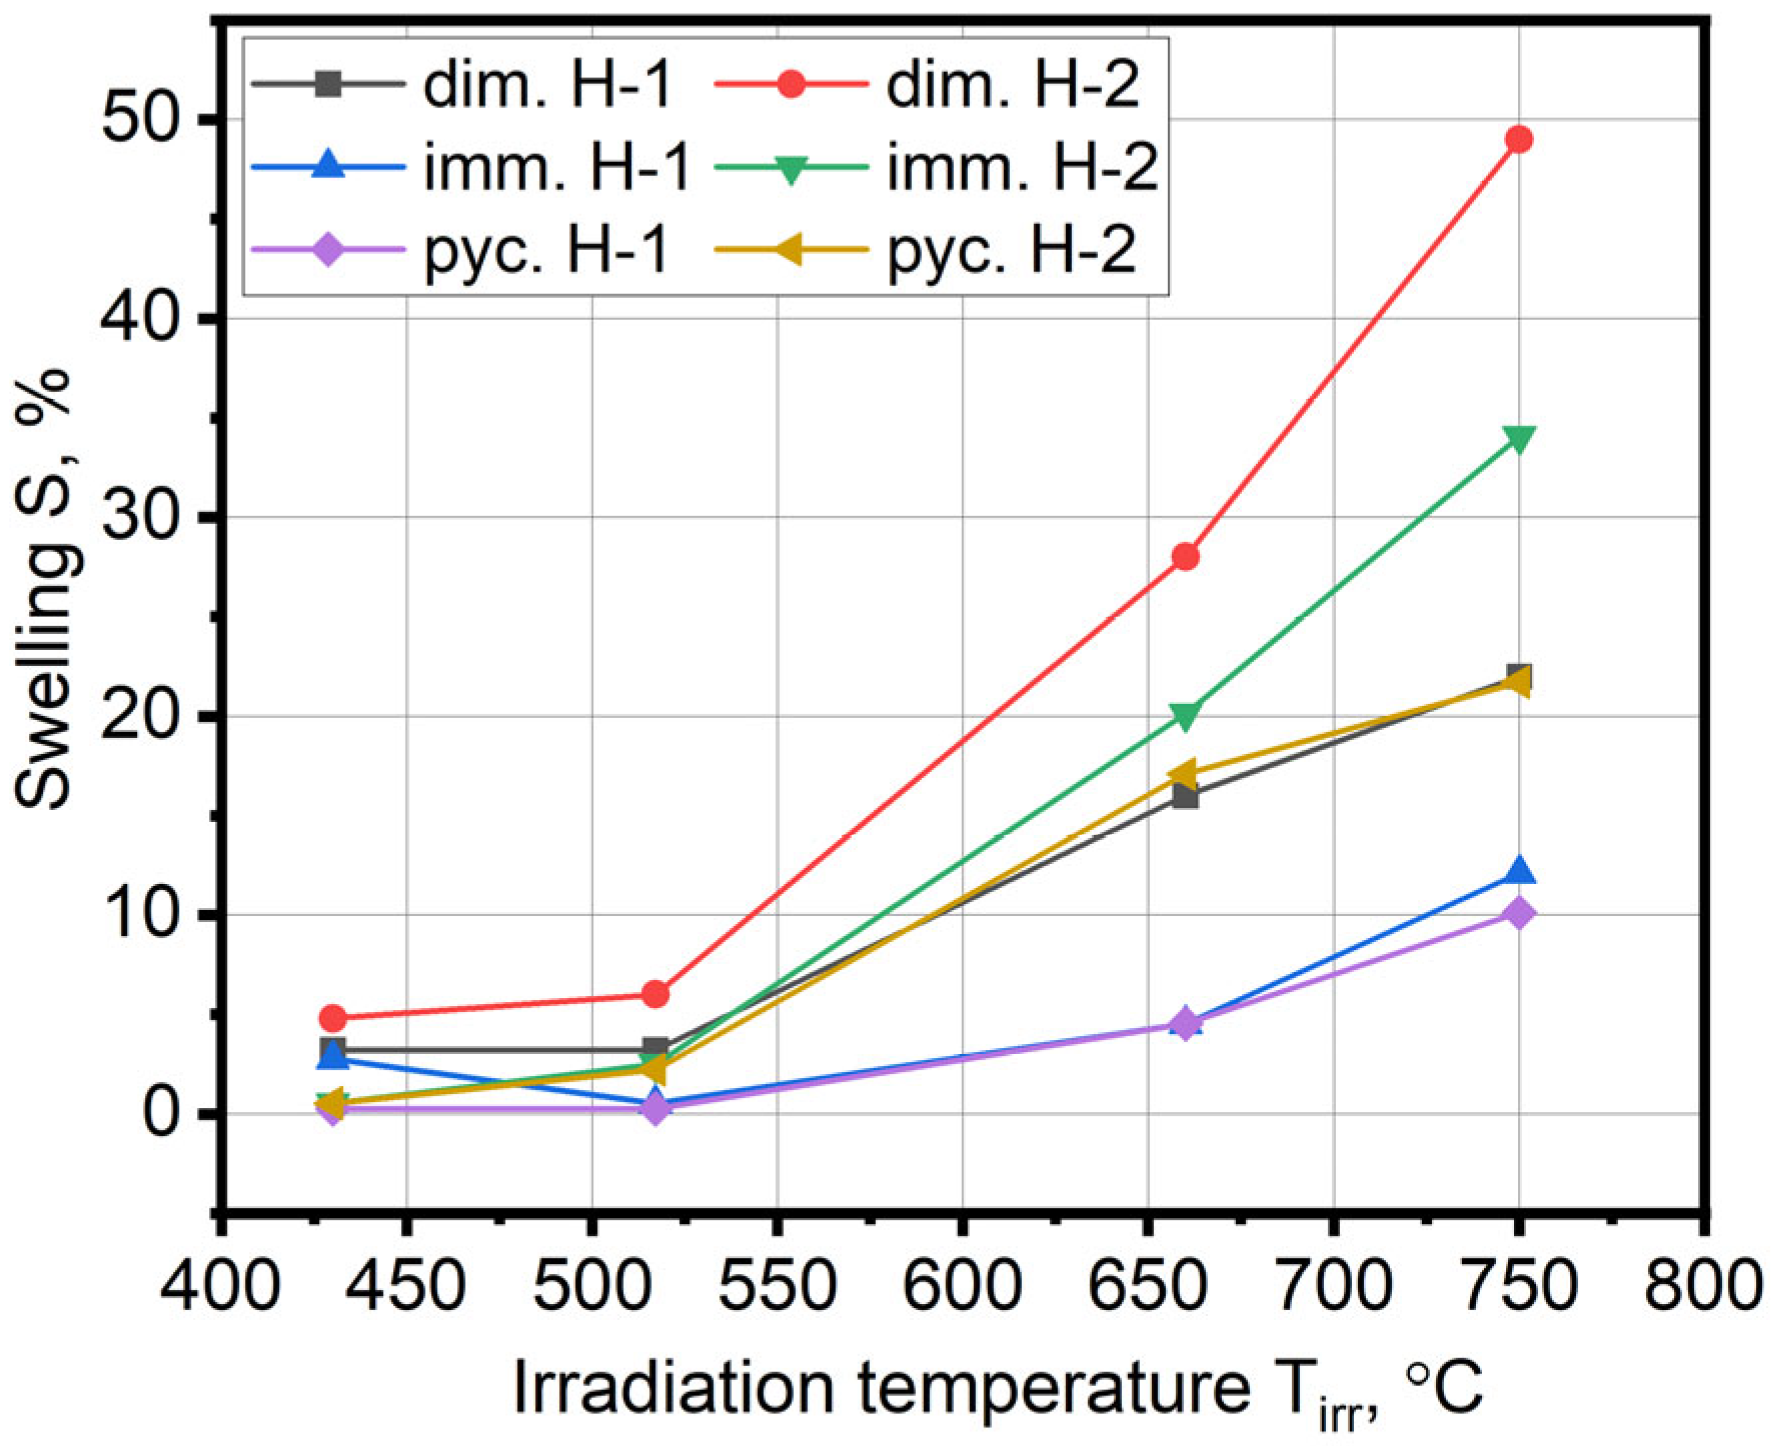
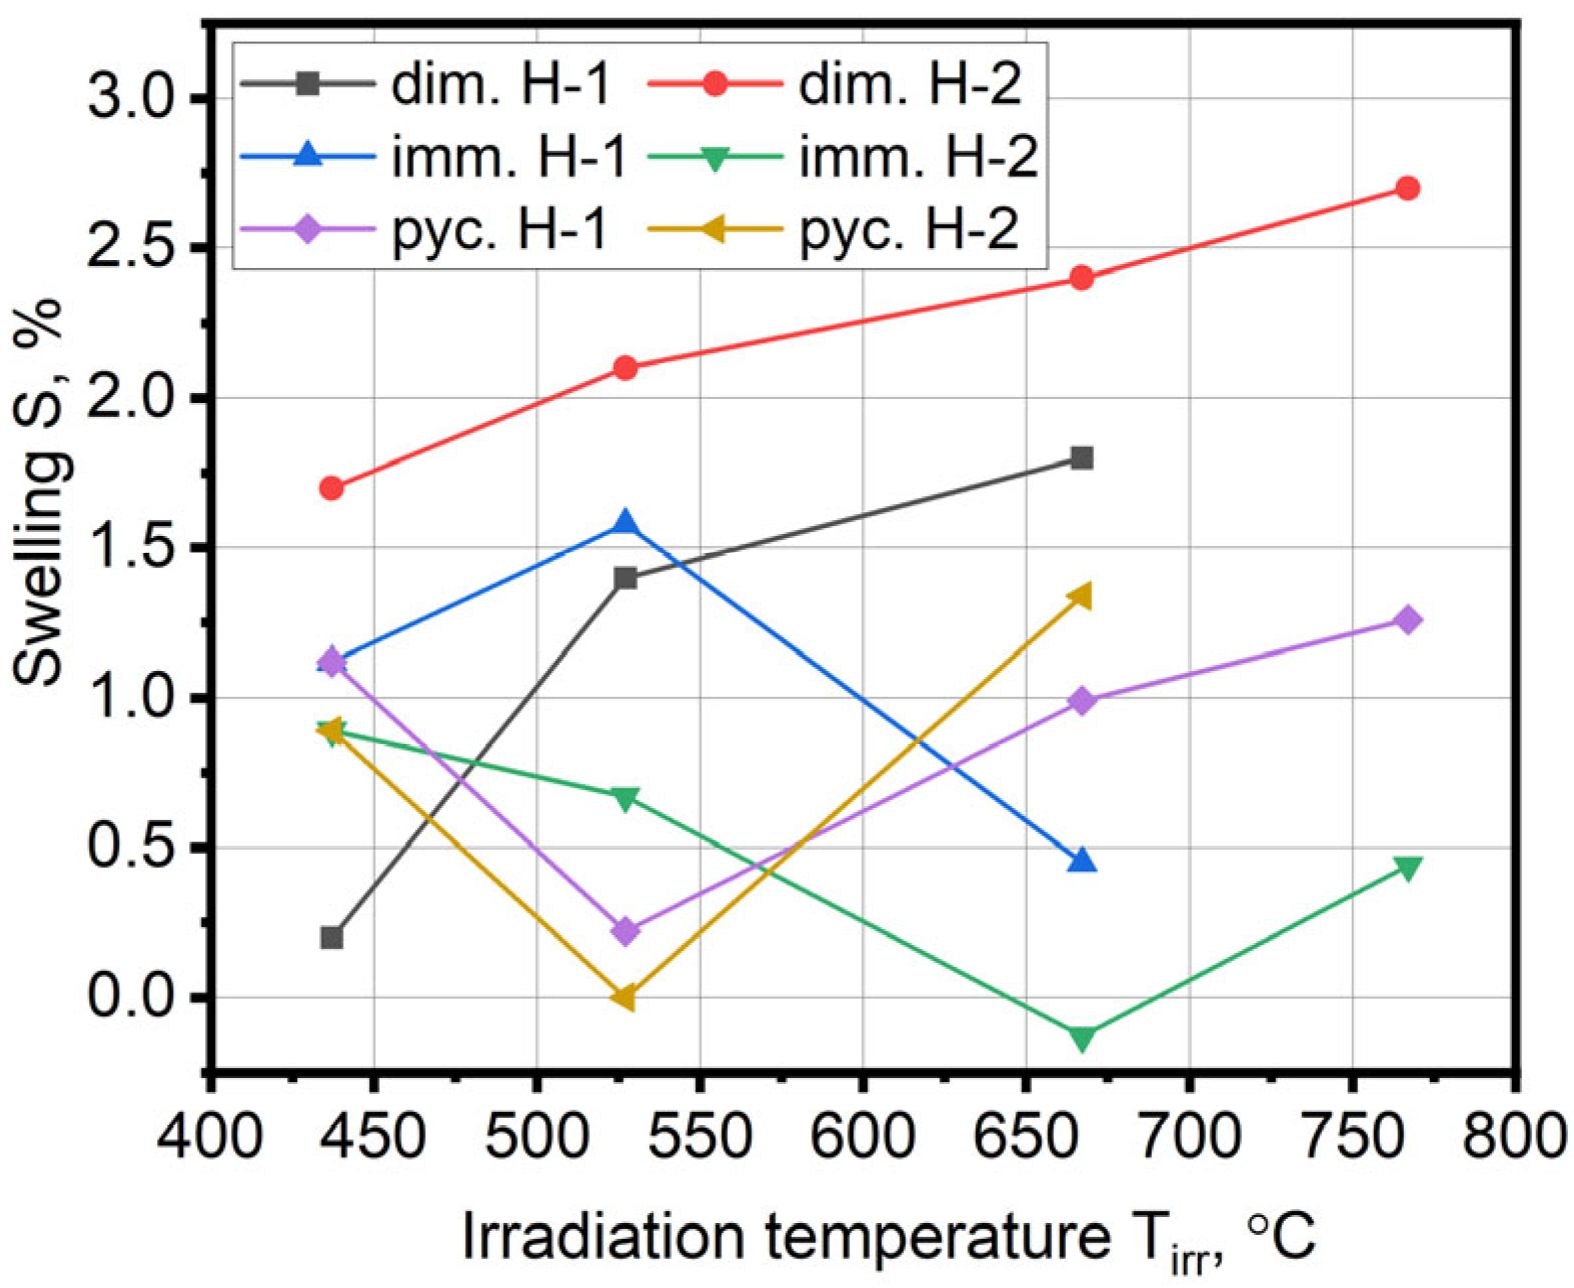
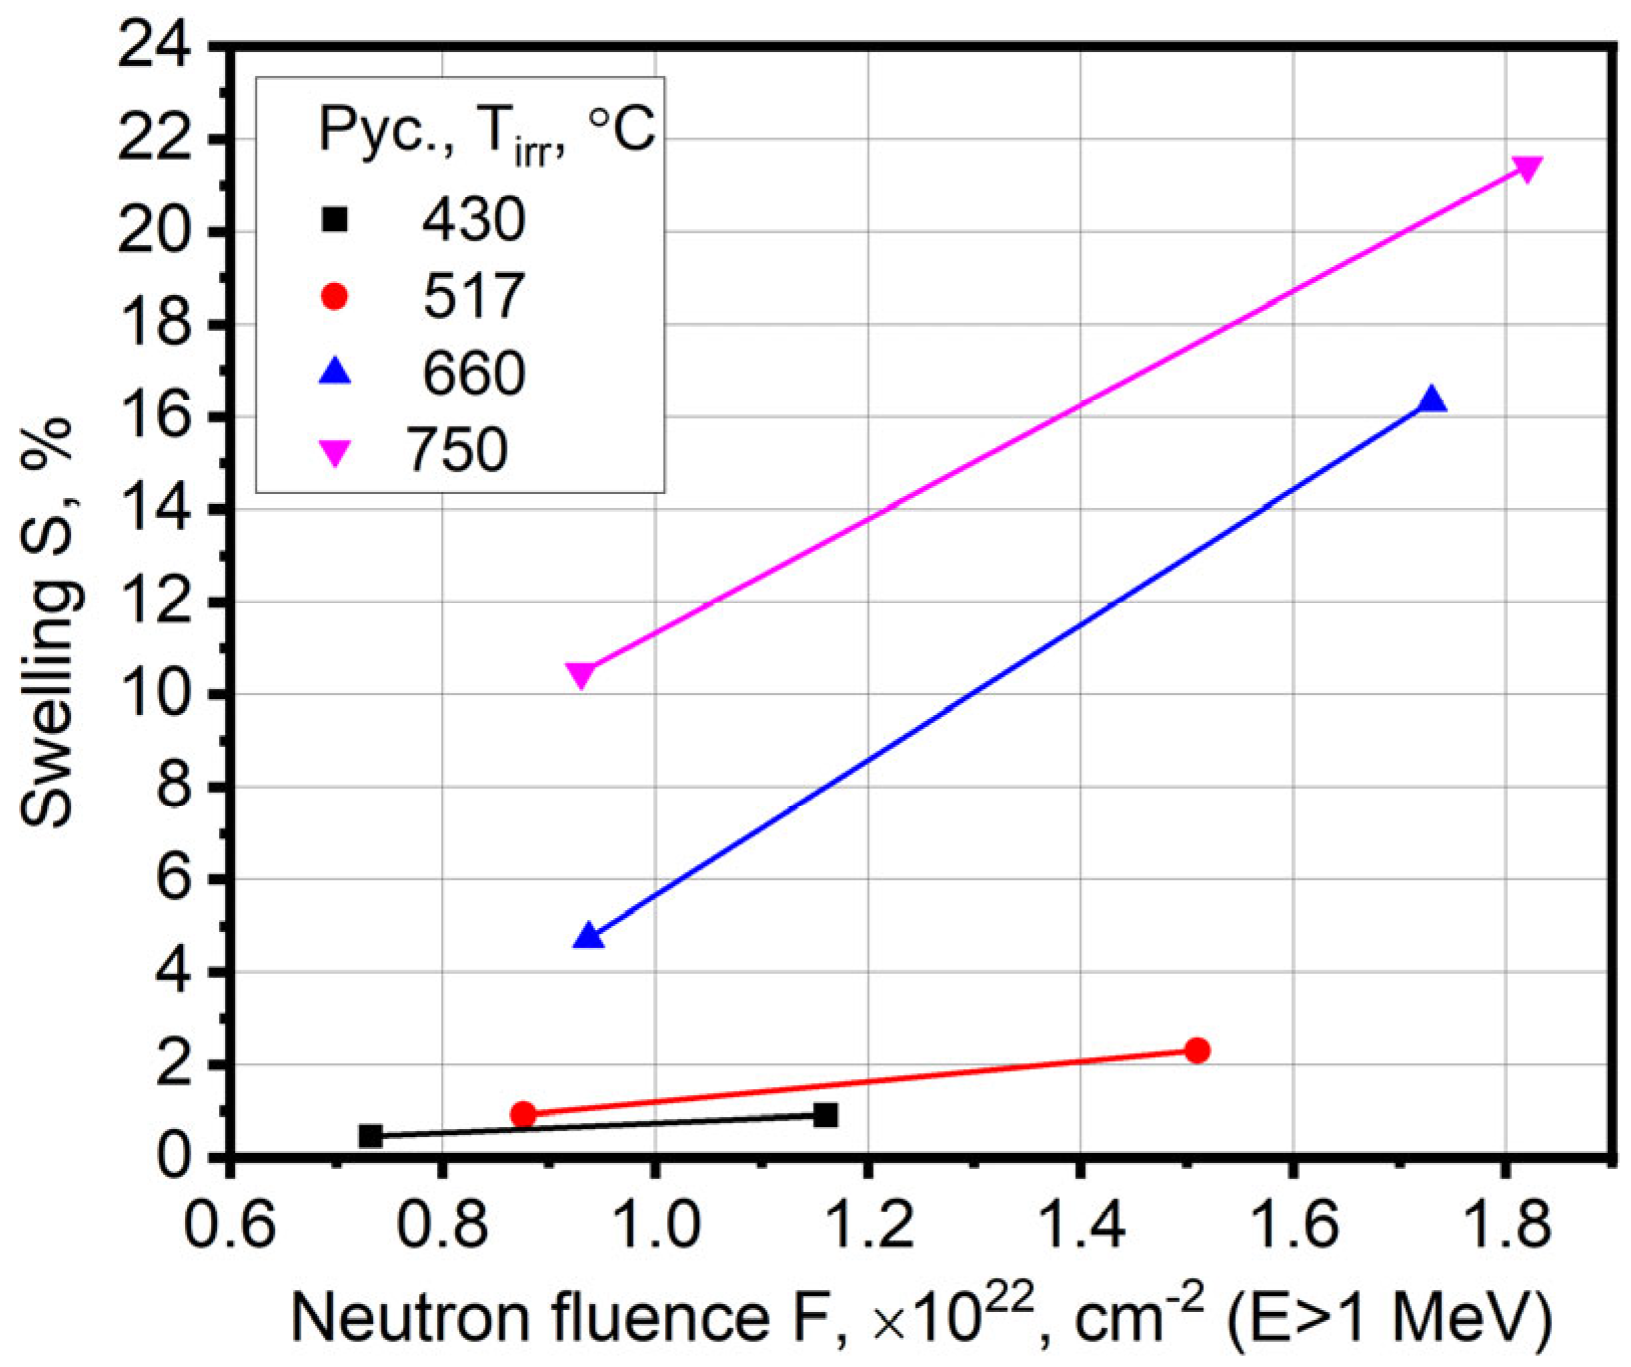
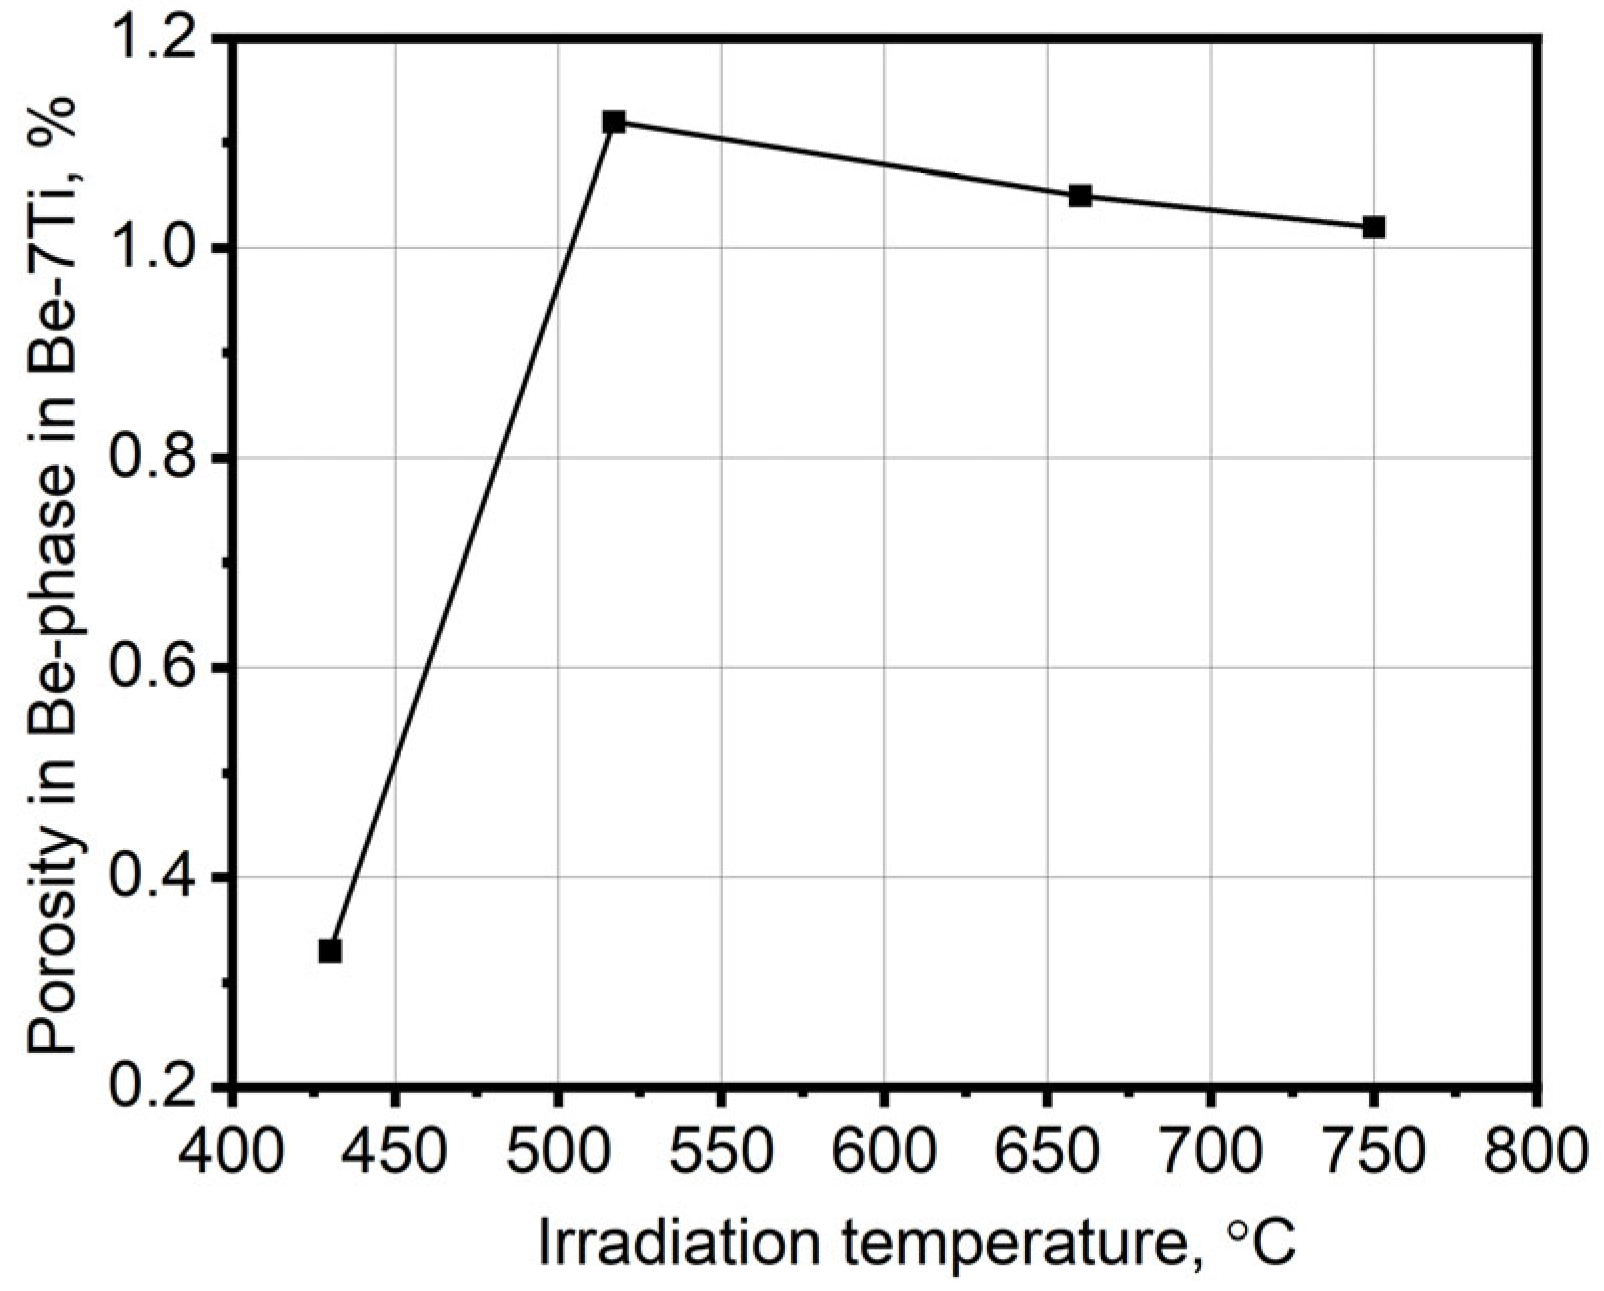
3.1. Temperature Dependence of Swelling

Figure 1 shows a dependence of swelling S of cast Be pellets irradiated in the HIDOBE-01 and -02 campaigns on the increase in irradiation temperature. The swelling was measured by immersion and pycnometry methods. The swelling does not exceed 5% up to the irradiation temperature of 517 °C; however, this follows by an increase in temperature to 750 °C, and the swelling increases rapidly at higher temperatures. For example, the swelling reaches 50% (dimension method) after irradiation at this temperature in the HIDOBE-02.
Figure 2 represents a dependence of swelling S of HE-56 beryllium grade specimens irradiated in the SM-3 reactor at a temperature of 70 °C to fast neutron fluence of 2.8 · 1022 cm−2 on post-irradiation short-term annealing temperature. It should be noted that if we compare Figure 1 and Figure 2, the swelling at close fluences has a close value to 12–14% for a temperature in the range of 750–800 °C, regardless of whether it is a long-term irradiation or a short-term annealing of the specimen previously irradiated at a low temperature of 70 °C.
Figure 3 shows the swelling S of Be-7Ti specimens on irradiation temperature. The maximum swelling value is 2.7% (dimension method), which is at the highest irradiation temperature of 750 °C. The results obtained by dimension method on the HIDOBE-02 specimens stand out as having a comparatively higher swelling to other methods because the other swelling values are mainly do not exceed of 1.8% regardless of the measurement method.

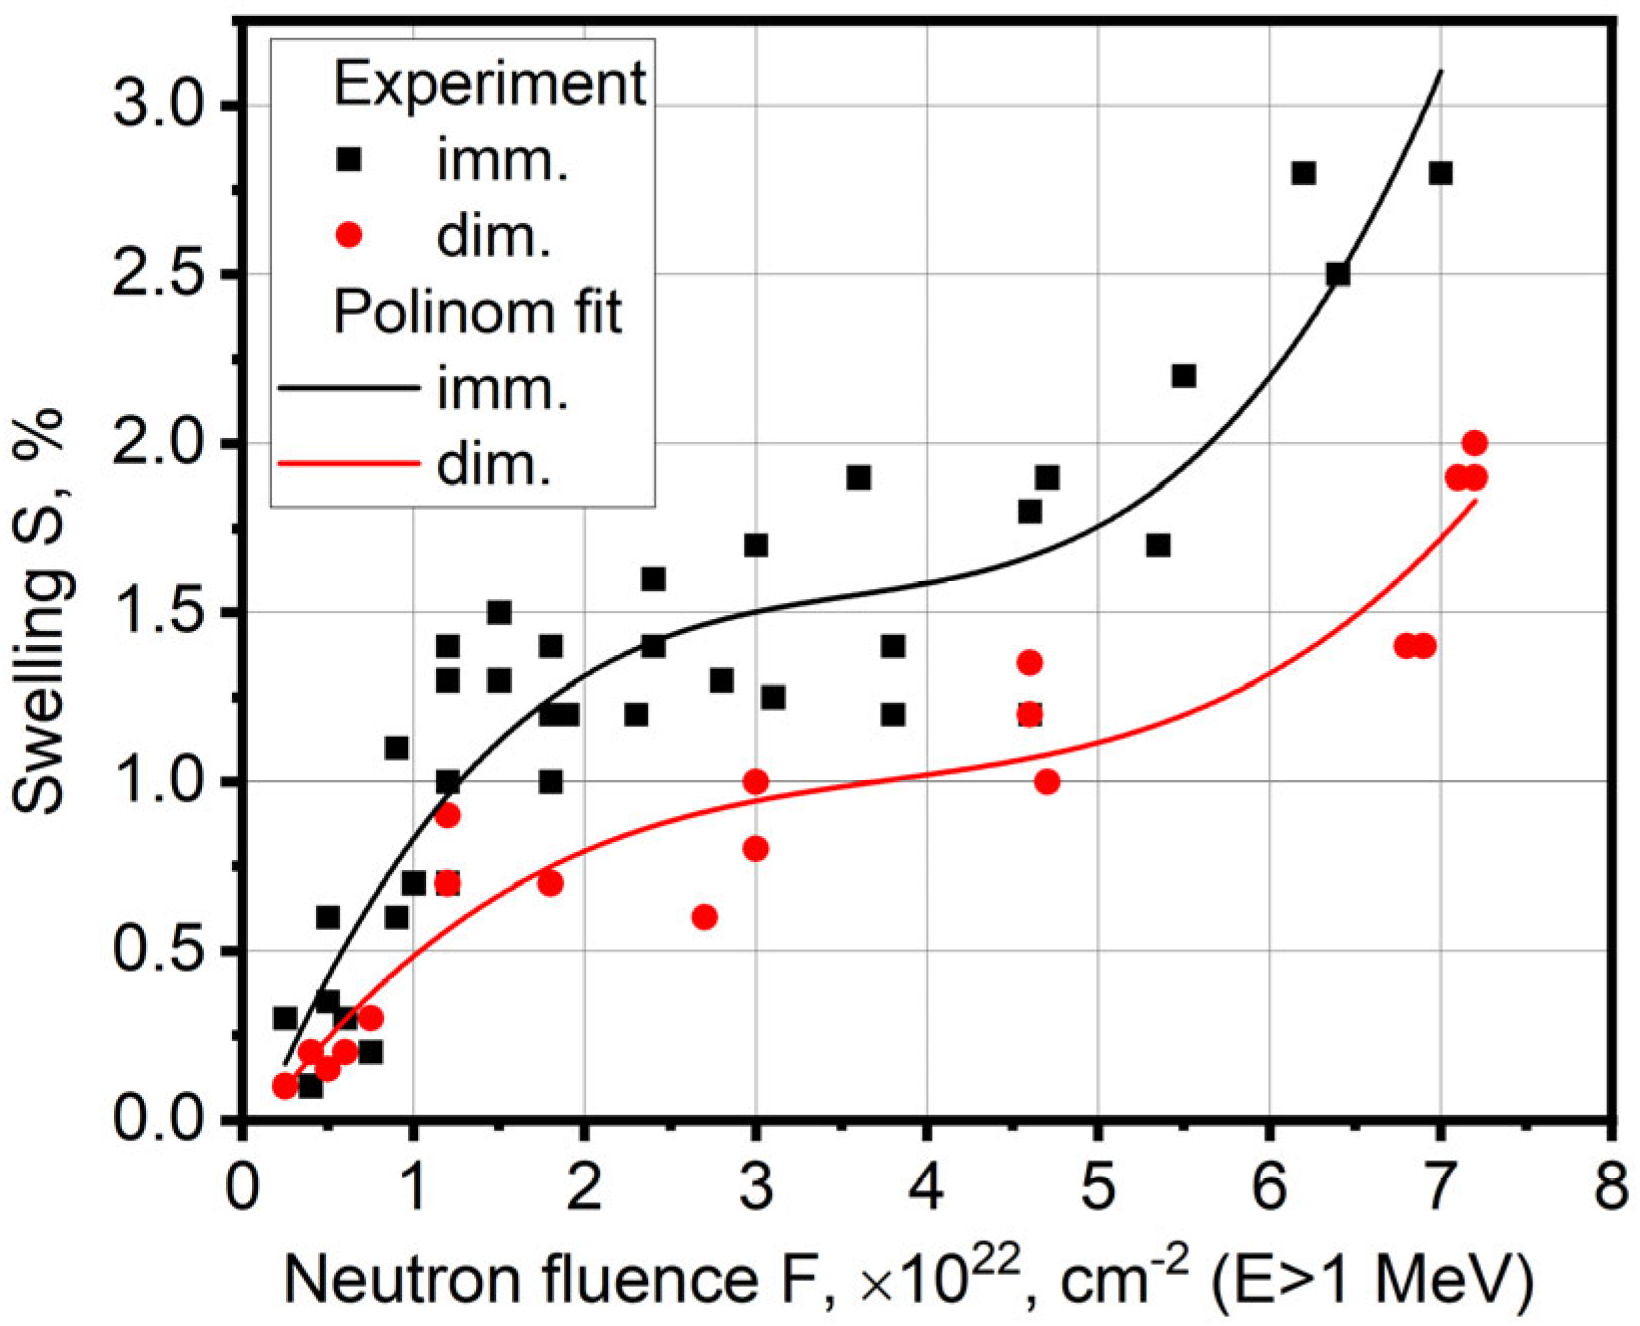
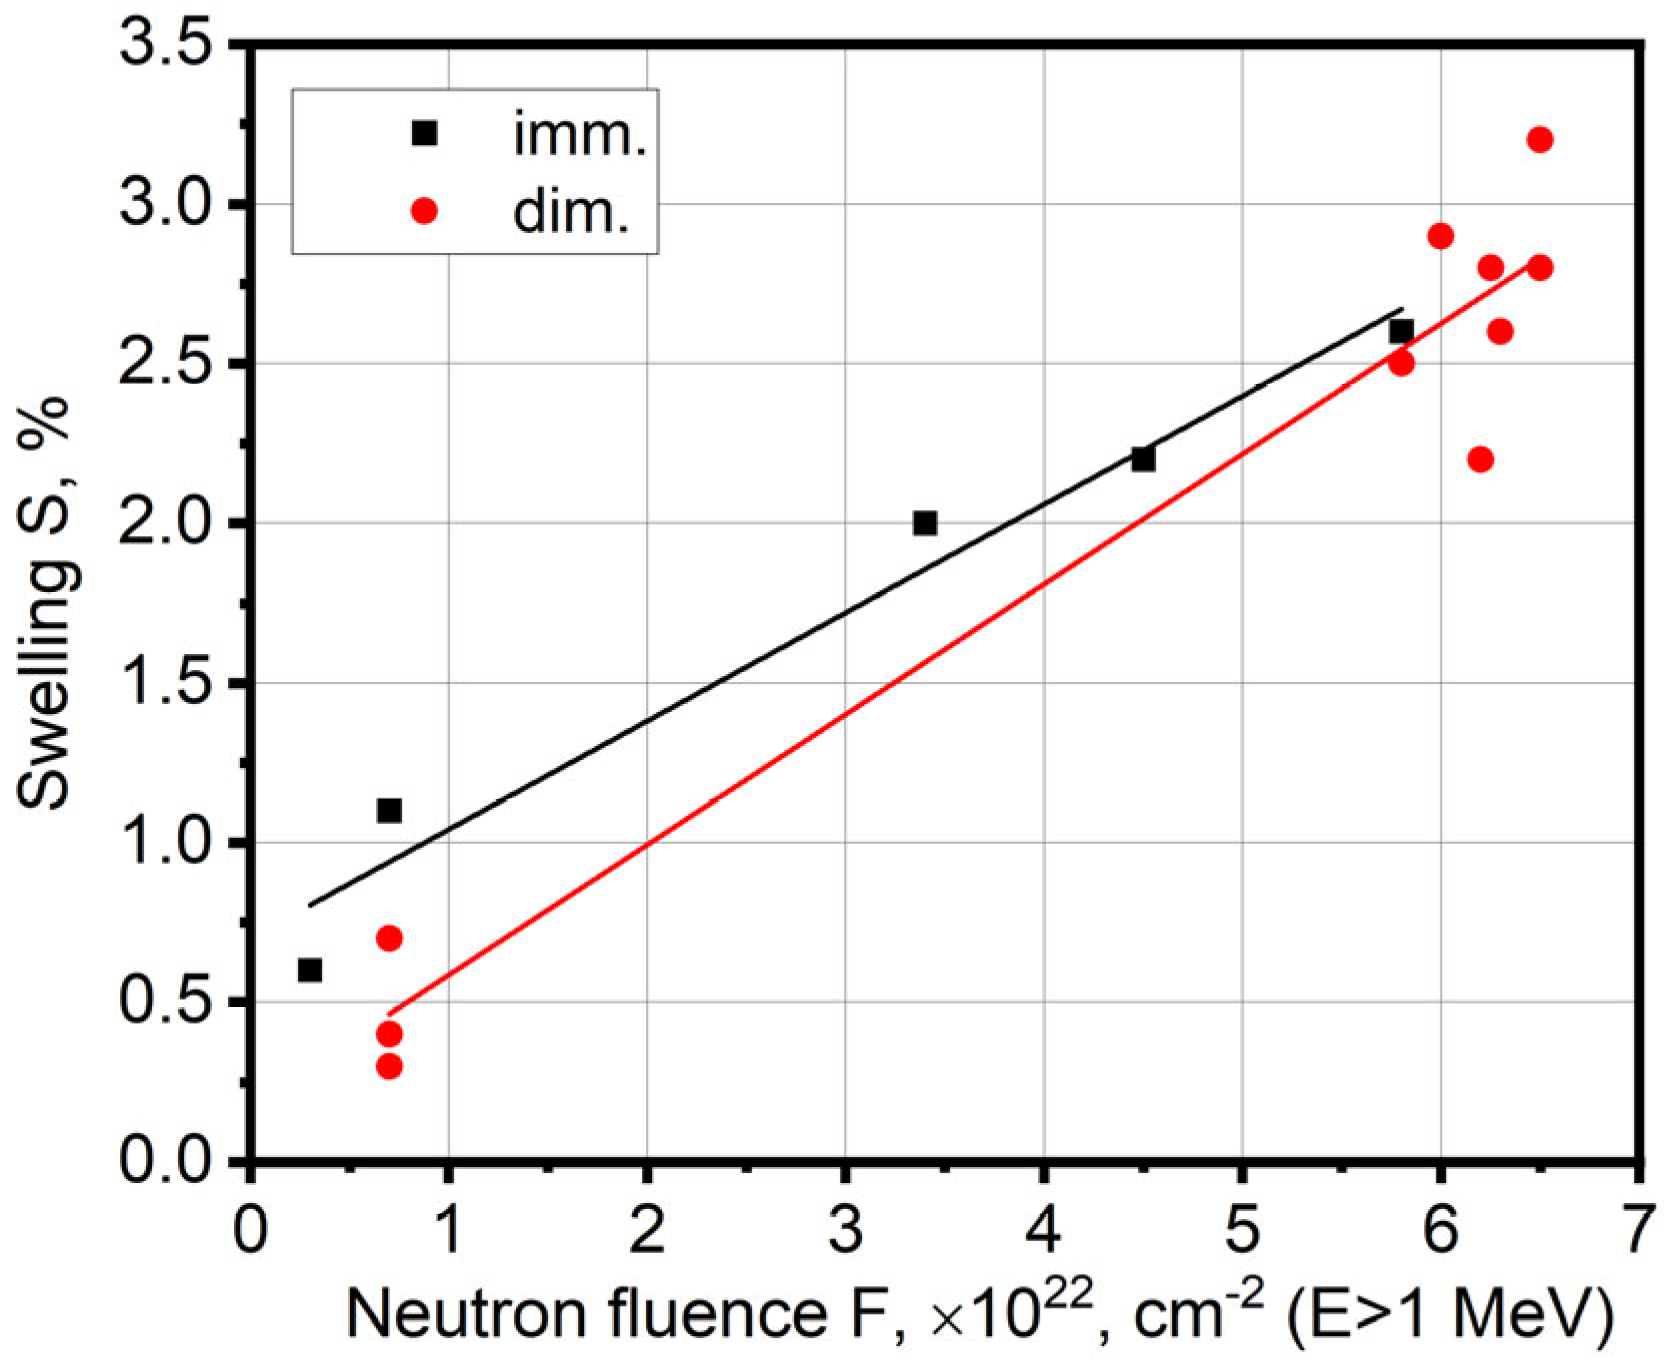
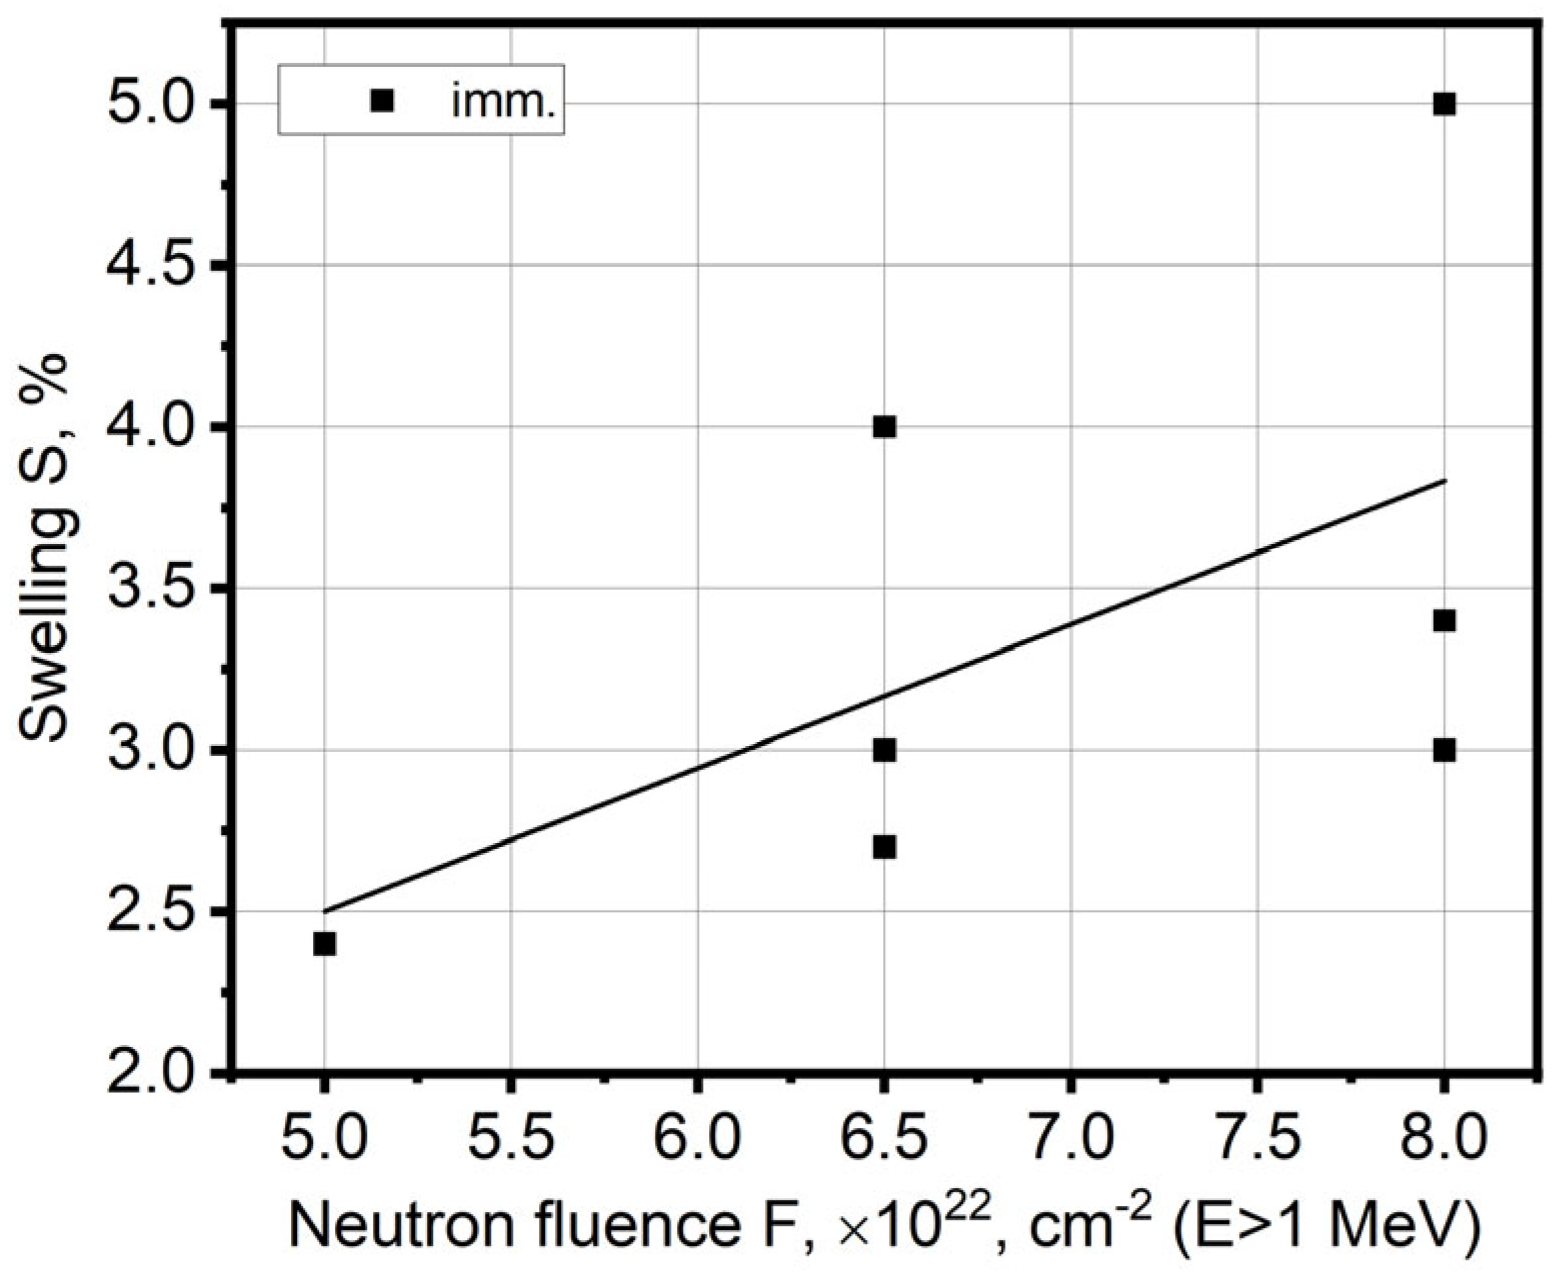
3.2. Dose Dependence of Swelling

Figure 4 shows a dose dependence of swelling S of the HE-56 beryllium grade irradiated at 70 °C. The behavior of the swelling curves for both the immersion and dimension methods is similar, but the results of the immersion measurement are systematically higher than for the dimension measurements. The maximum swelling rate for both curves to neutron fluence of F ≤ 2 · 1022 cm−2 occurs when the swelling is around 1.3–1.5% for immersion and 0.4–0.8% for dimension measurements. The moderation of swelling rate in the fluence region of (2–5) · 1022 cm−2 occurs. However, starting from F = (5–6) · 1022 cm−2, an increase in the swelling rate again takes place. The maximum swelling values at maximum neutron fluences are 2.6 and 2% after immersion and dimension measurements, accordingly. The polynomial fit of the swelling results after irradiation at 70 °C was performed (see Equations (8) and (9)).
For immersion results:
S = −0.13 + 1.26 × 10⁻²² × F − 0.33 × 10−44 × F2 + 0.03 × 10−66 × F3,
For dimension results:
S = −0.08 + 0.72 × 10⁻²² × F − 0.17 × 10−44 × F2 + 0.02 × 10−66 × F3,
Figure 5 represents a dose dependence of swelling of the HE-56 beryllium grade after irradiation at 200 °C. There is also a linear dose dependence of the swelling with the same mutual location of immersion and dimension results as it was at the irradiation temperature of 70 °C. A maximum swelling value at maximum neutron doses for the immersion method is 2.6%, and for the dimension method they are 2.4–3.4%. Figure 6 shows a dose dependence of swelling of the VHP-400 beryllium grade irradiated at a temperature of 420 °C to neutron fluence of F = (5–8) · 1022 cm−2. Despite a small amount of the experimental data, a linear dependence of swelling on the neutron dose can be seen. Maximum beryllium swelling values are 3–5% at a maximum neutron dose of F = 8 · 1022 cm−2. The large scattering of the swelling values is explained by inaccurate data regarding the actual position of the samples in the rig on the height during irradiation, which resulted in an inaccurate calculation of neutron fluences within interval of F = (5–8) · 1022 cm−2 (E > 1 MeV). Figure 7 shows a dose dependence of swelling of cast Be after irradiation at temperatures of 430–750 °C to fast neutron fluences of F = (0.73–1.82) · 1022 cm−2. An increase in swelling occurs on increasing neutron fluence for each irradiation temperature. However, a swelling rate also increases on increasing irradiation temperature. Thus, the swelling rate for two highest irradiation temperatures of 660 and 750 °C is S* = 1.23 · 10−21 % · cm2, and for two lowest irradiation temperatures of 430 and 517 °C is S* = 2.19 · 10−22 % · cm2.

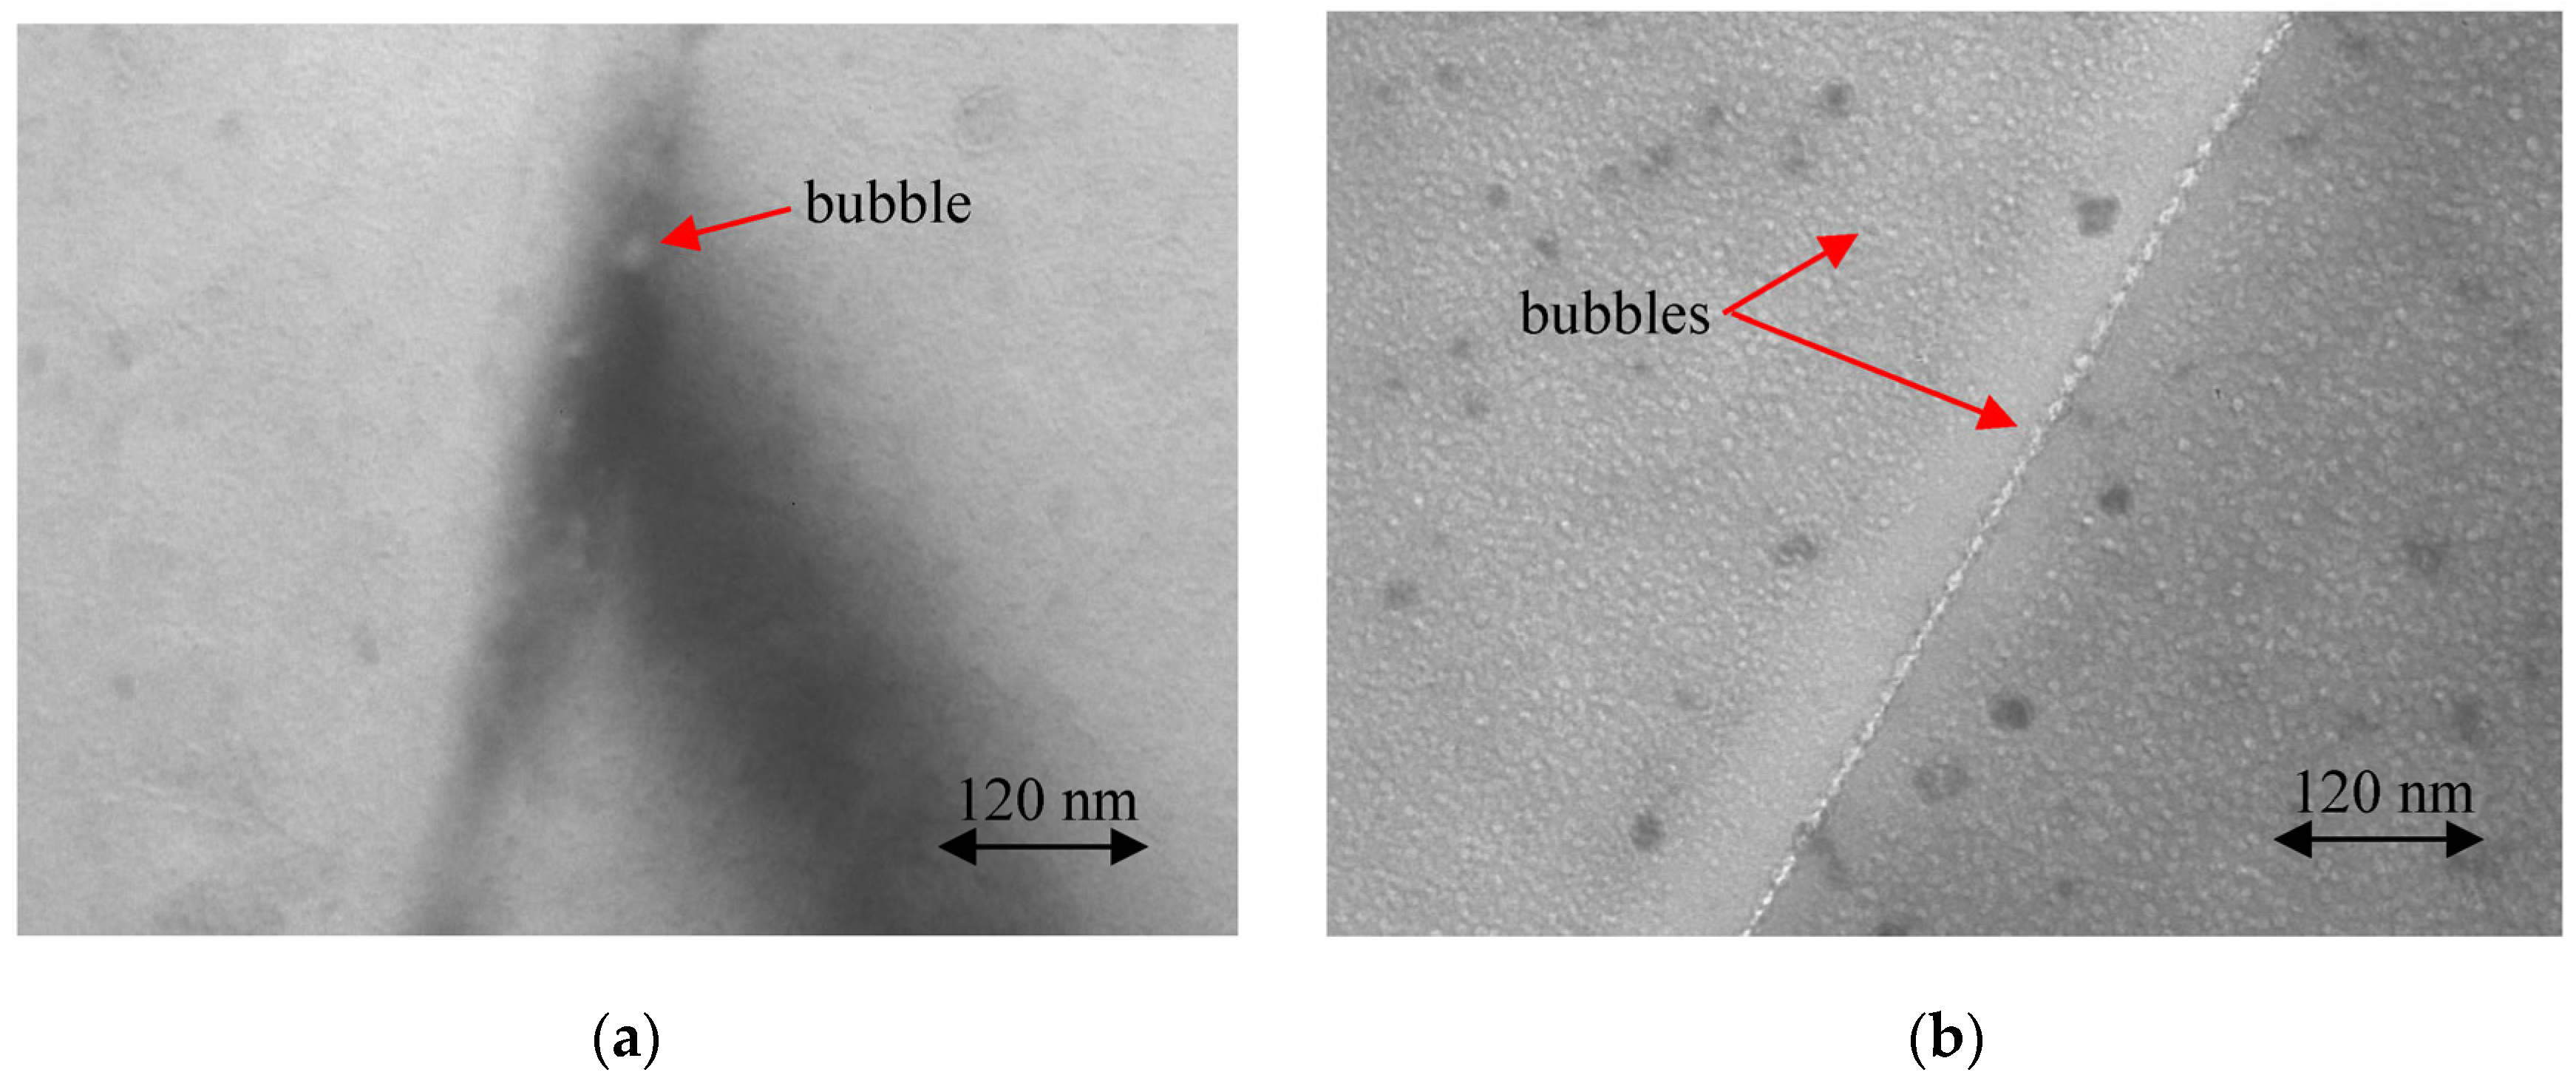
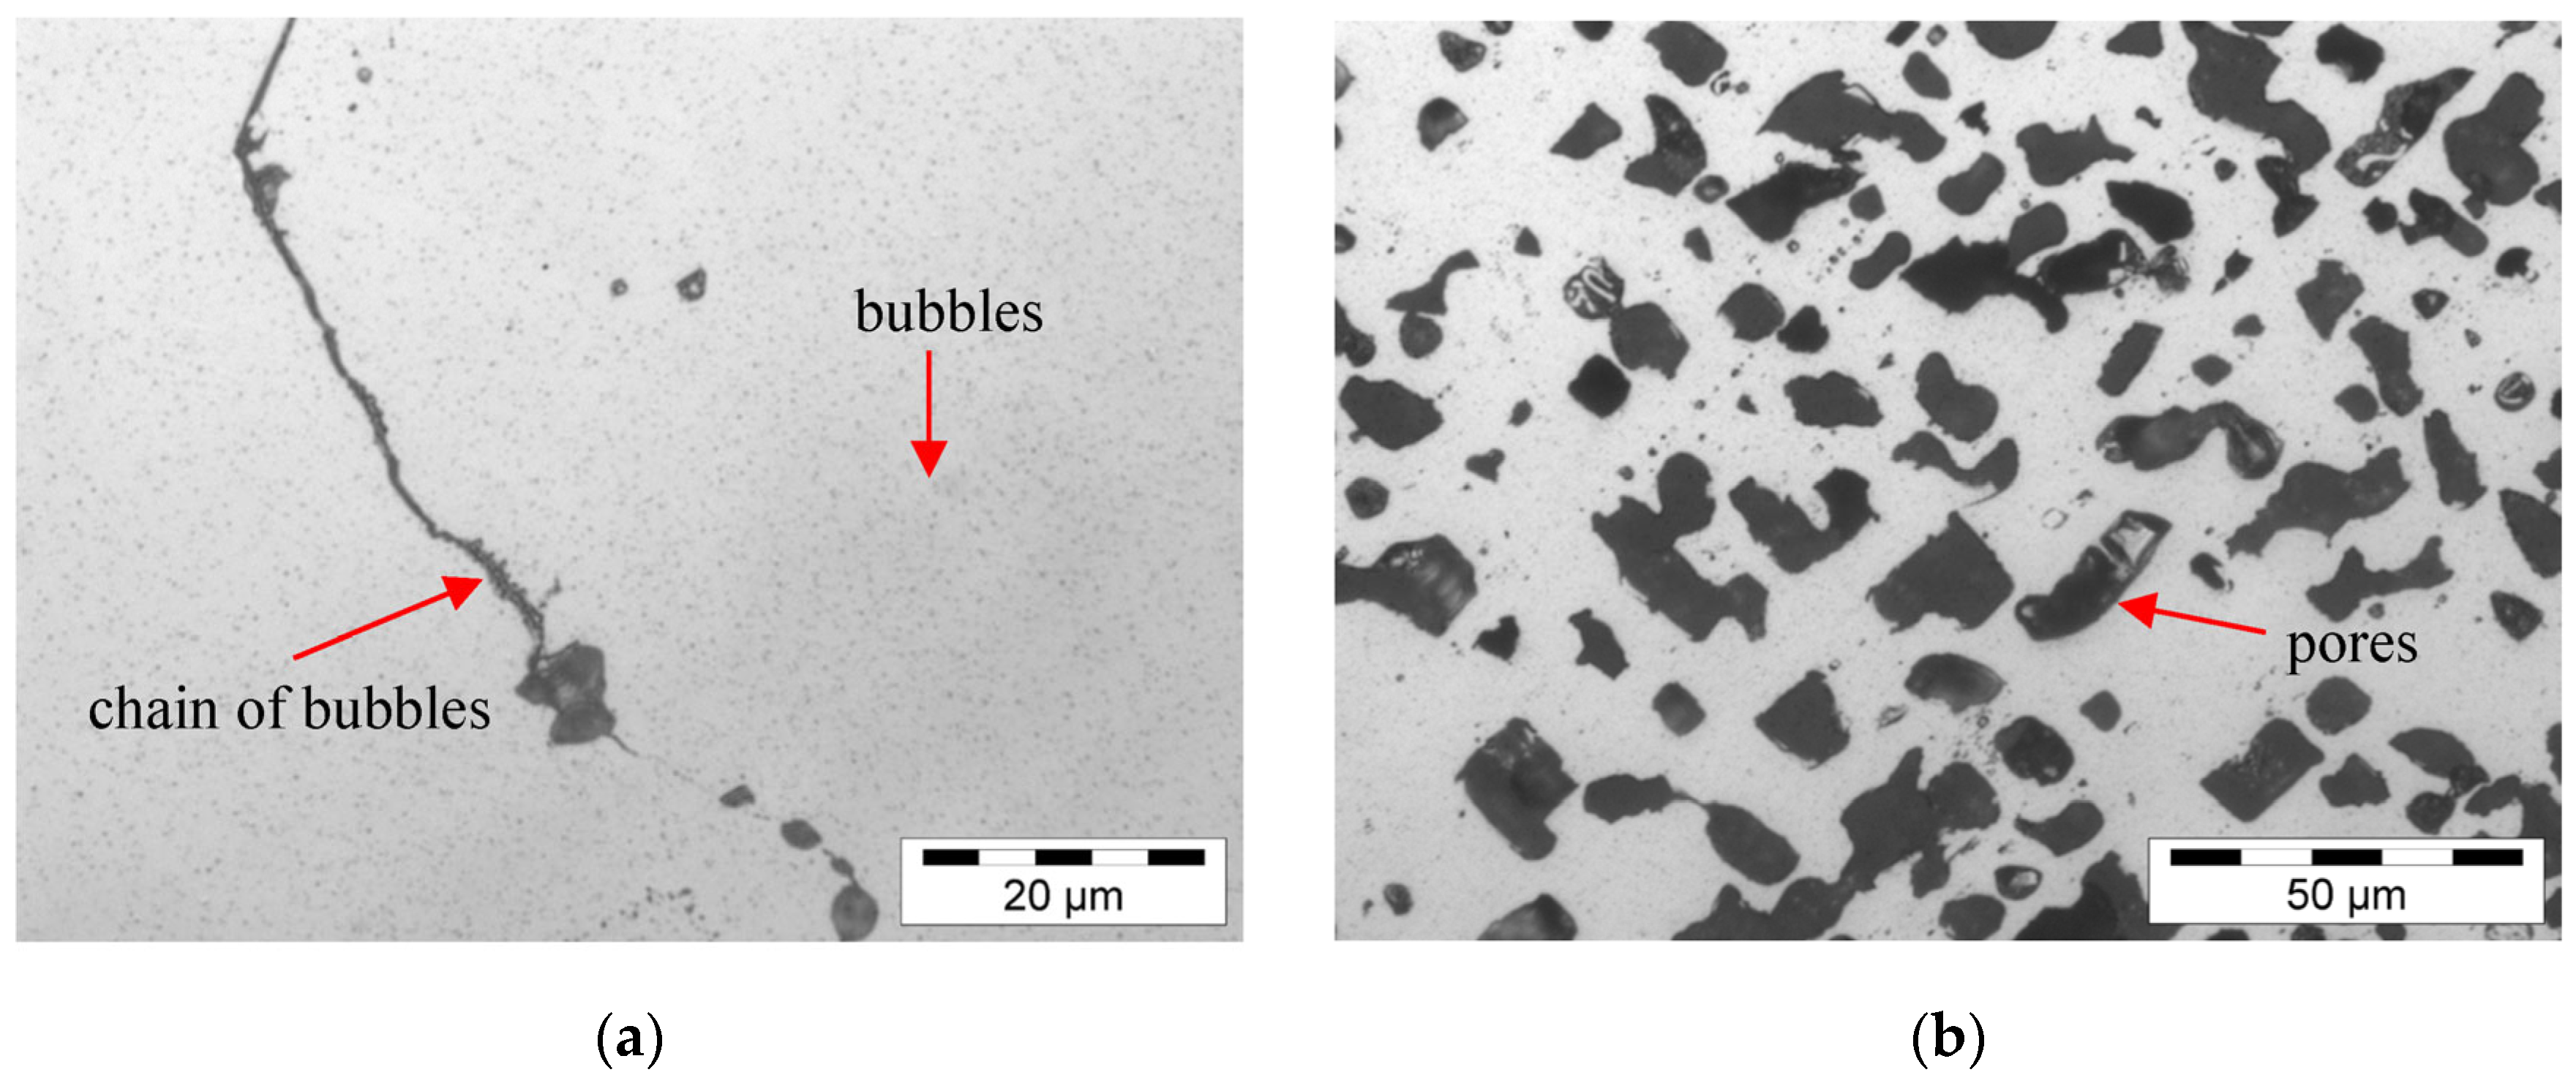
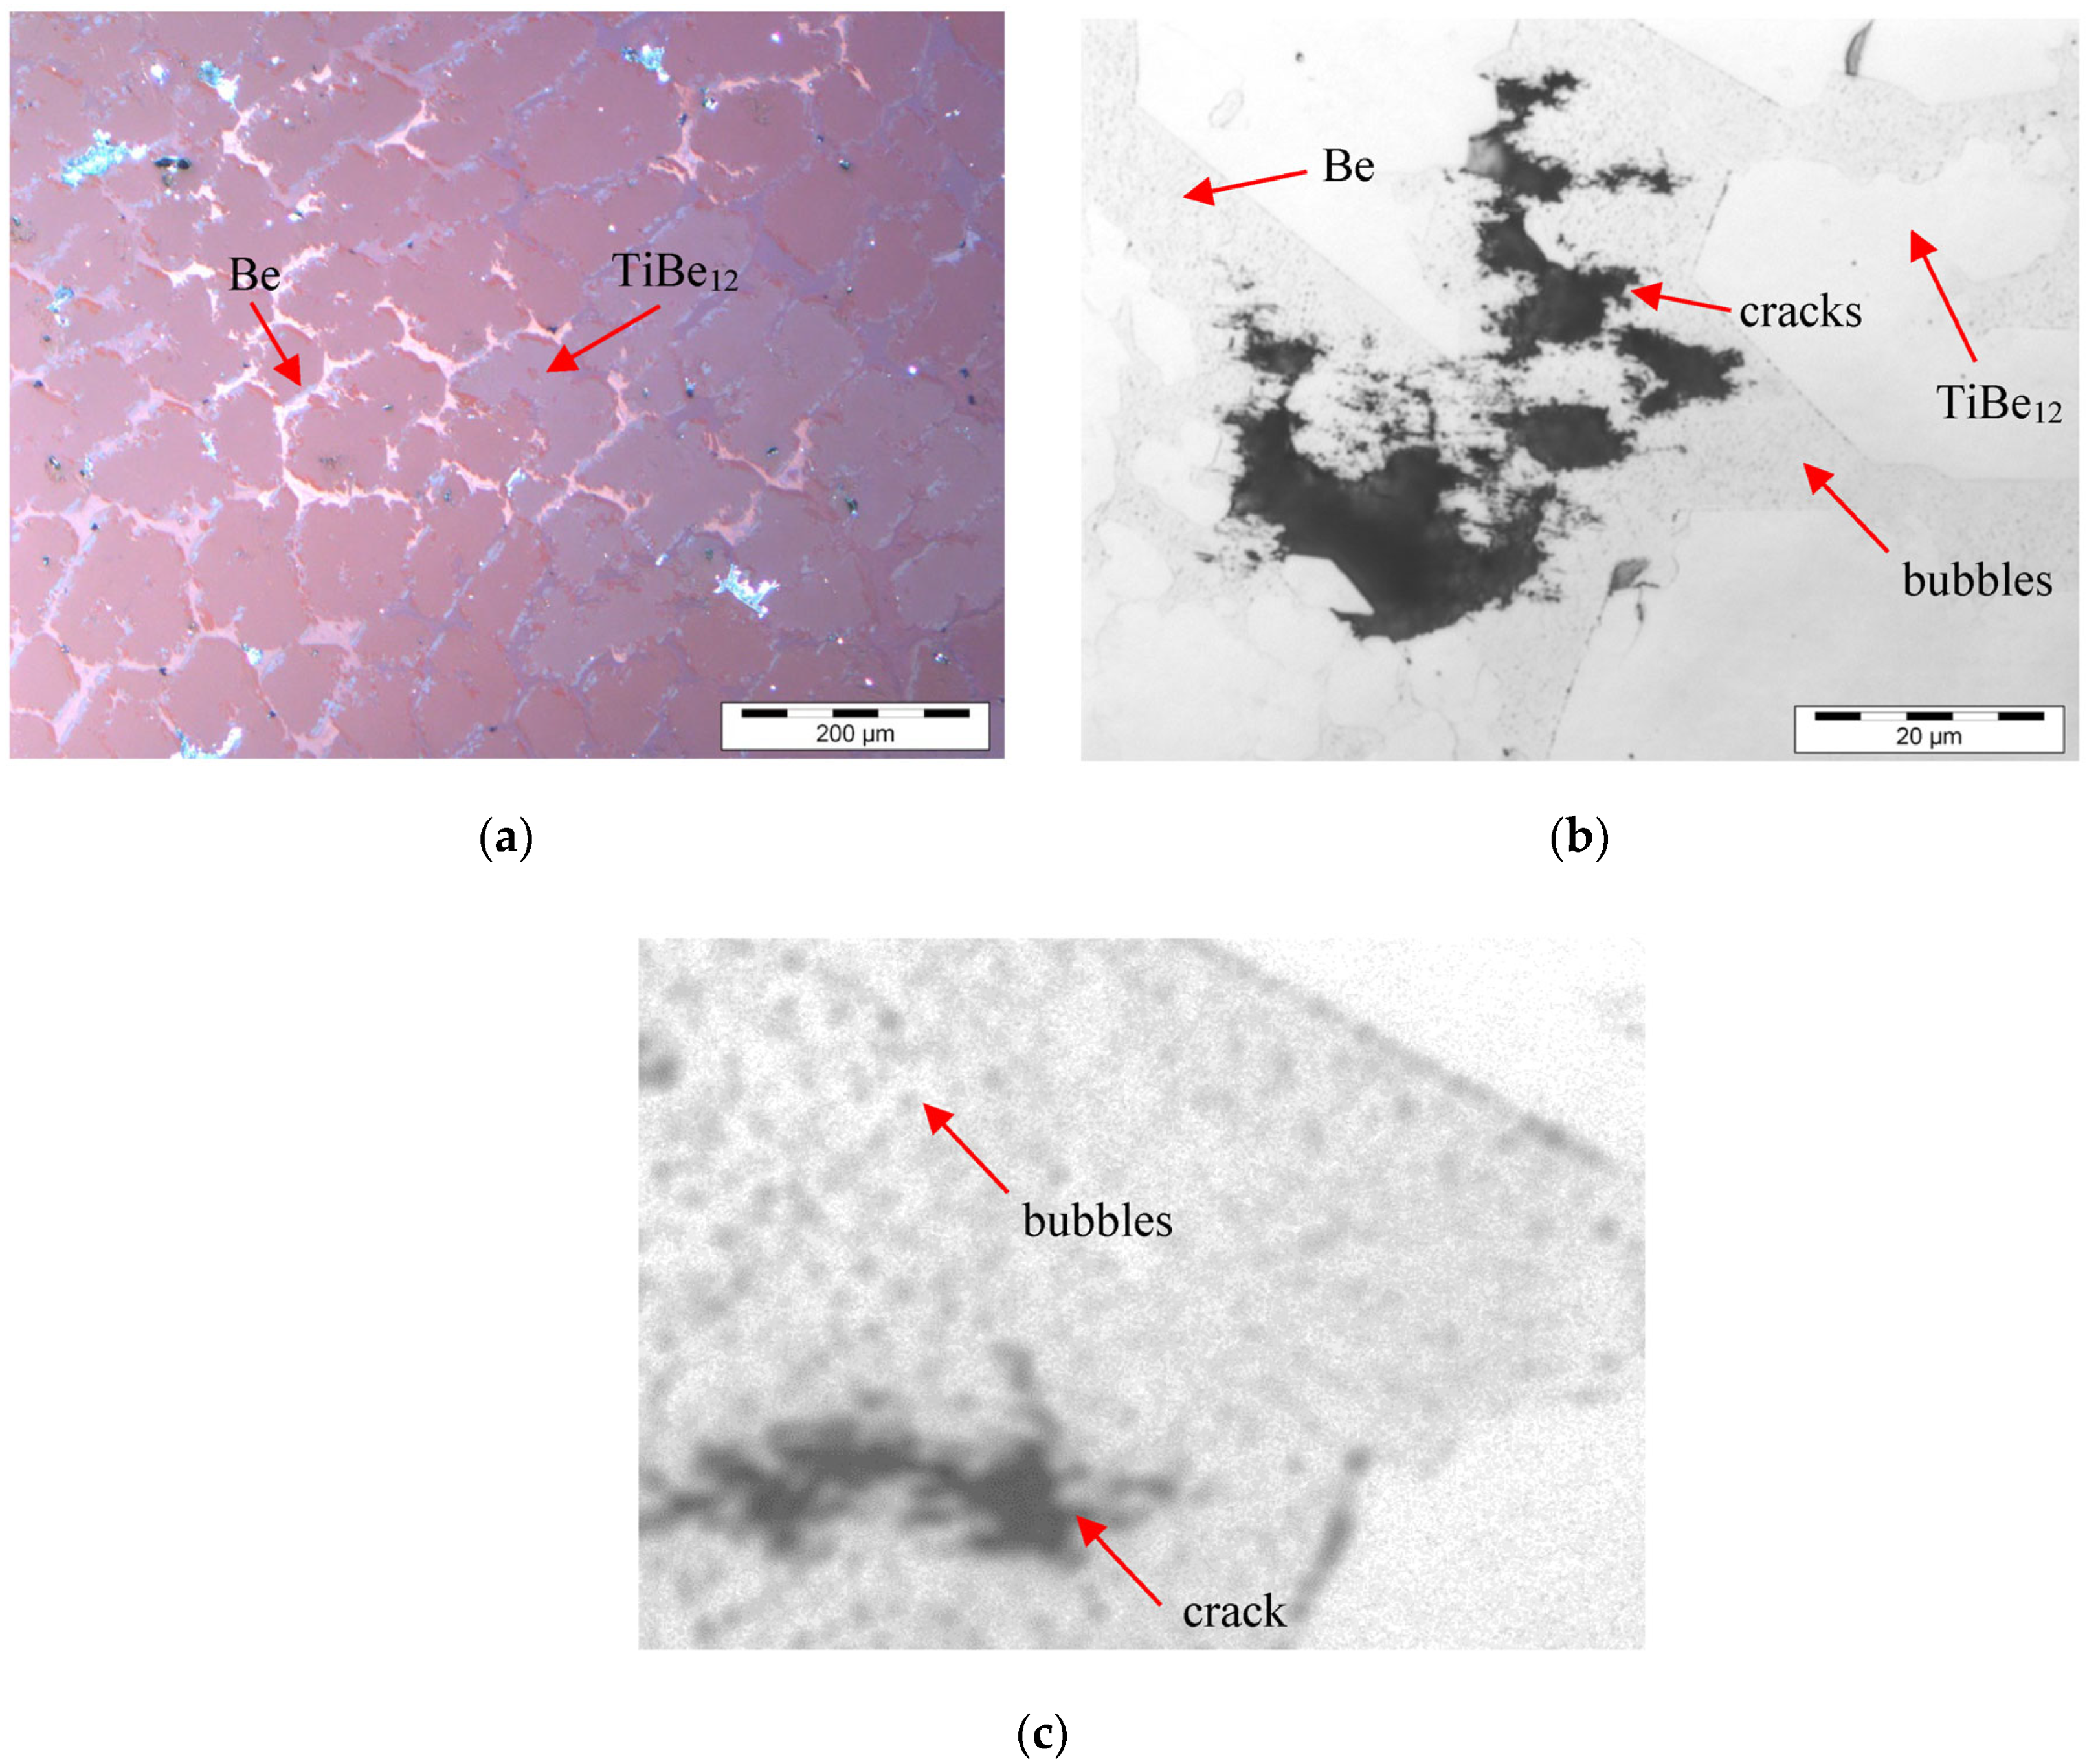
3.3. Microstructure of Irradiated Beryllium and Titanium Beryllide
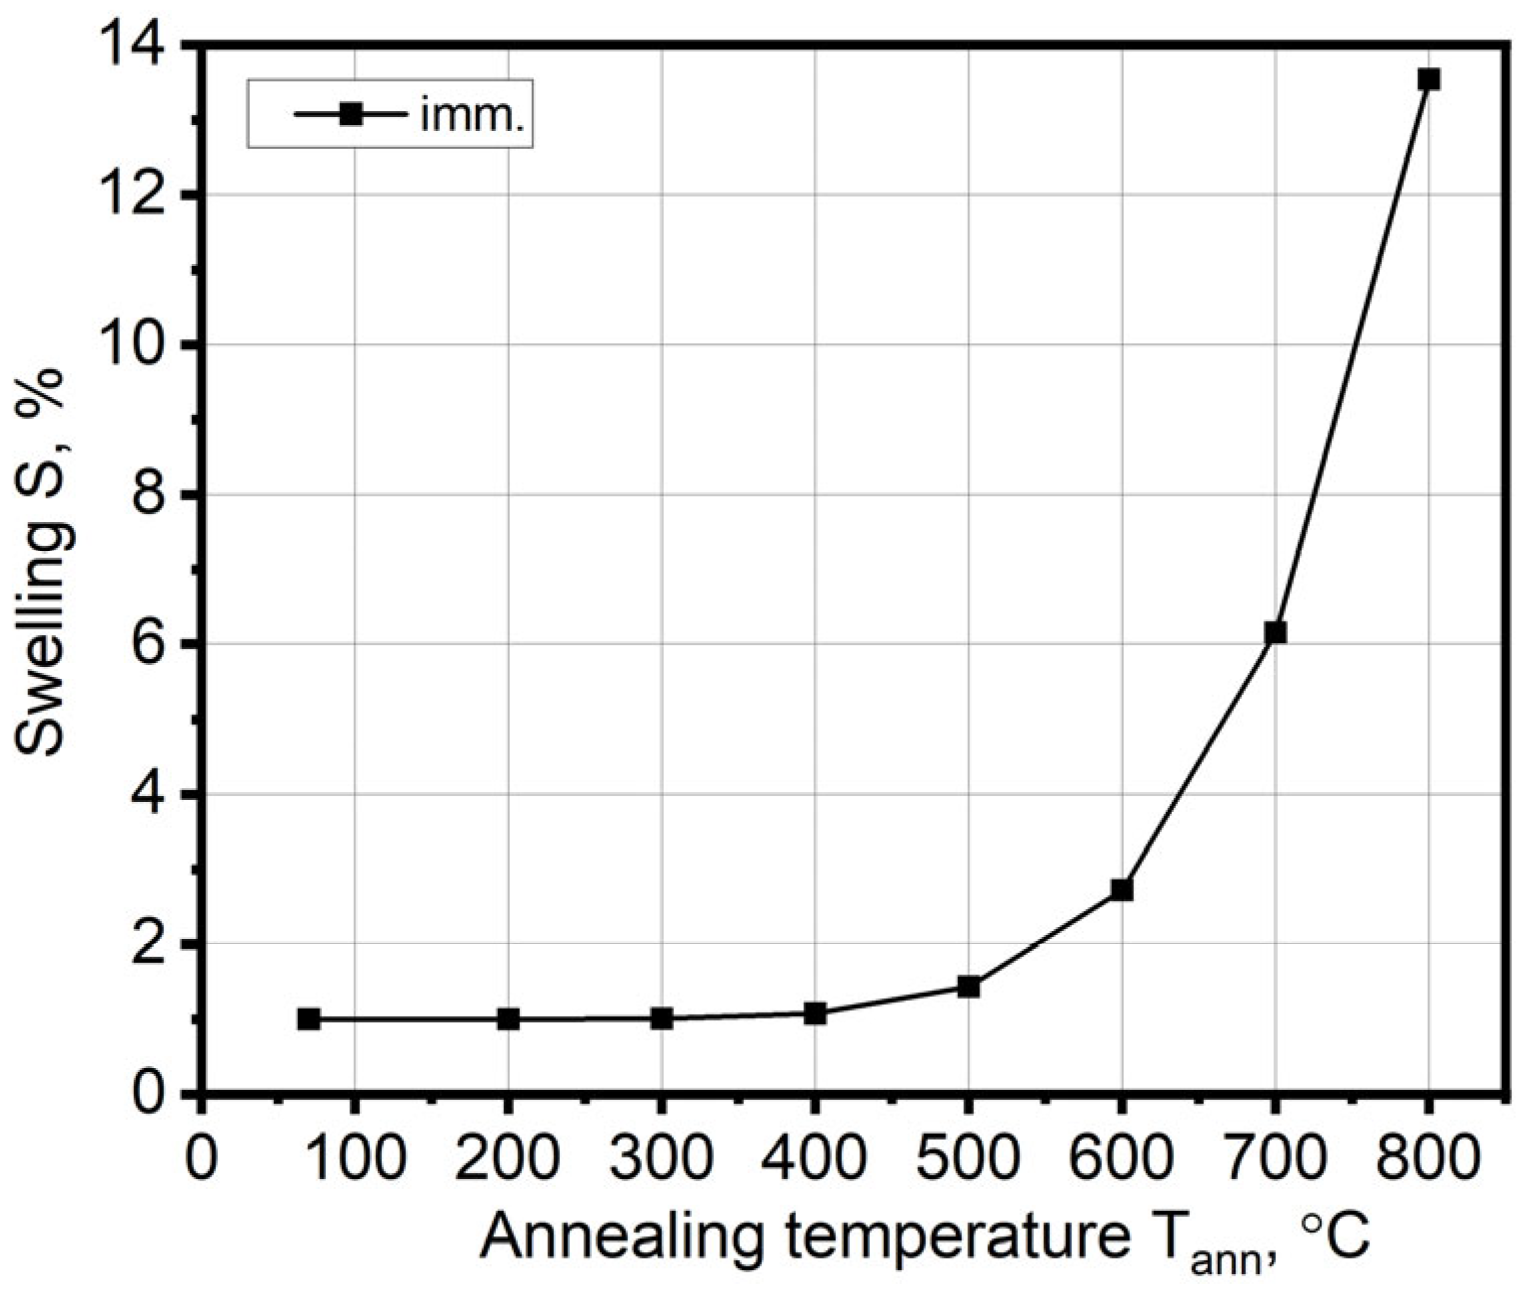
A comparison of the radiation-induced microstructure of the HE-56 beryllium grade irradiated at 70 and 200 °C shows a difference between them concerning a bubble formation rate. After irradiation at 70 °C, helium bubbles are practically absent in the microstructure. Only in rare cases are single bubbles (10–30 nm) visible on the grain boundaries (Figure 8a). In contrast to this, numerous small bubbles (3–6 nm) as well as larger bubbles (to 20 nm) on grain boundaries are in the beryllium irradiated at 200 °C (Figure 8b).
Neutron irradiation at higher temperatures of 430 and 517 °C also leads to the formation of small helium bubbles of high density [24,25]. Optical images show that after irradiation at 517 °C (Figure 9a), the small bubbles are evenly distributed throughout the structure. Much larger bubbles are found along the grain boundaries. These grain-boundary bubbles merge into the long chains of the bubbles. After irradiation at 750 °C (Figure 9b), big pores are formed. The pores have a regular shape and can reach of 20 µm. Between big pores, numerous helium bubbles are also visible.
The two-phase structure of the irradiated cast Be-7Ti material contains coarse grains of the TiBe12 phase with thin interlayers of the Be phase (Figure 10a). There is no noticeable rearrangement of the Be-7Ti phase structure compared to that before irradiation [26]. The volume fraction of the Be phase in the Be-7Ti specimens is 16–18%. Irradiation at 750 °C (Figure 10b) leads to formation of numerous small bubbles in the Be phase. These bubbles at higher magnification are shown in Figure 10c. No pores or bubbles are visible on optical images in the TiBe12 phase. Considering three lower irradiation temperatures, small bubbles in the Be interlayers were also found, as well as the absence of them in the beryllide phase.
Figure 11 shows the evolution of porosity in the Be phase in irradiated Be-7Ti specimens on irradiation temperature. The porosity at the lowest irradiation temperature of 430 °C is 0.35%. At higher temperatures of 517, 660, 750 °C, the porosity is within 1–1.1%. This means there is a significant difference between porosity values at the lowest irradiation temperature and the other three higher temperatures.

4. Discussion

The irregular behavior of swelling rate at irradiation temperatures of 70 °C as a function of the neutron dose is due to anisotropic swelling [17] and radiation growth of separate grains [27] as well as an increase in mobility of helium atoms in the field of enhanced internal stress [28]. This effect becomes significant at fluences higher than F = (5–6) · 1022 cm−2. Up to this dose, the swelling rate should be proportional to the helium production or to the fast neutron fluence [13,16,17]. The anisotropic swelling and growth of separate grains at the highest neutron fluences leads to the so-called “pseudo-swelling” because it is indirectly associated with the helium accumulation in beryllium under neutron irradiation. The main reason of the “pseudo-swelling” [17,29] is extension of the grains in directions of the predominant swelling and growth with the formation of additional grain-boundary cavities. The formation of the grain-boundary cavities can lead to the cracking along the boundaries and to the destruction of a beryllium block during operation under high neutron fluences.
Figure 4 shows that the swelling measurements by the immersion give systematically higher values than that by the dimension method. It seems that the swelling obtained here by the dimension method is comparatively more realistic because of a corrosion damage of the beryllium surface in the water coolant under irradiation [4,16]. The insufficient wetting of pitting corrosion spots during the measurement of weight of the sample in ethanol by the immersion method causes the underestimated density values.
The most important result of this study is much lower swelling of Be-7Ti (Figure 3) compared to pure Be (Figure 1) for irradiation temperatures relevant to the fusion application. This effect is especially significant at two highest irradiation temperatures of 660 and 750 °C. An explanation for this effect can be carried out after future transmission electron microscopy studies of the microstructure of irradiated specimens of both Be and Be-7Ti materials. It should be noted that the porosity in the Be phase in the Be-7Ti specimens has a value to a maximum of 1.2% (Figure 11). The swelling of Be-7Ti specimens, excluding measurements by the dimension method, is to 1.7% (Figure 3), which is close to 1.2%. Taking into account [22], where swelling of TiBe12 was 0.28%, it can be assumed that the main contributor to the swelling of the Be-7Ti specimens is the Be phase located between coarse TiBe12 grains. Therefore, if a titanium beryllide material contains only single TiBe12 phase (without beryllium phase), the swelling will be much lower compared to this study. However, in any case, the obtained results prove a fundamental advantage of beryllides (TiBe12) over pure beryllium for fusion application in terms of the swelling values (see Figure 1 and Figure 3).
The comparison of the swelling values obtained by different methods (Figure 1, especially at two highest irradiation temperatures) shows a difference between immersion and pycnometry results. At the same irradiation temperatures, the immersion results are always higher than that for the pycnometry measurements. This means that the irradiated cast Be material has open porosity. The volume of the open pores is the difference between swelling obtained by the immersion and pycnometry methods (see Table 3). The presence of open porosity network in irradiated beryllium contributes to the facilitated tritium release and lower tritium retention in the material [30,31,32].

5. Conclusions

Temperature and dose dependences of the swelling of beryllium and titanium beryllide were obtained using swelling measurements after irradiation in the SM-3, BOR-60, and HFR material testing nuclear reactors at temperatures of 70–750 °C to fast neutron fluences of (0.25–8) · 1022 cm−2 (E > 1 MeV).
Swelling of the HE-56 beryllium grade irradiated at 70 °C increases on increasing neutron fluence and reaches of 2–3% at a maximum fluence of 7.7 · 1022 cm−2 (E > 1 MeV). Irradiation at 200 °C of the same grade leads to maximum swelling of 2.4–3.4% at neutron fluence of 6.5 · 1022 cm−2 (E > 1 MeV). After irradiation of the VHP-400 beryllium grade at 420 °C to neutron fluence of 8 · 1022 cm−2 (E > 1 MeV), swelling is 3–5%.
Comparison of swelling behavior of the cast Be and Be-7Ti materials shows that Be-7Ti has much lower swelling compared to Be. After irradiation at 430–750 °C to neutron fluence of 1.82 · 1022 cm−2 (E > 1 MeV), the swelling of Be is about 50%, while for Be-7Ti, it is 2.7%. This difference can be explained by the more intense process of formation of bubbles and pores in beryllium than in titanium beryllide.
The obtained temperature and dose dependences of the beryllium and titanium beryllide swelling can be used in the indicated ranges of irradiation temperatures and neutron doses by nuclear and fusion reactors designers.

Author Contributions

Conceptualization, methodology, investigation, writing—original draft preparation, formal analysis, V.C.; methodology, validation, formal analysis, investigation, A.F.; formal analysis, writing—review and editing, R.G.; resources, supervision, project administration, M.Z. All authors have read and agreed to the published version of the manuscript.

Funding

This research received no external funding.

Data Availability Statement

Not applicable.

Acknowledgments

This work was supported by Fusion for Energy under the grant contract No. F4E-FPA-380-A3: SG01. The views and opinions expressed herein reflect only the author’s views. Fusion for Energy is not liable for any use that may be made of the information contained therein.

Conflicts of Interest

The authors declare no conflict of interest.

References

  1. Huffman, J.R. The Materials Testing Reactor as an Irradiation Facility. IDO-16, 122-PPCo, 31 August 1953. Available online: https://babel.hathitrust.org/cgi/pt?id=mdp.39015086573378&view=1up&seq=4 (accessed on 19 October 2022).
  2. White, D.W.; Burke, J.E. The Metal Beryllium; The American Society for Metals: Cleveland, OH, USA, 1955. [Google Scholar]
  3. Beeston, J.M. Beryllium metal as a neutron moderator and reflector material. Nucl. Eng. Des. 1970, 14, 445–474. [Google Scholar] [CrossRef]
  4. Chakin, V.P. Radiation damage of beryllium blocks of the SM reactor. Phys. Met. Metallogr. 1999, 88, 200–204. [Google Scholar]
  5. Dalle Donne, M.; Harries, D.R.; Kalinin, G.; Mattas, R.; Mori, S. Material problems and requirements related to the development of fusion blankets: The designer point of view. J. Nucl. Mater. 1994, 212–215, 69–79. [Google Scholar] [CrossRef]
  6. Boccaccini, L.V.; Giancarli, L.; Janeschitz, G.; Hermsmeyer, S.; Poitevin, Y.; Cardella, A.; Diegele, E. Materials and design of the European DEMO blankets. J. Nucl. Mater. 2004, 329–333, 148–155. [Google Scholar] [CrossRef]
  7. Federici, G.; Boccaccini, L.; Cismondi, F.; Gasparotto, M.; Poitevin, Y.; Ricapito, I. An overview of the EU breeding blanket design strategy as an integral part of the DEMO design effort. Fus. Eng. Des. 2019, 141, 30–42. [Google Scholar] [CrossRef]
  8. Zmitko, M.; Vladimirov, P.; Knitter, R.; Kolb, M.; Leys, O.; Heuser, J.; Schneider, H.-C.; Rolli, R.; Chakin, V.; Pupeschi, S.; et al. Development and qualification of functional materials for the European HCPB TBM. Fus. Eng. Des. 2018, 136, 1376–1385. [Google Scholar] [CrossRef]
  9. Hernandez, F.A.; Pereslavtsev, P.; Zhou, G.; Kiss, B.; Kang, Q.; Neuberger, H.; Chakin, V.; Gaisin, R.; Vladimirov, P.; Boccaccini, L.V.; et al. Advancements in the Helium-Cooled Pebble Bed Breeding Blanket for the EU DEMO: Holistic Design Approach and Lessons Learned. Fus. Sci. Technol. 2019, 75, 352–364. [Google Scholar] [CrossRef]
  10. Gaisin, R.; Chakin, V.; Vladimirov, P.; Hernandez Gonzalez, F.A.; Udartsev, S.; Vechkutov, A.; Kolmakov, M. Industrial-scale Manufacturing Experience of Titanium Beryllide Block for DEMO Blanket Application. Fus. Eng. Des. 2020, 161, 111862. [Google Scholar] [CrossRef]
  11. Ells, C.E.; Perryman, E.C. Effects of neutron-induced gas formation on beryllium. J. Nucl. Mater. 1959, 1, 73–84. [Google Scholar] [CrossRef]
  12. Foreman, A.J.E. Calculations on the Rate of Swelling of Gas Bubbles in Uranium; Report AERE-T/M-134; Great Britain Atomic Energy Research Establishment: Harwell, UK, March 1956. [Google Scholar]
  13. Barnes, R.S. A theory of swelling and gas release for reactor materials. J. Nucl. Mater. 1964, 11, 135–148. [Google Scholar] [CrossRef]
  14. Rich, J.B.; Redding, G.B.; Barnes, R.S. The effect of heating neutron irradiated beryllium. J. Nucl. Mater. 1959, 1, 96–105. [Google Scholar] [CrossRef]
  15. Rich, J.B.; Walters, G.P.; Barnes, R.S. The mechanical properties of some highly irradiated beryllium. J. Nucl. Mater. 1961, 3, 287–294. [Google Scholar] [CrossRef]
  16. Goltsev, V.P.; Sernyaev, G.A.; Chechetkina, Z.I. Radiation Material Science of Beryllium; Nauka i Tekhnika: Minsk, Belarus, 1977. (In Russian) [Google Scholar]
  17. Sernyaev, G.A. Radiation Damageability of Beryllium; Ekaterinburg Publishers: Yekaterinburg, Russia, 2001. [Google Scholar]
  18. Gelles, D.S.; Sernyaev, G.A.; Dalle Donne, M.; Kawamura, H. Radiation effects in beryllium used for plasma protection. J. Nucl. Mater. 1994, 212–215, 29–38. [Google Scholar] [CrossRef] [Green Version]
  19. Sannen, L.; De Raedt, C.; Moons, F.; Yao, Y. Helium content and induced swelling of neutron irradiated beryllium. Fus. Eng. Des. 1994, 29, 470–474. [Google Scholar] [CrossRef]
  20. Beeston, J.M.; Miller, L.G.; Wood, E.L.; Moir, R.W., Jr. Comparison of compression properties and swelling of beryllium irradiated at various temperatures. J. Nucl. Mater. 1984, 122–123, 802–809. [Google Scholar] [CrossRef] [Green Version]
  21. Sernyaev, G.A. Swelling of beryllium at high-temperature neutron irradiation. Role of main structural factors. Vopr. At. Nauki Tek. 1992, 63–73. (In Russian) [Google Scholar]
  22. Kurinskiy, P.; Moeslang, A.; Chakin, V.; Klimenkov, M.; Rolli, R.; Van Til, S.; Goraieb, A.A. Characteristics of microstructure, swelling and mechanical behavior of titanium beryllide samples after high-dose neutron irradiation at 740 and 873 K. Fus. Eng. Des. 2013, 88, 2198–2201. [Google Scholar] [CrossRef]
  23. Chakin, V.; Rolli, R.; Vladimirov, P.; Moeslang, A. Tritium release from highly neutron irradiated constrained and unconstrained beryllium pebbles. Fus. Eng. Des. 2015, 95, 59–66. [Google Scholar] [CrossRef]
  24. Klimenkov, M.; Chakin, V.; Moeslang, A.; Rolli, R. TEM study of beryllium pebbles after neutron irradiation up to 3000 appm helium production. J. Nucl. Mater. 2013, 443, 409–416. [Google Scholar] [CrossRef]
  25. Zimber, N.; Vladimirov, P.; Klimenkov, M.; Kuksenko, V. Investigation of a high-dose irradiated beryllium microstructure. J. Nucl. Mater. 2020, 540, 152374. [Google Scholar] [CrossRef]
  26. Fedorov, A.V.; Van Til, S.; Stijkel, M.P.; Nakamichi, M.; Zmitko, M. Post irradiation characterization of beryllium and beryllides after high temperature irradiation up to 3000 appm helium production in HIDOBE-01. Fus. Eng. Des. 2016, 102, 74–80. [Google Scholar] [CrossRef]
  27. Chakin, V.P.; Posevin, A.O.; Obukhov, A.V.; Silantyev, P.P. Radiation growth of beryllium. J. Nucl. Mater. 2009, 386–388, 206–209. [Google Scholar] [CrossRef]
  28. Geguzin, Y.E. Ascending diffusion and the diffusion aftereffect. Sov. Phys. Uspekhi 1986, 29, 467–473. [Google Scholar] [CrossRef]
  29. Chakin, V.; Rolli, R.; Schneider, H.-C.; Moeslang, A.; Kurinskiy, P.; Van Renterghem, W. Pores and cracks in highly neutron irradiated beryllium. J. Nucl. Mater. 2011, 416, 3–8. [Google Scholar] [CrossRef]
  30. Rabaglino, E.; Hiernaut, J.P.; Ronchi, C.; Scaffidi-Argentina, F. Helium and tritium kinetics in irradiated beryllium pebbles. J. Nucl. Mater. 2002, 307–311, 1424–1429. [Google Scholar] [CrossRef]
  31. Rabaglino, E.; Baruchel, J.; Boller, E.; Elmoutaouakkil, A.; Ferrero, C.; Ronchi, C.; Wiss, T. Study by microtomography of 3D porosity networks in irradiated beryllium. Nucl. Instr. Methods Phys. Res. Sect. B 2003, 200, 352–357. [Google Scholar] [CrossRef]
  32. Chakin, V.; Rolli, R.; Vladimirov, P.; Moeslang, A. Tritium and helium release from beryllium pebbles neutron-irradiated up to 230 appm tritium and 3000 appm helium. Nucl. Mater. Ener. 2016, 9, 207–215. [Google Scholar] [CrossRef]
Figure 1. Dependence of swelling S of cast Be on irradiation temperature, reactor HFR, F = (0.73–1.82) · 1022 cm−2 (E > 1 MeV) (dim.—dimension, imm.—immersion, pyc.—pycnometry, H-1—HIDOBE-01, H-2—HIDOBE-02).
Jne 03 00026 g001
Figure 2. Dependence of swelling S of beryllium irradiated at 70 °C on annealing temperature (for 1 h), reactor SM-3, F = 2.8 · 1022 cm−2 (E > 1 MeV).
Jne 03 00026 g002
Figure 3. Dependence of swelling S of titanium beryllide Be-7Ti on irradiation temperature, reactor HFR, F = (0.73–1.82) · 1022 cm−2 (E > 1 MeV) (dim.—dimension, imm.—immersion, pyc.—pycnometry, H-1—HIDOBE-01, H-2—HIDOBE-02).
Jne 03 00026 g003
Figure 4. Dose dependence of swelling S of HE-56 beryllium grade, reactor SM-3, Tirr = 70 °C, F = (0.25–7.7) · 1022 cm−2 (E > 1 MeV) (imm.—immersion, dim.—dimension).
Jne 03 00026 g004
Figure 5. Dose dependence of swelling S of HE-56 beryllium grade, reactor SM-3, Tirr = 200 °C, F = (0.3–6.5) · 1022 cm−2 (E > 1 MeV) (imm.—immersion, dim.—dimension).
Jne 03 00026 g005
Figure 6. Dose dependence of swelling S of VHP-400 beryllium grade, reactor BOR-60, Tirr = 420 °C, F = (5–8) · 1022 cm−2 (E > 1 MeV) (imm.—immersion).
Jne 03 00026 g006
Figure 7. Dose dependence of swelling S of cast Be, reactor HFR, Tirr = 430–750 °C, F = (0.73–1.82) · 1022 cm−2 (E > 1 MeV) (pyc.—pycnometry).
Jne 03 00026 g007
Figure 8. Small helium bubbles in microstructure of HE-56 beryllium grade irradiated at 70 °C (a) and 200 °C (b) to neutron fluences of 7 · 1022 cm−2 (E > 1 MeV) and 6.5 · 1022 cm−2 (E > 1 MeV), accordingly (transmission electron microscopy).
Jne 03 00026 g008
Figure 9. Small bubbles (a) and big pores (b) in microstructure of cast Be irradiated at 517 °C to F = 1.51 · 1022 cm−2 (E > 1 MeV) and 750 °C to neutron fluence of 1.82 · 1022 cm−2 (E > 1 MeV), accordingly (optical microscopy).
Jne 03 00026 g009
Figure 10. Two-phase microstructure of cast Be-7Ti irradiated at 517 °C to neutron fluence of 1.51 · 1022 cm−2 (E > 1 MeV) (a) and at 750 °C to neutron fluence of 1.82 · 1022 cm−2 (E > 1 MeV) (b). View of bubbles from picture (b) at higher magnification (c) (optical microscopy).
Jne 03 00026 g010
Figure 11. Porosity in Be-phase in Be-7Ti specimens on irradiation temperature.
Jne 03 00026 g011
Table 1. Chemical composition of beryllium-based materials in wt.%.
GradeBeFeAlNiCuMgMnCrSiUBeOTi
HE-56balance0.170.0260.0170.0040.00050.010.0410.0160.00031.48-
VHP-400 *-----------
Cast Be0.10.070.01<0.010.050.007<0.010.030.00680.02-
Cast Be-7Ti0.0310.060.0030.004<0.0010.0070.0050.0330.00410.2728.5
* No data.
Table 2. Irradiation parameters of beryllium specimens. Cast Be and Be-7Ti were irradiated at four temperatures in two campaigns of HIDOBE-01 (H-1) and HIDOBE-02 (H-2) to two different neutron fluences, helium and tritium productions (left sub-column in each column refers to H-1, right to H-2).
GradeReactorTirr, °CF · 1022, cm−2 (E > 1 MeV)Helium
Production, appm
Tritium
Production, appm
HE-56SM-3700.25–7.71071–33,000152–4675
2000.3–6.51286–27,857182–3946
VHP-400BOR-604205–86125–9800178–285
Cast BeHFR4300.73; 1.162370; 4144215; 430
5170.87; 1.512860; 5142279; 550
6600.94; 1.733070; 5757305; 625
7500.93; 1.823060; 5992301; 653
Cast Be-7TiHFR4300.73; 1.162370; 4144215; 430
5170.87; 1.512860; 5142279; 550
6600.94; 1.733070; 5757305; 625
7500.93; 1.823060; 5992301; 653
Table 3. Volume of open pores in irradiated cast Be. H-1—HIDOBE-01, H-2—HIDOBE-02.
Tirr, °CS, %
ImmersionPycnometryOpen Pores
H-1H-2H-1H-2H-1H-2
6604.5220.134.5217.0903.04
75012.1234.0610.1221.71212.35
Publisher’s Note: MDPI stays neutral with regard to jurisdictional claims in published maps and institutional affiliations.

