1. Introduction
Sodium-cooled fast reactors (SFRs) are one of several promising advanced reactor concepts being considered for commercialization and have received renewed attention from industry and research institutions. Paramount to the guaranteed safety of reactor plant operations is a sound physical understanding of the systems involved, achieved largely through computational analyses. To build confidence in computational analyses, the simulation software must be validated through comparison with experiments. But, as is true for many advanced reactor concepts, experimental data for SFRs are limited; data from the Experimental Breeder Reactor II (EBR-II) provides one of these limited data sets.
The EBR-II was operated from 1964 through 1994 by Argonne National Laboratory on a site which now belongs to Idaho National Laboratory (INL). The reactor had a maximum heat output of 62.5 MWth. Although initially designed to breed more fuel than it consumed, EBR-II was later reconfigured to operate as an irradiation facility, becoming a testbed for a variety of fuels and structural materials. The evaluation of EBR-II run 138B, a test within the Shutdown Heat Removal Tests series conducted on 3 April 1986, was recently included in the 2018 Edition of the International Handbook of Evaluated Reactor Physics Benchmark Experiments (IRPhEP handbook) [
1].
Although the measured data provided in this benchmark are limited to the eigenvalue, the availability of the benchmark model specifications offers a basis for further performance assessments of computational methods and data using realistic geometrical and material specifications for investigations of other key metrics beyond eigenvalue. They also provide the basis for code-to-code comparisons across institutions based on one thoroughly reviewed data set.
Various computational analyses of the EBR-II have been performed for different areas of interest, but only limited studies focused on neutronics analysis (e.g., [
2,
3,
4,
5]). Furthermore, at the time of this writing, only the EBR-II IRPhEP benchmark authors have published computational analyses based on the new IRPhEP benchmark specifications [
1,
6,
7]. While these analyses cover uncertainty and sensitivity analyses with respect to several modeling parameters such as geometric dimensions and material compositions, they do not cover an analysis of the impact of uncertainties in nuclear data on the calculated results.
The uncertainties of important quantities due to nuclear data uncertainties in SFR analyses can be significantly larger than those of thermal systems. This is due to the large uncertainties in relevant cross sections over the high energy range. The eigenvalue uncertainty for SFRs can be 2–3 times greater than for light water reactors (LWRs), depending on the libraries used. For example, a reactivity uncertainty for a typical SFR with mixed uranium-transuranic fuel was found in the range 1–1.5% when using ENDF/B-VII.1 data. The uncertainties of important reactivity coefficients such as the sodium void coefficient was found as high as 5%. The major contributor to the uncertainty of many reactivity coefficients in these systems is
U inelastic scattering due to its large uncertainty in the fast energy range. Other relevant contributors to reactivity coefficients uncertainties, are the scattering reactions of
Na as the coolant and
Fe as the major component in structural materials [
8].
For SFRs with enriched U such as the EBR-II, it is noted that the U cross section data are well known in the thermal energy range due to extensive history of measurements and evaluations targeting traditional LWRs. However, in the fast energy range, the neutron capture cross section of U shows a large uncertainty of over 30% in the ENDF/B-VII.1 releases. Due to the importance for reactivity, this large uncertainty can have a significant impact on the reactivity uncertainty. A significant reduction in reactivity uncertainty is expected when using ENDF/B-VIII.0 data because of the significantly reduced uncertainty for this reaction in the recent library release.
The evaluated nuclear data libraries are undergoing continuous modifications based on additional measurements or improved evaluations, and new revisions are being released on a regular basis. Updates of relevant cross sections and uncertainties between the ENDF/B-VII.1 and ENDF/B-VIII.0 releases, including
Fe,
U, and
Pu, can impact reactivity results. For example, reactivity differences of up to 200 pcm were observed in previous studies as a result of updates in
U data [
9,
10].
This paper presents the computational analysis of the EBR-II based on the IRPhEP benchmark specifications using SCALE, a widely used computational tool set for criticality safety, reactor physics, shielding, and sensitivity and uncertainty analysis [
11]. Although SCALE has been thoroughly tested and validated for light water reactor (LWR) criticality, fewer non-LWR systems are part of SCALE’s criticality safety validation suite [
12]. Testing and validation for application to non-LWR systems is ongoing. Recent activities with respect to SCALE’s SFR applications include nuclear data performance assessments for fast-spectrum systems [
8,
9,
10,
13] and cross section processing development [
14]. Current modeling efforts concern several non-LWR systems for the validation of SCALE and the support of several application activities, including severe accident analysis and nuclear data performance assessment.
The purpose of this article is (1) to assess the performance of the SCALE code system for fast reactor analysis by comparing calculated results with measurements, (2) to perform code-to-code comparisons based on previously published results, and (3) to increase awareness of existing gaps in nuclear data and uncertainties for the simulation of quantities of interest for fast-spectrum systems.
Eigenvalue results obtained with SCALE’s Monte Carlo code KENO-VI using Evaluated Nuclear Data File (ENDF)/B-VII.1 and VIII.0 nuclear data library evaluations are compared to the benchmark eigenvalue and calculated results published by the benchmark’s authors, obtained with the Monte Carlo N-Particle Transport Code (MCNP) and ENDF/B-VII.0 data. The benchmark’s authors performed extensive studies to assess the impact of uncertainties in various modeling parameters—such as material densities and geometric dimensions on the eigenvalue—to determine the benchmark eigenvalue uncertainty. However, these studies did not include uncertainty resulting from nuclear data on the calculated eigenvalue. This type of information can be used to help identify the causes of observed differences between calculated and experimental eigenvalue results. The study presented in this work is closing this gap by analyzing the impact of nuclear data uncertainties on the calculated eigenvalue uncertainty; the major drivers to the obtained uncertainty are also being investigated. This type of information is also essential for assessing the impact of data differences between different ENDF/B evaluations and for providing recommendations for further nuclear data measurements to reduce important data uncertainties. The analyses presented here go beyond the eigenvalue calculation to include reactivity coefficients and radial power distribution in an attempt to reveal additional relevant nuclear data impacting other operations and safety key metrics.
2. EBR-II
Table 1 presents an overview of the key characteristics of the EBR-II benchmark [
1]. A summary of these characteristics, for which a detailed description is available in the IRPhEP benchmark, is provided here for completeness.
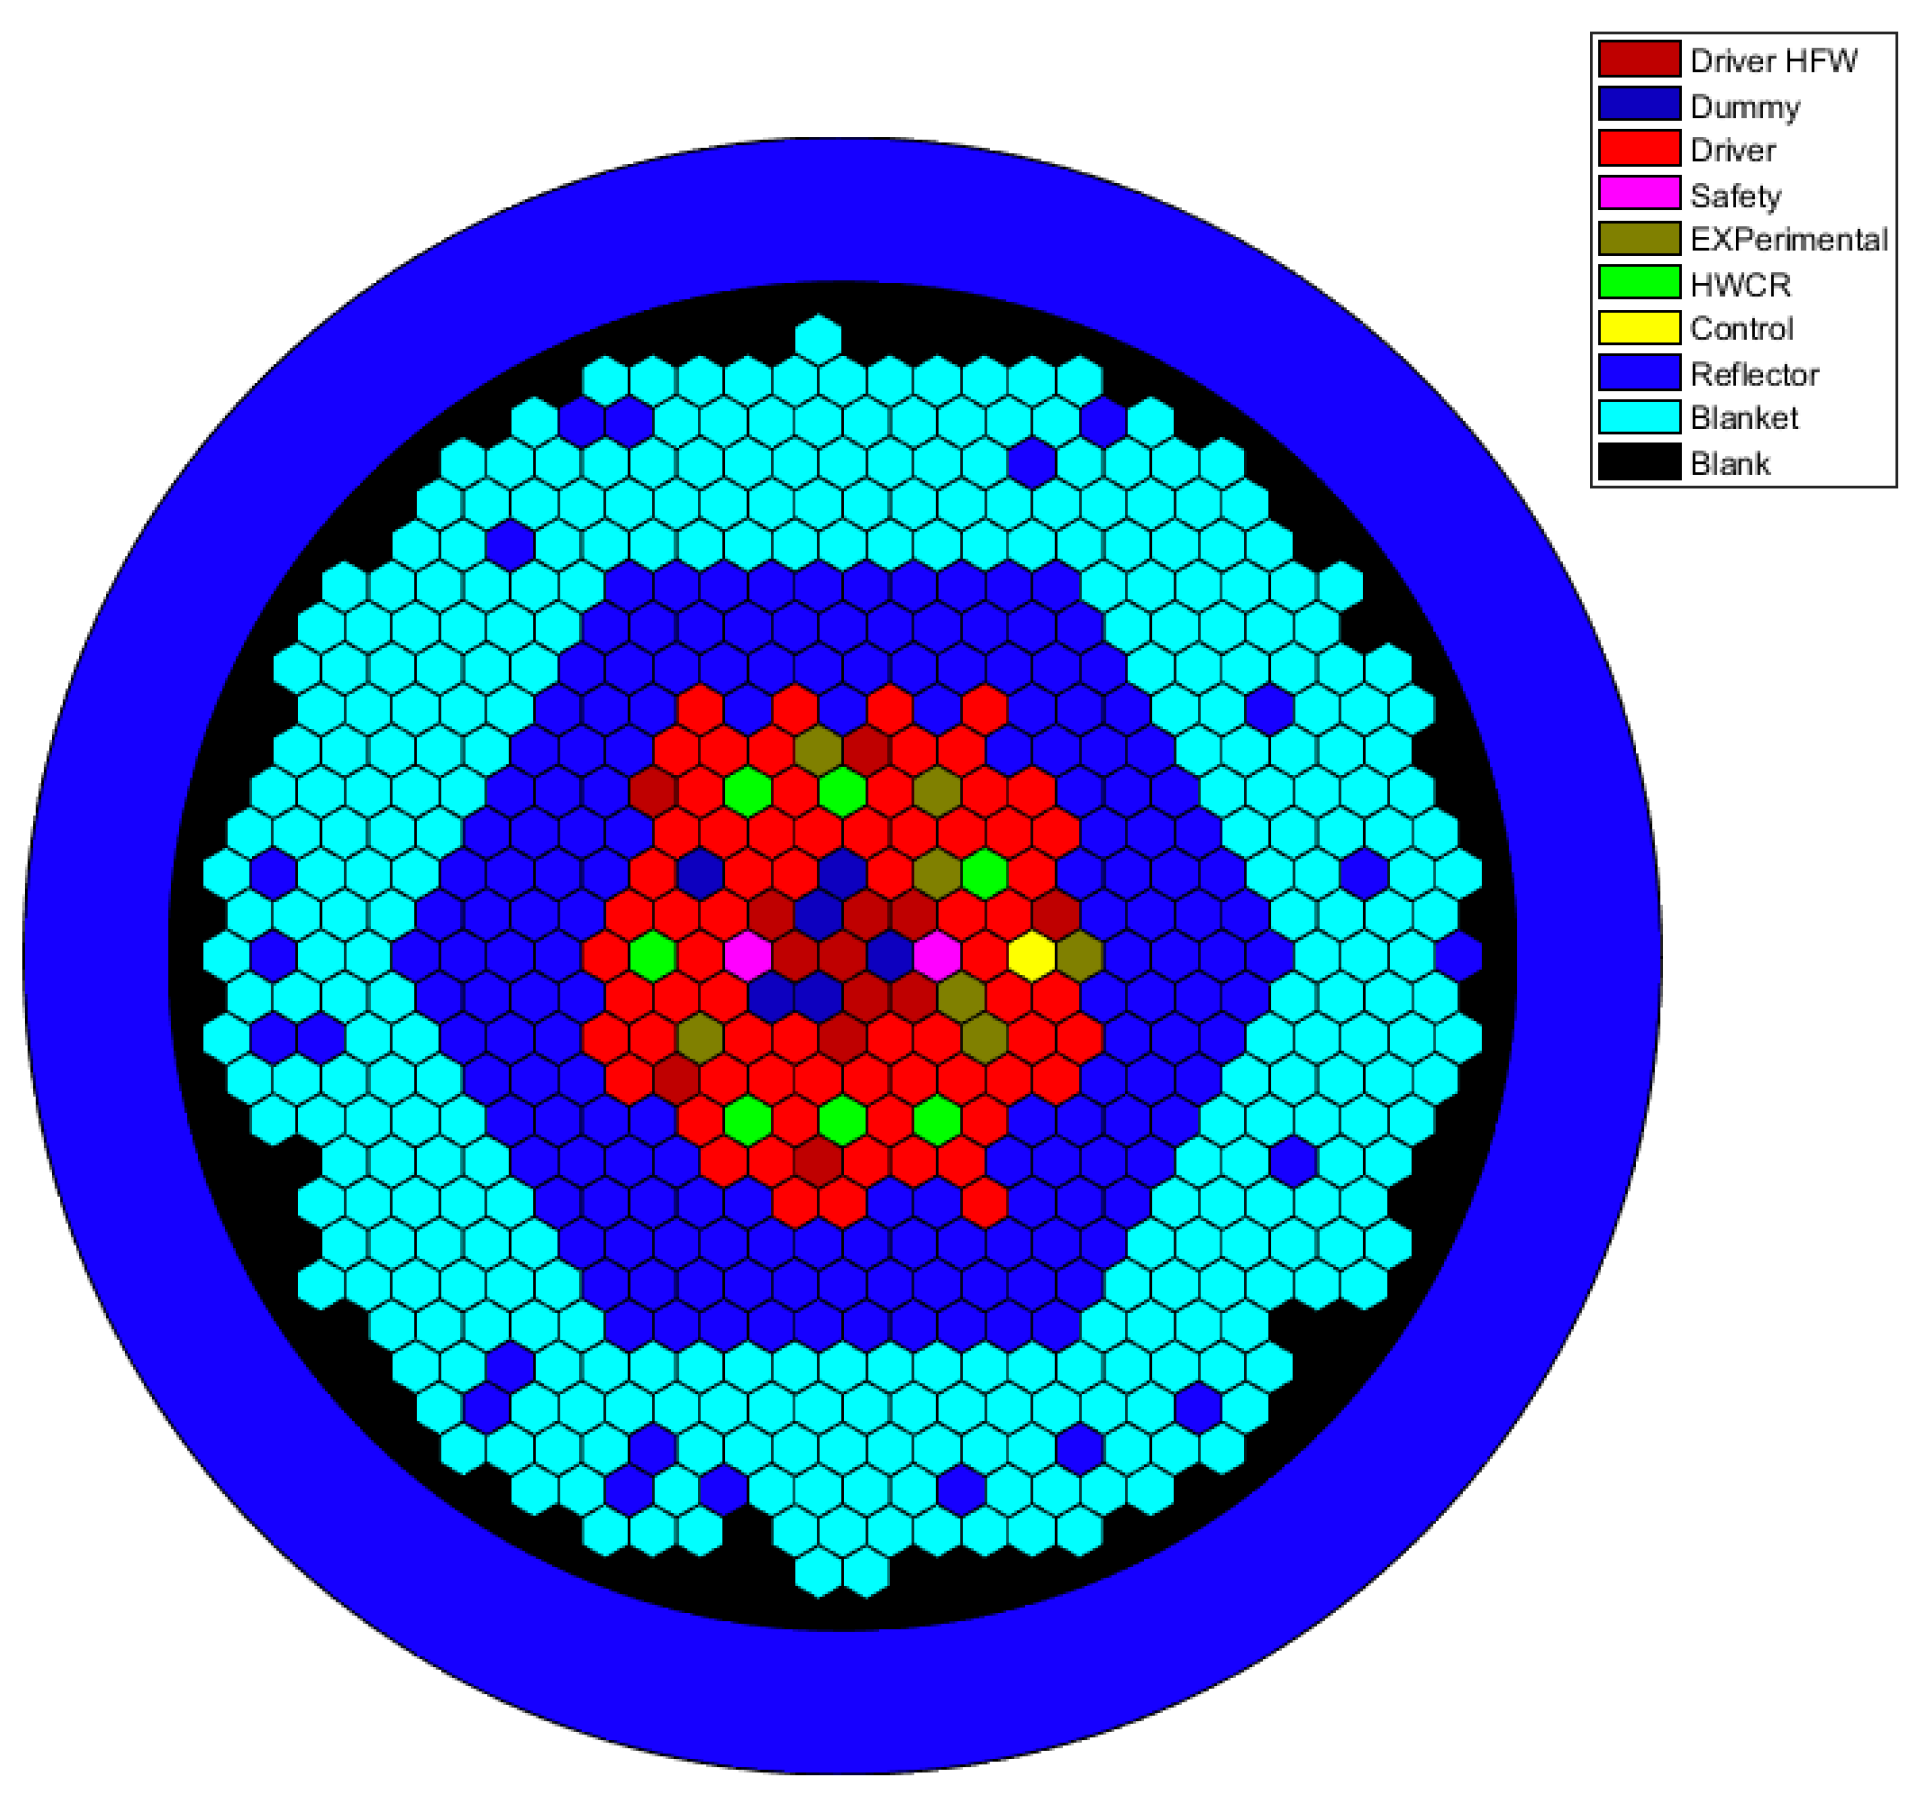
The EBR-II core consisted of 637 hexagonal assemblies divided into three regions: the core, an inner blanket, and an outer blanket (
Figure 1). The core region consisted of driver (full worth and half worth) assemblies, experimental/instrumentation assemblies, dummy assemblies, and movable assemblies that were used for reactivity control. The safety and control assemblies contained a fuel region and an absorber region. The core was surrounded by an inner blanket of stainless-steel reflector assemblies. The outer blanket region consisted almost entirely of depleted uranium assemblies for breeding and reflection.
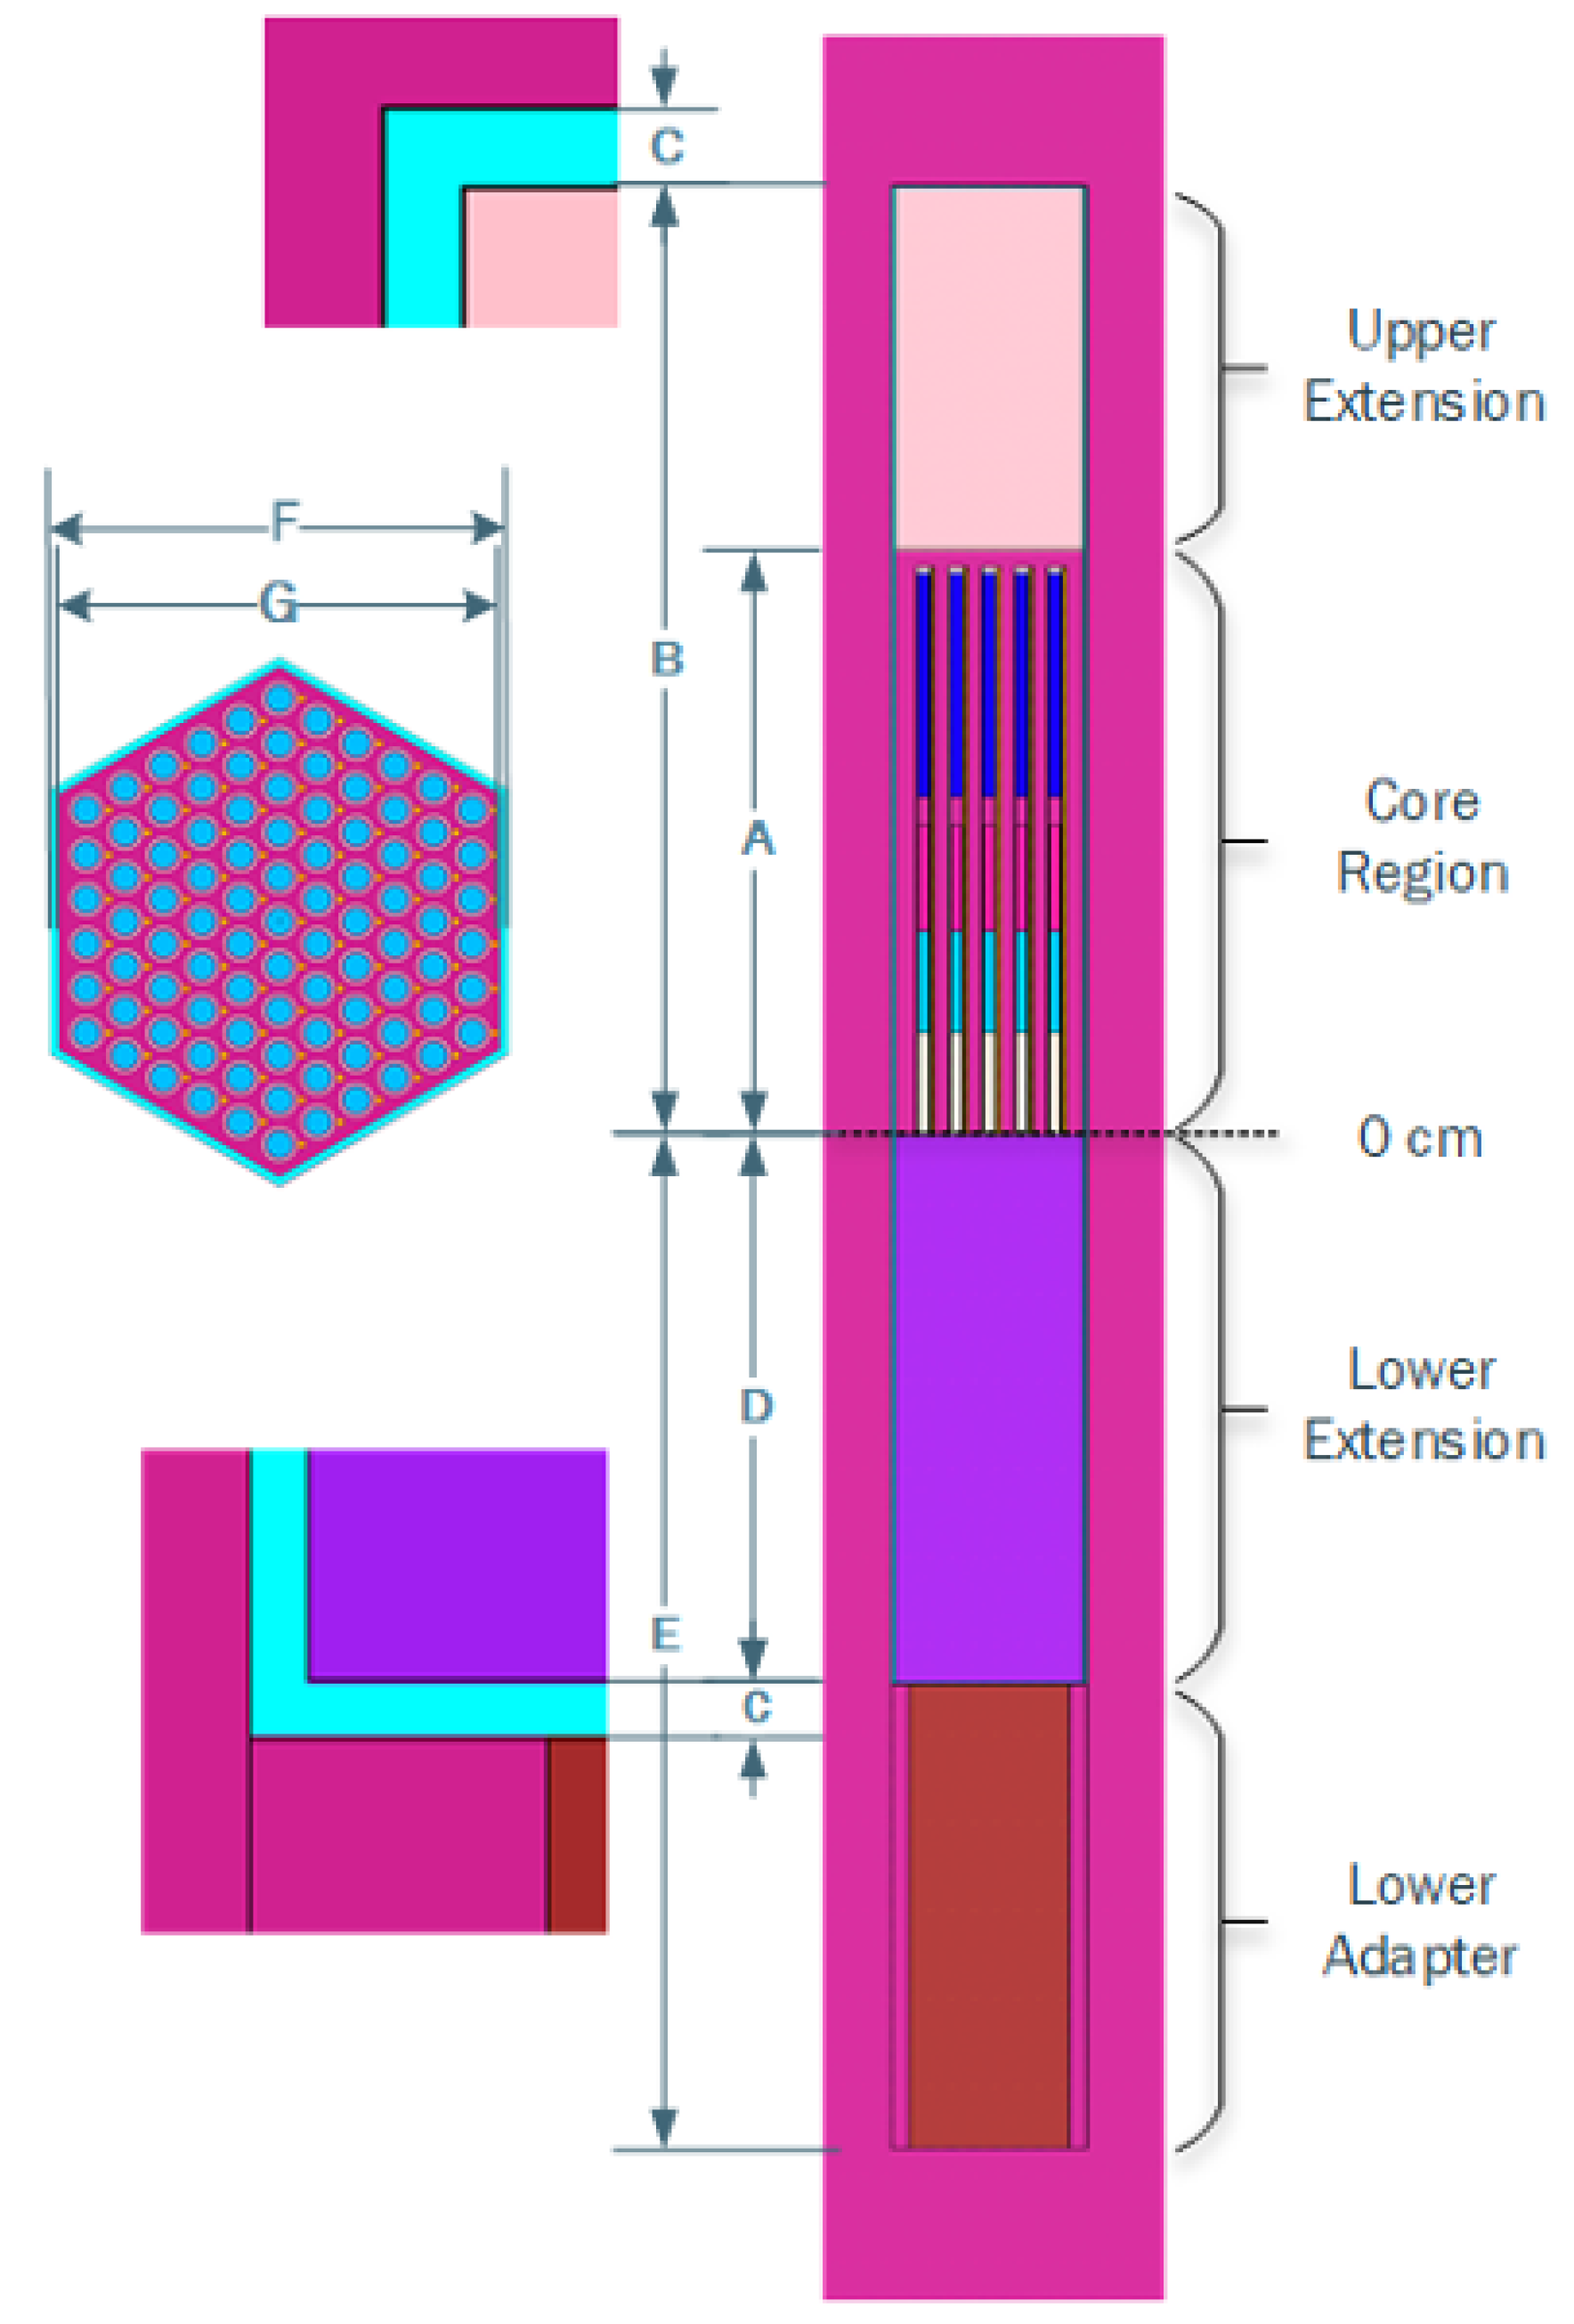
The driver fuel assemblies contained a hexagonal lattice of 91 fuel rods (
Figure 2 and
Figure 3). Each fuel rod consisted of enriched uranium metal surrounded by a stainless-steel cladding. A wire was wrapped helically up the length of each fuel rod. Due to the complexity of modeling a toroid, the benchmark specifications suggest modeling a single cylinder corresponding to the wire wrap. The specifications also suggest that the regions above and below the fuel area—the upper extension, lower extension, and lower adapter—be simplified as homogenized regions of stainless steel and sodium. All materials in the EBR-II benchmark are assumed to be at a temperature of 343 °C.
The IRPhEP handbook provides an experimental eigenvalue, along with the corresponding experimental uncertainty. The results of a criticality calculation with MCNP using ENDF/VII.0 data based on the benchmark model are also provided. No other calculations of this particular EBR-II benchmark have been found in the open literature.
3. Applied Computational Methods and Data
The results of all calculations presented in this article were obtained using the SCALE code system [
11]. SCALE provides a comprehensive, verified and validated, user-friendly tool set for criticality safety, reactor and lattice physics, radiation shielding, spent fuel and radioactive source term characterization, and sensitivity and uncertainty analysis. From the existing modules for different application spaces, the three-dimensional (3D) 3d Monte Carlo neutron transport code KENO-VI and the sensitivity and uncertainty analysis sequences TSUNAMI and Sampler were applied in the work. The applied methods and tools are further described in the subsections below.
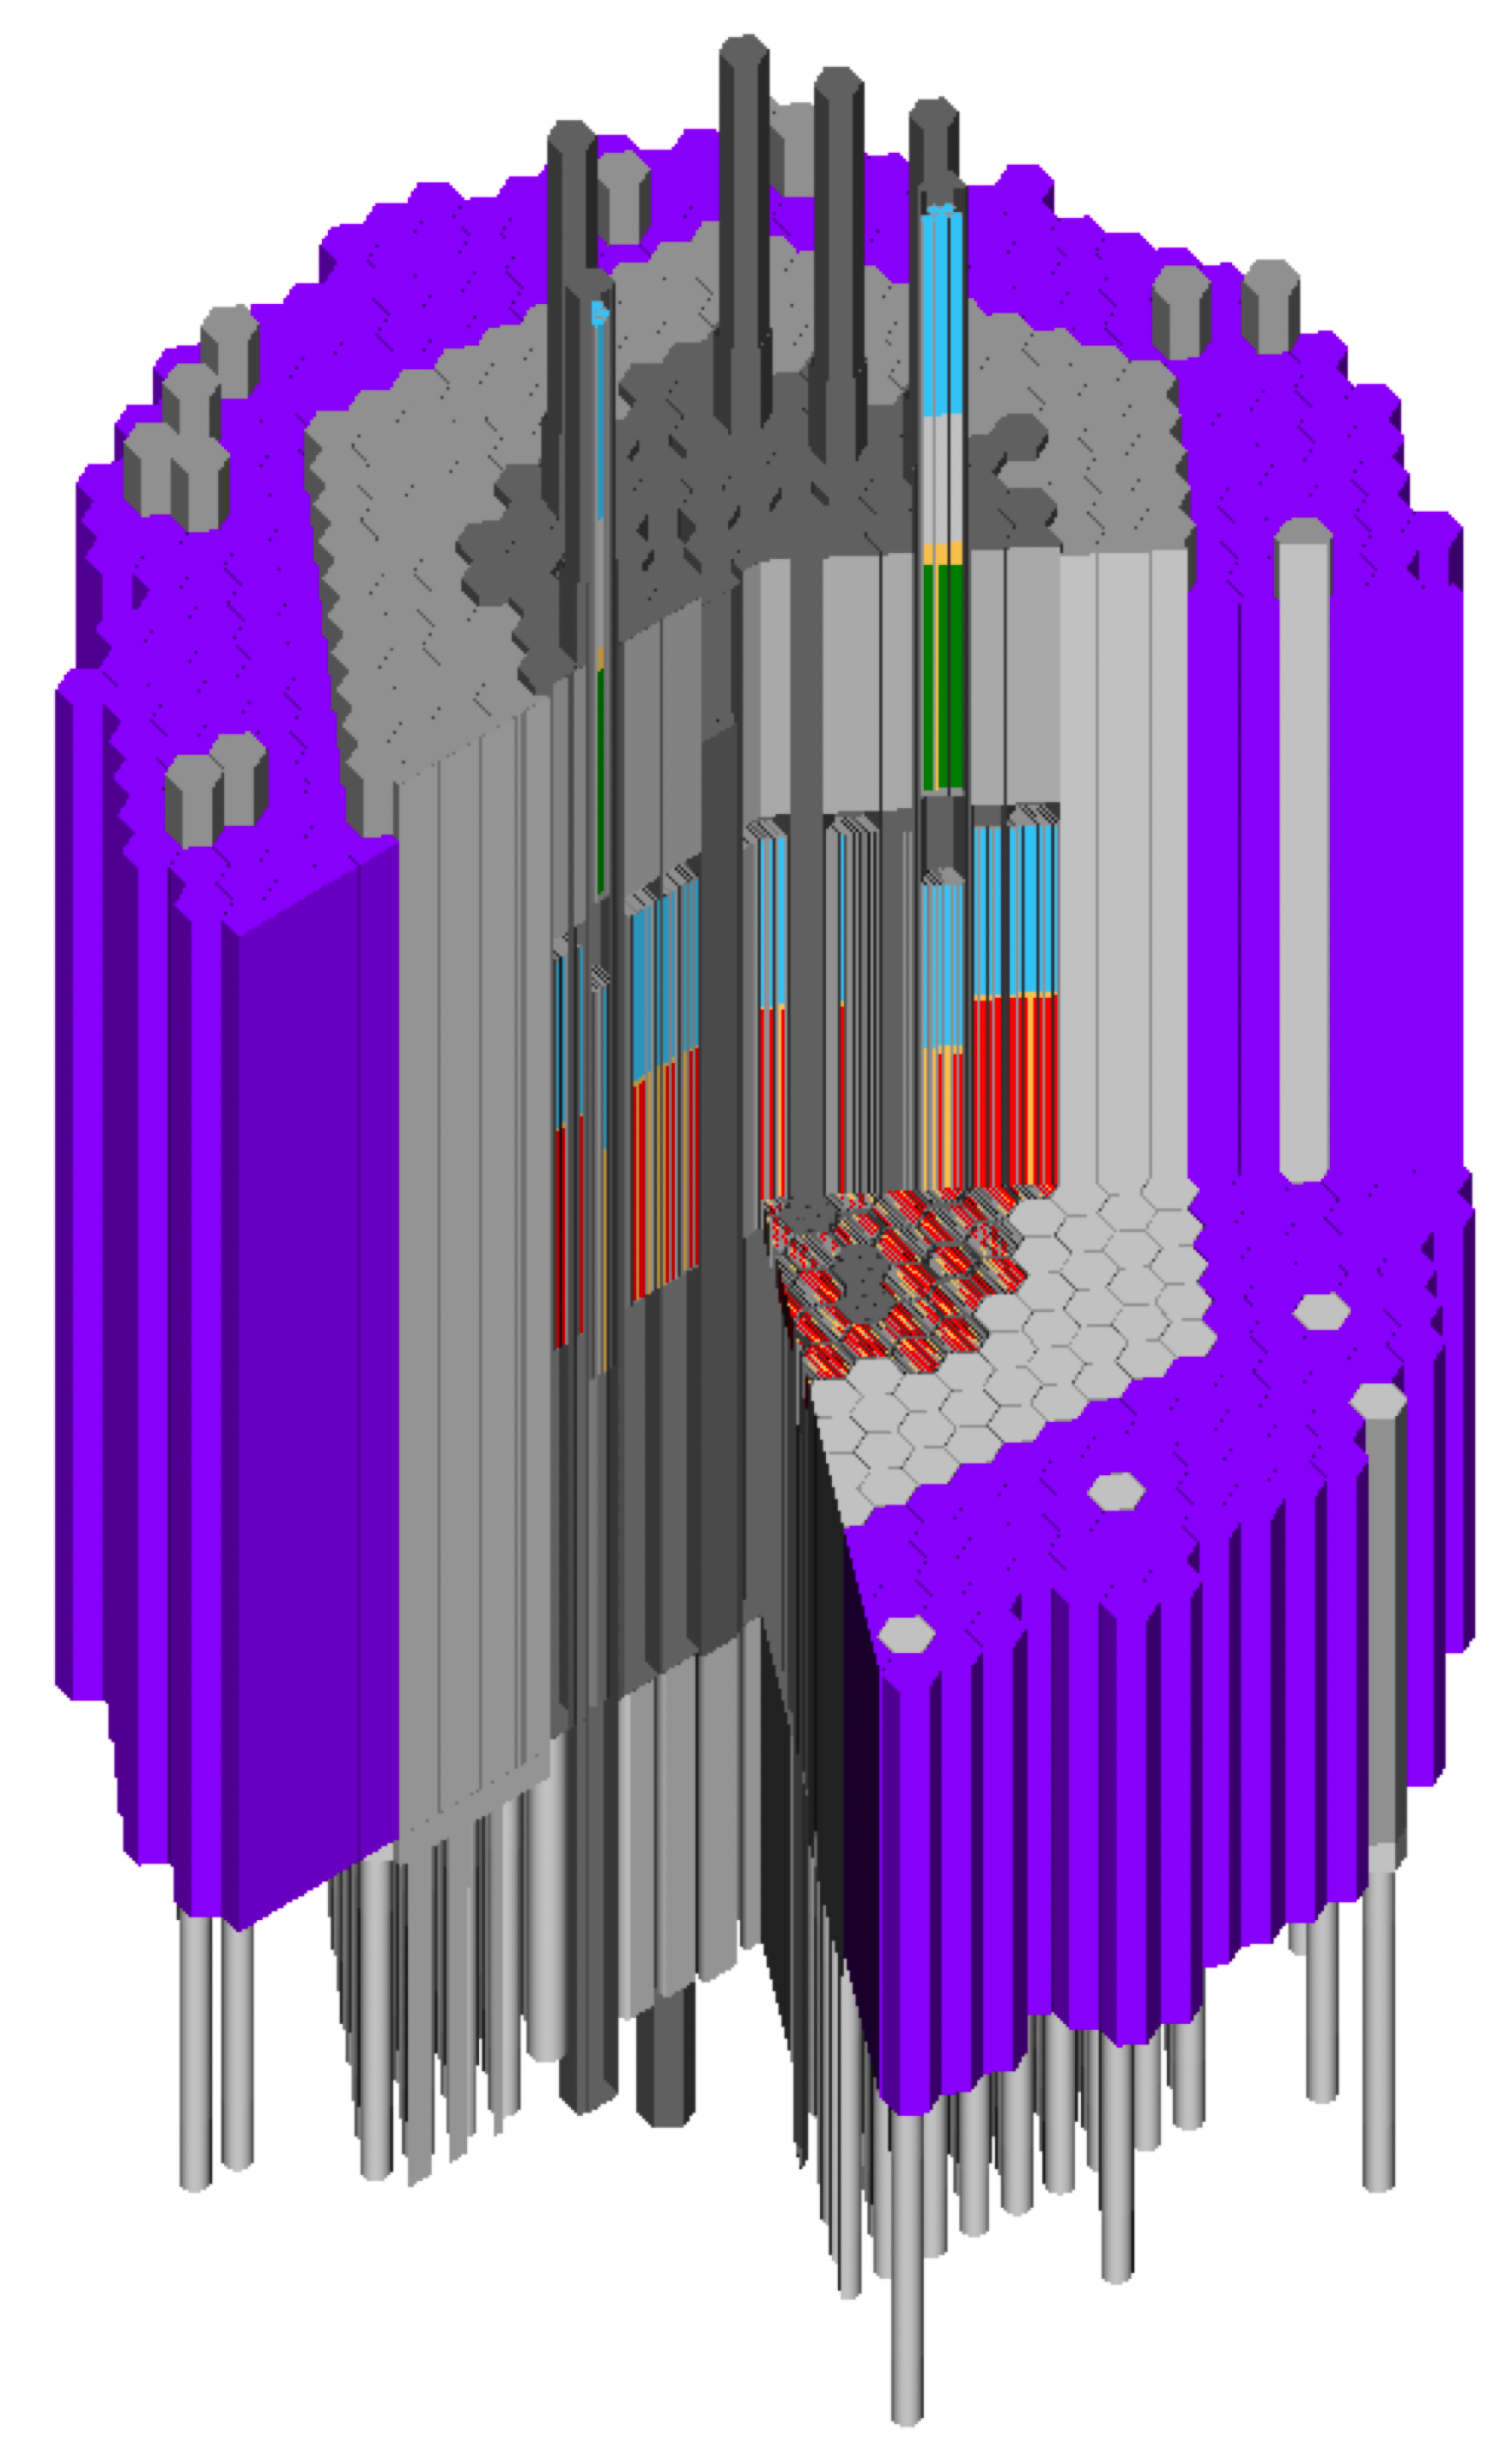
A three-dimensional (3D) SCALE model of the EBR-II was developed based on the benchmark specifications in the IRPhEP handbook [
1].
Figure 4 and
Figure 5 show visualisations of the full core model, and
Figure 6 shows an image of a half-worth driver assembly.
This SCALE model was used as a basis for performing nominal, sensitivity, and uncertainty analyses for the following quantities of interest:
eigenvalue (k),
Control rod (CR) worth: reactivity difference with all control assemblies out vs. all control assemblies in,
Sodium void worth: reactivity difference between the nominal model (1) and a model with all sodium removed,
Radial power profile.
3.1. Neutron Transport
The nominal criticality calculations presented in this work were performed with SCAlE’s Monte Carlo code KENO-VI in continuous-energy (CE) mode. For the sensitivity and uncertainty analyses discussed in the following sections, KENO-VI was applied in either CE or in multigroup (MG) mode. The assembly powers were determined by applying KENO-VI in MG mode as part of the TRITON sequence for depletion analysis. TRITON provides a list of specific powers for all materials, determined from the energy released in the materials through fission and capture. By considering that each fuel assembly is using a unique fuel material, the power in each assembly was calculated using the specific power and the heavy metal mass of the fuel in the particular assembly.
3.2. Sensitivity Analysis
Sensitivity analyses were performed for the eigenvalue and the reactivity effects with the perturbation theory-based approach implemented in SCALE’s TSUNAMI code [
15,
16]. The CE version of TSUNAMI, in particular the
contributon-linked eigenvalue sensitivity /uncertainty estimation via track length importance characterization (CLUTCH) method [
17] were applied. TSUNAMI calculates sensitivity coefficients for all nuclides included in the model of interest with all reactions in all energy groups [
18,
19].
The application of CLUTCH requires appropriate settings to be determined to calculate the average importance generated per fission neutron emitted (F*) in a spatial grid. Because of the fast neutron flux spectrum in the EBR-II reactor and the consequential small local flux gradients, a relatively coarse spatial grid was applied in the driver fuel region with pitches of 6.5, 6.83 and 4.34 cm in x, y, and z-directions, respectively. Outside the driver core (radially and axially), an even coarser grid was applied to cover fuel in the control rod assemblies and the fuel in the outer reflector ring. Ten latent generations were applied in the calculation of F* during the simulation of the inactive neutron cycles (see [
17] for detailed explanations on latent generations). In 600 active and 200 inactive cycles, 200,000 neutron histories were calculated per cycle. A large number of inactive cycles was necessary to sufficiently converge F*, and a large number of active cycles improved the convergence of the energy-dependent sensitivities. Using the settings described, the calculation took 886.65 CPU-hours on a computing cluster with 2.30 GHz Intel Xeon CPUs.
Direct perturbation calculations were performed in conjunction with all CE TSUNAMI calculations to confirm the largest obtained (nuclide-integrated) sensitivities and thereby the adequacy of the chosen settings.
TSUNAMI was applied to calculate sensitivities of the eigenvalue. For reactivity differences such as temperature feedback and control rod worth, SCALE’s module TSAR [
20] was used to combine the sensitivity coefficients obtained from TSUNAMI calculations at two different states for determining sensitivity coefficients for the reactivity difference.
3.3. Uncertainty Analysis
Uncertainty analyses were performed through linear perturbation theory and the random sampling approach.
3.3.1. Linear Perturbation Theory
The nuclear data uncertainties are given in energy-dependent covariance matrices for each nuclide reaction and for correlations between different nuclide reactions. The multiplication of these covariance matrices with the corresponding sensitivity coefficients determined with TSUNAMI in the so-called
sandwich formula leads to the total output variance [
15,
16]. In addition to the total output uncertainty, TSUNAMI provides a list of the individual contributions of all relevant covariance matrices so that the top contributors to the output uncertainty can be identified.
3.3.2. Random Sampling Approach
Since TSUNAMI does not permit the direct calculation of sensitivity coefficients for power, the random sampling approach as implemented in SCALE’s Sampler sequence [
21] was used to study uncertainties resulting from nuclear data of the radial power profile. To identify the top contributing nuclide reactions to the output uncertainty, Sampler calculates the sensitivity index R
[
8] of all reactions of all nuclides relevant for the model. On a level from 0 to 1, R
provides a measure of the importance of an individual nuclear reaction to the observed output uncertainty.
In this work, Sampler was used in combination with KENO-VI in MG mode using SCALE’s 302-group fast reactor library to study uncertainties of the EBR-II radial power profile. A sample size of 500 was used. Each calculation was run using 200,000 neutrons per cycle in 200 active and 50 inactive cycles.
To estimate the bias in the power distribution resulting from the MG approximations, a CE calculation was run for comparison using the same neutron settings. The CE transport calculation took ∼80.9 CPU-hours, and the MG transport calculation only took 23.1 CPU-hours on a computing cluster with 2.90 GHz Intel Xeon CPUs. In both cases, the loading and preparation of cross sections (in the case of MG, additionally the self-shielding calculation), as well as the processing of the geometry, took a significant amount of time because of the large number of materials (887) and cells (1131 units) in the model.
3.4. Applied Nuclear Data
As part of the TSUNAMI and Sampler calculations, the KENO-VI neutron transport calculations were performed using the ENDF/B-VII.1 and ENDF/B-VIII.0 CE cross section libraries [
22,
23]. For the uncertainty quantification, TSUNAMI applied the 56-group ENDF/B-VII.1–based and the 56-group ENDF/B-VIII.0–based covariance libraries. Sampler calculations were performed using perturbation factors that were generated based on these two covariance libraries. More details on these libraries can be found in the SCALE manual [
11].
All analyses were performed using codes and nuclear data libraries from a pre-release version of SCALE 6.3. Relevant nominal data and uncertainties for analysis of the EBR-II are compared between the different ENDF/B versions in
Appendix A.
4. Results
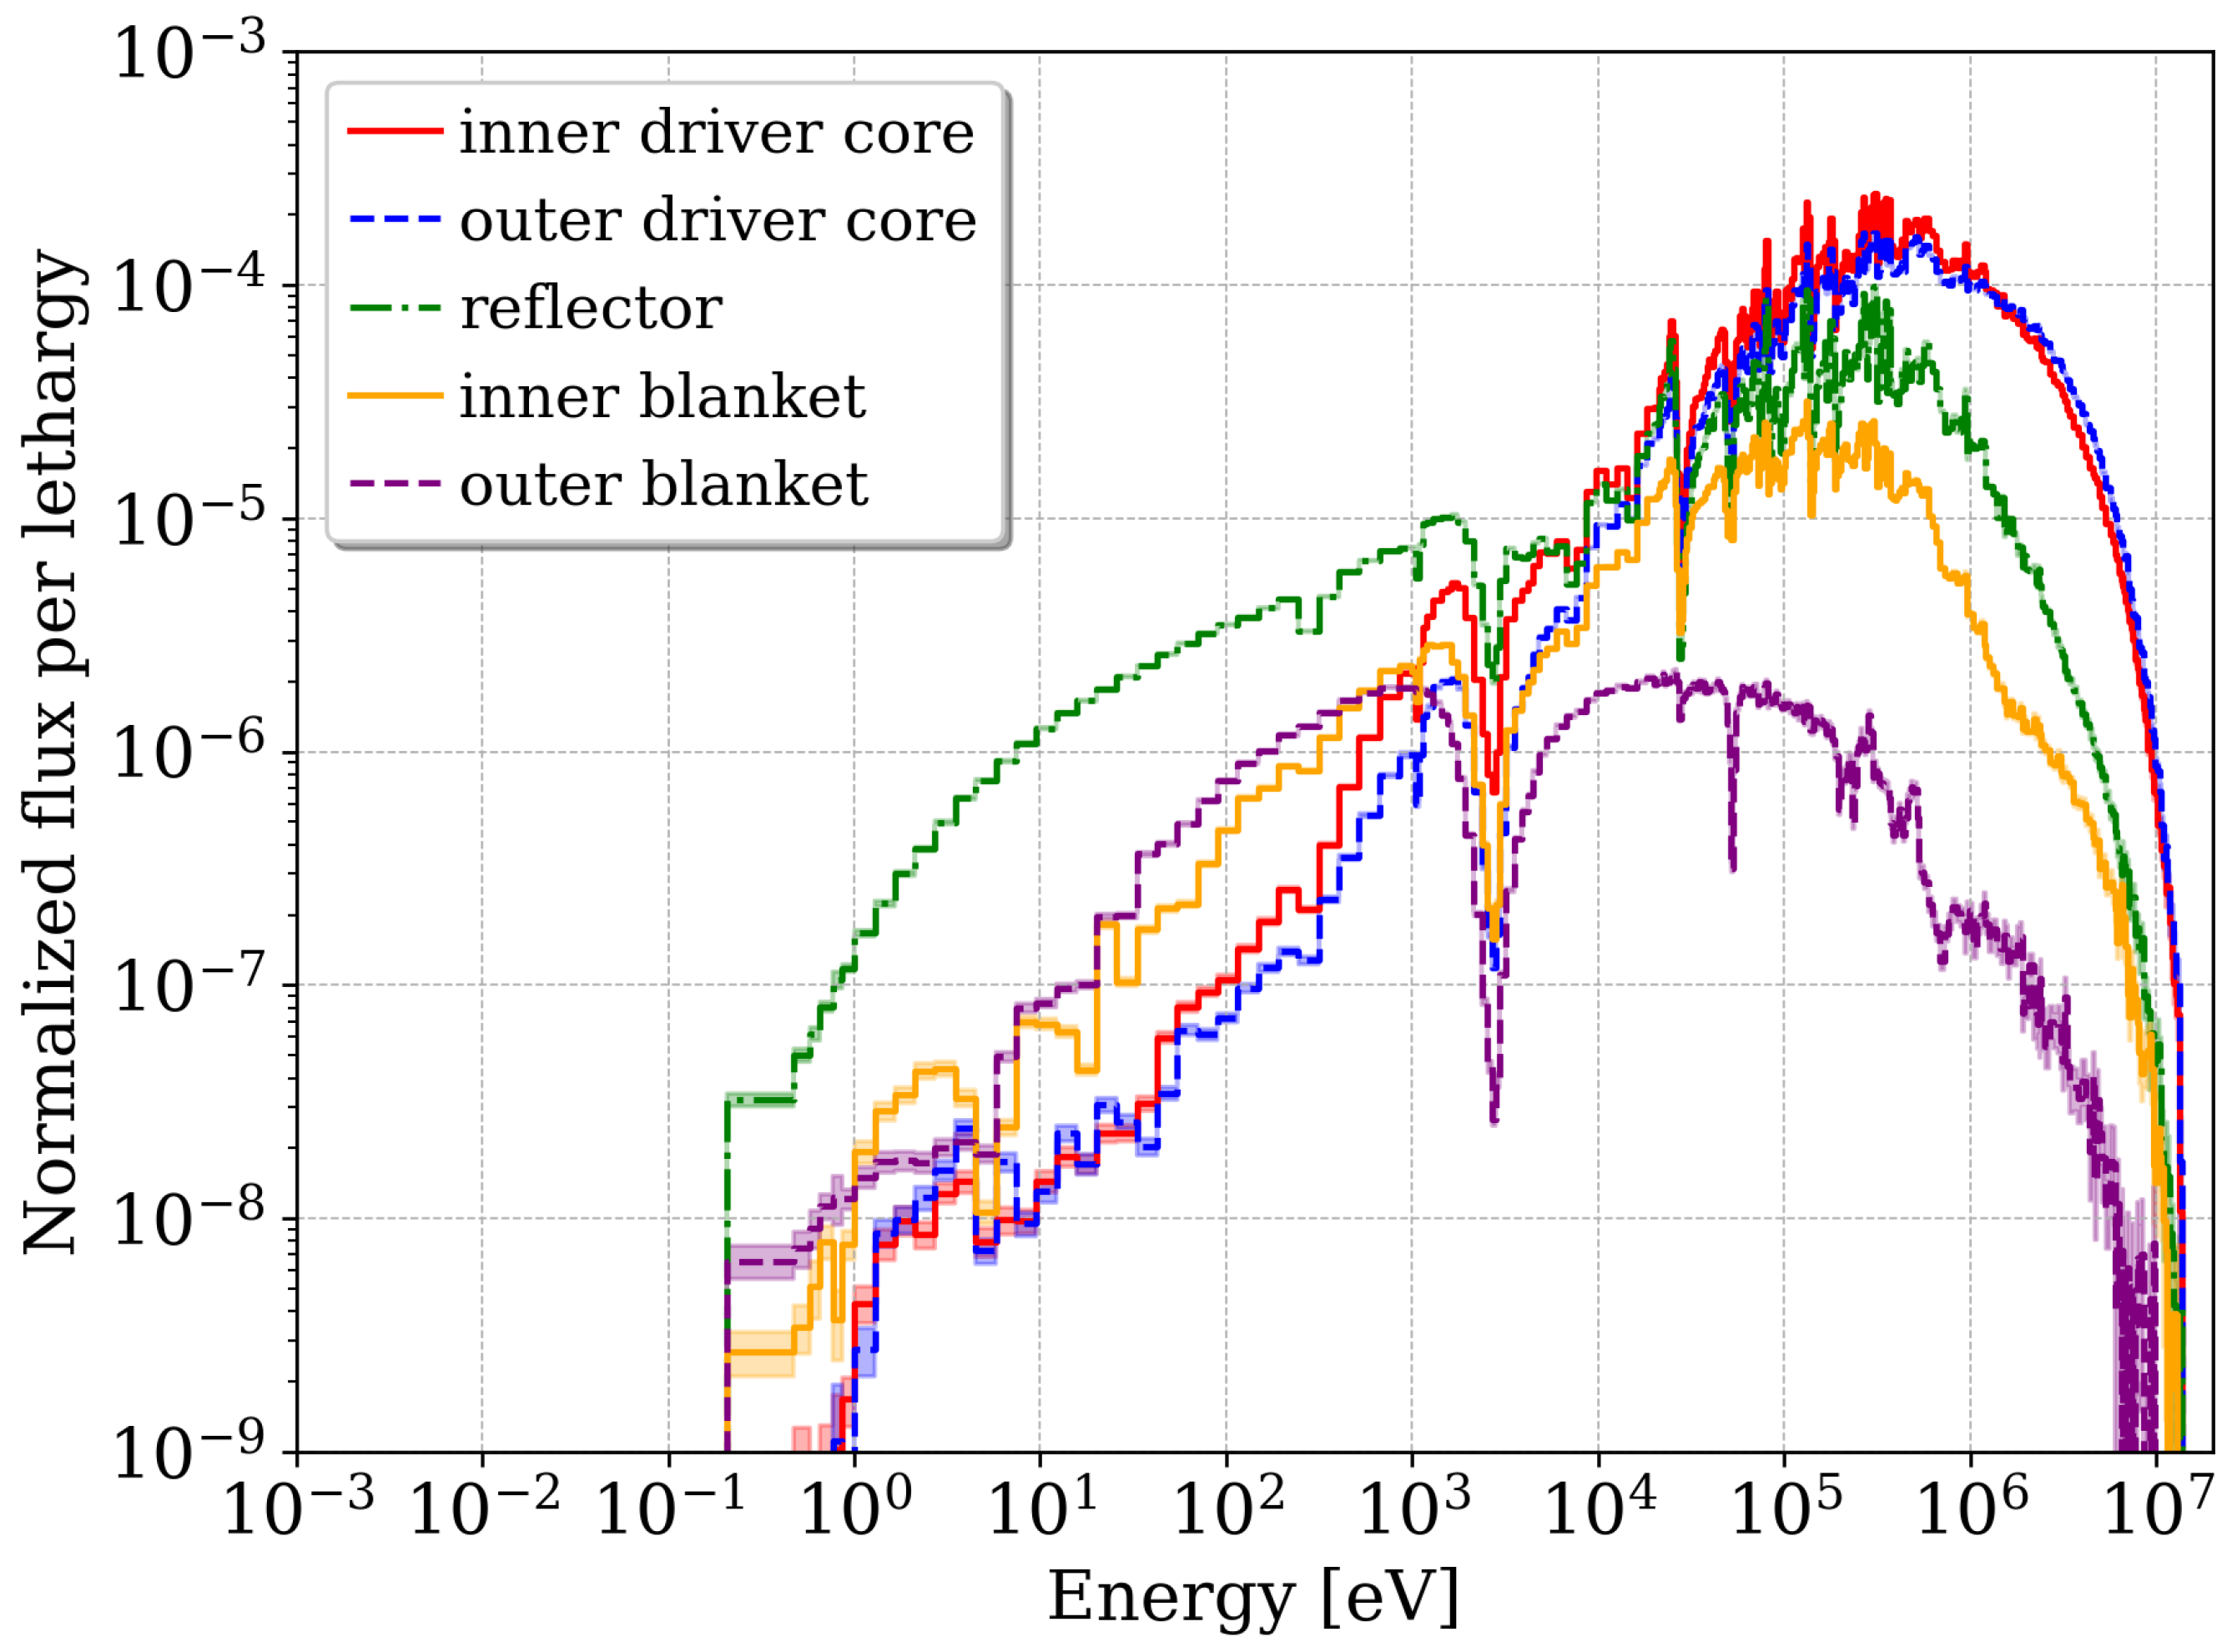
To support the discussion of results,
Figure 7 presents the energy-dependent flux distribution as seen in different regions of the core. The flux was obtained by overlaying a 3D mesh on the core geometry so that each mesh cell contains one fuel element in the x-y direction. The displayed fluxes present the normalized flux per unit lethargy in individual fuel elements at different radial locations.
It is interesting to note that the initial plan was to investigate the Doppler reactivity of the EBR-II’s fuel, but only a small reactivity difference of less than 100 pcm was obtained, even when the fuel temperature increased from 616 to 1800 K. Because of the hard neutron flux spectrum in the EBR-II, Doppler broadening in the resonance range with increasing temperature only has a minor effect on the reactivity. With such a small reactivity difference, sensitivities of this quantity cannot be determined with sufficient statistical convergence. Therefore, the analysis was omitted in this study. Choi et al. determined EBR-II’s fuel Doppler reactivity as −0.04268
$ when doubling the fuel temperature [
24]; given an effective delayed neutron fraction between 200 and 700 pcm, −0.04268
$ corresponds to a reactivity between 8 and 30 pcm, thus confirming the small Doppler reactivity.
4.1. Nominal Results
Table 2 compares the k
results obtained with KENO-CE to the experimental benchmark value and the reported MCNP calculation. The (1
) benchmark uncertainty is given as 618 pcm and includes uncertainties in the geometry and material data. The driver fuel mass and the
U concentration are the main contributors to this uncertainty. The benchmark uncertainty assessment considered the initial mass uncertainty and the depletion analysis effect since the discussed EBR-II configuration contains fuel assemblies at varying degrees of burnup [
1]. Considering this uncertainty, very good agreement is observed between all calculated results.
A direct comparison between the reported MCNP result and the KENO result with ENDF/B-VII.0 data [
25] could not be performed because of an issue with the generation of probability tables for SCALE’s CE libraries that was recently fixed. SCALE’s ENDF/B-VII.1 and ENDF/B-VIII.0 libraries were updated, but the ENDF/B-VII.0 library was not updated since it will no longer be included in the next SCALE releases. The correction of the probability tables has been found to impact reactivity calculations of fast spectrum systems that include irradiated fuel [
14].
However, the benchmark specification provided the MCNP input. Therefore, it was possible to re-run MCNP calculation with this input using both the ENDF/B-VII.0 and ENDF/B-VII.1 libraries. The eigenvalue decreased by ∼400 pcm when using ENDF/B-VII.1 compared to ENDF/B-VII.0. The Oak Ridge National Laboratory (ORNL) MCNP ENDF/B-VII.1 result and the KENO ENDF/B-VII.1 result show a difference of ∼250 pcm; after the provided MCNP model was studied in more detail, it was concluded that this small difference is caused by slight geometric inconsistencies between the models. The cause of the difference between the reported MCNP result and ORNL’s MCNP result when both were using ENDF/B-VII.0 data is unknown. Possible causes of differences could be updates in MCNP and differences in the applied nuclear data files (ORNL used the data files provided with MCNP, but it is not known which data files the benchmark team used).
Table 3 compares the nominal quantities of interest based on the different ENDF/B libraries as obtained with KENO-CE. The differences between the ENDF/B-VIII.1 and ENDF/B-VII.1 results are negligible.
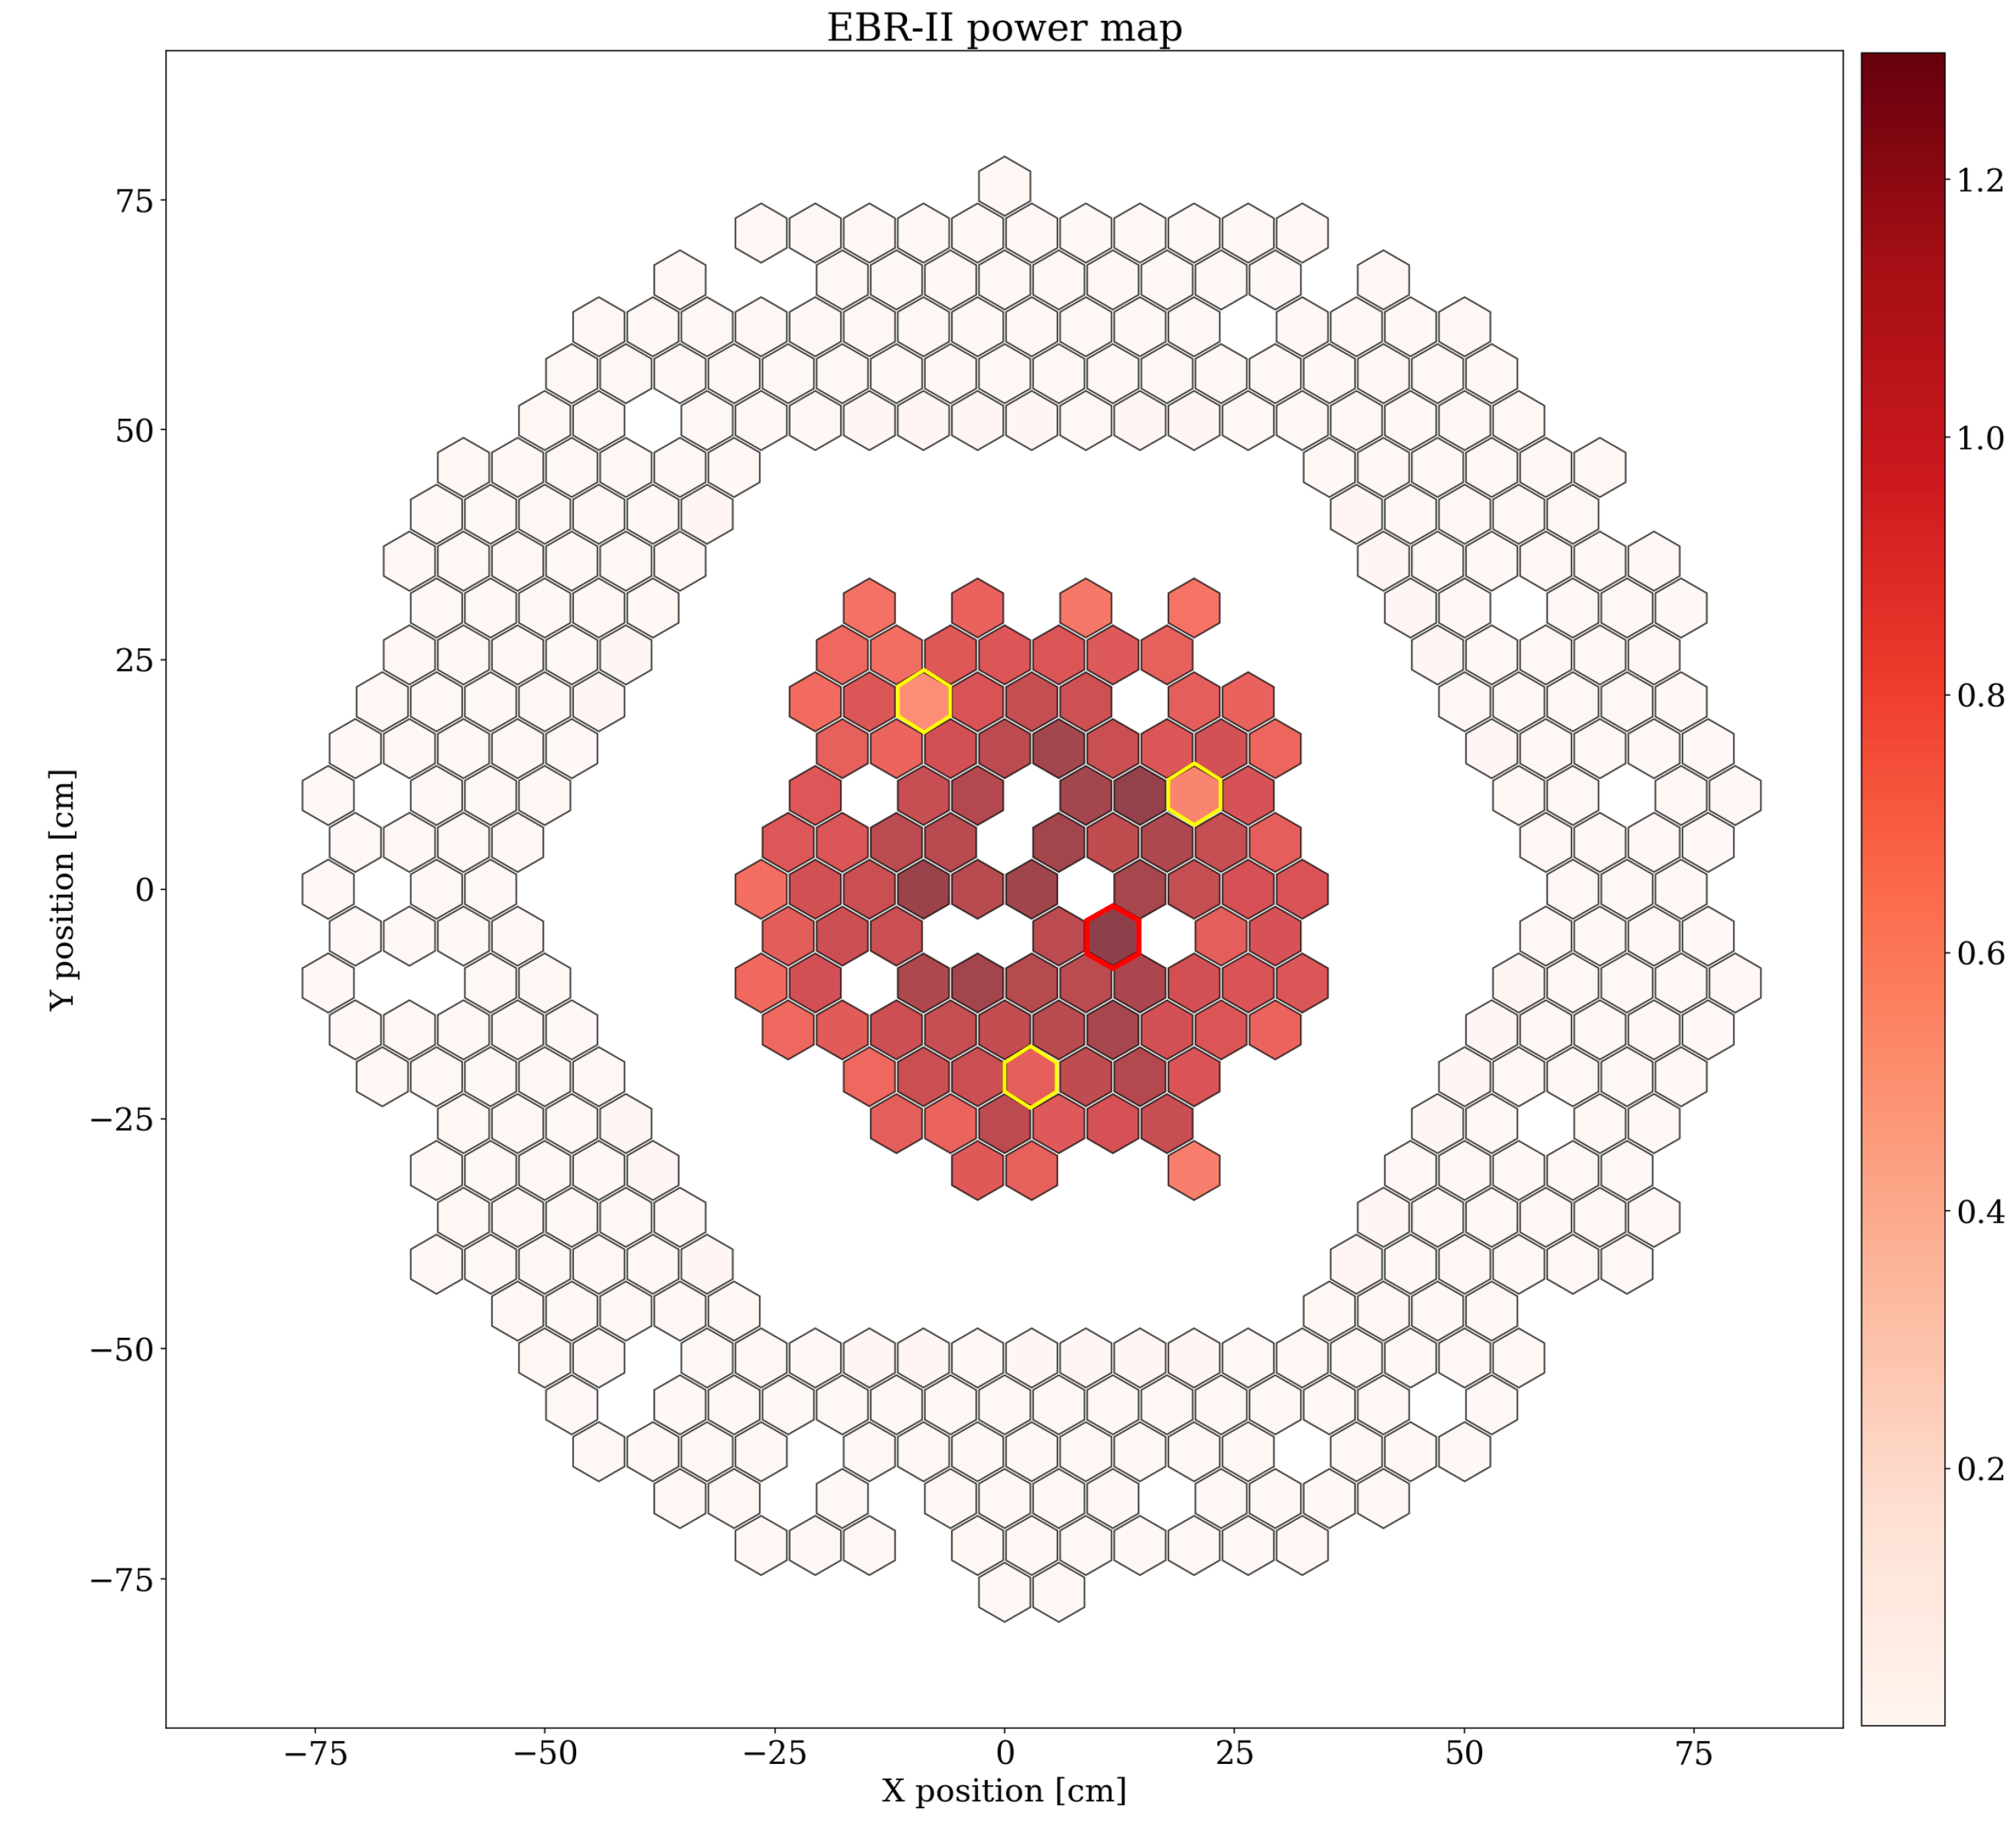
Figure 8 shows the normalized radial power distribution of the EBR-II. The power was obtained for all materials containing fuel. Empty spaces indicate assemblies that do not contain fuel, such as the dummy assemblies and certain experimental assemblies in the inner driver core.
Figure 8 clearly shows the contrast between the high power in the inner core with driver fuel assemblies vs. the low power in the outer blanket. The power was normalized to yield an average assembly power of 1.0 in the inner driver core, and the displayed power in the outer blanket core was adjusted accordingly. The minimum and maximum values of the inner core are 0.653 and 1.297, respectively, when using ENDF/B-VII.1. The minimum and maximum values are 0.597 and 1.282, respectively, when using ENDF/B-VIII.0. The minimum and maximum values of the outer blanket are 0.003 and 0.031, respectively, when using ENDF/B-VII.1. The minimum and maximum values are 0.003 and 0.030, respectively, when using ENDF/B-VIII.0.
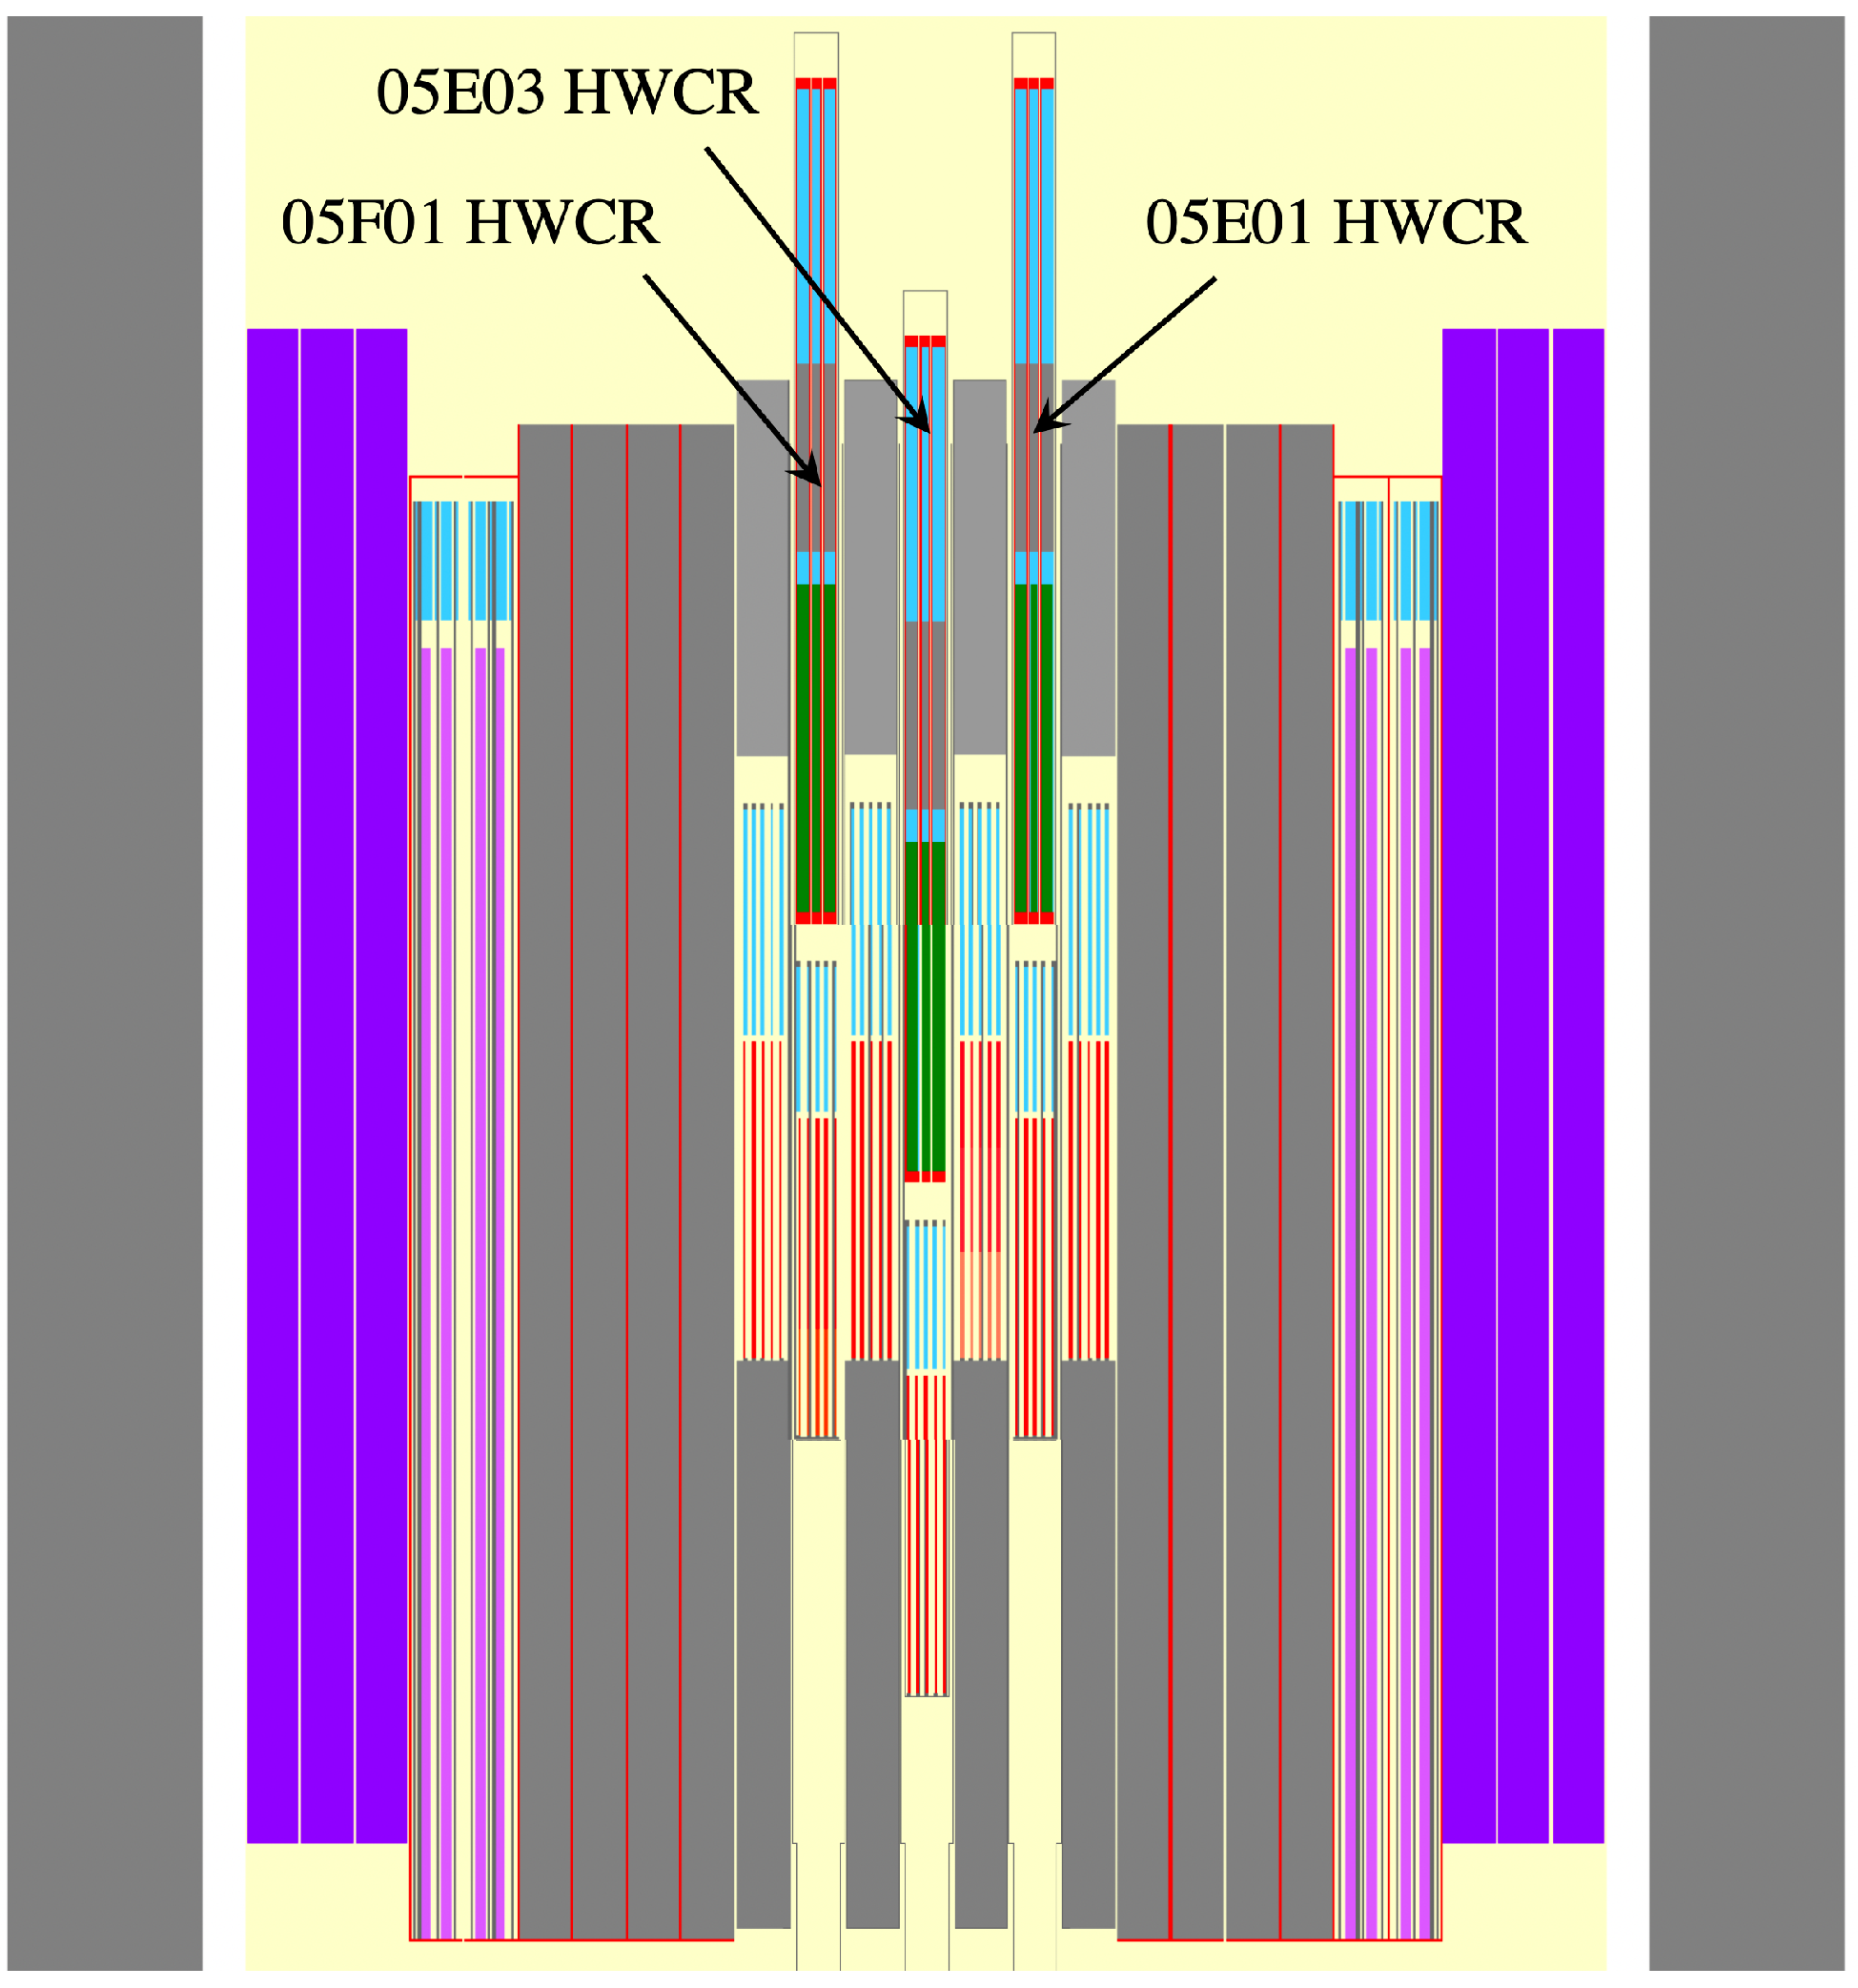
Figure 8 highlights the assembly with the highest power—a half worth driver assembly—with a red hexagon. The assemblies highlighted with a yellow hexagon are three of the high worth control rod (HWCR) assemblies. These control assemblies show a smaller power than other assemblies—in particular compared to other HWCR assemblies—because they are partially inserted into the active region of the core such that their fuel rods are pushed outside and contribute less power (see
Figure 5 for the insertion of one of these control assemblies).
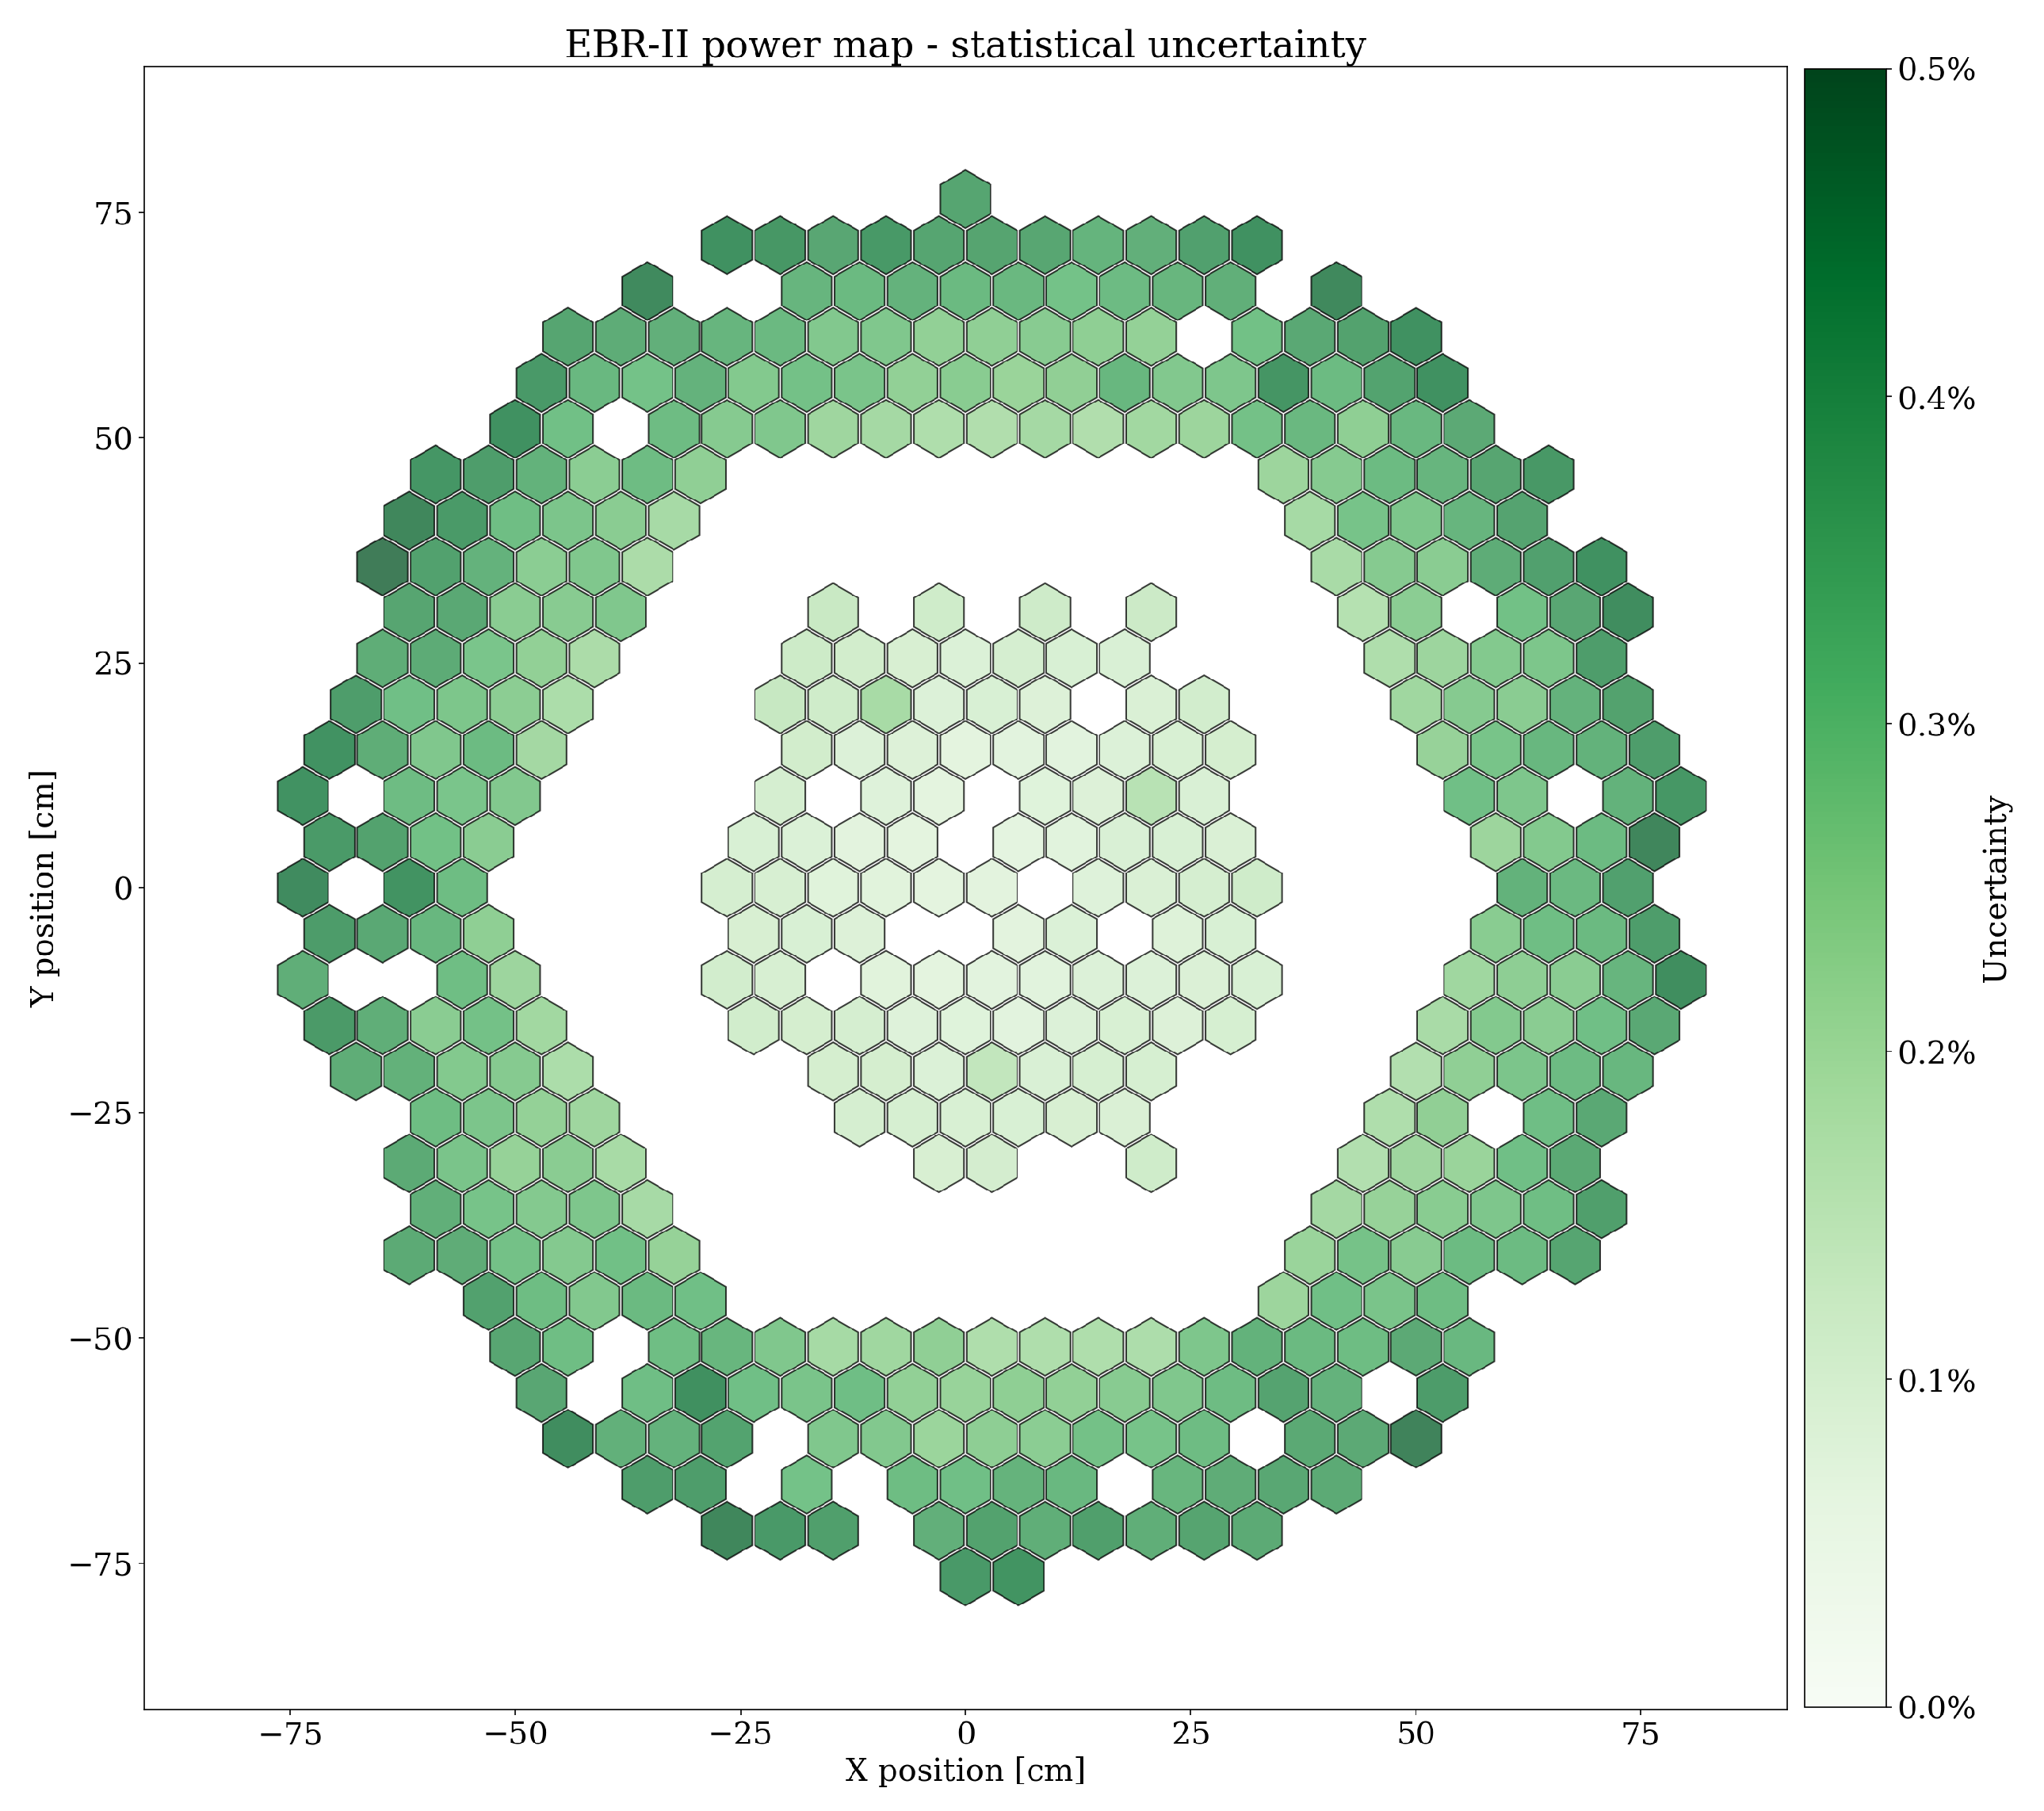
Figure 9 shows the statistical error of the KENO-MG power distribution calculation. The statistical error was determined by calculating the standard deviation of a set of calculations with different random seems. The statistical error of the inner driver fuel assemblies varies between 0.08% and 0.22%. Due to smaller neutron flux in the outer core, the statistical error of the blanket assemblies is slightly larger with values between 0.19% and 0.48%. The statistical error in the three partially inserted HWCR assemblies in the inner driver core is slightly higher than the error of the neighboring assemblies. The fuel of these assemblies is located below the main active region and therefore experiences a smaller neutron flux than the main region which leads to a slightly larger statistical error. In general, these small statistical errors confirm the adequacy of the chosen settings for the Monte Carlo calculations.
A small bias of the power distribution is expected to be caused by using KENO in MG mode instead of CE mode. A small MG bias below 5% was previously observed for two different SFR designs and was attributed to the missing consideration of leakage effects during the cross section self-shielding calculation [
8].
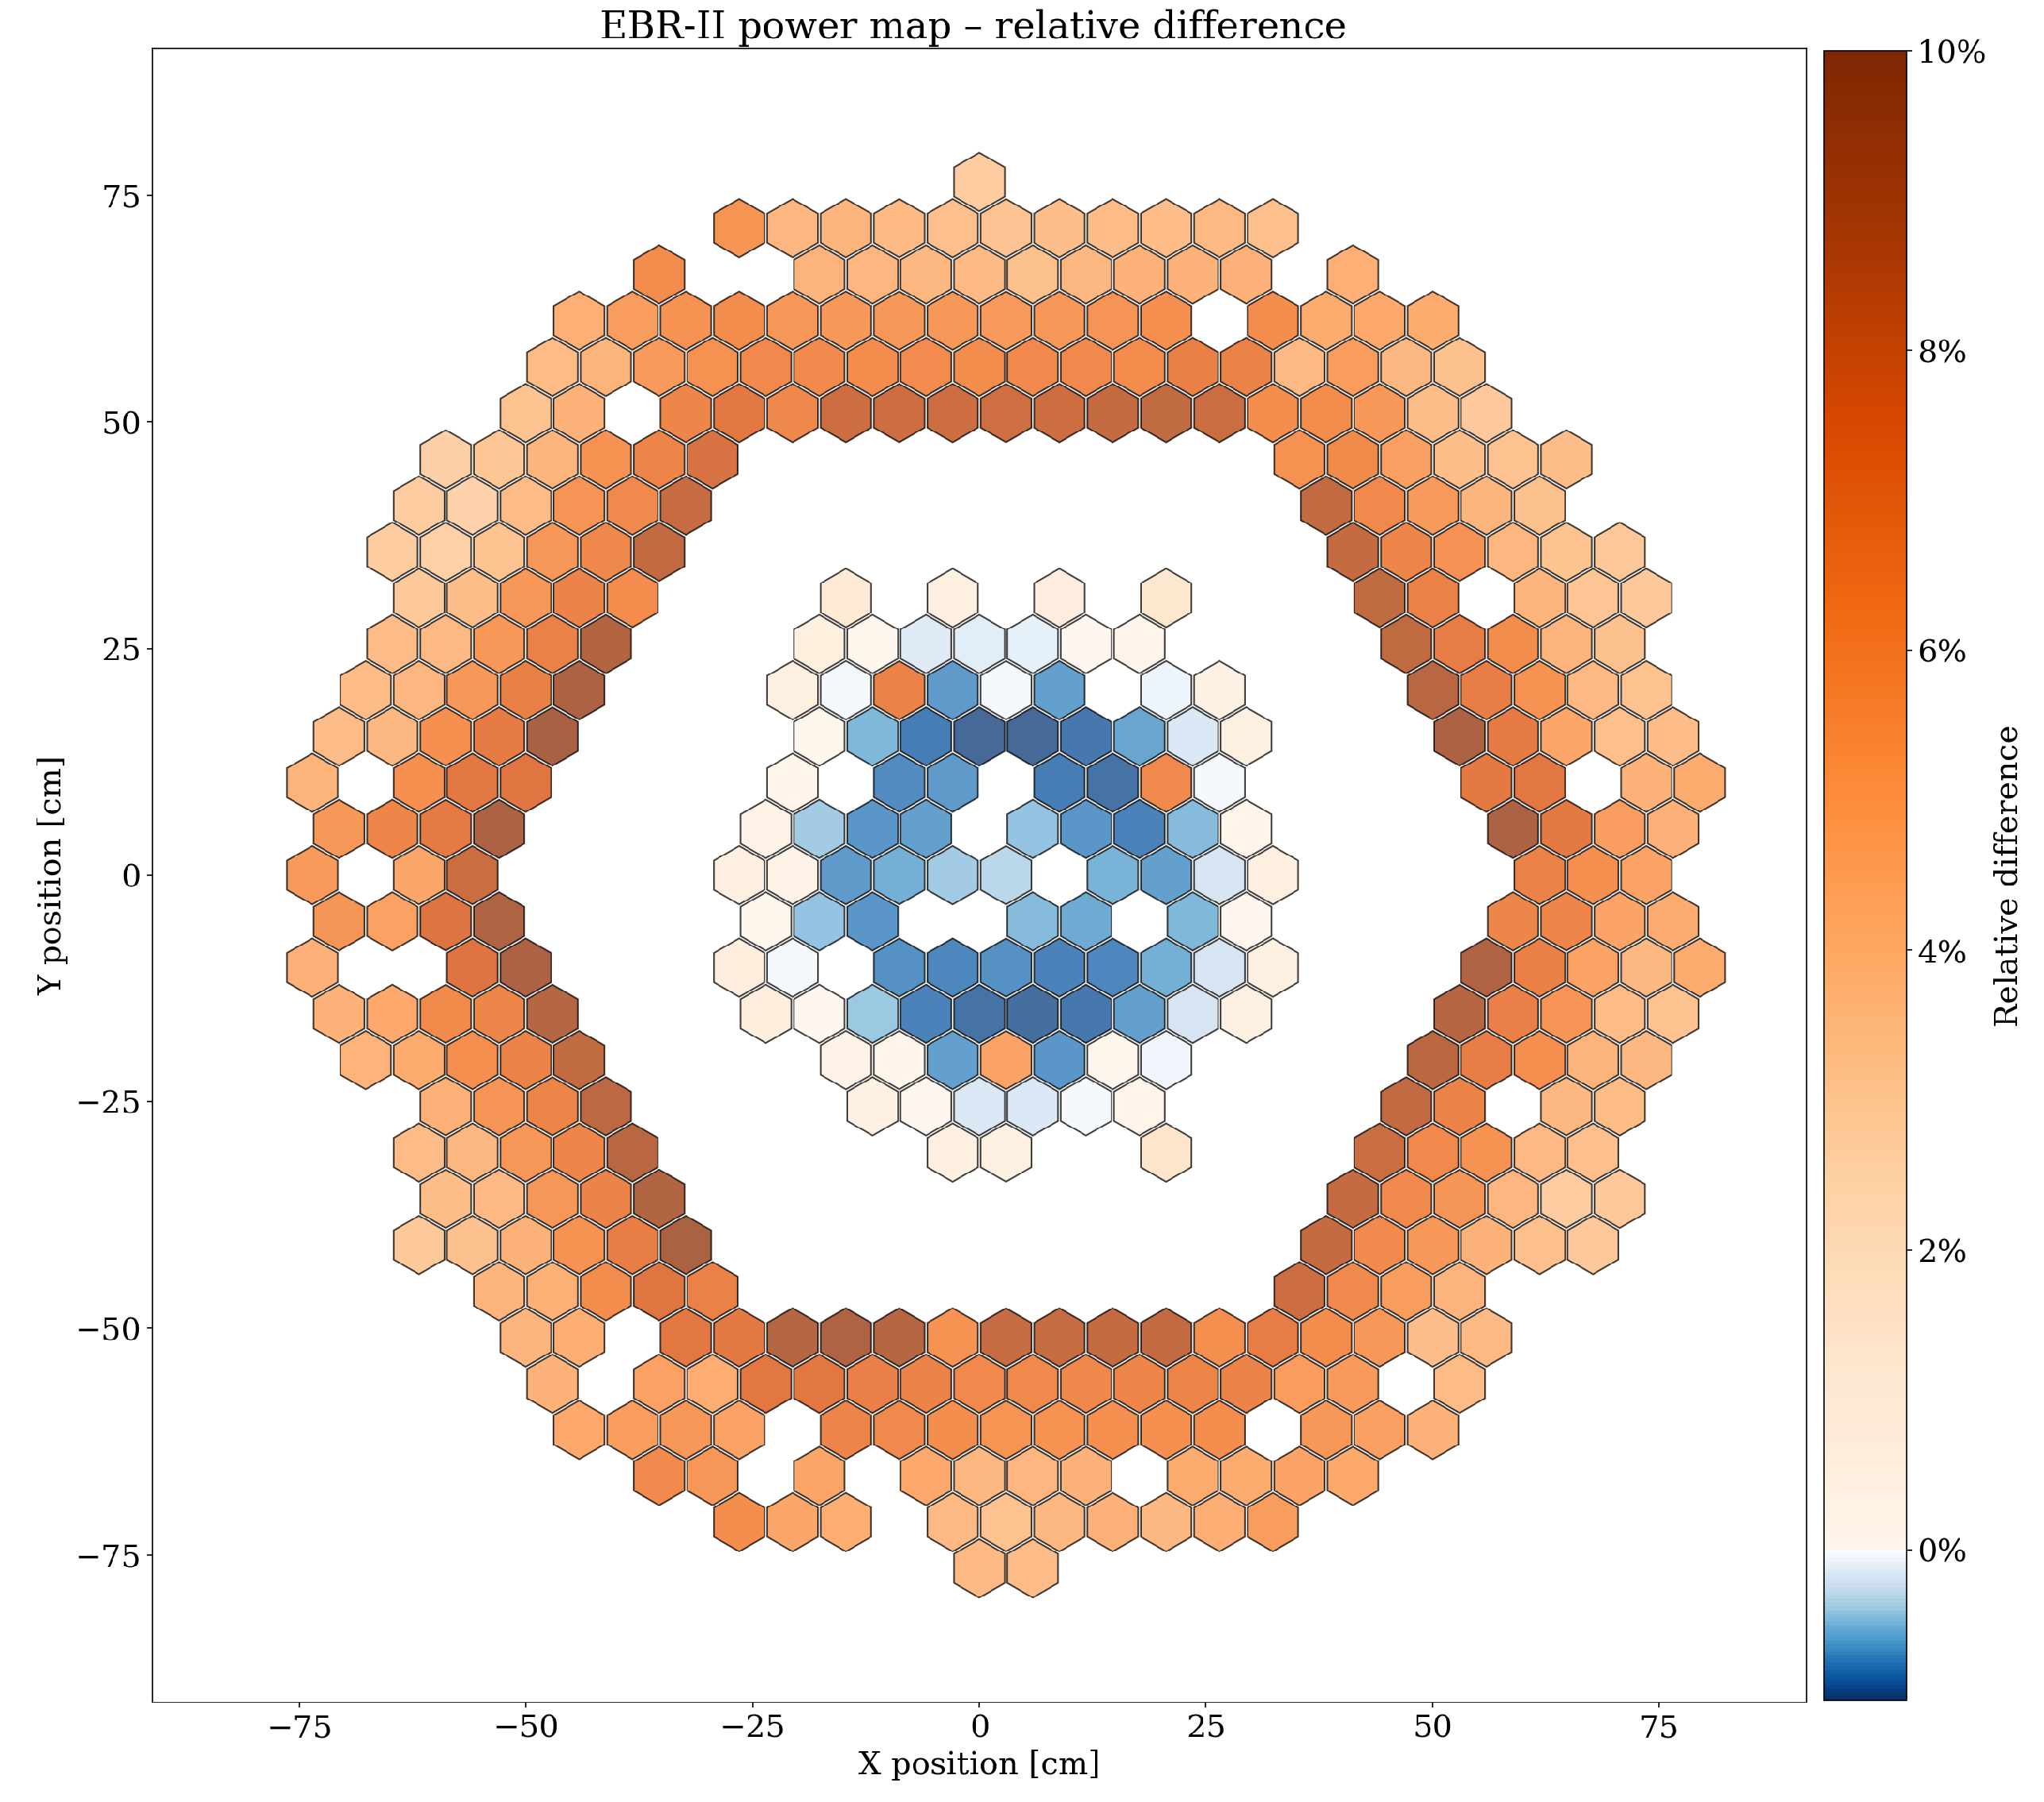
Figure 10 shows the relative difference of the KENO-MG power distribution to KENO-CE. The KENO-MG result overestimates the KENO-CE result in the outer blanket region by 2.93–9.58%. The difference in the central driver core varies between an underestimation of −0.95% and an overestimation of 6.85%. This type of geometric MG bias will not be sensitive to nuclear data variations and thus will be a near-constant component in every sample calculation. Therefore, the MG bias will not greatly affect the relative power uncertainty estimation.
4.2. Sensitivity Analysis
Table 4 presents the comparison between the TSUNAMI and direct perturbation calculations. The k
sensitivities were confirmed for six energy-integrated sensitivity coefficients. Due to the large number of materials in the model and the consequential spread of material-dependent sensitivities, only four sensitivities were found to be greater than 0.01. In addition to these four sensitivities, the top sensitivities in the absorber and in the fuel were also investigated despite their small values. In general, good agreement was observed between the sensitivities obtained with TSUNAMI and calculated with direct perturbation, with differences of less than 2 statistical standard deviations
of the sensitivity differences. The largest sensitivity difference was observed for
Fe in the driver assemblies due to the large contribution of the scattering reaction sensitivity to the total sensitivity of this nuclide, which is generally more difficult to convergence. The
B sensitivity shows a similar difference due to the small sensitivity and therefore similar challenges with statistical convergence. Based on these results, the parameter settings for the TSUNAMI-CLUTCH calculation were considered adequate.
Table 5,
Table 6 and
Table 7 list the top integrated sensitivities of the different quantities of interest as determined with CE TSUNAMI. Each of these sensitivity coefficients represents the sensitivity of a specific quantity of interest to a single specific reaction and can be used to understand relevant sensitivities for a given quantity of interest. Because the sensitivities obtained from the ENDF/B-VII.1 and ENDF/B-VIII.0 are very similar, only the results obtained with ENDF/B-VII.1 are displayed here.
As expected for fresh uranium fuel, the largest sensitivities are found for U and U. Scattering reactions and the radiative capture (n,) reaction of Fe, Cr, and Ni play a significant role, since these isotopes are the major parts of the cladding materials. The control rod worth is very sensitive to the the B (n,), because boron is the absorbing material in the control rods. The sodium void reactivity is naturally very sensitive to the elastic and inelastic scattering of Na.
4.3. Uncertainty Analysis
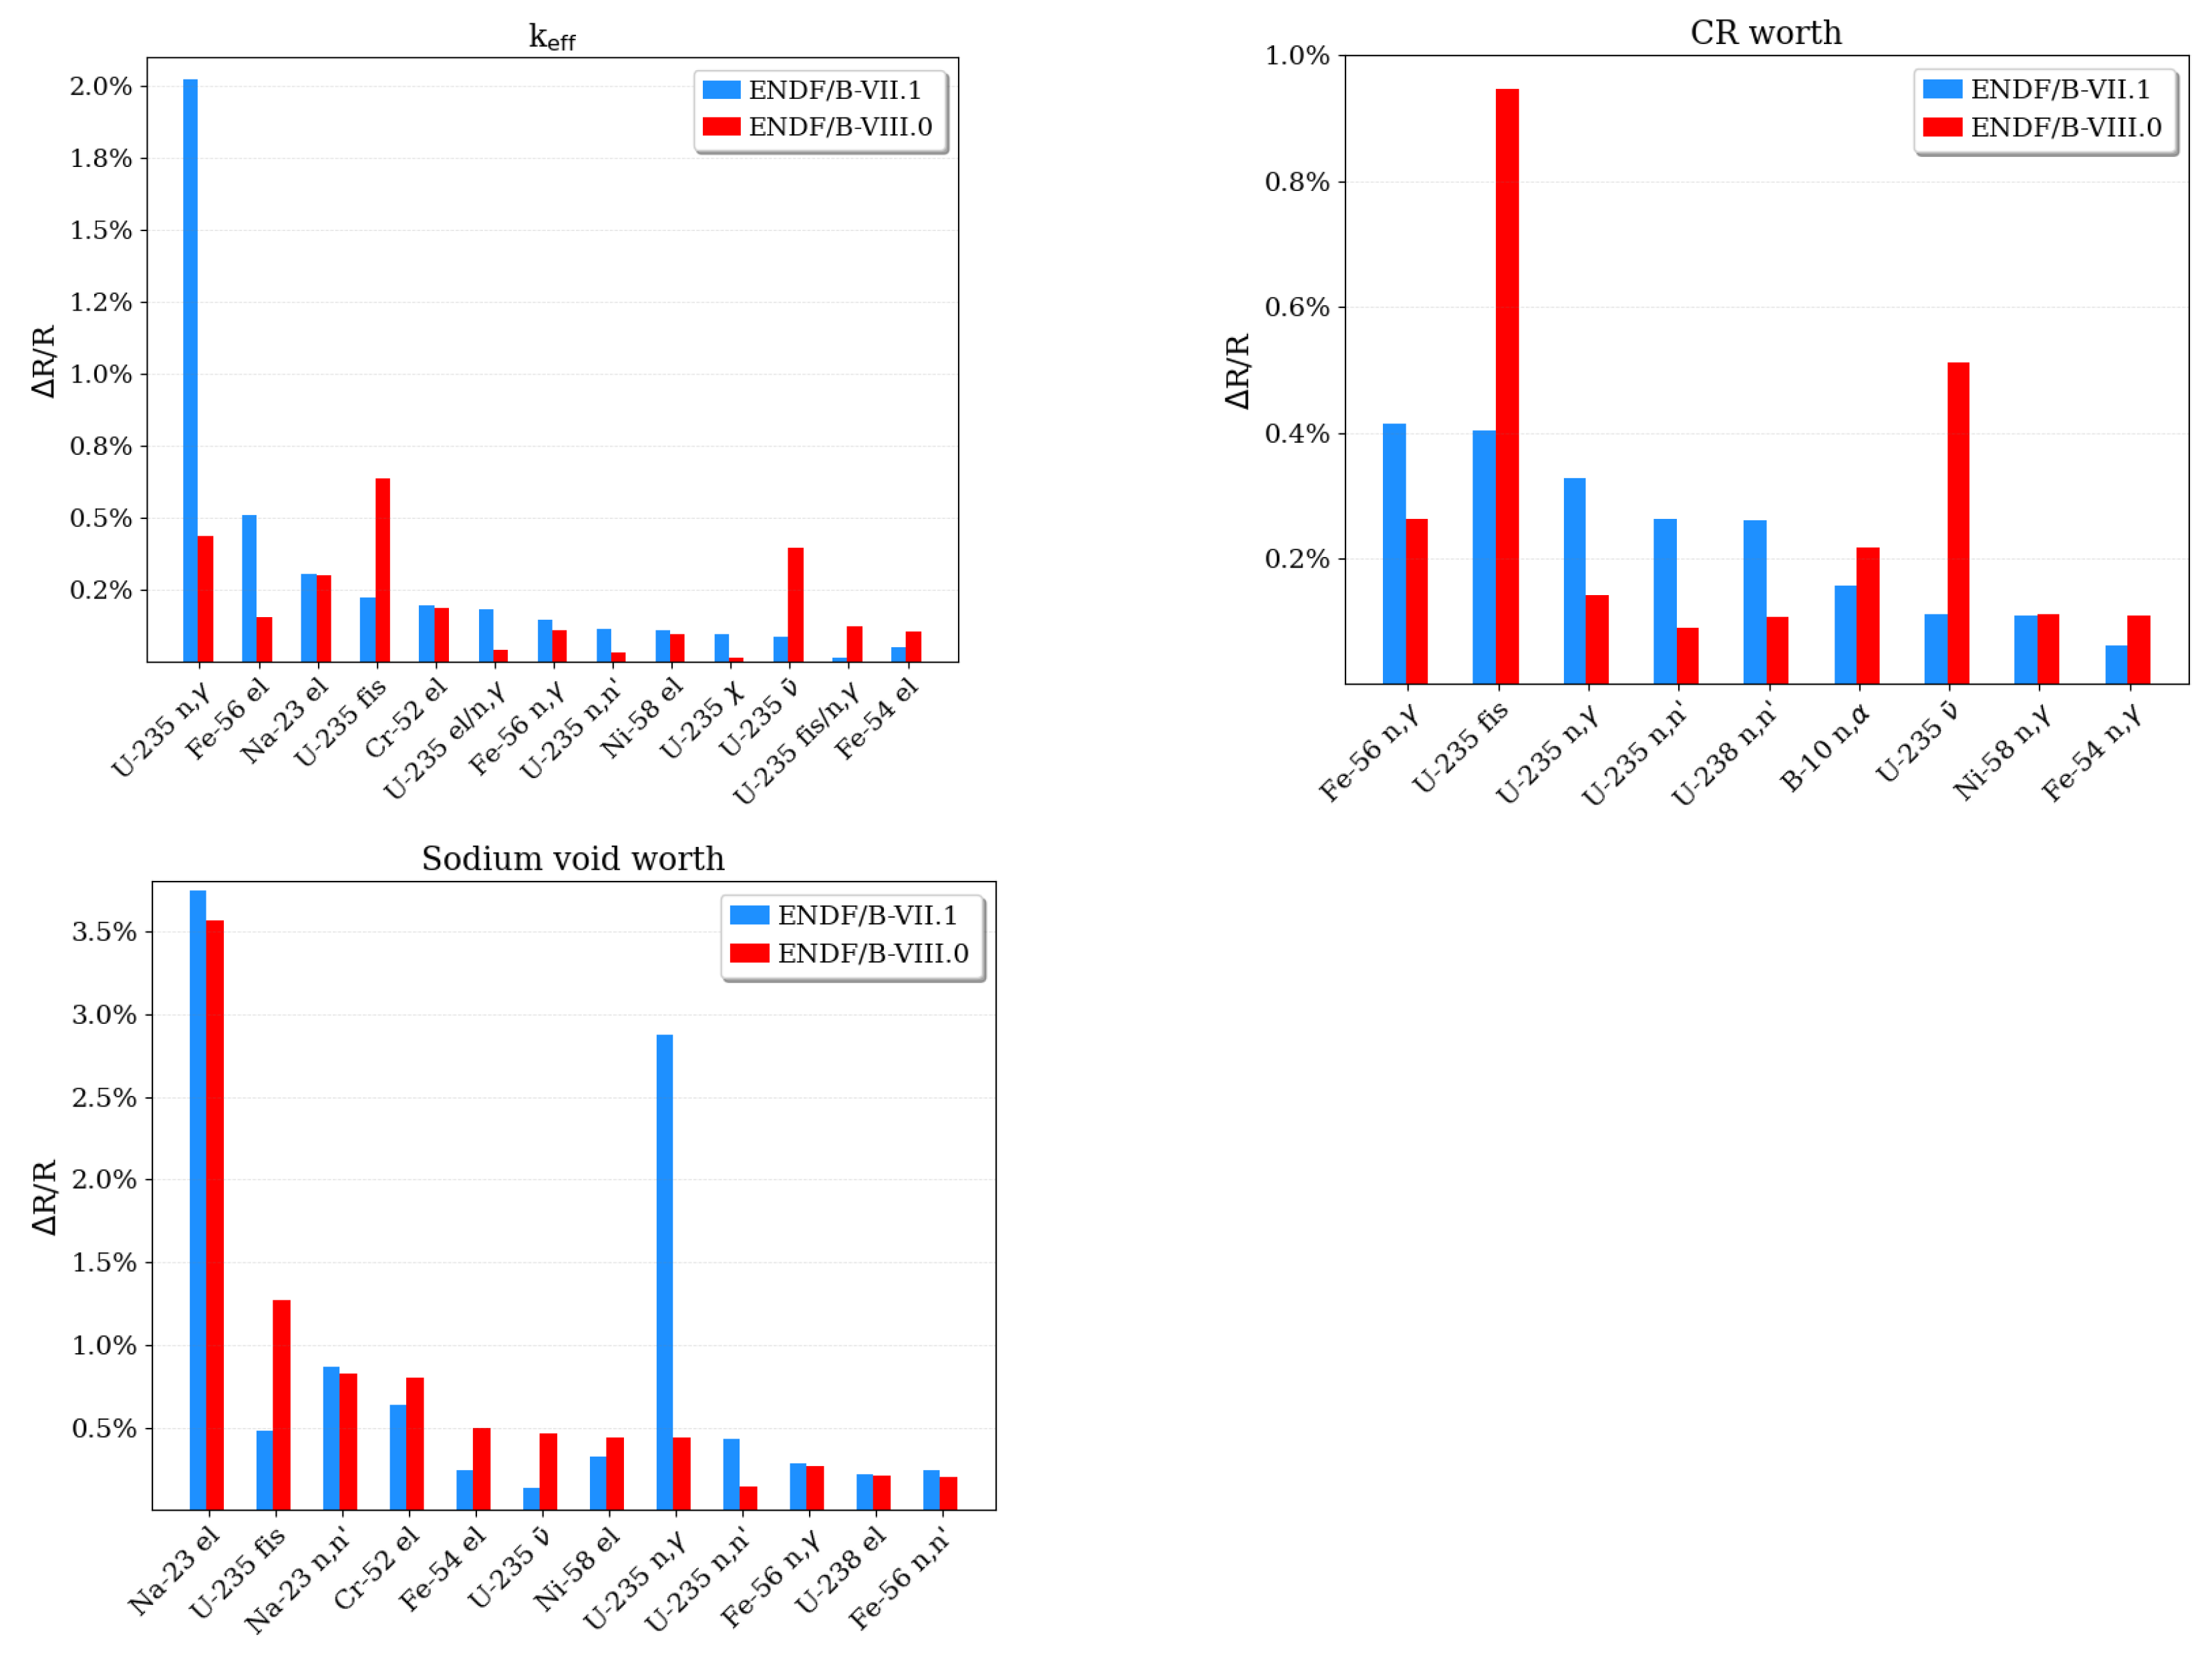
Table 8 compares the output uncertainties obtained with TSUNAMI-CE. The causes of the observed differences can be explained when comparing the individual contributions of the top contributing nuclear reactions (covariance matrices of the individual reactions) to the uncertainties presented for each individual quantity of interest in
Figure 11.
The k
uncertainty was calculated as ∼2% when using ENDF/B-VII.1 data, but the uncertainty is significantly smaller with ∼1% when using ENDF/B-VIII.0 data. The major contributor to this uncertainty in the ENDF/B-VII.1 calculations is
U (n,
). Although
U is relevant for the analysis of light-water reactor concepts using low-enriched uranium fuel, the (n,
) reaction is usually not observed as a top contributor to output uncertainties: the top contributor is usually the neutron multiplicity
[
26].
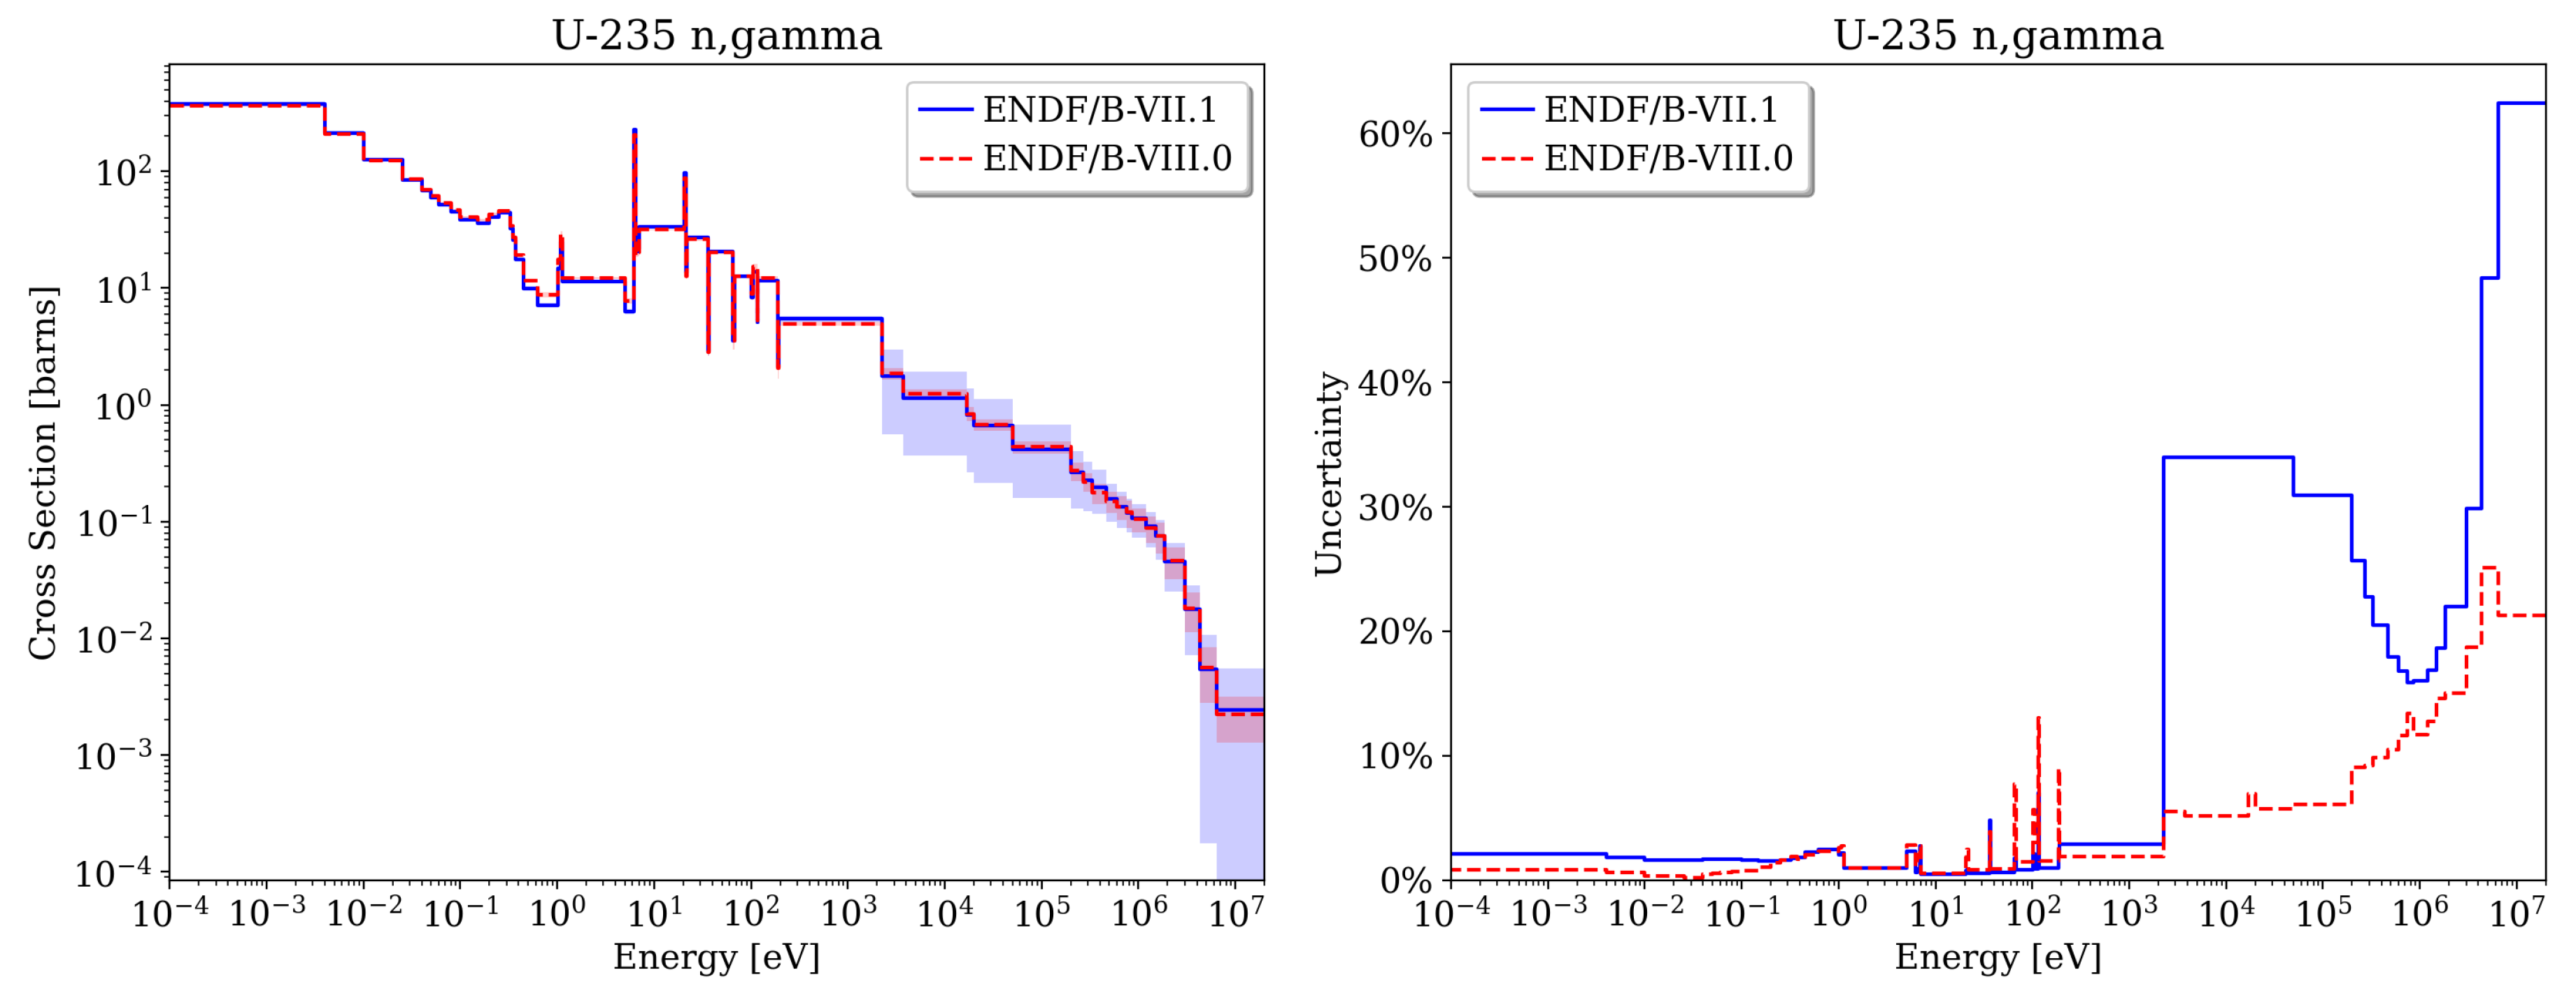
Figure A6 shows that
U (n,
) has an uncertainty above 30% in the fast energy range. Given the fast energy spectrum of the EBR-II, this uncertainty becomes the major driver of the k
uncertainty. Naturally, the decrease of this uncertainty in ENDF/B-VIII.0 leads to the significant decrease of the k
uncertainty. It should be noted that the importance of this reaction is relevant for EBR-II because the fuel is enriched uranium. Other SFR concepts using mixed uranium-transuranic fuel—with a large fraction of plutonium—show other top contributors, which are mainly reactions of
U and
U, while
U (n,
) does not appear at all [
8].
Although the individual contribution of U (n,) is also significantly decreased for the control rod worth and sodium void worth in ENDF/B-VIII.0, the effect on the overall uncertainty is smaller because (1) it is partially compensated through increased uncertainties of other reactions, and (2) other reactions show major contributions to the total uncertainty.
In the case of the control rod worth, the increased contributions of
U fission and
(
Figure A5 and
Figure A7) compensate for the decreased contributions of, for example,
U (n,
) and and
Fe (n,
) (
Figure A4).
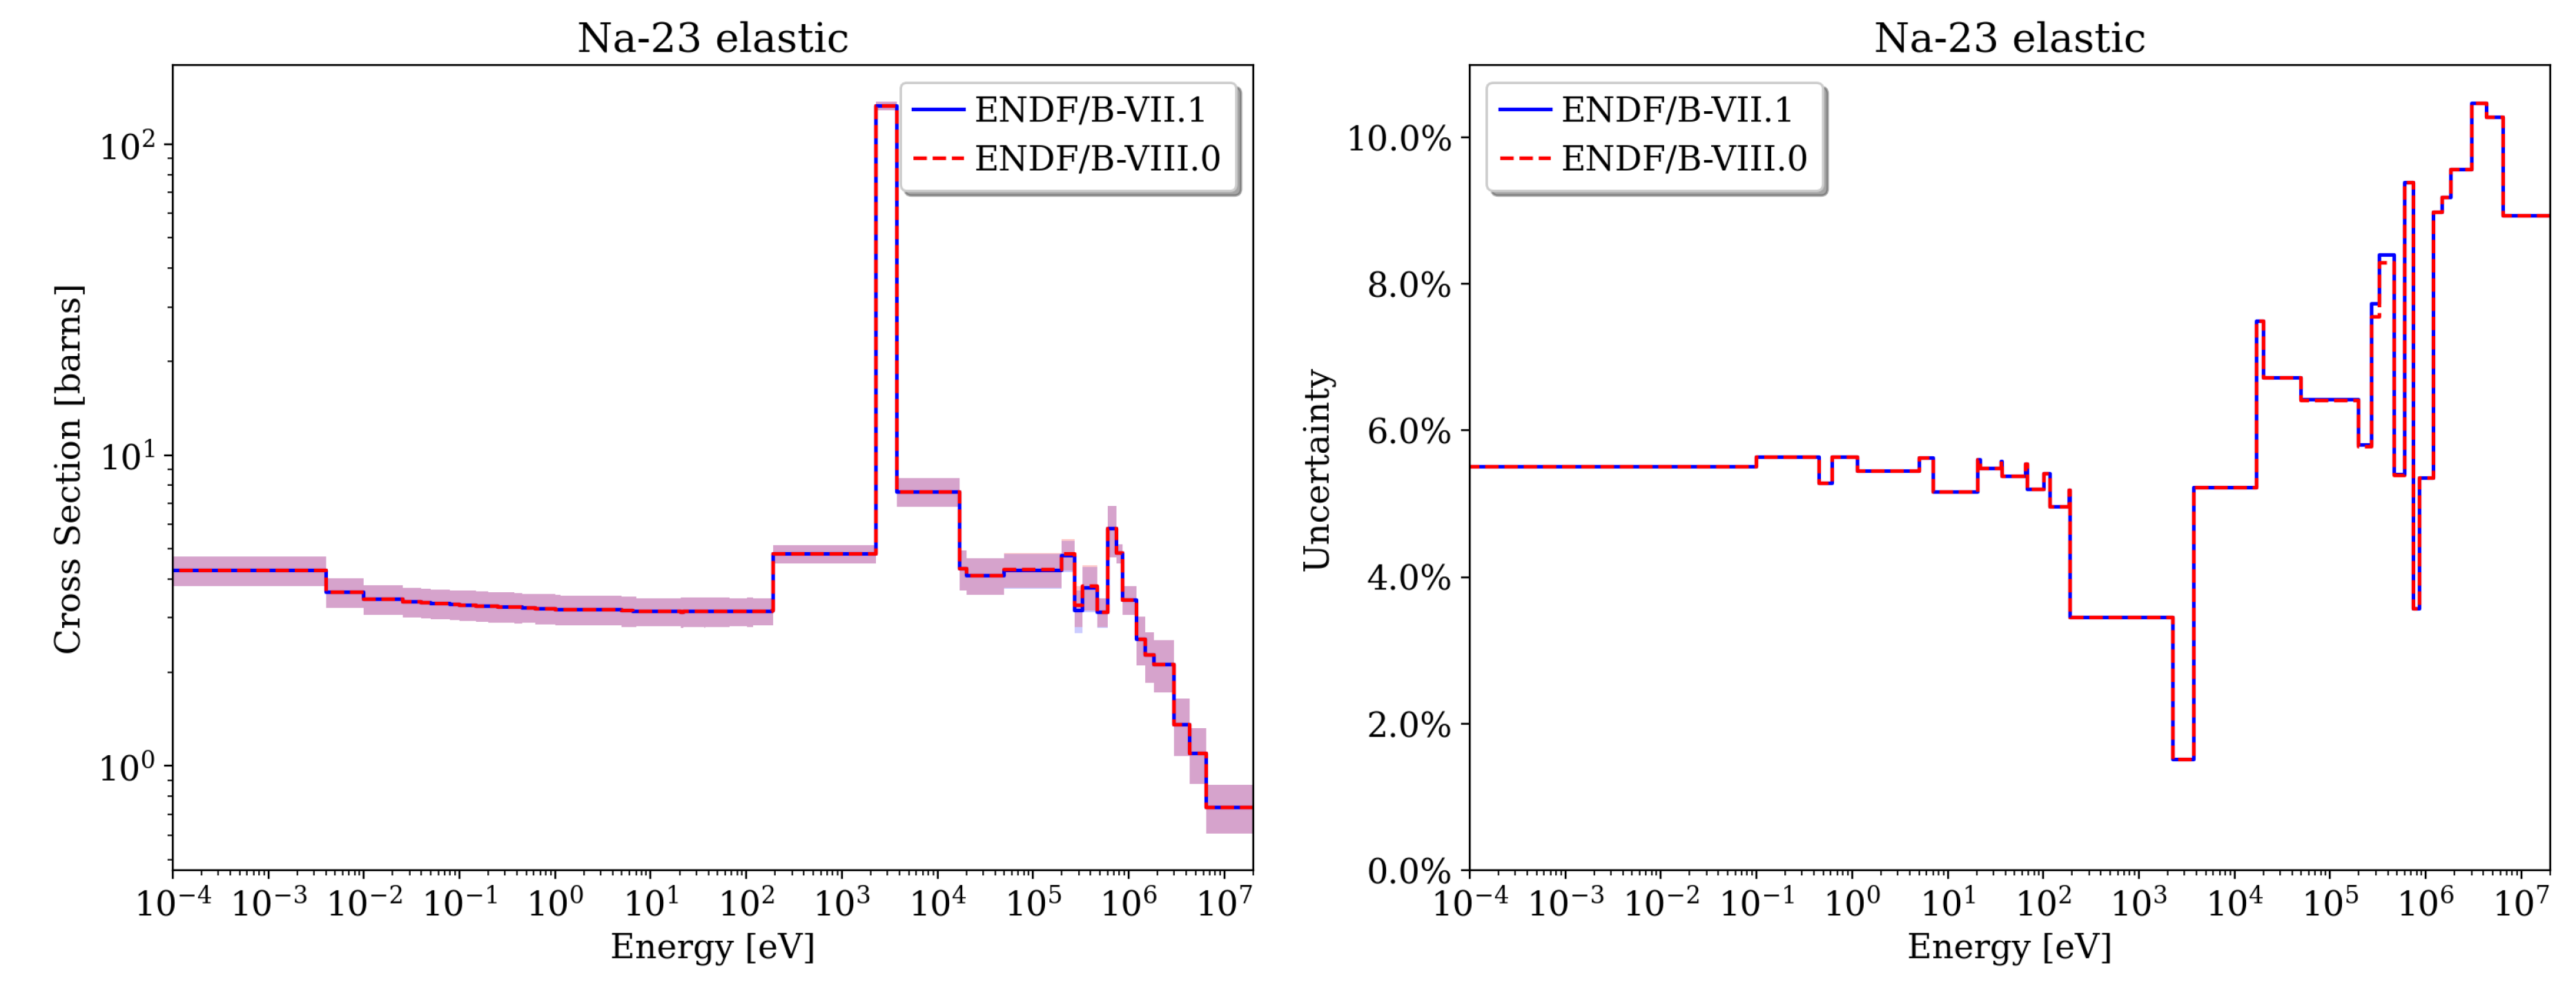
The major contributor to the sodium void worth uncertainty is elastic scattering of
Na (
Figure A1). The impact of the reduced contribution from
U (n,
) is therefore smaller than for k
.
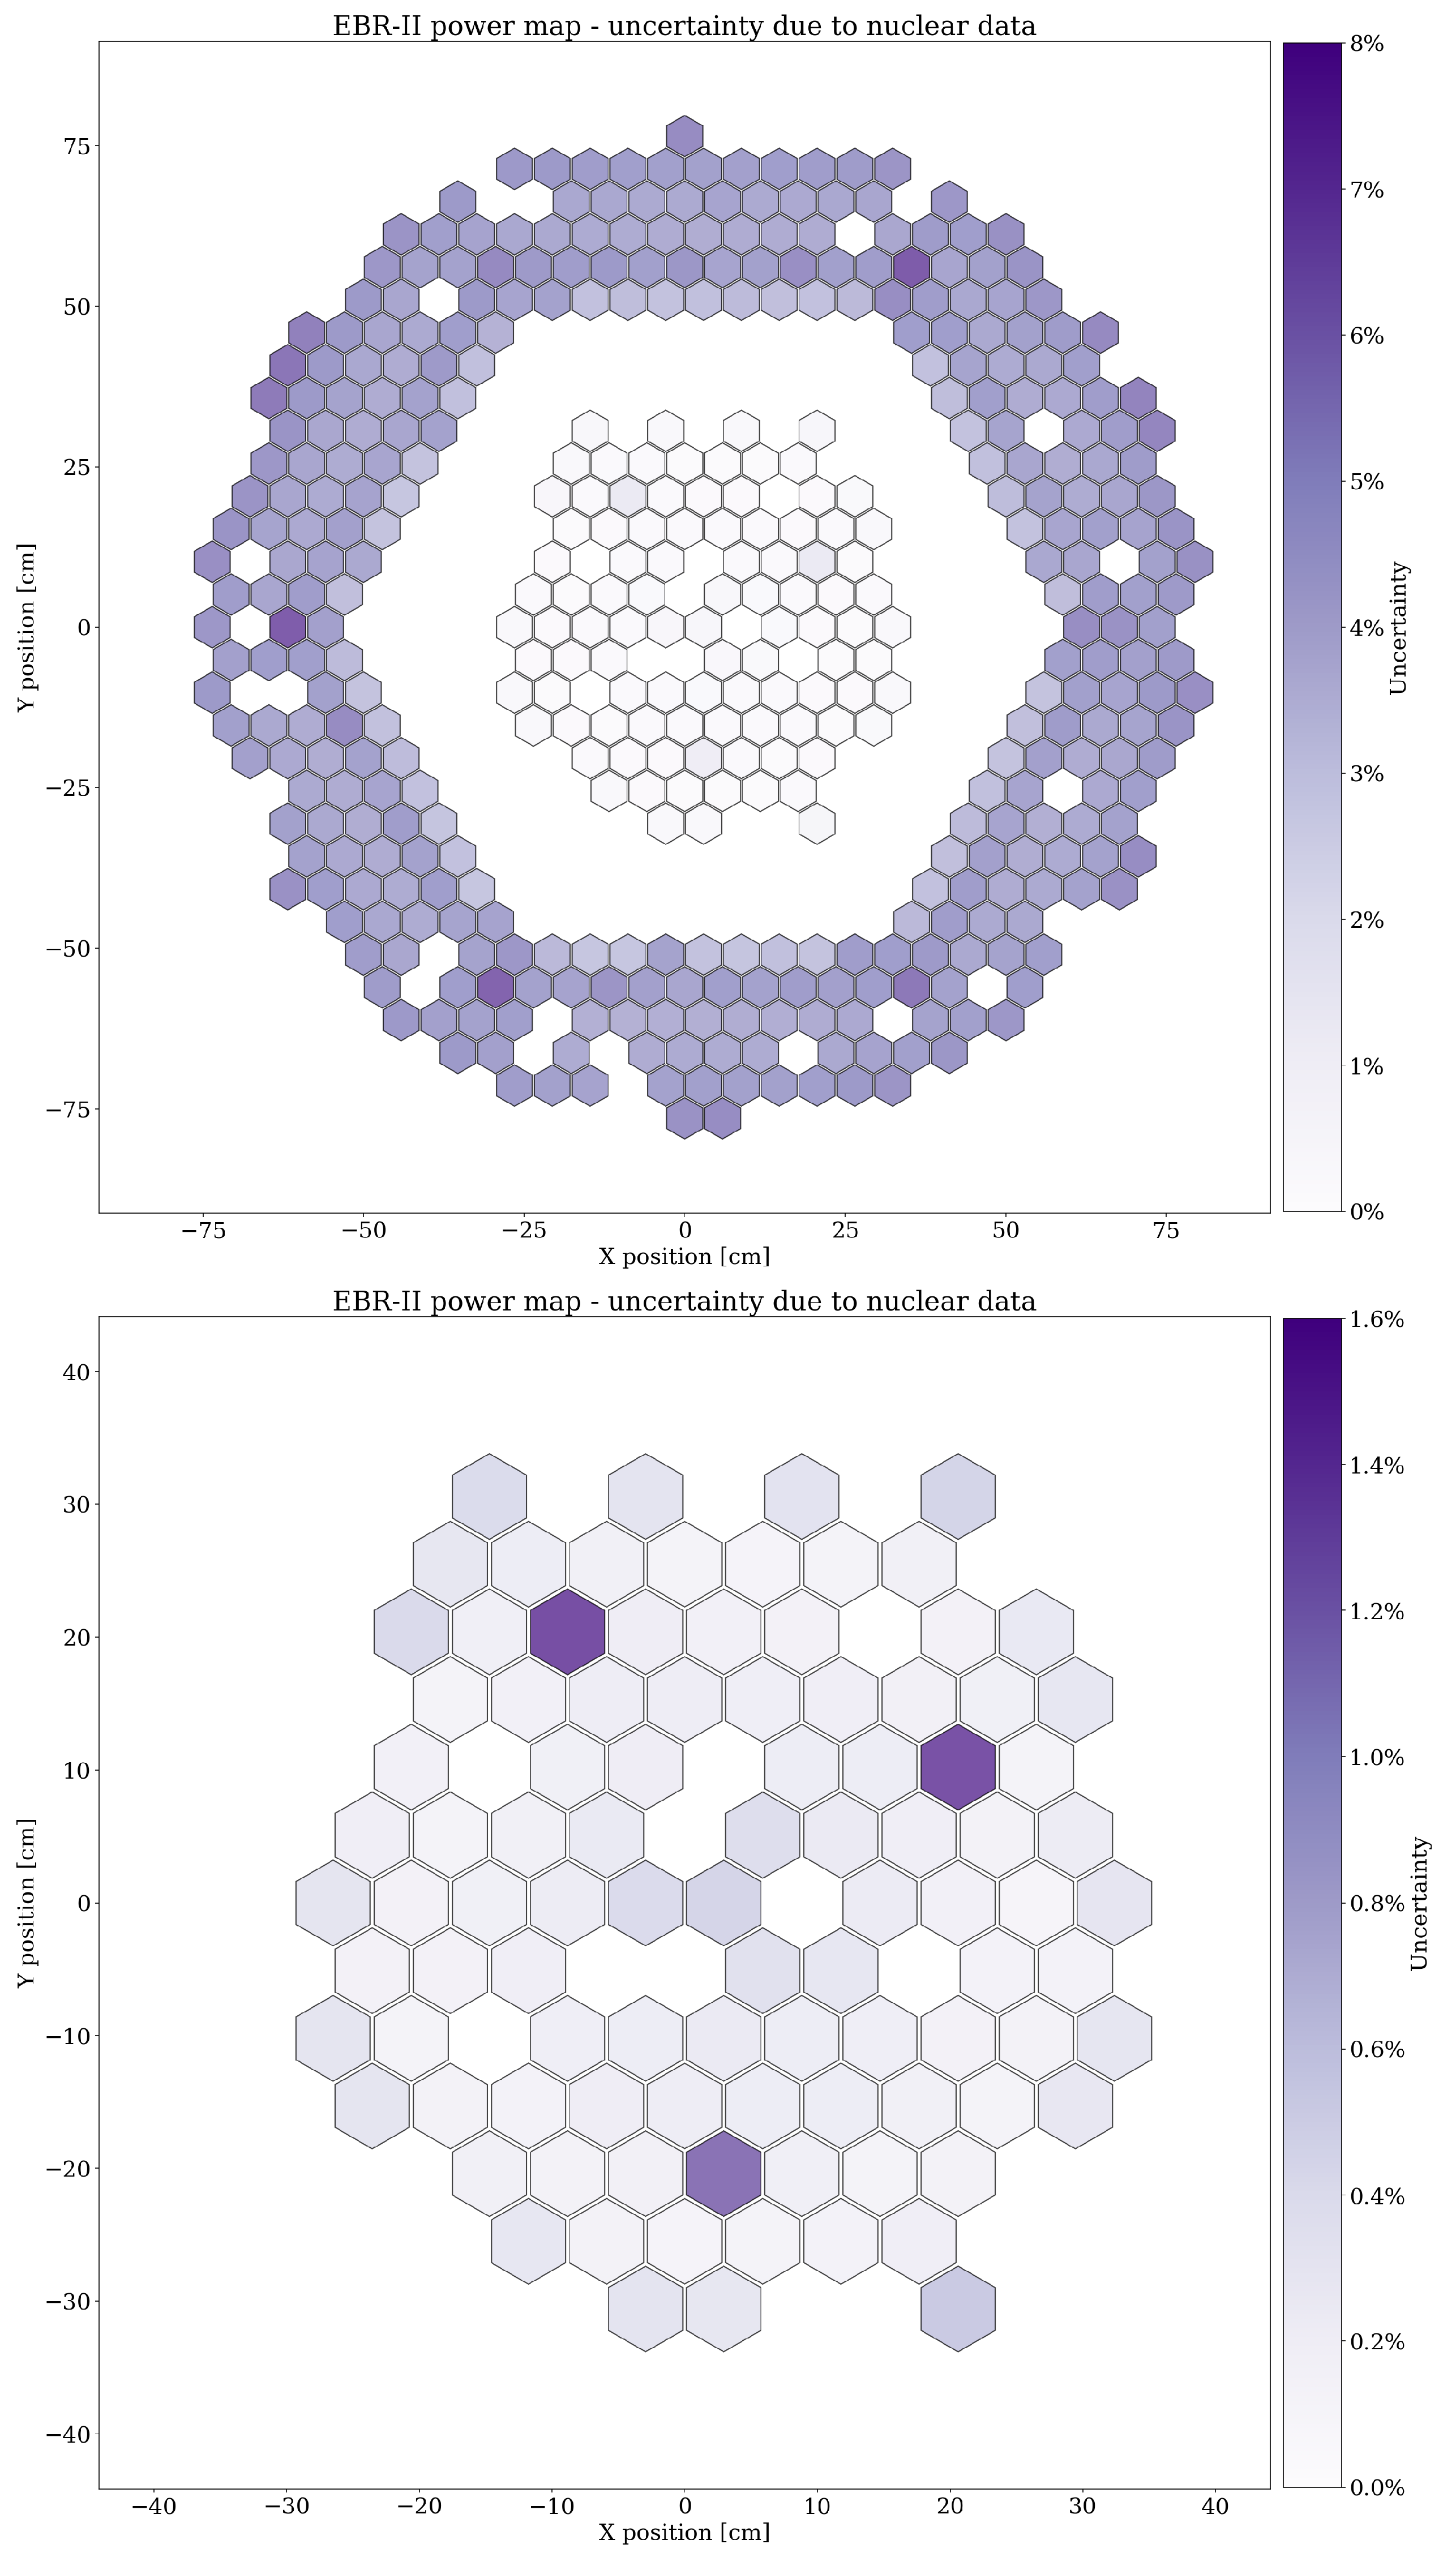
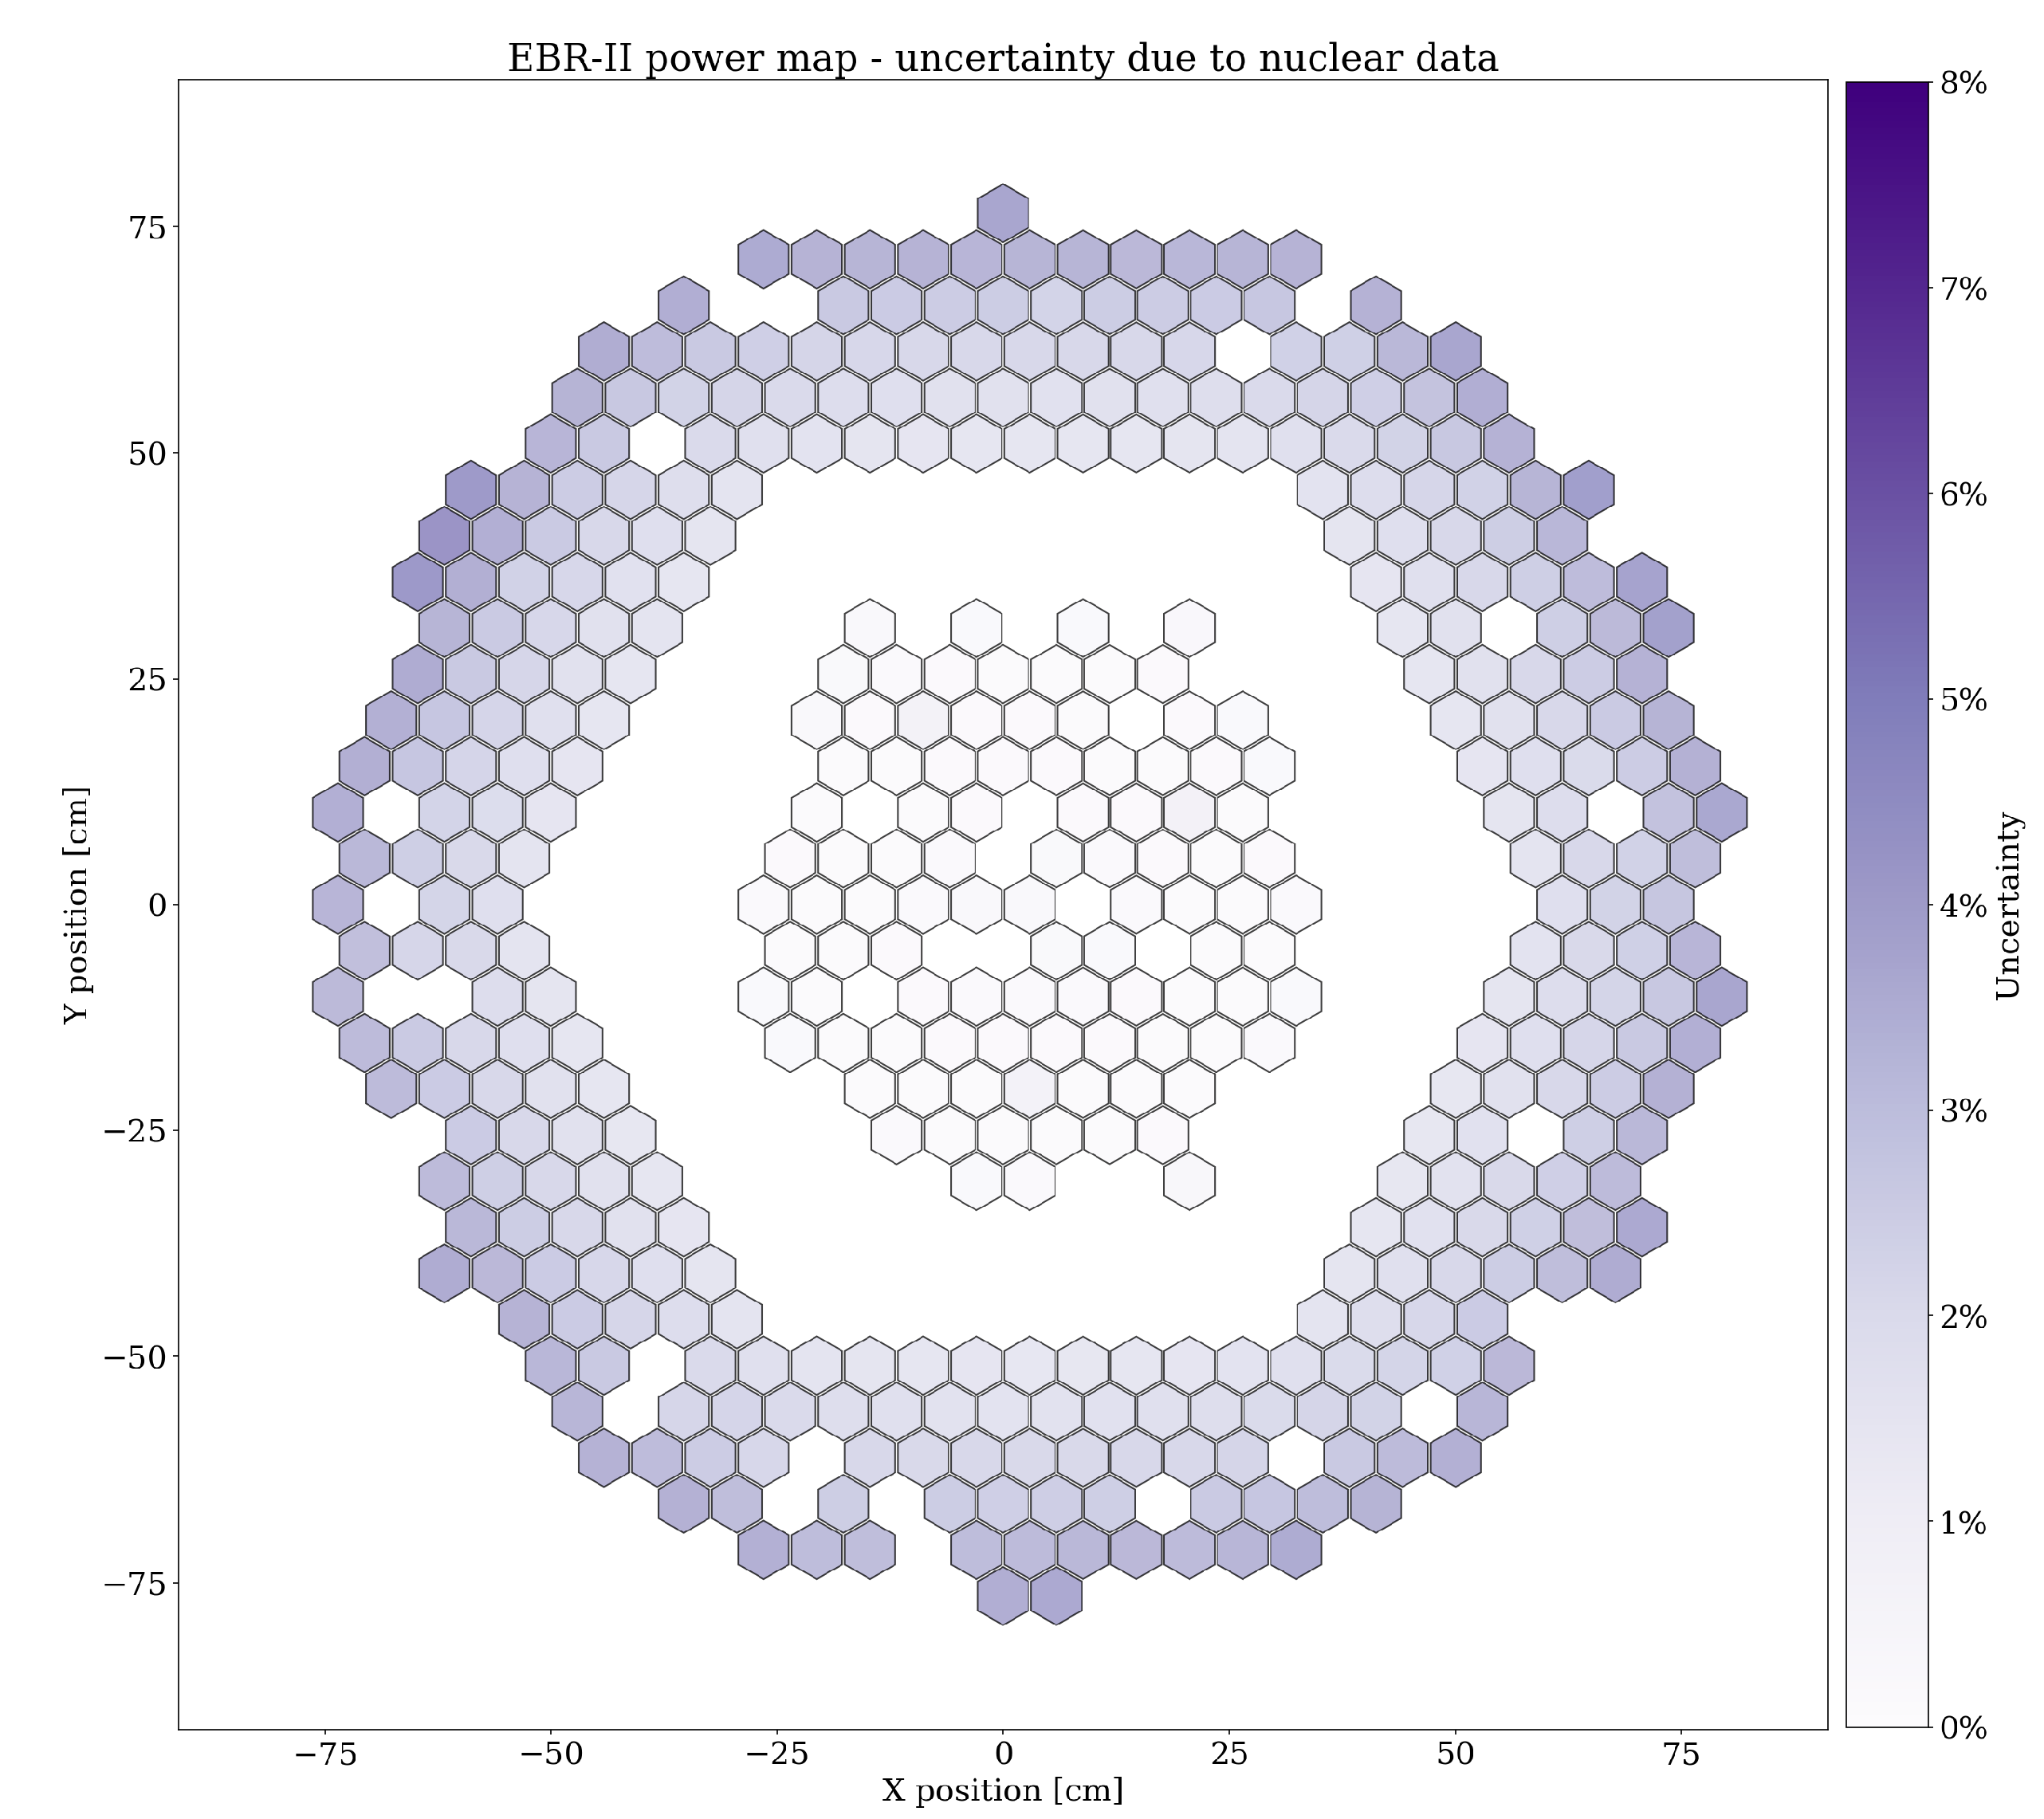
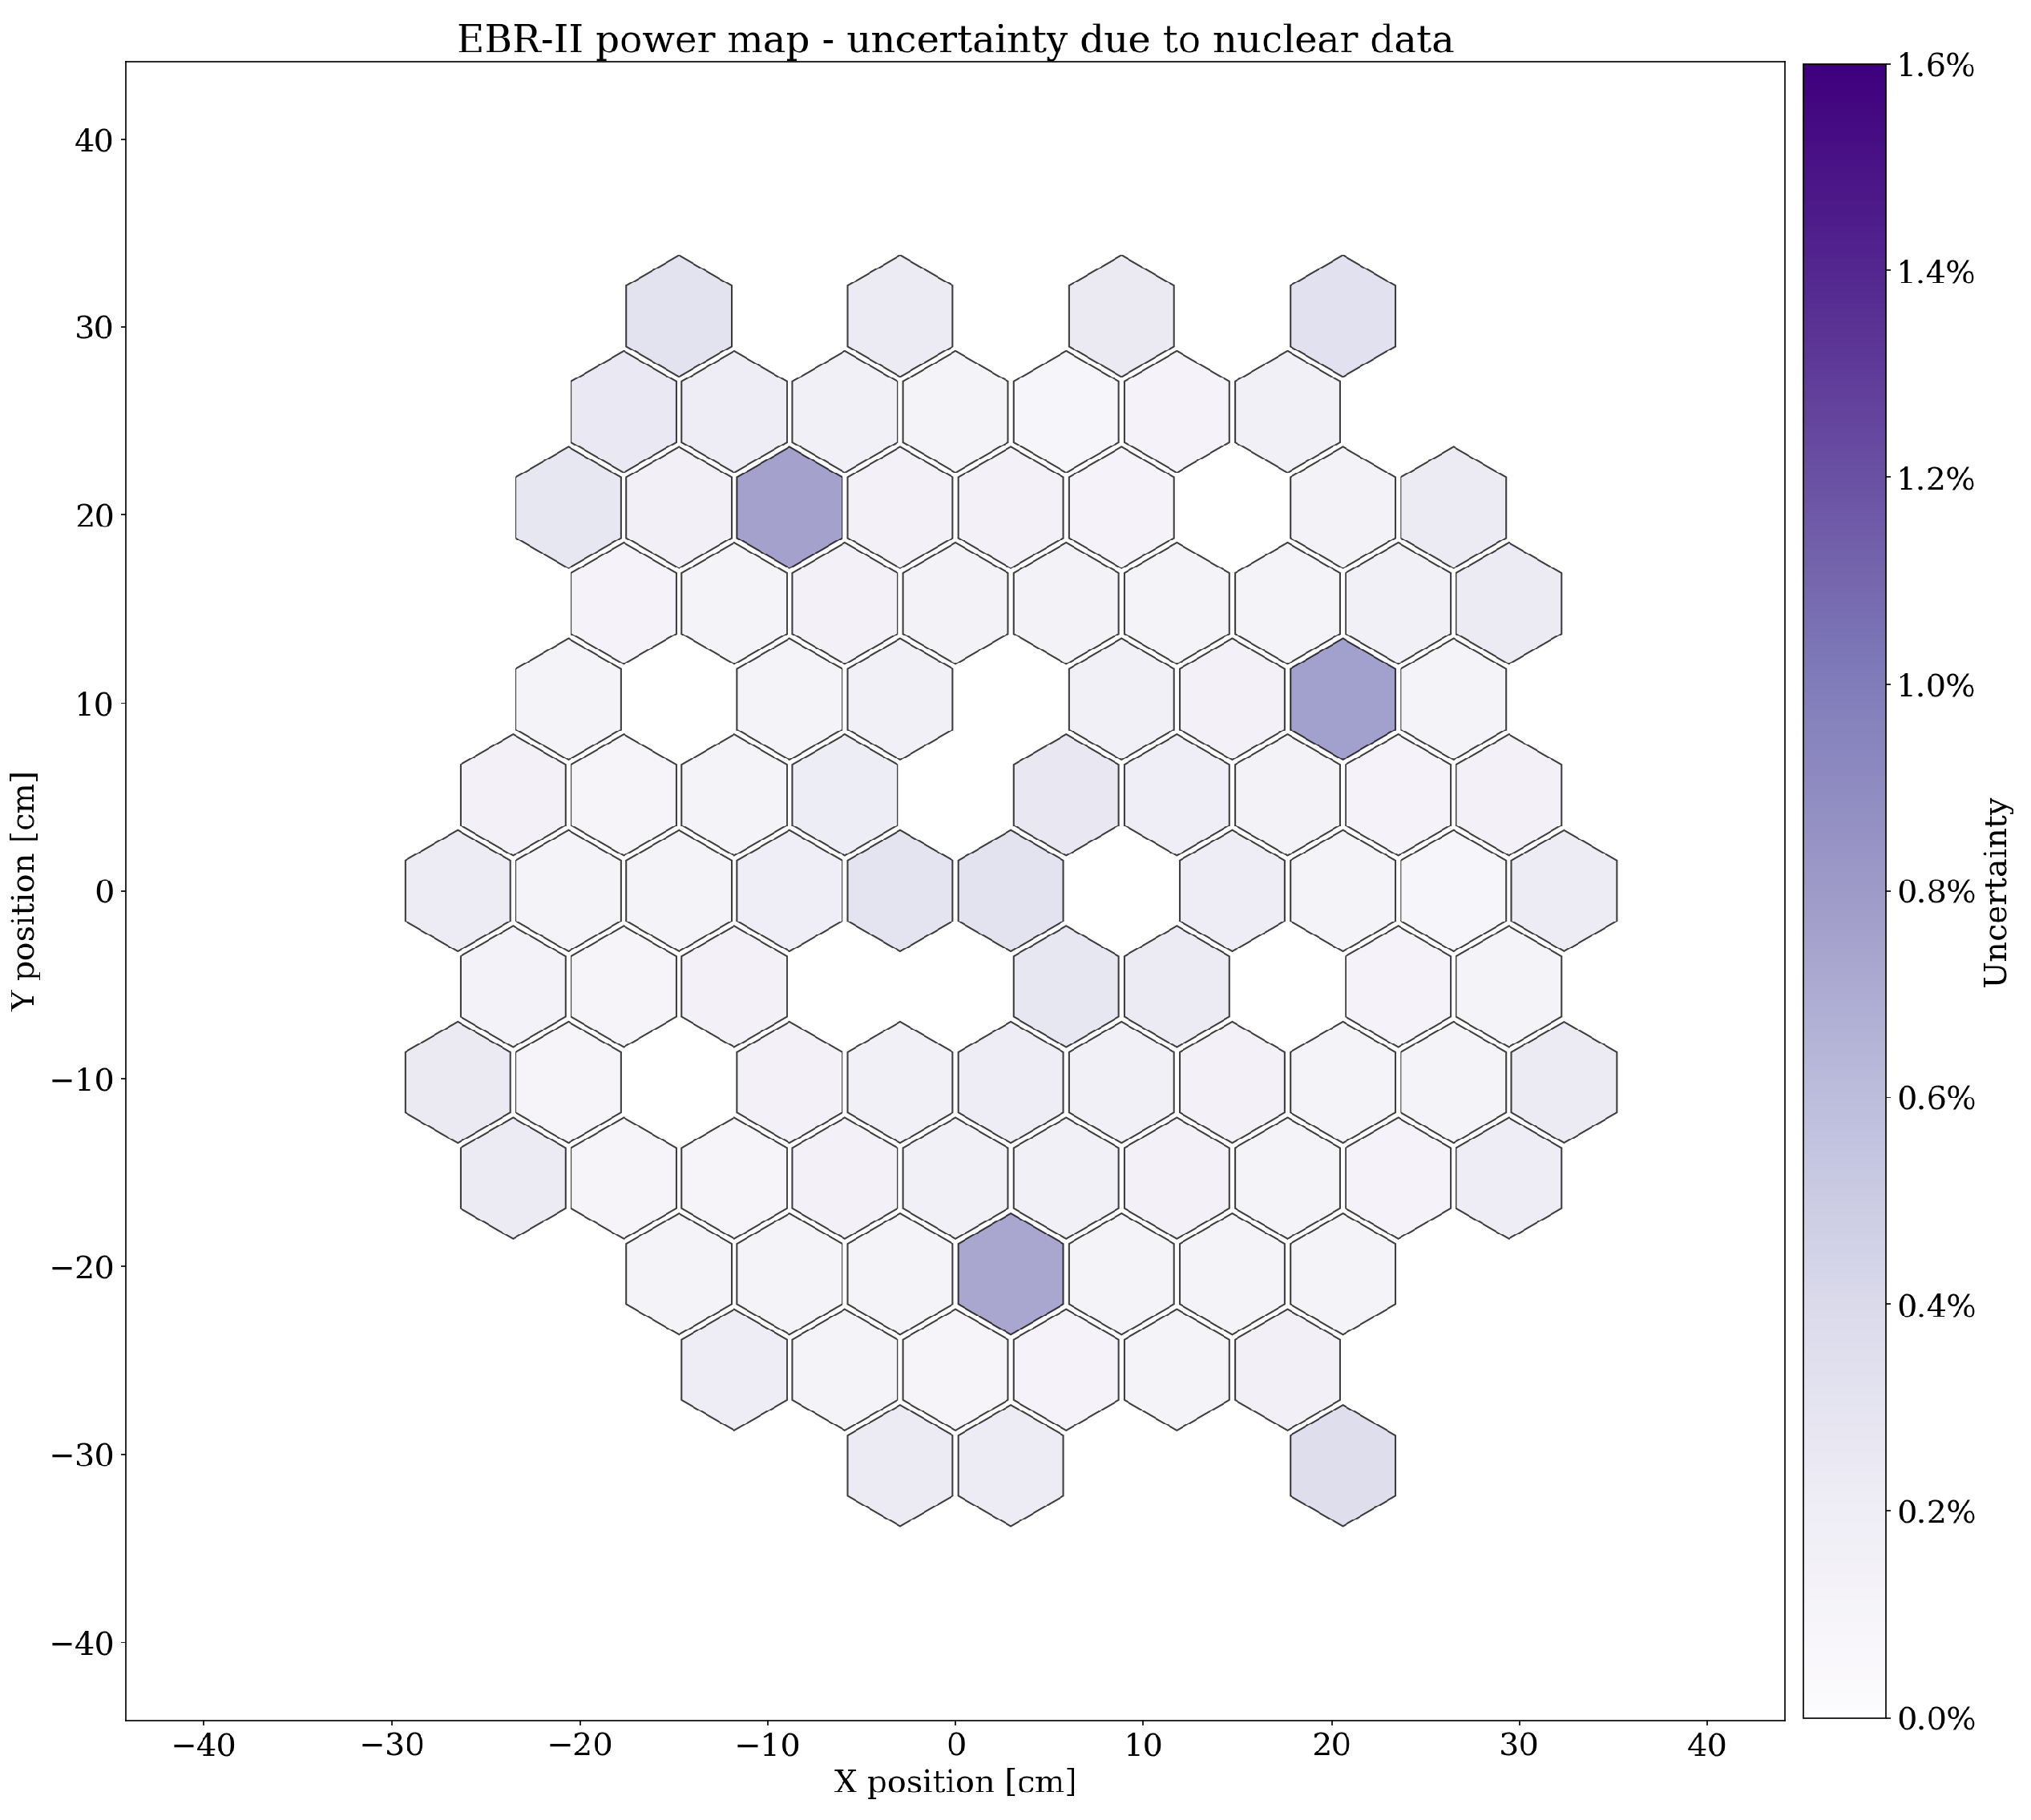
The uncertainty of the EBR-II’s radial power distribution as determined with Sampler /KENO-MG is displayed in
Figure 12 and
Figure 13. The uncertainty of the power in the outer blanket assemblies is larger than the power uncertainty of the inner driver assemblies (
Table 9). The ENDF/B-VII.1 calculation yields larger uncertainties as compared to those obtained using the ENDF/B-VIII.0 calculation.
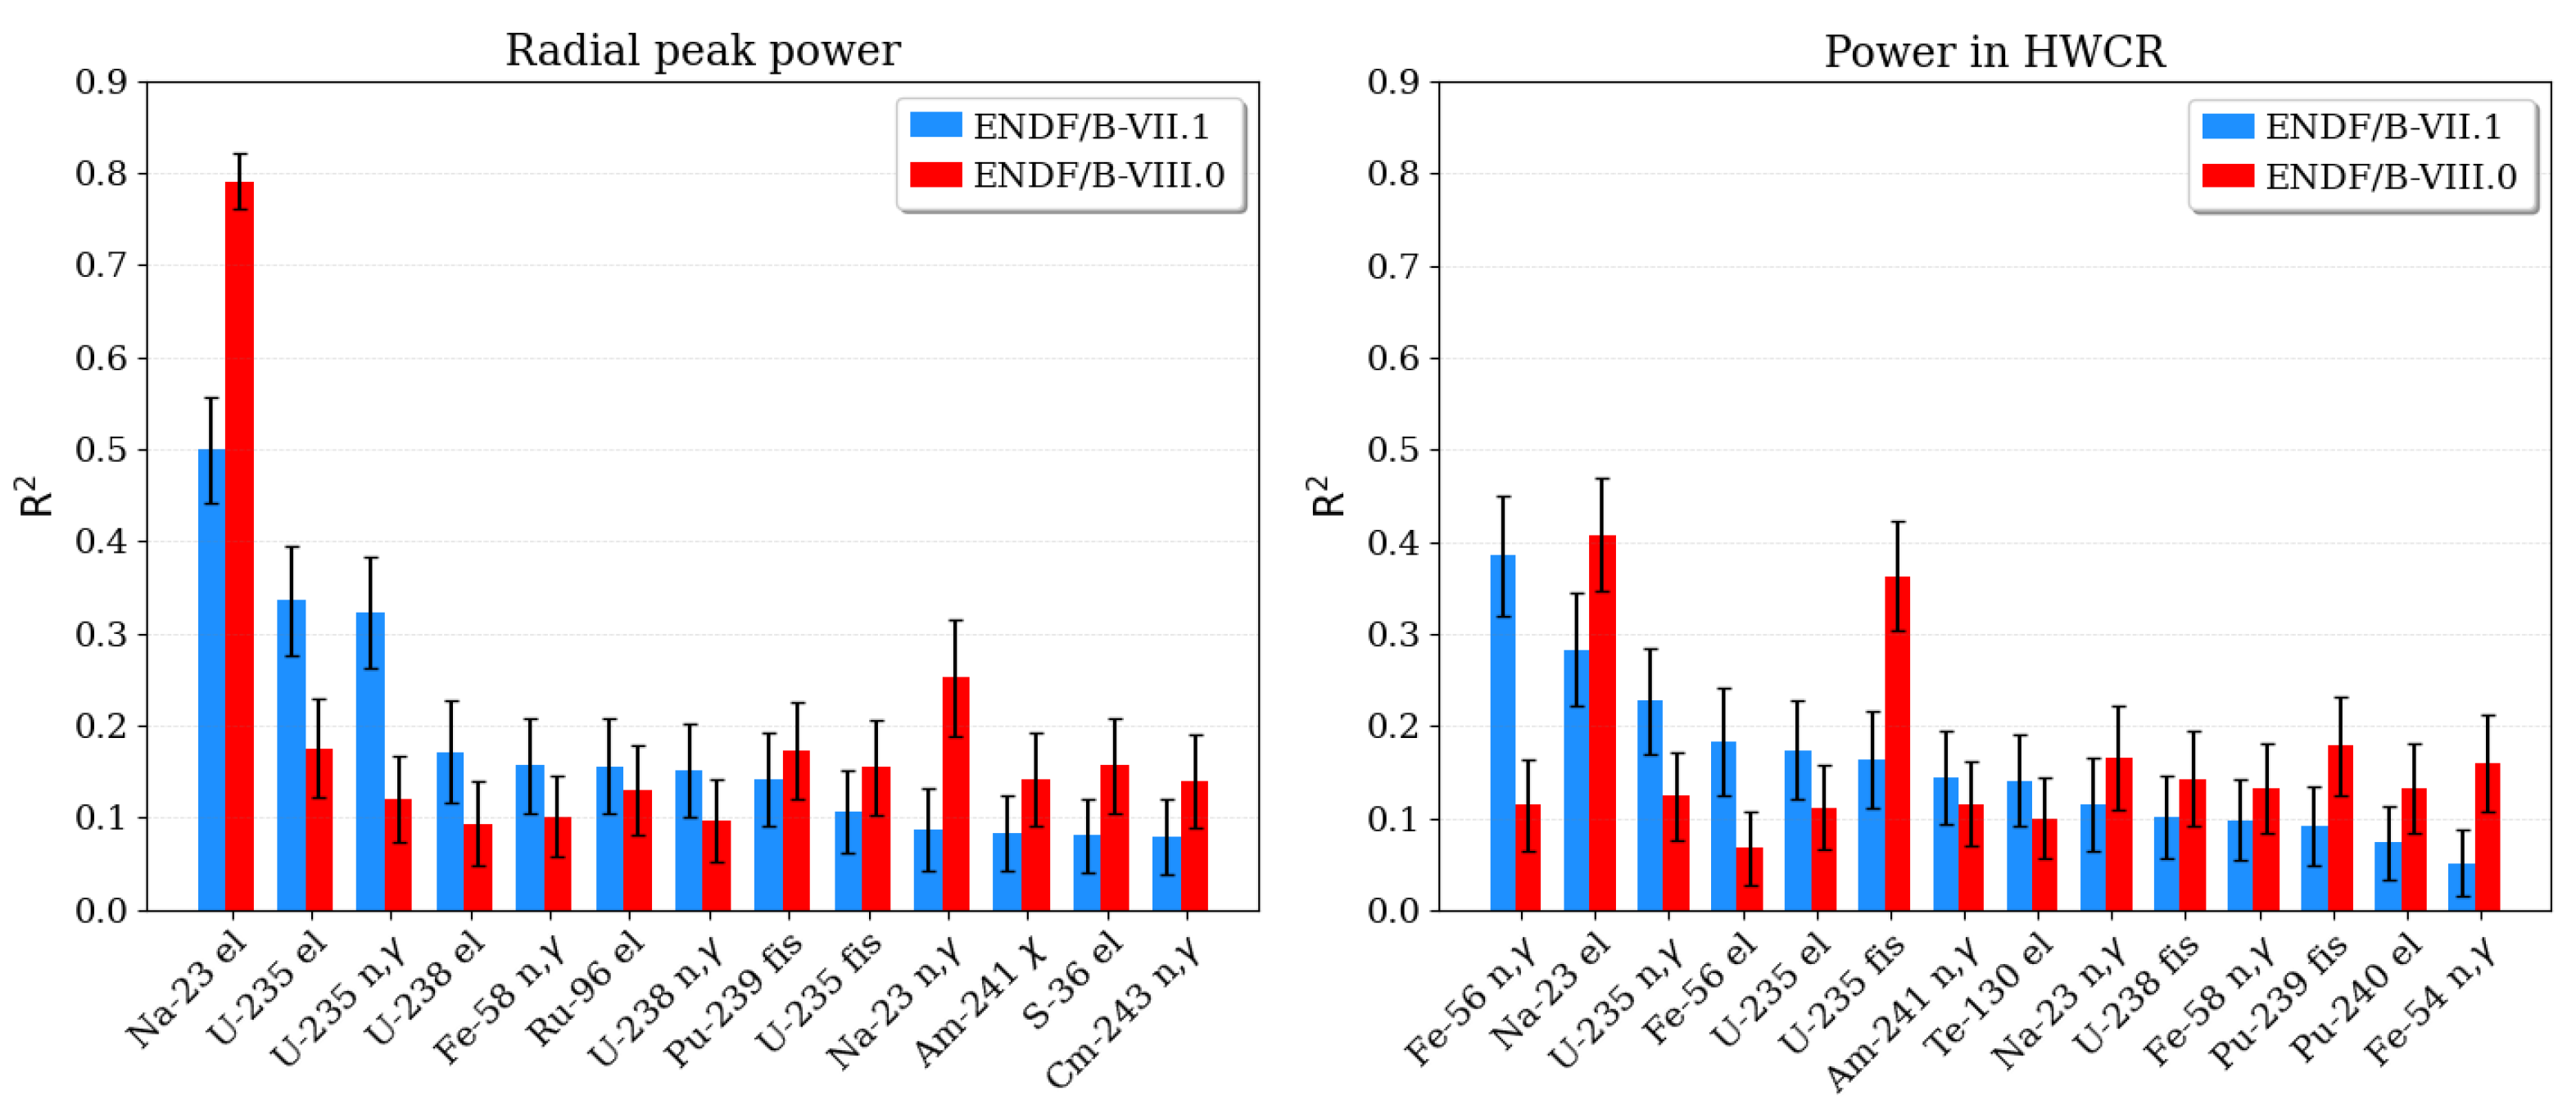
The uncertainties of the peak assembly power as determined with ENDF/B-VII.1 and ENDF/B-VIII.0 are 0.343 and 0.335%, respectively.
Figure 14 shows that the most significant contributor to the peak power uncertainty was found to be
Na elastic scattering (
Figure A1). As for other quantities of interest of the EBR-II, the (n,
) uncertainty of
U (
Figure A6) provides a significant contribution to the power uncertainty. This contribution is no longer identified in the ENDF/B-VIII.0 calculation due to the decrease of this uncertainty in this library. In contrast, the ENDF/B-VIII.0 calculation shows a significant contribution of the
U and
Pu fission uncertainties caused by the increased uncertainty of these reactions in ENDF/B-VIII.0 (
Figure A5 and
Figure A8). The contribution of the
Na (n,
) uncertainty is increased in the ENDF/B-VIII.0 calculation as compared to the ENDF/B-VII.1 calculation. This is not caused by an increase of the uncertainty in the latest ENDF/B release (
Figure A2 shows that the uncertainty did not change between the latest two ENDF/B releases), but rather, it is caused by an increased relevance of this reaction resulting due to the smaller relevance of other cross section uncertainties.
The uncertainties of the partially inserted HWCR assemblies are larger than all other assembly power uncertainties. The largest uncertainty is obtained in the HWCR assembly at position 05E03 with 1.496% and 0.976% in the ENDF/B-VII.1 and ENDF/B-VIII.0 calculation, respectively. The top contributors to the HWCR assembly power uncertainty (
Figure 14) are similar to contributors to the peak assembly power uncertainty, identifying elastic scattering with
Na as most important contributor. Additionally, due to location of the fuel in the HWCR assemblies below the main active region, scattering with the structure below the core, in particular elastic scattering with
Fe, becomes more important.
5. Conclusions
This article presents an assessment of SCALE for application to fast reactor system analyses. The SFR SCALE model used in this study was developed based on the EBR-II benchmark specifications that were recently included in the IRPhEP handbook. The SCALE-calculated eigenvalue was found to be in close agreement with both the measurement and the MCNP benchmark calculation. This analysis provides another data point in demonstrating SCALE’s excellent performance for fast spectrum systems.
To increase awareness of gaps and uncertainties of nuclear data for the simulation of various quantities of interest in fast spectrum systems, sensitivity and uncertainty analyses were performed for the eigenvalue, as well as reactivity effects and the radial power profile, using the two most recent ENDF/B nuclear data libraries.
The sensitivity analyses provided information about nuclear data for which a change in the data could cause a significant change in the calculated metric of interest. It was found that reactivity in the EBR-II is significantly affected by fission, (n,), , and scattering cross sections for U and U, as well as scattering cross sections for nuclides in coolant and structural materials.
The results of the uncertainty analyses—in particular the ranking of contributions to the output uncertainties—can be used to guide future measurement and evaluation efforts to reduce the significant nuclear data uncertainties, thereby significantly reducing the overall observed uncertainties. Due to the fast neutron flux spectrum in the EBR-II, it was found that the large reactivity uncertainties of 1–5% are mainly caused by large uncertainties for the U (n,) reaction in the fast energy range. For the control rod worth, the uncertainty of the Fe (n,) reaction and inelastic scattering of U and U also contribute significantly to the overall output uncertainty.
While the nominal results are consistent between the calculations with the different libraries, the uncertainties due to nuclear data vary significantly. Since the uncertainty of the major driver of the observed uncertainties—U (n,)—is significantly reduced in the ENDF/B-VIII.0 nuclear data library as compared to ENDF/B-VII.0 and ENDF/B-VII.1 libraries, the uncertainties determined for the investigated output uncertainties tend to be smaller in ENDF/B-VIII.0 calculations, although the decrease is partially compensated for by increased uncertainties of U fission and .
Results from the present study build the foundation for future assessments using the developed SCALE model. This model will be used for continued validation of SCALE, for continued testing of SCALE’s nuclear data libraries, and for generation of source terms to support severe accident analysis.
Author Contributions
Conceptualization, F.B.; methodology, F.B.; software, F.B.; validation, F.B.; formal analysis, F.B.; investigation, F.B.; resources, G.I., W.A.W.; data curation, F.B.; writing—original draft preparation, F.B.; writing—review and editing, F.B., G.I., W.A.W.; visualization, F.B.; supervision, G.I., W.A.W.; project administration, G.I., W.A.W.; funding acquisition, G.I., W.A.W. All authors have read and agreed to the published version of the manuscript.
Funding
This research was funded by the US Nuclear Regulatory Commission under contract IAA 31310019N0009 for nuclear data assessment for advanced reactors.
Institutional Review Board Statement
Not applicable.
Informed Consent Statement
Not applicable.
Data Availability Statement
The data presented in this study are available on request from the corresponding author.
Acknowledgments
Support for this work was provided by the US Nuclear Regulatory Commission (NRC).
Conflicts of Interest
The authors declare no conflict of interest. The funders had no role in the design of the study; in the collection, analyses, or interpretation of data; in the writing of the manuscript, or in the decision to publish the results.
Abbreviations
The following abbreviations are used in this manuscript:
| CE | continuous-energy |
| CLUTCH | contributon-linked eigenvalue sensitivity/uncertainty estimation via track length importance characterization |
| CR | control rod |
| DOE | Department of Energy |
| EBR-II | Experimental Breeder Reactor II |
| ENDF/B | Evaluated Nuclear Data File/B |
| HWCR | high worth control rod |
| IFP | iterated fission probability |
| INL | Idaho National Laboratory |
| IRPhEP | International Reactor Physics Experiment Evaluation Project |
| JENDL | Japanese Evaluated Nuclear Data Library |
| LWR | light water reactor |
| MCNP | Monte Carlo N-Particle Transport Code |
| MG | multigroup |
| ORNL | Oak Ridge National Laboratory |
| SFR | sodium-cooled fast reactor |
Appendix A. Comparison of Relevant Nominal Data and Uncertainties between the Different ENDF/B Versions
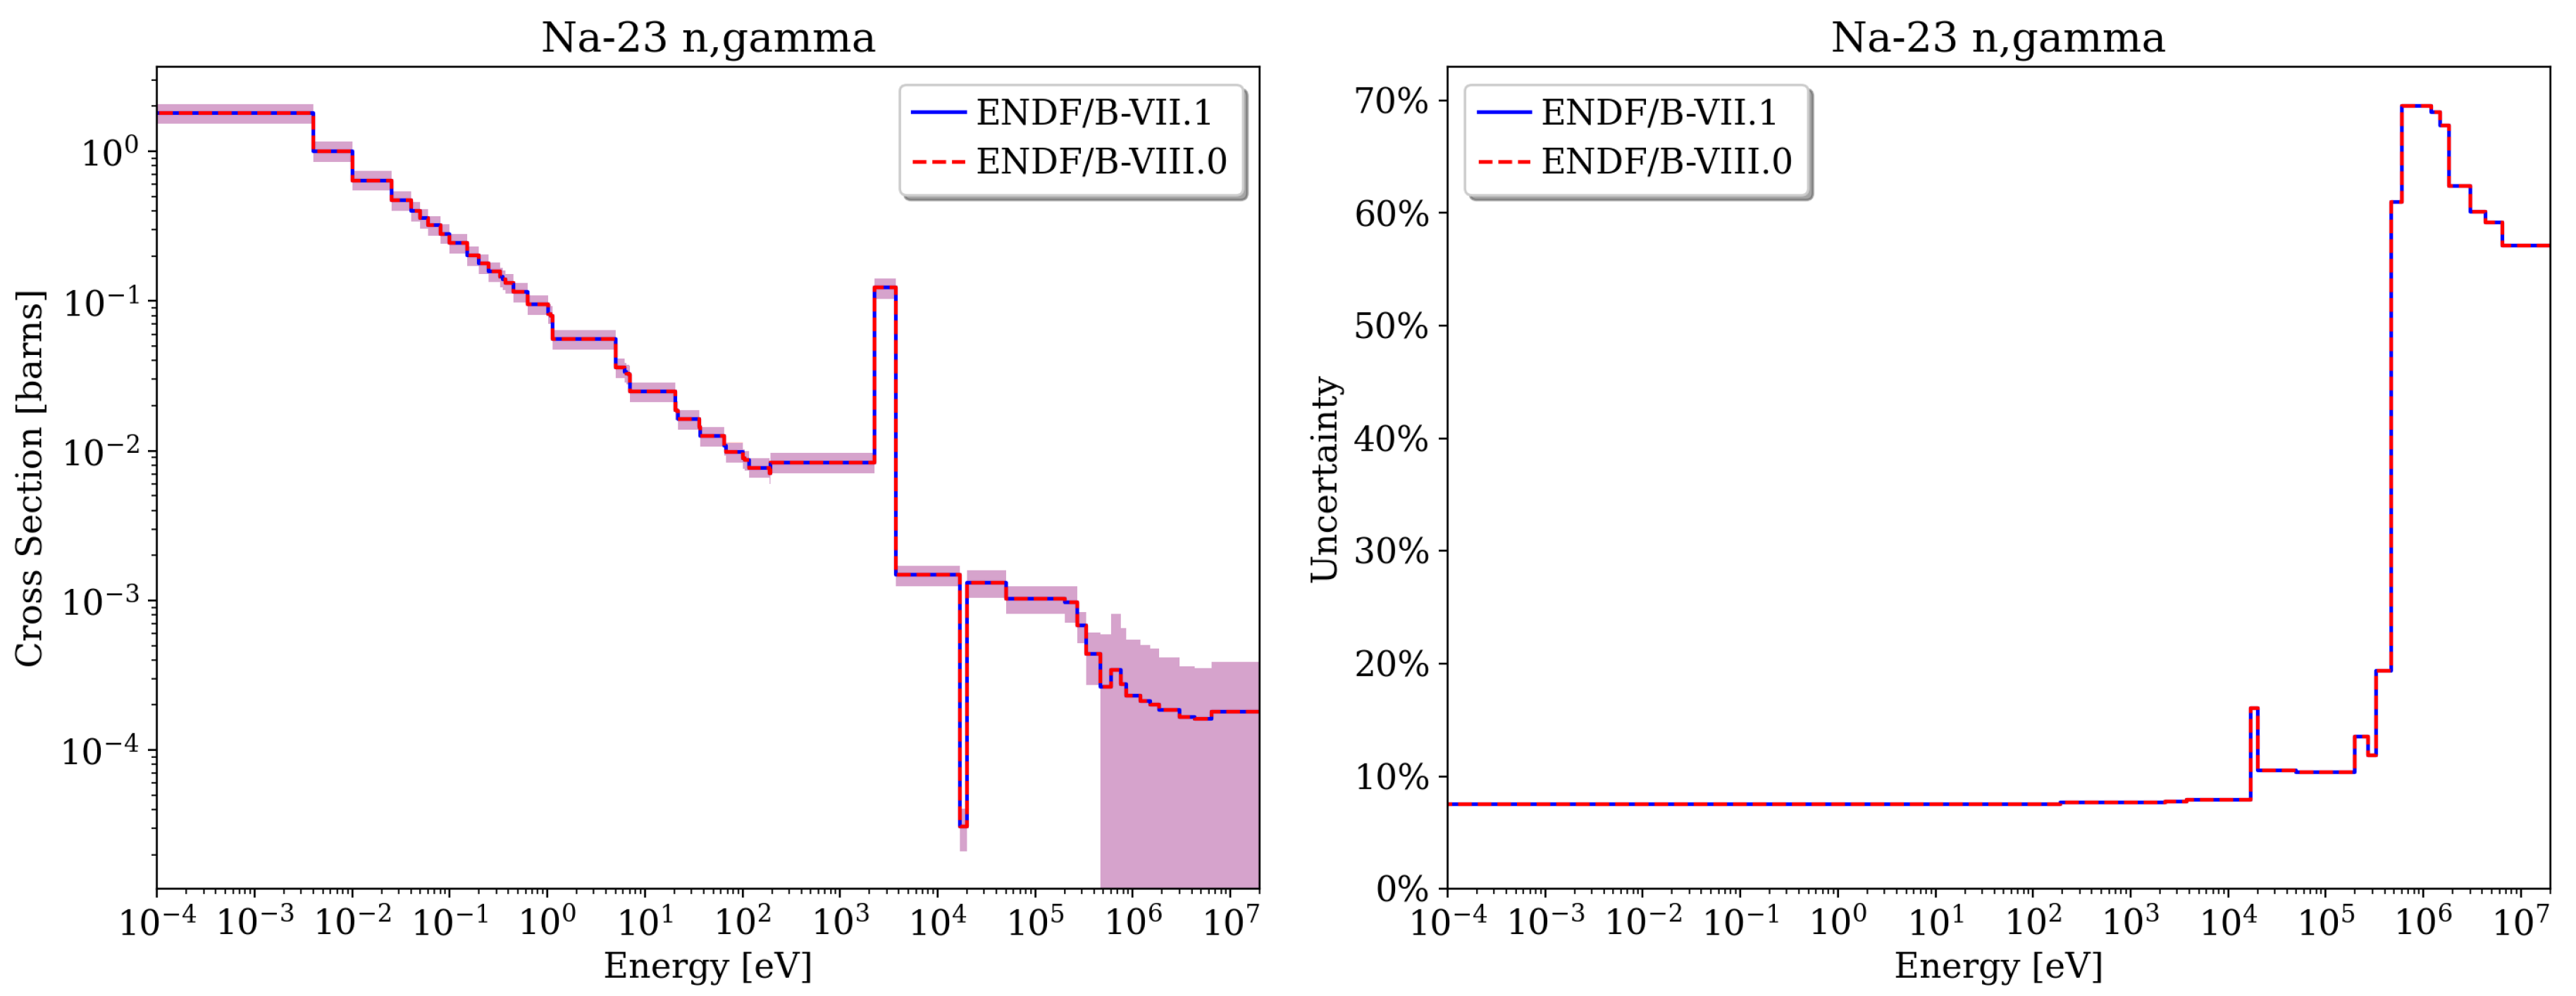
Figure A1.
Na elastic scattering nominal data and uncertainty.
Figure A1.
Na elastic scattering nominal data and uncertainty.
Figure A2.
Na (n,) nominal data and uncertainty.
Figure A2.
Na (n,) nominal data and uncertainty.
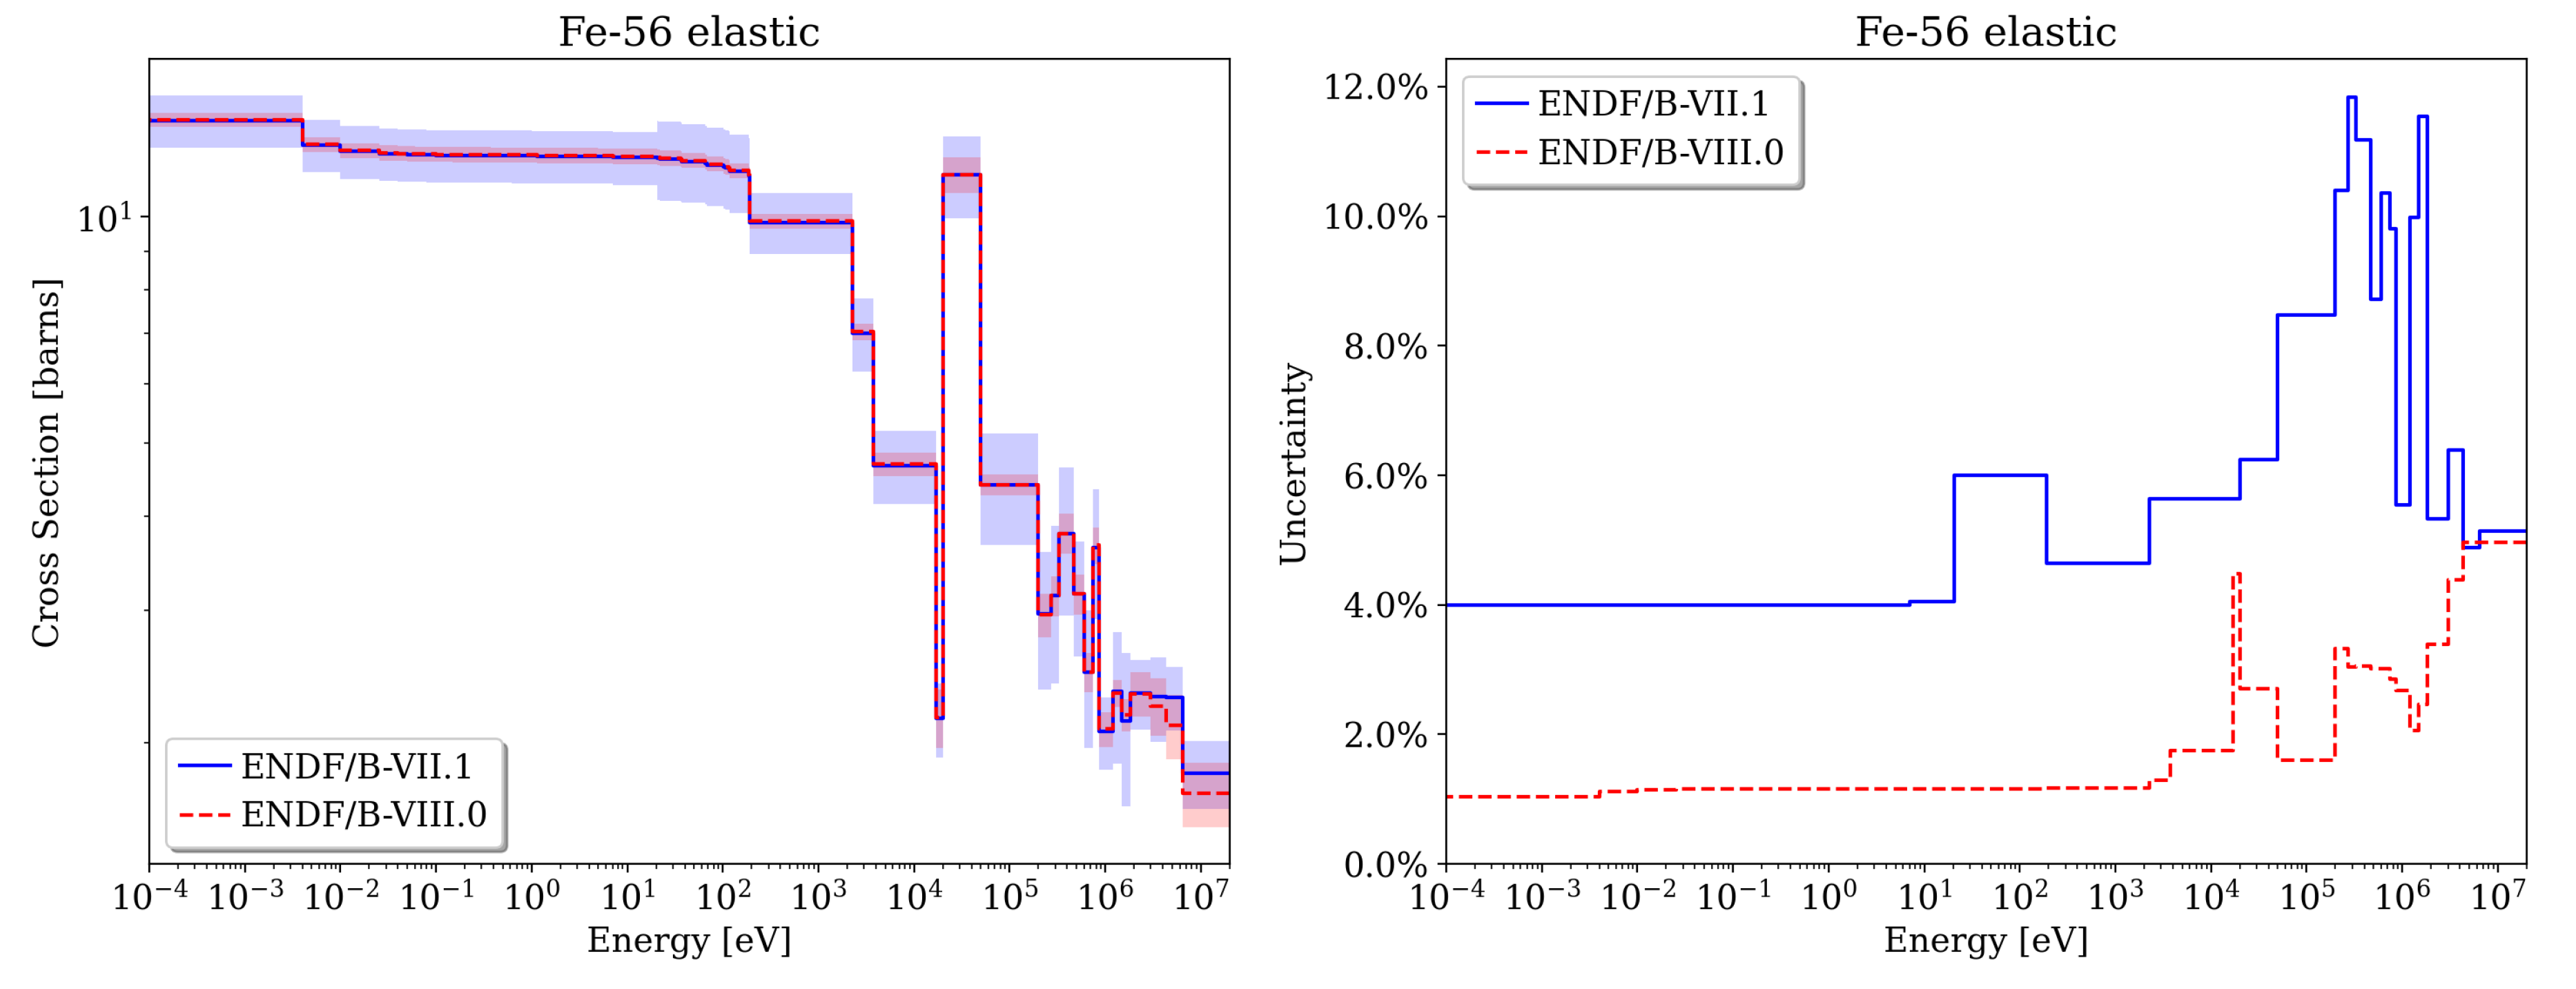
Figure A3.
Fe elastic scattering nominal data and uncertainty.
Figure A3.
Fe elastic scattering nominal data and uncertainty.
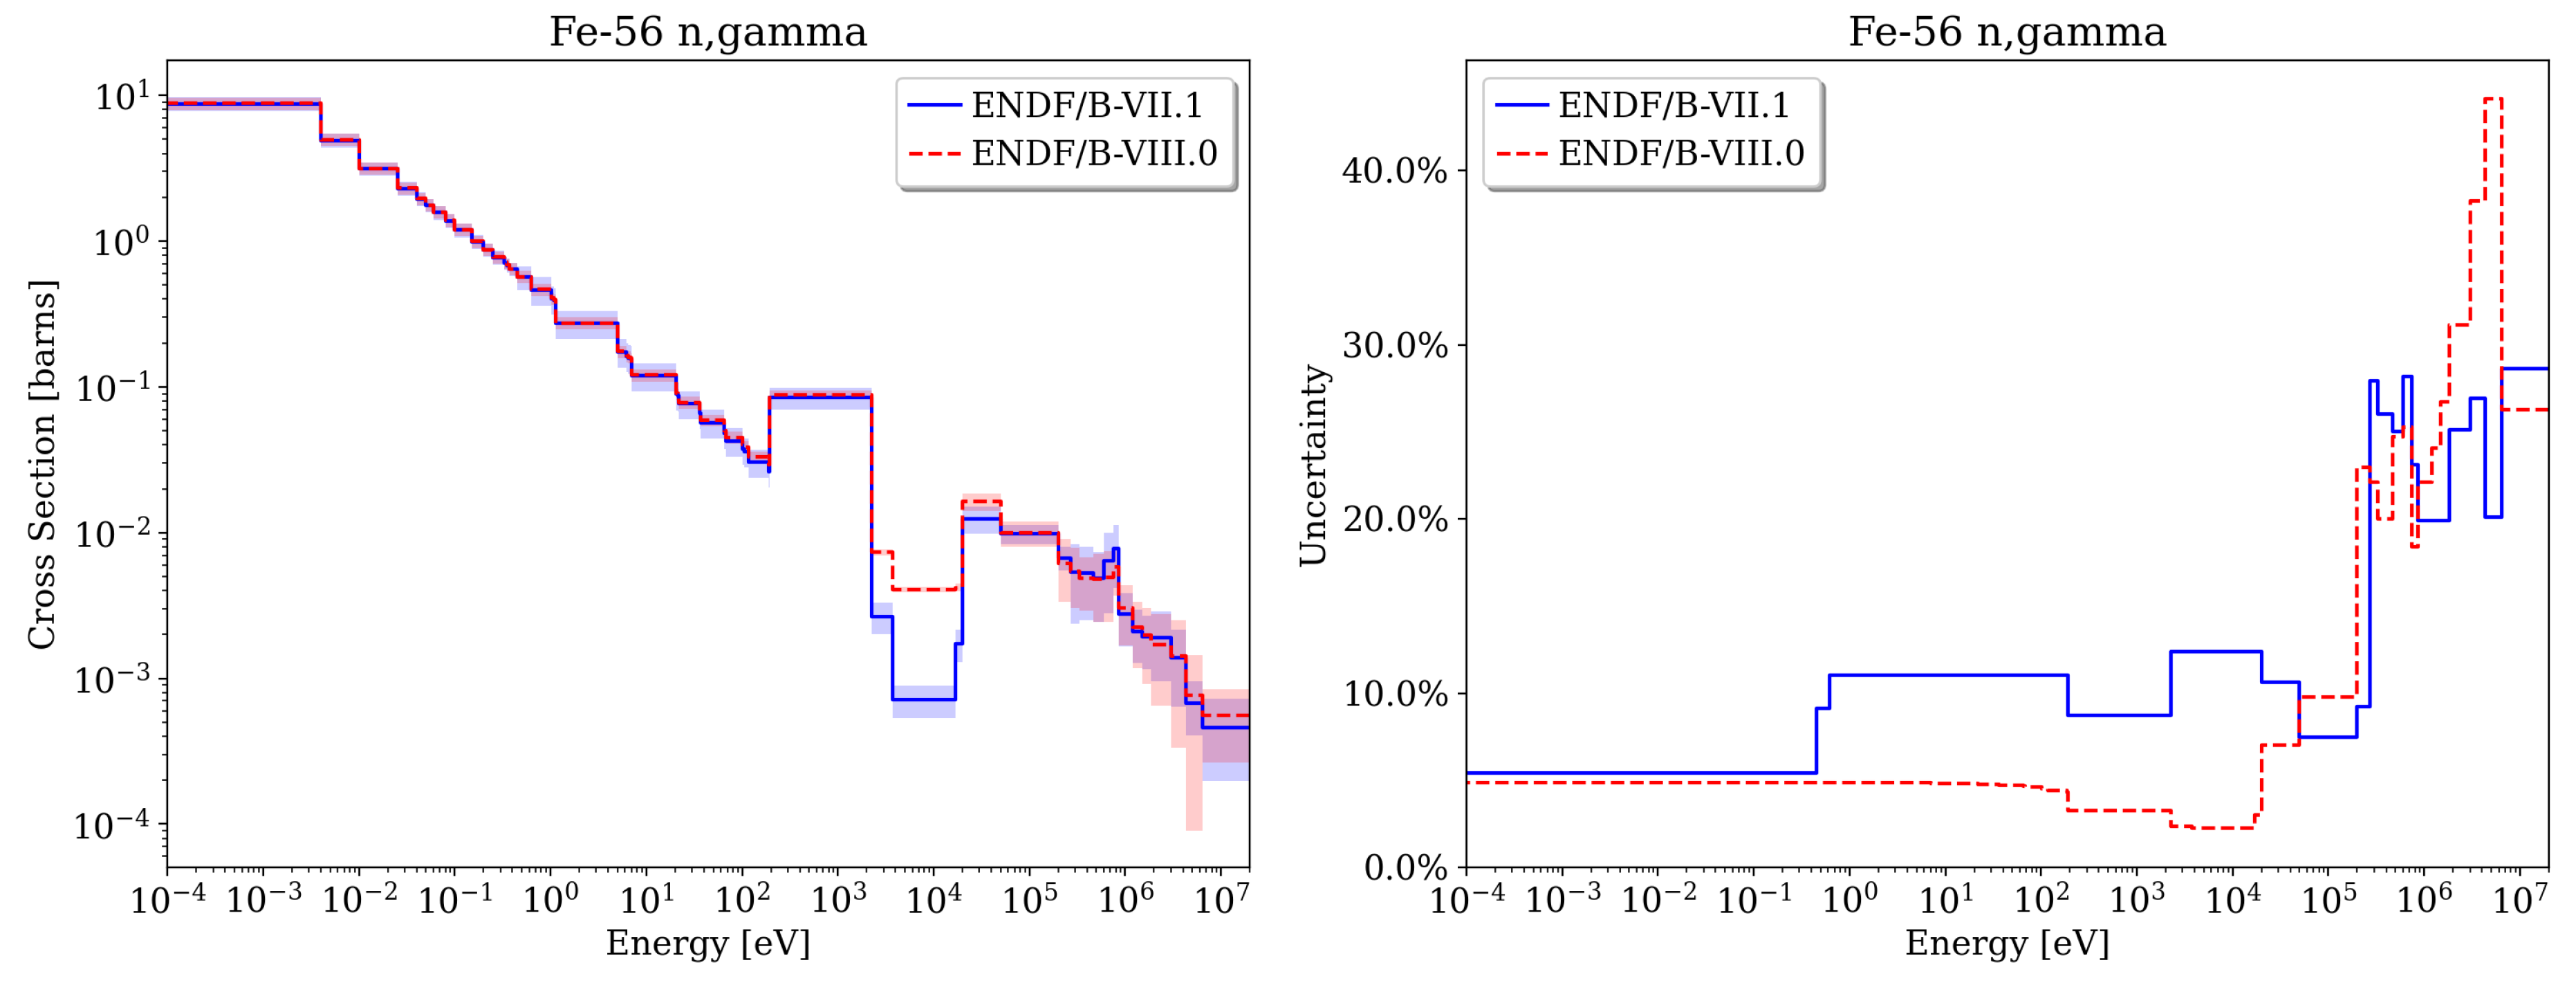
Figure A4.
Fe (n,) nominal data and uncertainty.
Figure A4.
Fe (n,) nominal data and uncertainty.
Figure A5.
U fission nominal data and uncertainty.
Figure A5.
U fission nominal data and uncertainty.
Figure A6.
U (n,) nominal data and uncertainty.
Figure A6.
U (n,) nominal data and uncertainty.
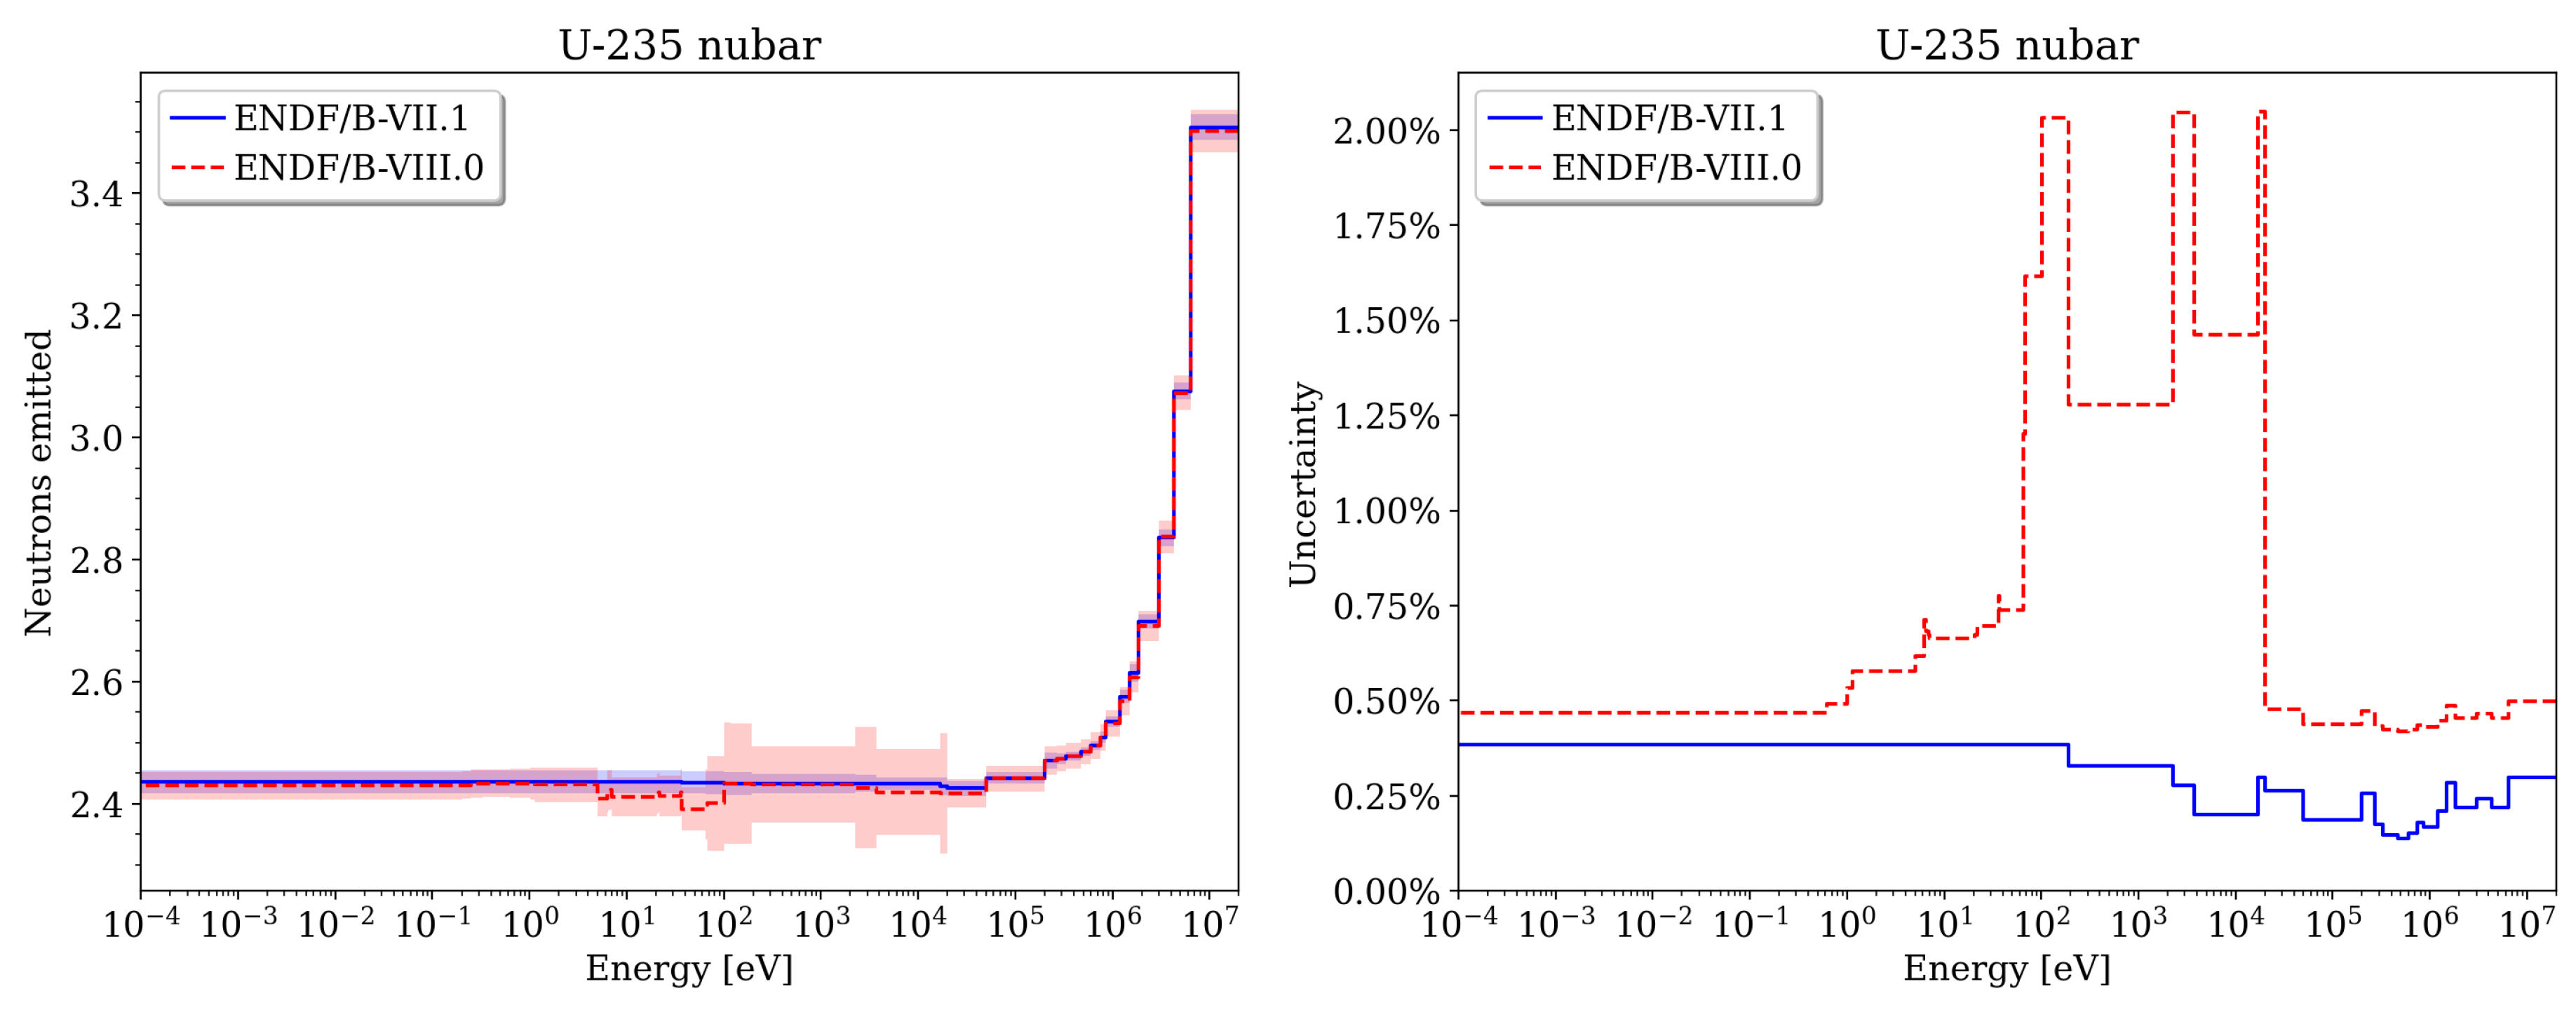
Figure A7.
U nominal data and uncertainty.
Figure A7.
U nominal data and uncertainty.
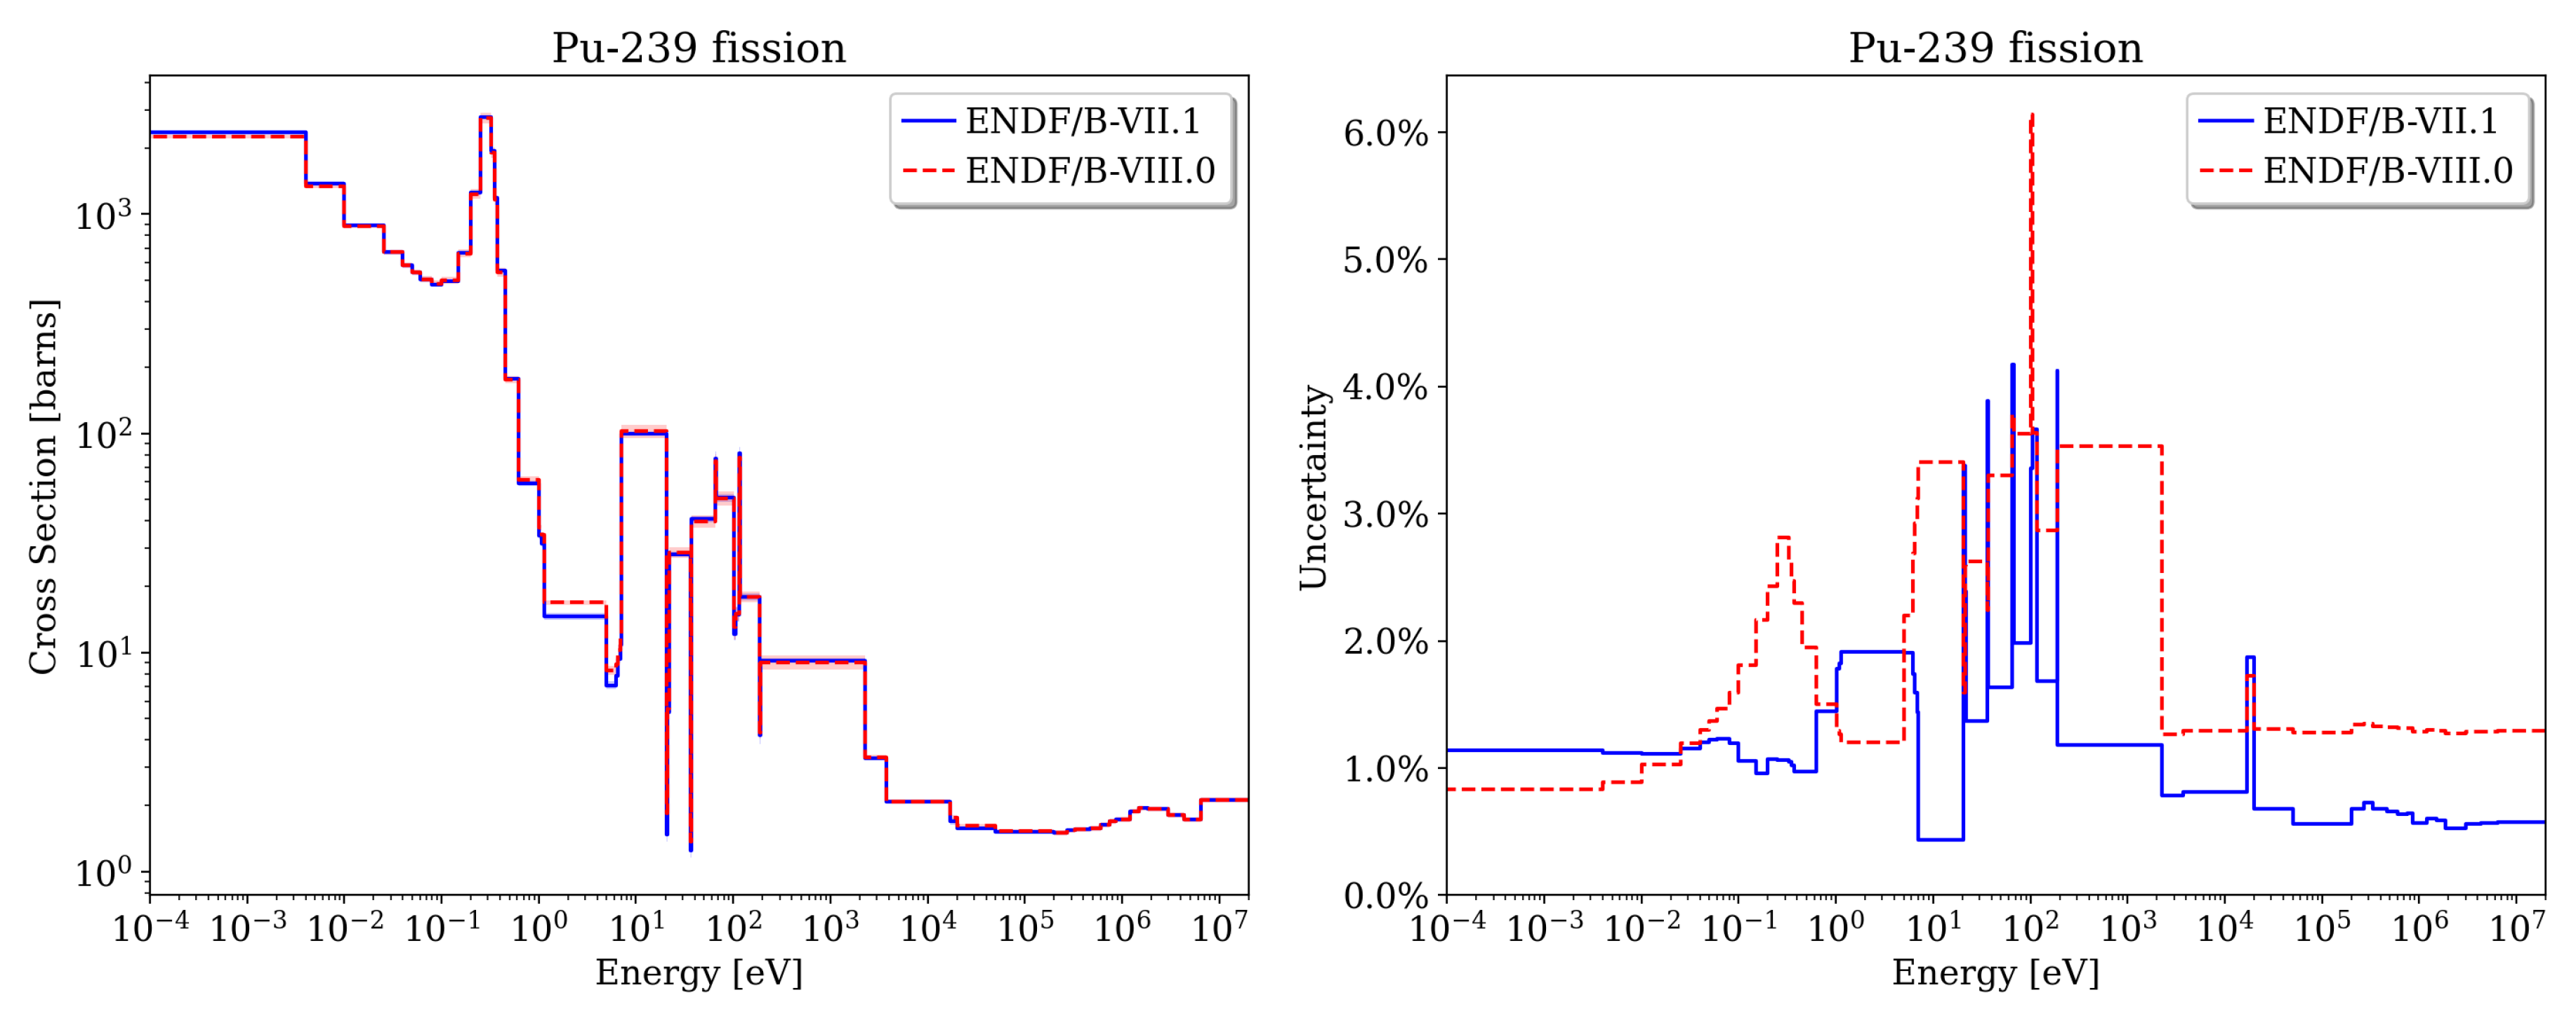
Figure A8.
Pu fission nominal data and uncertainty.
Figure A8.
Pu fission nominal data and uncertainty.
References
- Lum, E.S.; Pope, C.L.; Stewart, R.; Byambadorj, B.; Beaulieu, Q. Evaluation of Run 138B at Experimental Breeder Reactor II, a Prototypic Liquid Metal Reactor; Technical Report EBR2-LMFR-RESR-001, CRIT, NEA/NSC/DOC(2006)1; Organisation for Economic Cooperation and Development/Nuclear Energy Agency: Paris, France, 2018. [Google Scholar]
- Balestra, P.; Parisi, C.; Alfonsi, A. EBR-II Static Neutronic Calculations by PHISICS / MCNP6 Codes. In Proceedings of the Transactions of the American Nuclear Society, New Orleans, LA, USA, 12–16 June 2016; Volume 114. [Google Scholar]
- IAEA. Benchmark Analysis of EBR-II Shutdown Heat Removal Tests; Technical Report IAEA-TECDOC-1819; International Atomic Energy Agency: Vienna, Austria, 2017. [Google Scholar]
- van Rooijen, W. Analysis of the EBR-II SHRT-45R Neutronics Benchmark with ERANOS-2.0. In Proceedings of the Fast Reactors and Related Fuel Cycles: Next Generation Nuclear Systems for Sustainable Development FR17, Yekaterinburg, Russia, 26–29 June 2017; p. IAEA–CN245–159. [Google Scholar]
- Lyu, S.; Lu, D.; Sui, D. Neutronics benchmark analysis of the EBR-II SHRT-45R with SAC-3D. Nucl. Eng. Design 2020, 364, 110679. [Google Scholar] [CrossRef]
- Lum, E.S.; Pope, C. Experimental Breeder Reactor II Reactor Physics Benchmark Evaluation. In Proceedings of the Transactions of the American Nuclear Society, Orlando, FL, USA, 11–15 November 2018; Volume 119. [Google Scholar]
- Stewart, R.; Lum, E.; Pope, C. Design of an experimental breeder reactor run 138B reactor physics benchmark evaluation management application. J. Nucl. Sci. Technol. 2020, 57, 323–334. [Google Scholar] [CrossRef]
- Bostelmann, F. Systematic Sensitivity and Uncertainty Analysis of Sodium-Cooled Fast Reactor Systems. Ph.D. Thesis, École Polytechnique Fédérale de Lausanne, Lausanne, Switzerland, 2020. [Google Scholar]
- Bostelmann, F.; Holcomb, A.M.; Clarity, J.B.; Marshall, W.J.; Sobes, V.; Rearden, B.T. Nuclear Data Performance Assessment for Advanced Reactors; Technical Report ORNL/TM-2018/1033; Oak Ridge National Laboratory: Oak Ridge, TN, USA, 2019. [Google Scholar]
- Bostelmann, F.; Holcomb, A.M.; Marshall, W.J.; Sobes, V.; Rearden, B.T. Impact of the ENDF/B-VIII.0 Library on Advanced Reactor Simulations. In Proceedings of the Transactions of the American Nuclear Society, Washington, DC, USA, 17–21 November 2019; Volume 121. [Google Scholar]
- Wieselquist, W.A.; Lefebvre, R.A.; Jessee, M.A. SCALE Code System, Version 6.2.4; Technical Report ORNL/TM-2005/39; Oak Ridge National Laboratory: Oak Ridge, TN, USA, 2020. [Google Scholar]
- Saylor, E.M.; Marshall, W.J.; Clarity, J.B.; Clifton, Z.J.; Rearden, B.T. Criticality Safety Validation of SCALE 6.2.2; Technical Report ORNL/TM-2018/884; Oak Ridge National Laboratory: Oak Ridge, TN, USA, 2018. [Google Scholar]
- Kim, K.S.; Bostelmann, F.; Holcomb, A.M.; Ilas, G.; Wieselquist, W.A. Verification of the ENDF/B-VII.1 and VIII.0 AMPX 1597-group libraries for advanced reactor analysis. In Proceedings of the M&C 2019, Portland, OR, USA, 25–29 August 2019. [Google Scholar]
- Kim, K.S.; Williams, M.L.; Holcomb, A.M.; Wiarda, D.; Jeon, B.K.; Yang, W.S. The SCALE/AMPX multigroup cross section processing for fast reactor analysis. Ann. Nucl. Energy 2019, 132, 161–171. [Google Scholar] [CrossRef]
- Rearden, B.T.; Williams, M.L.; Jessee, M.A.; Mueller, D.E.; Wiarda, D.A. Sensitivity and uncertainty analysis capabilities and data in SCALE. Nucl. Technol. 2011, 174, 236–288. [Google Scholar] [CrossRef]
- Broadhead, B.L.; Rearden, B.T.; Hopper, C.M.; Wagschal, J.J.; Parks, C.V. Sensitivity- and Uncertainty-Based Criticality Safety Validation Techniques. Nucl. Sci. Eng. 2004, 146, 340–366. [Google Scholar] [CrossRef]
- Perfetti, C.M.; Rearden, B.T.; Martin, W.R. SCALE Continuous-Energy Eigenvalue Sensitivity Coefficient Calculations. Nucl. Sci. Eng. 2016, 182, 332–353. [Google Scholar] [CrossRef]
- Williams, M.L. Perturbation Theory for Nuclear Reactor Analysis. In Handbook of Nuclear Reactors Calculations, Volume III; Ronen, Y., Ed.; CRC Press: Boca Raton, FL, USA, 1986; pp. 63–188. [Google Scholar]
- Williams, M.L.; Broadhead, B.L.; Parks, C.V. Eigenvalue Sensitivity Theory for Resonance-Shielded Cross Sections. Nucl. Sci. Eng. 2001, 138, 177–191. [Google Scholar] [CrossRef]
- Williams, M.L. Sensitivity and Uncertainty Analysis for Eigenvalue-Difference Responses. Nucl. Sci. Eng. 2007, 155, 18–36. [Google Scholar] [CrossRef]
- Williams, M.L.; Ilas, G.; Jessee, M.A.; Rearden, B.T.; Wiarda, D.; Zwermann, W.; Gallner, L.; Klein, M.; Krzykacz-Hausmann, B.; Pautz, A. A statistical sampling method for uncertainty analysis with SCALE and XSUSA. Nucl. Technol. 2013, 183, 515–526. [Google Scholar] [CrossRef]
- Chadwick, M.B.; Herman, M.; Obložinský, P.; Dunn, M.E.; Danon, Y.; Kahler, A.C.; Smith, D.L.; Pritychenko, B.; Arbanas, G.; Arcilla, R.; et al. ENDF/B-VII.1 Nuclear Data for Science and Technology: Cross Sections, Covariances, Fission Product Yields and Decay Data. Nucl. Data Sheets 2011, 112, 2887–2996. [Google Scholar] [CrossRef]
- Brown, D.; Chadwick, M.; Capote, R.; Kahler, A.; Trkov, A.; Herman, M.; Sonzogni, A.; Danon, Y.; Carlson, A.; Dunn, M.; et al. ENDF/B-VIII.0: The 8th Major Release of the Nuclear Reaction Data Library with CIELO-Project Cross Sections, New Standards and Thermal Scattering Data. Nucl. Data Sheets 2018, 148, 1–142. [Google Scholar] [CrossRef]
- Choi, C.; Ha, K.S. Assessment calculation of MARS-LMR using EBR-II SHRT-45R. Nucl. Eng. Design 2016, 307, 10–29. [Google Scholar] [CrossRef]
- Chadwick, M.; Obložinský, P.; Herman, M.; Greene, N.; McKnight, R.; Smith, D.; Young, P.; MacFarlane, R.; Hale, G.; Frankle, S.; et al. ENDF/B-VII.0: Next Generation Evaluated Nuclear Data Library for Nuclear Science and Technology. Nucl. Data Sheets 2006, 107, 2931–3060. [Google Scholar] [CrossRef] [Green Version]
- Rochman, D.; Leray, O.; Hursin, M.; Ferroukhi, H.; Vasiliev, A.; Aures, A.; Bostelmann, F.; Zwermann, W.; Cabellos, O.; Diez, C.; et al. Nuclear Data Uncertainties for Typical LWR Fuel Assemblies and a Simple Reactor Core. Nucl. Data Sheets 2017, 139, 1–76. [Google Scholar] [CrossRef] [Green Version]
Figure 1.
EBR-II Run 138B core configuration [
1].
Figure 1.
EBR-II Run 138B core configuration [
1].
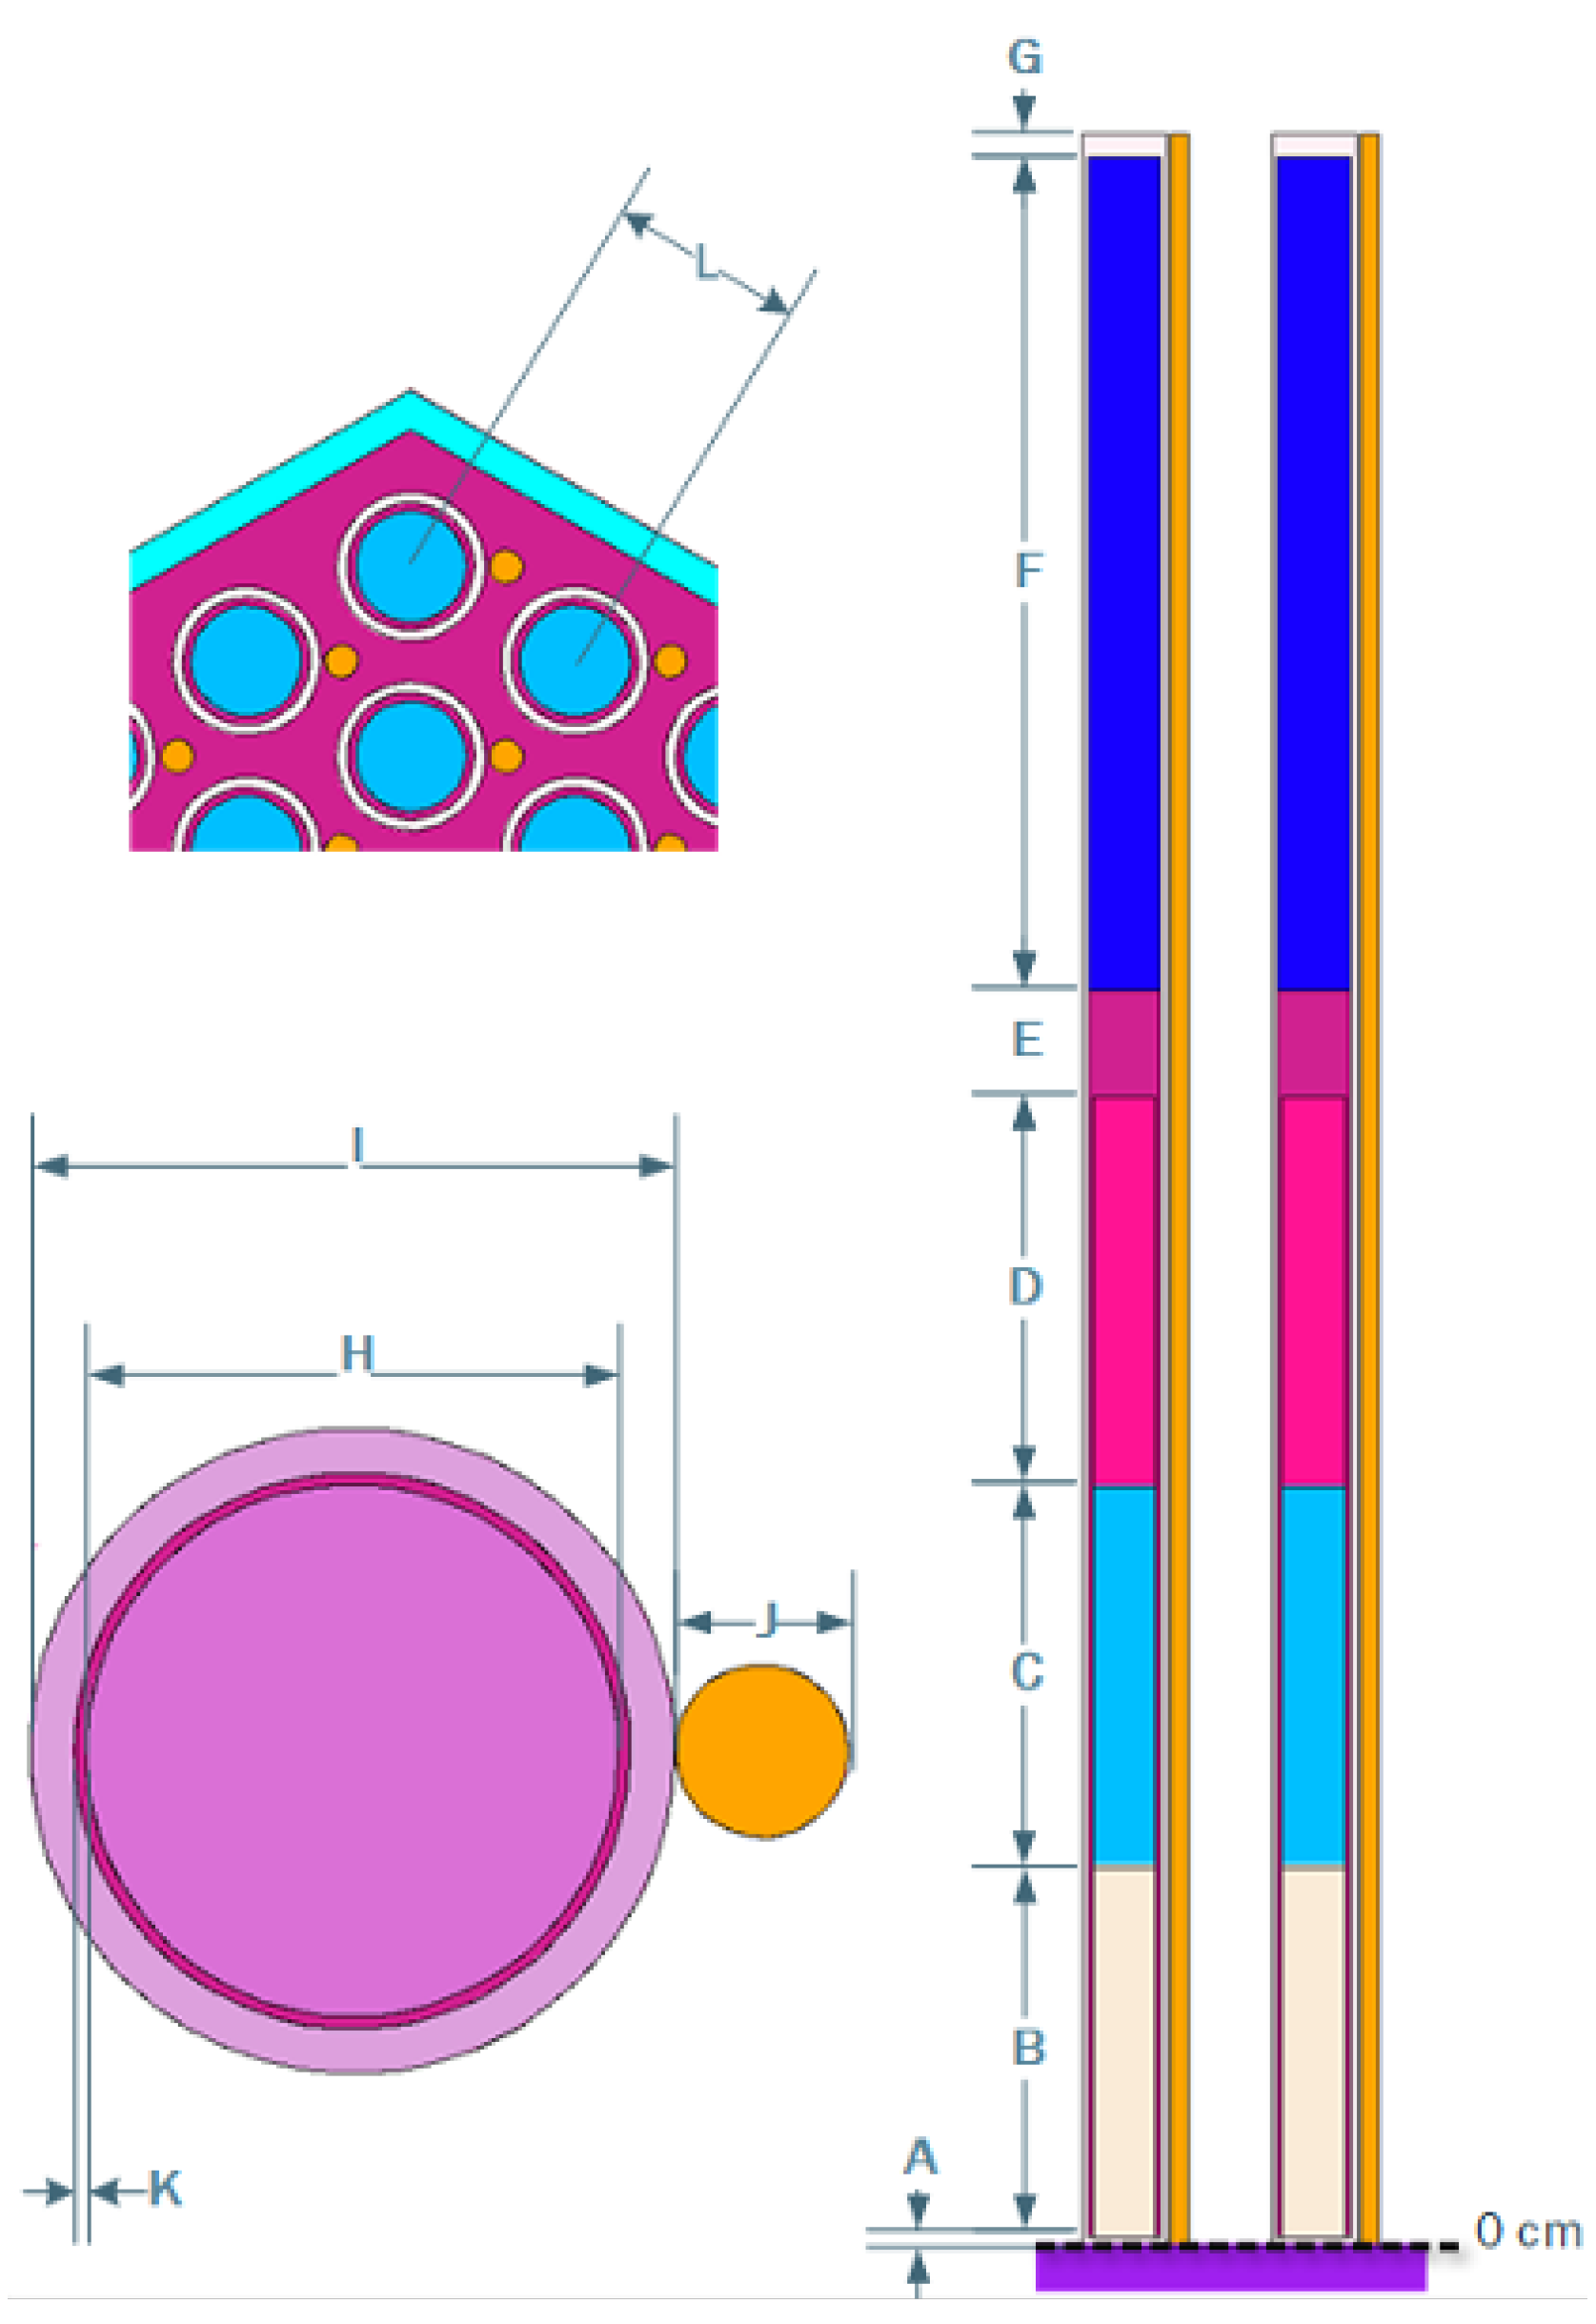
Figure 2.
EBR-II driver rod [
1]. The driver rod consisted of three fuel slugs (B, C, D), sodium bond (E), and gas plenum (F).
Figure 2.
EBR-II driver rod [
1]. The driver rod consisted of three fuel slugs (B, C, D), sodium bond (E), and gas plenum (F).
Figure 3.
EBR-II driver assembly [
1].
Figure 3.
EBR-II driver assembly [
1].
Figure 4.
SCALE full core model of the EBR-II. The inner driver core region (driver fuel in red, bond sodium in yellow, gas plenum in blue) is surrounded by a steel reflector (gray), which is surrounded by the blanket assemblies (purple). The green region shows absorber material in one of the control assemblies.
Figure 5.
Axial view of the EBR-II SCALE full core model, highlighting the different insertion heights of three half worth control rod (HWCR) assemblies.
Figure 5.
Axial view of the EBR-II SCALE full core model, highlighting the different insertion heights of three half worth control rod (HWCR) assemblies.
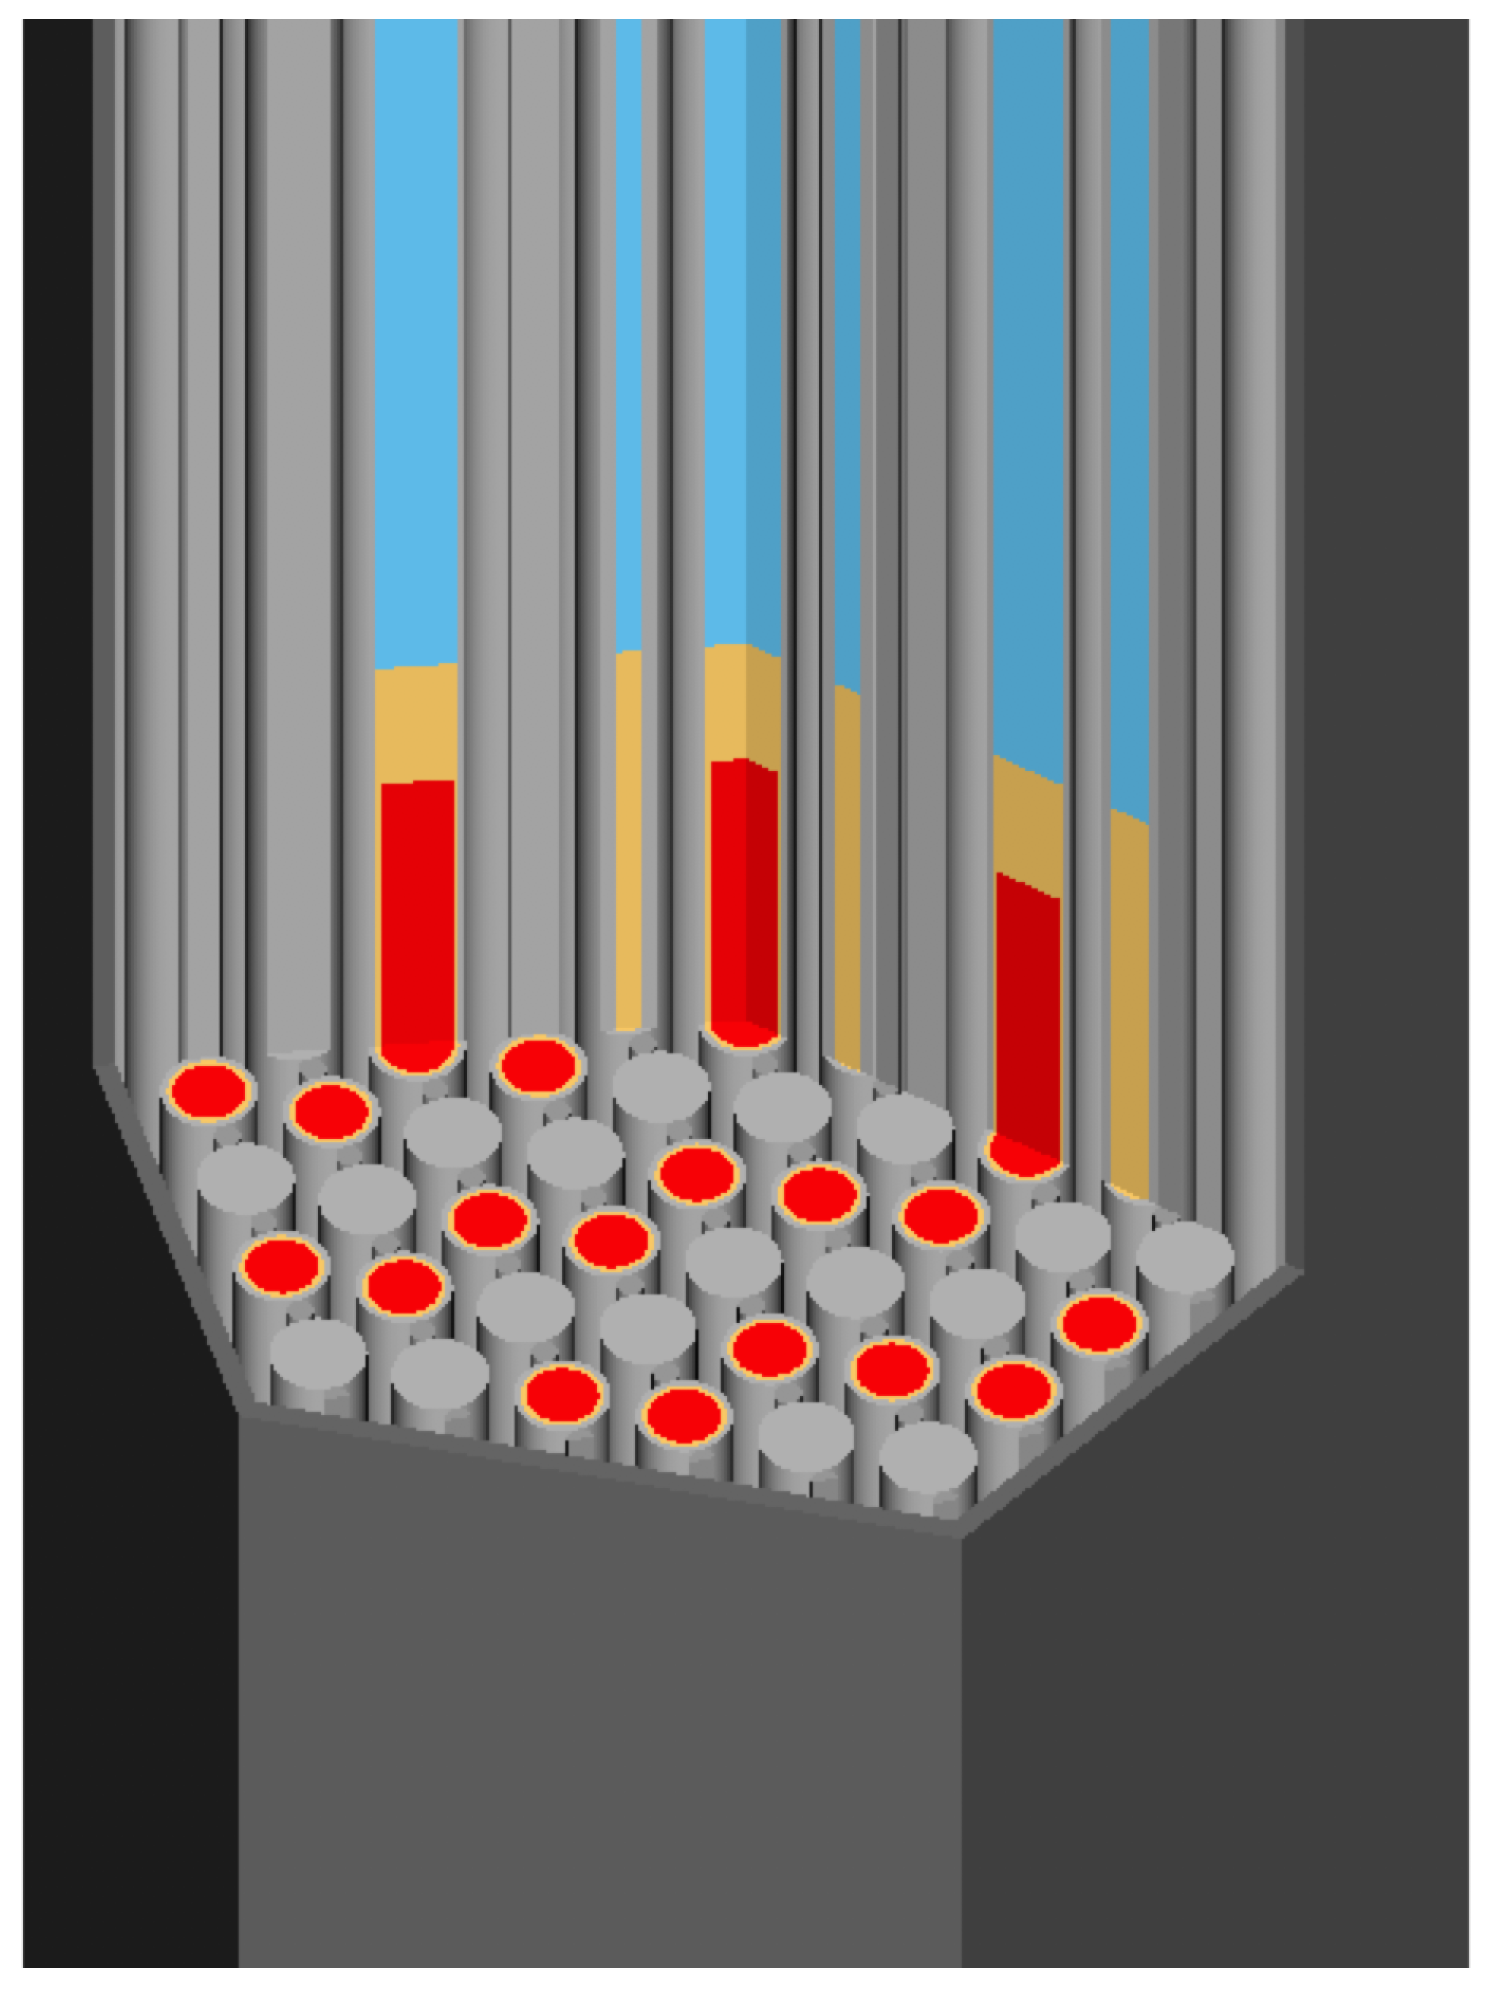
Figure 6.
SCALE half-worth driver assembly model of the EBR-II. The fuel (red) is located in every second rod, and the other rods (gray) are solid steel cylinders. Bond sodium in the fuel rods is displayed in yellow, and the gas plenum is shown in blue.
Figure 6.
SCALE half-worth driver assembly model of the EBR-II. The fuel (red) is located in every second rod, and the other rods (gray) are solid steel cylinders. Bond sodium in the fuel rods is displayed in yellow, and the gas plenum is shown in blue.
Figure 7.
Normalized neutron flux in a 302-group representation at the core axial mid line, at different radial positions determined with KENO-CE.
Figure 7.
Normalized neutron flux in a 302-group representation at the core axial mid line, at different radial positions determined with KENO-CE.
Figure 8.
KENO-MG radial power distribution (axially integrated assembly powers) using ENDF/B-VII.1 data. High power is visible in the central driver core region, whereas only very low power is observed in the outer blanket region. The power was normalized to yield an average inner driver assembly power of 1.
Figure 9.
KENO-MG statistical uncertainty of the axially integrated assembly powers using ENDF/B-VII.1 data.
Figure 9.
KENO-MG statistical uncertainty of the axially integrated assembly powers using ENDF/B-VII.1 data.
Figure 10.
Relative difference between the KENO-MG and KENO-CE calculation of the axially integrated assembly powers using ENDF/B-VII.1 data. Note the different range for the positive and negative parts of the color map.
Figure 10.
Relative difference between the KENO-MG and KENO-CE calculation of the axially integrated assembly powers using ENDF/B-VII.1 data. Note the different range for the positive and negative parts of the color map.
Figure 11.
Contributions to the output uncertainties (as obtained with TSUNAMI-CE in R/R, R: response).
Figure 11.
Contributions to the output uncertainties (as obtained with TSUNAMI-CE in R/R, R: response).
Figure 12.
Sampler/KENO-MG uncertainty of axially integrated assembly powers using ENDF/B-VII.1 data: whole core (top) and inner driver core (bottom). Note the different ranges of the color map for the two images.
Figure 12.
Sampler/KENO-MG uncertainty of axially integrated assembly powers using ENDF/B-VII.1 data: whole core (top) and inner driver core (bottom). Note the different ranges of the color map for the two images.
Figure 13.
Sampler/KENO-MG uncertainty of axially integrated assembly powers using ENDF/B-VIII.0 data: whole core (top) and inner driver core (bottom). Note the different ranges of the color map for the two images.
Figure 13.
Sampler/KENO-MG uncertainty of axially integrated assembly powers using ENDF/B-VIII.0 data: whole core (top) and inner driver core (bottom). Note the different ranges of the color map for the two images.
Figure 14.
Sampler/KENO-MG top contributor to the peak power uncertainty and to the 05E03 HWCR assembly power uncertainty in terms of R.
Figure 14.
Sampler/KENO-MG top contributor to the peak power uncertainty and to the 05E03 HWCR assembly power uncertainty in terms of R.
Table 1.
Key characteristics of EBR-II [
1].
Table 1.
Key characteristics of EBR-II [
1].
| Description | Value |
|---|
| Reactor power | 62.5 MWth |
| Fuel material | high enriched uranium metal |
| Coolant material | sodium |
| Major structural material | steel |
| Temperature of all materials (K) | 616 |
| Number of fuel assemblies in the core: | |
| Full worth | 70 |
| Half worth | 13 |
| Number of fuel pins per assembly | 91 |
| Number of depleted uranium blanket assemblies | 330 |
| Assembly pitch (cm) | 6.8877 |
| Outer fuel radius (cm) | 0.1651 |
| Outer cladding radius (cm) | 0.2210 |
| Inner cladding radius (cm) | 0.1905 |
| Fuel pin pitch (cm) | 0.566 |
| Active core height (cm) | 34.6075 |
Table 2.
KENO-CE EBR-II k results compared to the benchmark value and the MCNP-CE results.
Table 2.
KENO-CE EBR-II k results compared to the benchmark value and the MCNP-CE results.
| Case | Library | k | Benchmark k [pcm] |
|---|
| SCALE/KENO | ENDF/B-VII.1 | 1.00703 ± 0.00016 | −224 ± 618 |
| ENDF/B-VIII.0 | 1.00704 ± 0.00019 | −223 ± 618 |
| MCNP 6.1 (ORNL *) | ENDF/B-VII.0 | 1.01371 ± 0.00017 | 444 ± 618 |
| ENDF/B-VII.1 | 1.00952 ± 0.00020 | 25 ± 618 |
| MCNP 6.1.1 [1] | ENDF/B-VII.0 | 1.01169 ± 0.00005 | 242 ± 618 |
| Benchmark [1] | 1.00927 ± 0.00618 | (ref) |
Table 3.
Nominal values of quantities of interest determined with KENO-CE.
Table 3.
Nominal values of quantities of interest determined with KENO-CE.
| Quantity | ENDF/B-VII.1 | ENDF/B-VIII.0 | [pcm] |
|---|
| k | 1.00703 ± 0.00016 | 1.00704 ± 0.00019 | 1 ± 25 |
| CR worth [pcm] | 4728 ± 26 | 4728 ± 25 | 0 ± 36 |
| Na void [pcm] | −4651 ± 18 | −4681 ± 29 | −29 ± 34 |
Table 4.
k sensitivities obtained using direct perturbation compared to corresponding TSUNAMI results using ENDF/B-VII.1 data.
Table 4.
k sensitivities obtained using direct perturbation compared to corresponding TSUNAMI results using ENDF/B-VII.1 data.
| Material | Nuclide | TSUNAMI | Direct Perturbation | S (%) | S |
|---|
| Sensitivity | Sensitivity | R |
|---|
| Coolant | Na | 0.0449 ± 0.0007 | 0.0453 ± 0.0015 | 0.9944 | −1.0% | 0.28 |
| Reflector | Fe | 0.0349 ± 0.0017 | 0.0369 ± 0.0005 | 0.9977 | −5.5% | 1.13 |
| Steel in driver assemblies | Fe | 0.0192 ± 0.0008 | 0.0188 ± 0.0005 | 0.9958 | 1.7% | 0.35 |
| Reflector | Cr | 0.0154 ± 0.0003 | 0.0152 ± 0.0005 | 0.9973 | 1.5% | 0.36 |
| Absorber BC | B | −0.0095 ± 0.0001 | −0.0090 ± 0.0005 | 0.9279 | 5.4% | 0.93 |
| Fuel (assembly position 03C01) | U | 0.0033 ± 0.0001 | 0.0034 ± 0.0005 | 0.9266 | −2.3% | 0.15 |
Table 5.
EBR-II: top k sensitivities (top 10 positive and top 10 negative mixture-, region- and energy-integrated sensitivities, determined with TSUNAMI-CE using ENDF/B-VII.1 data).
Table 5.
EBR-II: top k sensitivities (top 10 positive and top 10 negative mixture-, region- and energy-integrated sensitivities, determined with TSUNAMI-CE using ENDF/B-VII.1 data).
| Nuclide | Reaction | Sensitivity (Increasing k) | Nuclide | Reaction | Sensitivity (Decreasing k) |
|---|
| U | | 9.537e-01 ± 5.591e-05 | U | n, | −8.695e-02 ± 3.010e-05 |
| U | fission | 5.486e-01 ± 1.086e-04 | U | n, | −3.966e-02 ± 2.076e-05 |
| Fe | elastic | 6.762e-02 ± 2.669e-03 | Fe | n, | −1.685e-02 ± 1.265e-05 |
| Na | elastic | 5.407e-02 ± 1.208e-03 | B | n, | −9.555e-03 ± 1.340e-05 |
| Cr | elastic | 3.480e-02 ± 6.083e-04 | Ni | n, | −5.420e-03 ± 3.072e-06 |
| U | | 3.469e-02 ± 5.355e-05 | Cr | n, | −3.634e-03 ± 4.483e-06 |
| U | fission | 2.210e-02 ± 5.359e-05 | Ni | n,p | −2.952e-03 ± 1.940e-06 |
| Ni | elastic | 1.837e-02 ± 6.585e-04 | Mn | n, | −2.717e-03 ± 2.584e-06 |
| U | elastic | 1.653e-02 ± 5.665e-04 | Fe | n, | −2.176e-03 ± 1.330e-06 |
| Fe | n,n’ | 1.309e-02 ± 1.491e-04 | Cr | n, | −2.135e-03 ± 1.919e-06 |
Table 6.
EBR-II: top control rod worth sensitivities (reactivity difference between all controls fully inserted and all controls fully withdrawn *, = 4728 ± 25 pcm; top 10 positive and top 10 negative mixture-, region- and energy-integrated sensitivities, determined with TSUNAMI-CE using ENDF/B-VII.1 data).
| Nuclide | Reaction | Sensitivity (Increasing ) | Nuclide | Reaction | Sensitivity (Reducing ) |
|---|
| B | n, | 4.262e-01 ± 4.564e-04 | U | | −9.493e-01 ± 1.680e-03 |
| U | n, | 5.357e-02 ± 8.876e-04 | U | fission | −9.320e-01 ± 3.148e-03 |
| Fe | n, | 5.356e-02 ± 3.804e-04 | Fe | elastic | −9.565e-02 ± 8.242e-02 |
| U | n, | 3.144e-02 ± 6.463e-04 | Cr | elastic | −3.683e-02 ± 1.718e-02 |
| U | n,n’ | 2.857e-02 ± 3.657e-03 | Ni | elastic | −3.680e-02 ± 2.229e-02 |
| U | n,n’ | 2.204e-02 ± 4.350e-03 | U | elastic | −3.379e-02 ± 1.720e-02 |
| Mn | n, | 1.442e-02 ± 9.126e-05 | U | fission | −2.808e-02 ± 1.532e-03 |
| Ni | n, | 1.321e-02 ± 7.568e-05 | B | elastic | −2.653e-02 ± 2.908e-03 |
| Cr | n, | 1.102e-02 ± 1.262e-04 | U | | −2.603e-02 ± 1.519e-03 |
| Cr | n, | 8.054e-03 ± 5.581e-05 | Pu | | −2.314e-02 ± 7.302e-04 |
Table 7.
EBR-II: top sodium void worth sensitivities (all sodium removed, = −4681 ± 29 pcm; top 10 positive and top 10 negative mixture-, region- and energy-integrated sensitivities, determined with TSUNAMI-CE using ENDF/B-VII.1 data).
Table 7.
EBR-II: top sodium void worth sensitivities (all sodium removed, = −4681 ± 29 pcm; top 10 positive and top 10 negative mixture-, region- and energy-integrated sensitivities, determined with TSUNAMI-CE using ENDF/B-VII.1 data).
| Nuclide | Reaction | Sensitivity (Reducing Negative ) | Nuclide | Reaction | Sensitivity (Increasing Negative ) |
|---|
| U | fission | 9.829e-01 ± 2.171e-03 | Na | elastic | −7.047e-01 ± 2.672e-02 |
| U | | 8.492e-01 ± 1.241e-03 | Na | n,n’ | −6.572e-02 ± 2.099e-03 |
| Fe | elastic | 2.336e-01 ± 6.374e-02 | Fe | n, | −1.655e-02 ± 2.909e-04 |
| U | | 1.143e-01 ± 1.106e-03 | U | n, | −9.823e-03 ± 4.789e-04 |
| U | n, | 1.128e-01 ± 6.320e-04 | Ni | n,p | −9.340e-03 ± 4.690e-05 |
| Cr | elastic | 9.926e-02 ± 1.268e-02 | Ni | n, | −4.537e-03 ± 5.656e-05 |
| U | elastic | 8.745e-02 ± 1.279e-02 | Fe | n,p | −3.900e-03 ± 2.127e-05 |
| U | fission | 8.563e-02 ± 1.108e-03 | Cr | n, | −3.288e-03 ± 9.066e-05 |
| Ni | elastic | 8.351e-02 ± 1.781e-02 | Fe | n, | −2.901e-03 ± 2.811e-05 |
| Fe | elastic | 5.294e-02 ± 8.601e-03 | Ni | n, | −1.665e-03 ± 2.070e-05 |
Table 8.
Uncertainties determined with TSUNAMI-CE.
Table 8.
Uncertainties determined with TSUNAMI-CE.
| Quantity | ENDF/B-VII.1 | ENDF/B-VIII.0 | |
|---|
| k | 2.16% | 1.01% | −53.0% |
| CR worth | 1.18% | 1.26% | 6.8% |
| Na void | 5.15% | 4.21% | −18.3% |
Table 9.
Power uncertainties determined with Sampler/KENO-MG.
Table 9.
Power uncertainties determined with Sampler/KENO-MG.
| Quantity | ENDF/B-VII.1 | ENDF/B-VIII.0 |
|---|
| Power uncertainty in outer blanket zone | 3.293–7.049% | 1.739–5.255% |
| Power uncertainty in inner driver zone | 0.147–1.496% | 0.128–0.976% |
| Radial peak power uncertainty | 0.343% | 0.335% |
| Publisher’s Note: MDPI stays neutral with regard to jurisdictional claims in published maps and institutional affiliations. |
© 2021 by the authors. Licensee MDPI, Basel, Switzerland. This article is an open access article distributed under the terms and conditions of the Creative Commons Attribution (CC BY) license (https://creativecommons.org/licenses/by/4.0/).


