Article

Techno-Economic Evaluation of Scalable and Sustainable Hydrogen Production Using an Innovative Molten-Phase Reactor

1
Department of Engineering, Durham University, Durham DH1 3LE, UK
2
Centre for E-Mobility and Clean Growth, Coventry University, Coventry CV1 5FB, UK
3
Shell Global Solutions (UK), Shell Centre, York Road, London SE1 7NA, UK
*
Author to whom correspondence should be addressed.
Hydrogen 2025, 6(3), 66; https://doi.org/10.3390/hydrogen6030066
Submission received: 27 May 2025 / Revised: 22 July 2025 / Accepted: 7 August 2025 / Published: 5 September 2025

Abstract

The transition to low-carbon energy systems requires efficient hydrogen production methods that minimise CO2 emissions. This study presents a techno-economic assessment of hydrogen production via methane pyrolysis, utilising a novel liquid metal bubble column reactor (LMBCR) designed for CO2-free hydrogen and solid carbon outputs. Operating at 20 bar and 1100 °C, the reactor employs a molten nickel-bismuth alloy as both catalyst and heat transfer medium, alongside a sodium bromide layer to enhance carbon purity and facilitate separation. Four operational scenarios were modelled, comparing various heating and recycling configurations to optimise hydrogen yield and process economics. Results indicate that the levelised cost of hydrogen (LCOH) is highly sensitive to methane and electricity prices, CO2 taxation, and the value of carbon by-products. Two reactor configurations demonstrate competitive LCOHs of 1.29 $/kgH2 and 1.53 $/kgH2, highlighting methane pyrolysis as a viable low-carbon alternative to steam methane reforming (SMR) with carbon capture and storage (CCS). This analysis underscores the potential of methane pyrolysis for scalable, economically viable hydrogen production under specificmarket conditions.

1. Introduction

Over the last 160 years, temperatures have risen 1.4 °C as a direct result of drastically increased levels of atmospheric CO2, which acts as a greenhouse gas (GHG) [1,2]. Over 90% of this increase can be directly attributed to the combustion of fossil fuels, which produces CO2 with heat and water and has been the primary energy source globally for two centuries [3]. The energy sector accounts for roughly two-thirds of all GHG emissions, so to meet rising global energy demands as the population grows and keep global temperatures below 2 °C rise from pre-industrial levels as per the Paris Agreement, sustainable and CO2-neutral energy sources must be researched and developed [4].
Progress has recently been made in the production of hydrogen as an alternative fuel, with a view to providing energy for transportation and industry and to be used in high-energy-conversion-efficiency hydrogen fuel cells [5]. The global hydrogen production market was valued at US$ 136 billion in 2021 and is expected to reach US$ 219 billion by 2030 [6]. Hydrogen is seen as a possible way of fuelling vehicles via fuel cells. Hydrogen fuel cell vehicles are often considered advantageous over battery-electric vehicles for certain applications due to their faster refuelling times and compatibility with existing fuelling infrastructure. These characteristics make hydrogen particularly attractive for heavy-duty transport sectors such as trucks, buses, and trains, where the large battery capacity required for long-range travel could be logistically and economically prohibitive [7].

1.1. Conventional Hydrogen Production

Over 95% of hydrogen produced today is made using technologies reliant on fossil fuels, of which the most prevalent processes are CO/CO2 emitting [8]. Around 50% is made by steam methane reforming (SMR), which, although favourable since it produces four moles of hydrogen per one mole of methane, also produces one mole of CO2, as per Equation (1). The GHG emissions generated by these processes vastly offset hydrogen’s environmental benefits.
C H 4 ( g ) + 2 H 2 O ( l ) C O 2 ( g ) + 4 H 2 ( g )
Δ H n e t 0 = 253 k J / m o l C H 4
Water electrolysis, known as ‘green hydrogen’, accounts for 4% of hydrogen production [9] and is the most established renewable energy alternative if powered by electricity derived from renewable sources. However, hydrogen produced by electrolysis is 2–3.5 times more expensive: between 3.00 $/kg and 6.55 $/kg, compared to fossil-based hydrogen around 1.80 $/kg [10]. Although the cost of electrolysis is likely to decrease in line with the price of renewable electricity, the lower production costs of conventional fossil fuel technologies will likely continue to make them much more attractive [11].

1.2. Methane Pyrolysis

Methane pyrolysis is the thermal decomposition of methane into two moles of hydrogen and one mole of solid carbon, shown in Equation (2). Since oxygen is not present in the reaction, carbon oxides cannot form, and thus there are no direct CO2 emissions from the process, putting methane pyrolysis at an advantage over other fossil-fuel-based technologies.
C H 4 ( g ) 2 H 2 ( g ) + C ( s )
Δ H n e t 0 = 75 k J / m o l C H 4
Purely thermal methods of methane cracking have been found to be economically uncompetitive due to high heat demands, requiring temperatures up to 1500 °C [12]. Catalytic cracking, however, can be achieved with high methane conversion rates at temperatures around 1000 °C. Although solid metal and carbon catalysts have both been found to deactivate after a short period as a result of the carbon deposits formed during the reaction [13], molten alloys of transition and low-reactivity metals have been found to both maintain high conversion rates and act as an effective heat transfer fluid.
Upham et al. [14] compared the catalytic activity of various melts, reporting that a nickel-bismuth alloy was most favourable. A mole composition of Ni0.17Bi0.83 had the highest rate of hydrogen production, while Ni0.27Bi0.73 achieved the highest methane conversion rate of 95% at 1065 °C.
Despite favourable conversion, Upham’s group found the recovered carbon purity to be only 61 wt %. This resulted in substantial metal loss from the reactor and rendered the carbon product unacceptable for sale in the market. A molten salt layer with lower density than the molten metal was thus proposed to sit above, to decrease metal impurities in the carbon and aid its separation from the liquid melt. Rahimi et al. [15] found the addition of molten bromide salts to bubble column reactors containing Ni0.27Bi0.73 to produce a carbon product with less than 0.1 wt % metal contaminants. Spectroscopy revealed nanotube-like structures within the recovered carbon.

1.3. Novelty of the Present Work

Thermodynamic and techno-economic analysis was conducted on a pyrolysis reactor that has been designed, capable of producing 200 kta−1 hydrogen. It utilises a molten nickel-bismuth (NiBi) alloy as a catalyst. Operating conditions were modelled, and optimal values were recommended. A molten sodium-bromide (NaBr) salt layer has been selected to overcome issues with low carbon product purity and to ease its removal from the reactor.

2. Methodology and Setup

2.1. Design Concept and Case Scenarios

A 200 kta−1 H2 plant was designed and modelled in ASPEN PLUS chemical engineering software with multiple case scenarios considered. Table 1 defines the conditions common to all scenarios, including the reactor conditions as recommended by the study.
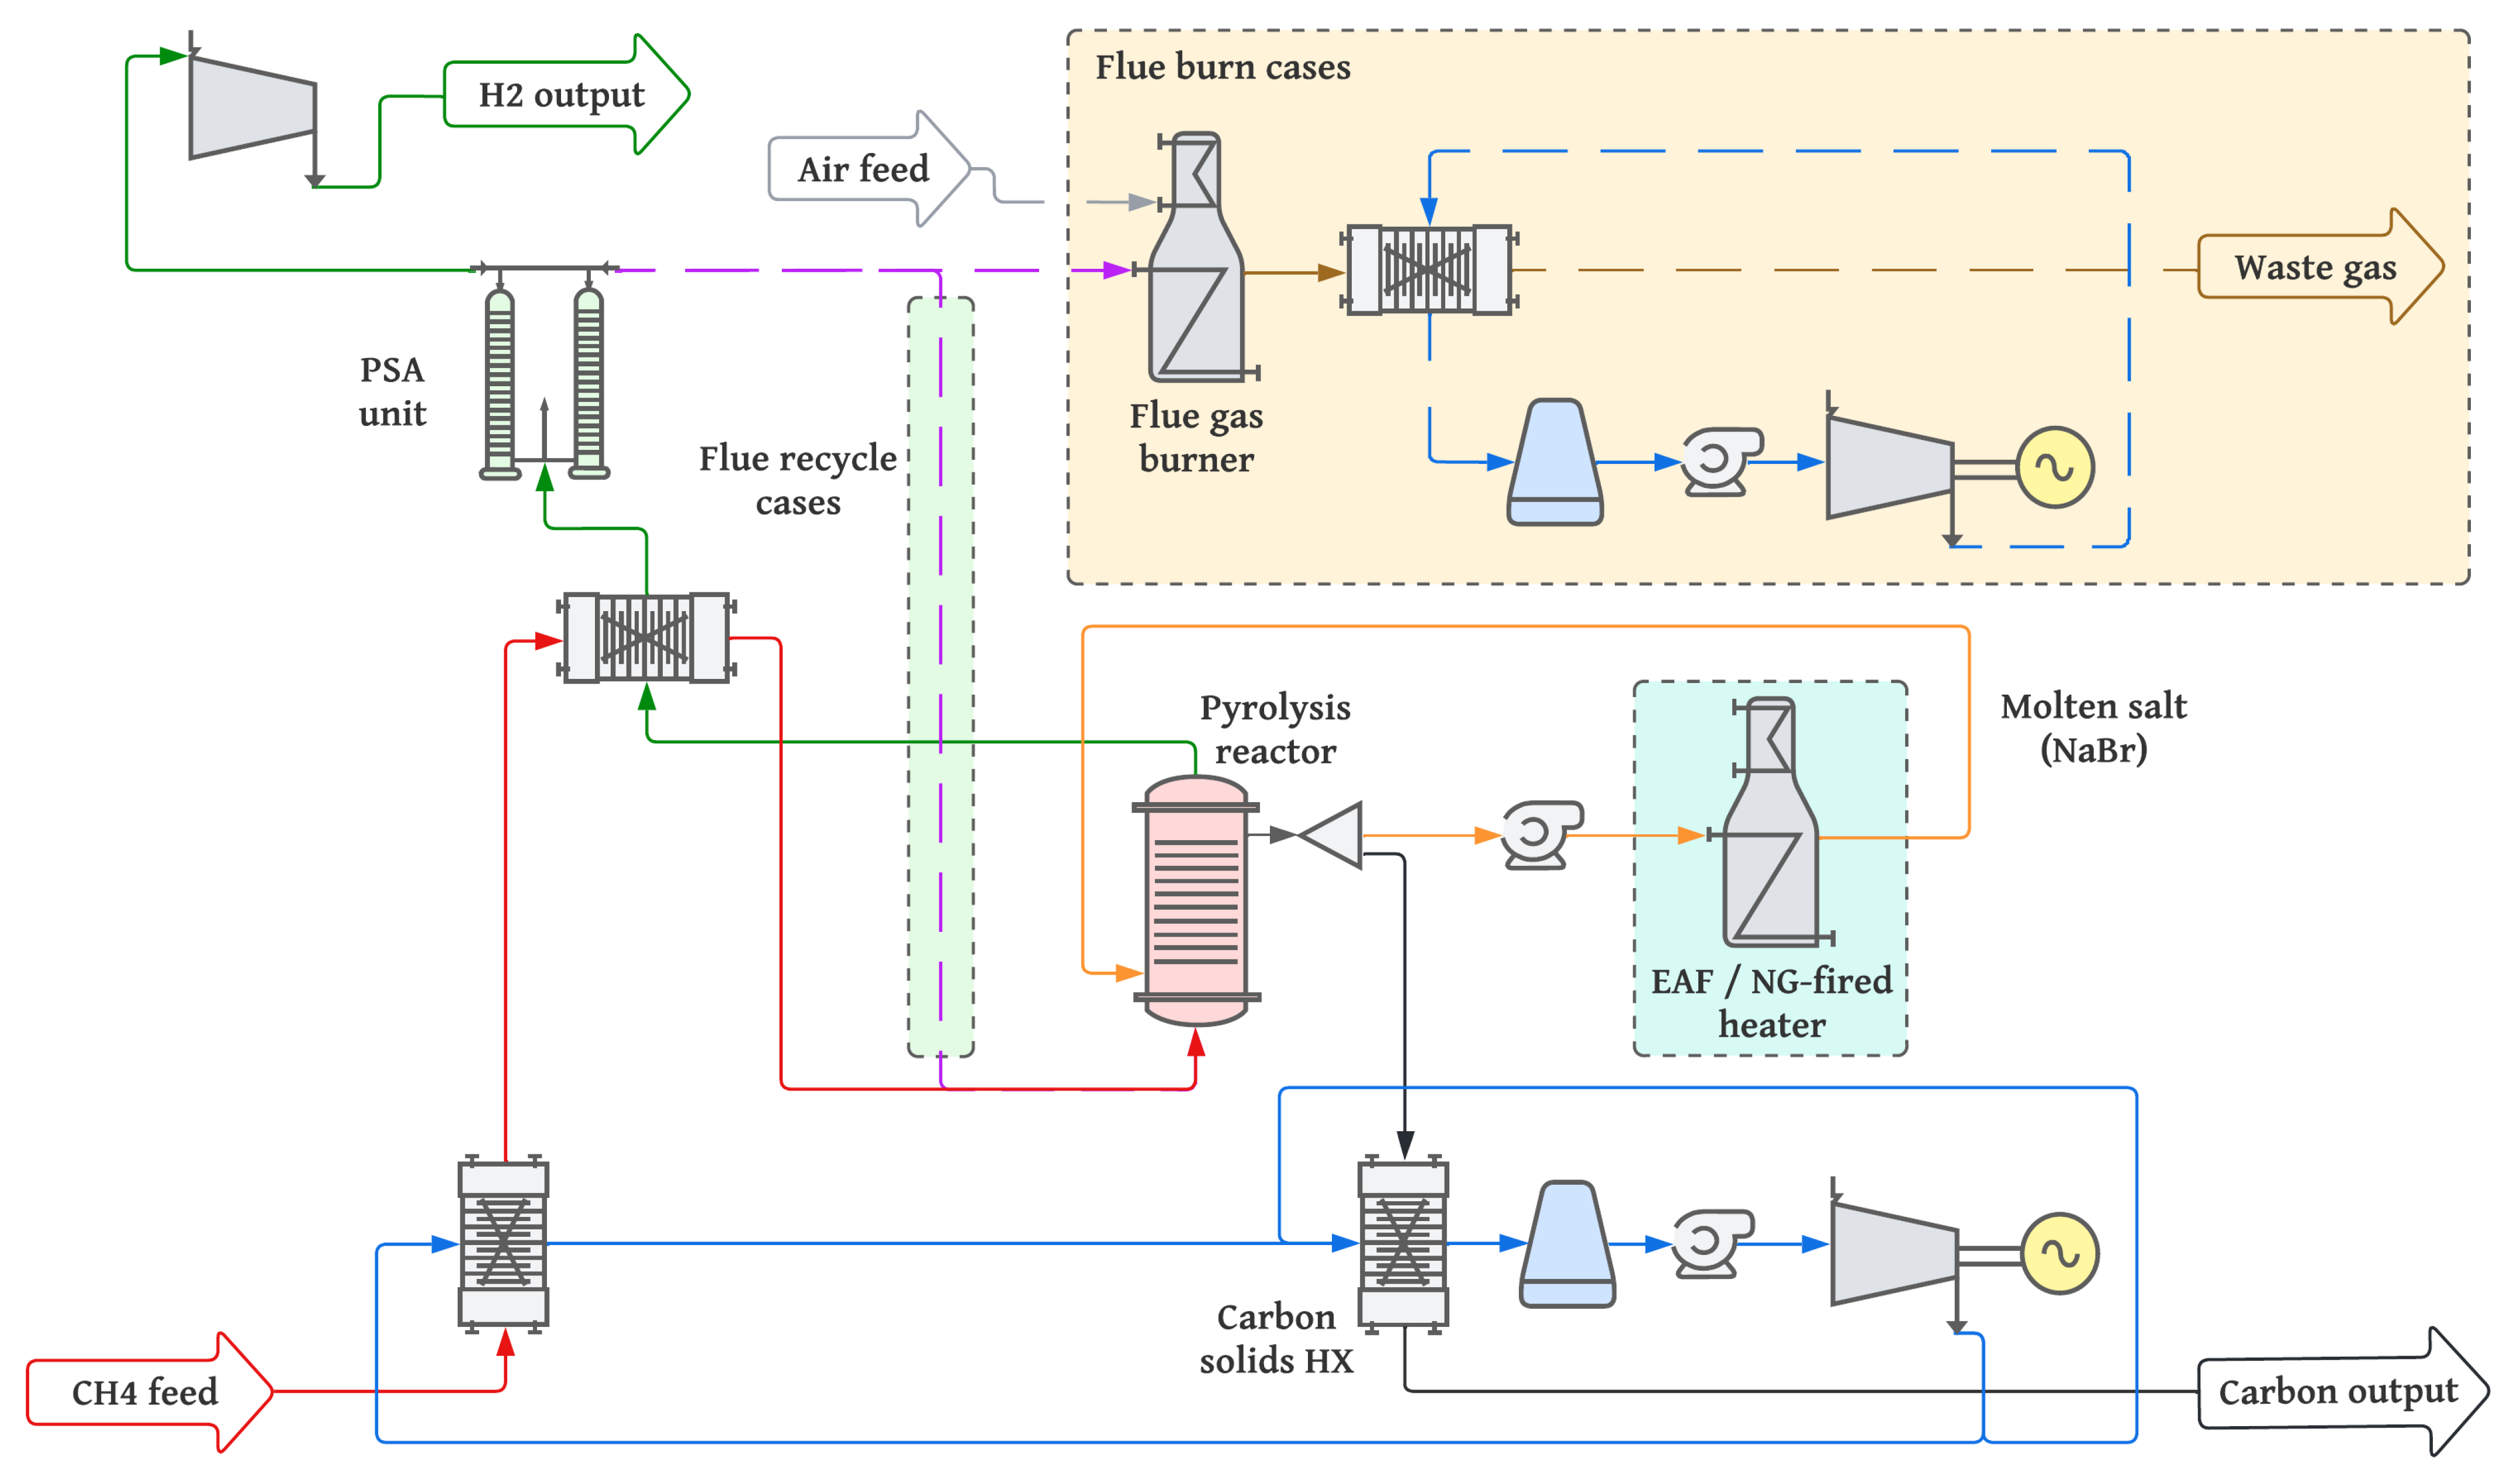
A simplified process flowsheet is shown in Figure 1, with case-specific elements enclosed within dashed boxes. A performer is incorporated to process natural gas feedstock, removing impurities and ensuring a consistent CH4 supply to the reactor. Preheated methane enters the pyrolysis reactor, which itself is provided heat by molten salt as the heat transfer fluid (HTF), chosen for its comparatively low cost and ability to be pumped at high temperatures. The molten salt is heated either by a natural gas-fired heater or an electric arc furnace (EAF). Sodium bromide has been specified for its low wettability to the carbon product and relatively cheap cost [15].
The hydrogen product leaves the reactor and is separated from any unreacted methane through a pressure swing adsorption (PSA) unit, producing 99.999% purity H2 [16]. The purge gas, primarily unreacted CH4, is then either recycled back into the reactor or burnt to produce heat that raises steam for electricity generation. This auxiliary steam cycle is shown in the yellow box in Figure 1. Another smaller steam cycle recovers heat from the carbon product.
For the simplification of stoichiometric modelling and reaction kinetics, pure CH4 has been modelled as the feedstock rather than natural gas. It can be assumed that natural gas would not lower the reaction rates specified in Section 2.3, since the longer hydrocarbons would more readily decompose.
Four case scenarios for the plant operation have been considered, allowing direct comparison between two heating methods: natural gas-fired heater and electric arc furnace; and whether to burn or recycle flue gases leaving the pyrolysis chamber.
  • Case 1: Natural gas-fired heater with flue gas burn
  • Case 2: Electric arc furnace with flue gas burn
  • Case 3: Natural gas-fired heater with recycling of the flue gases
  • Case 4: Electric arc furnace with recycling of the flue gases

2.2. Reactor Design

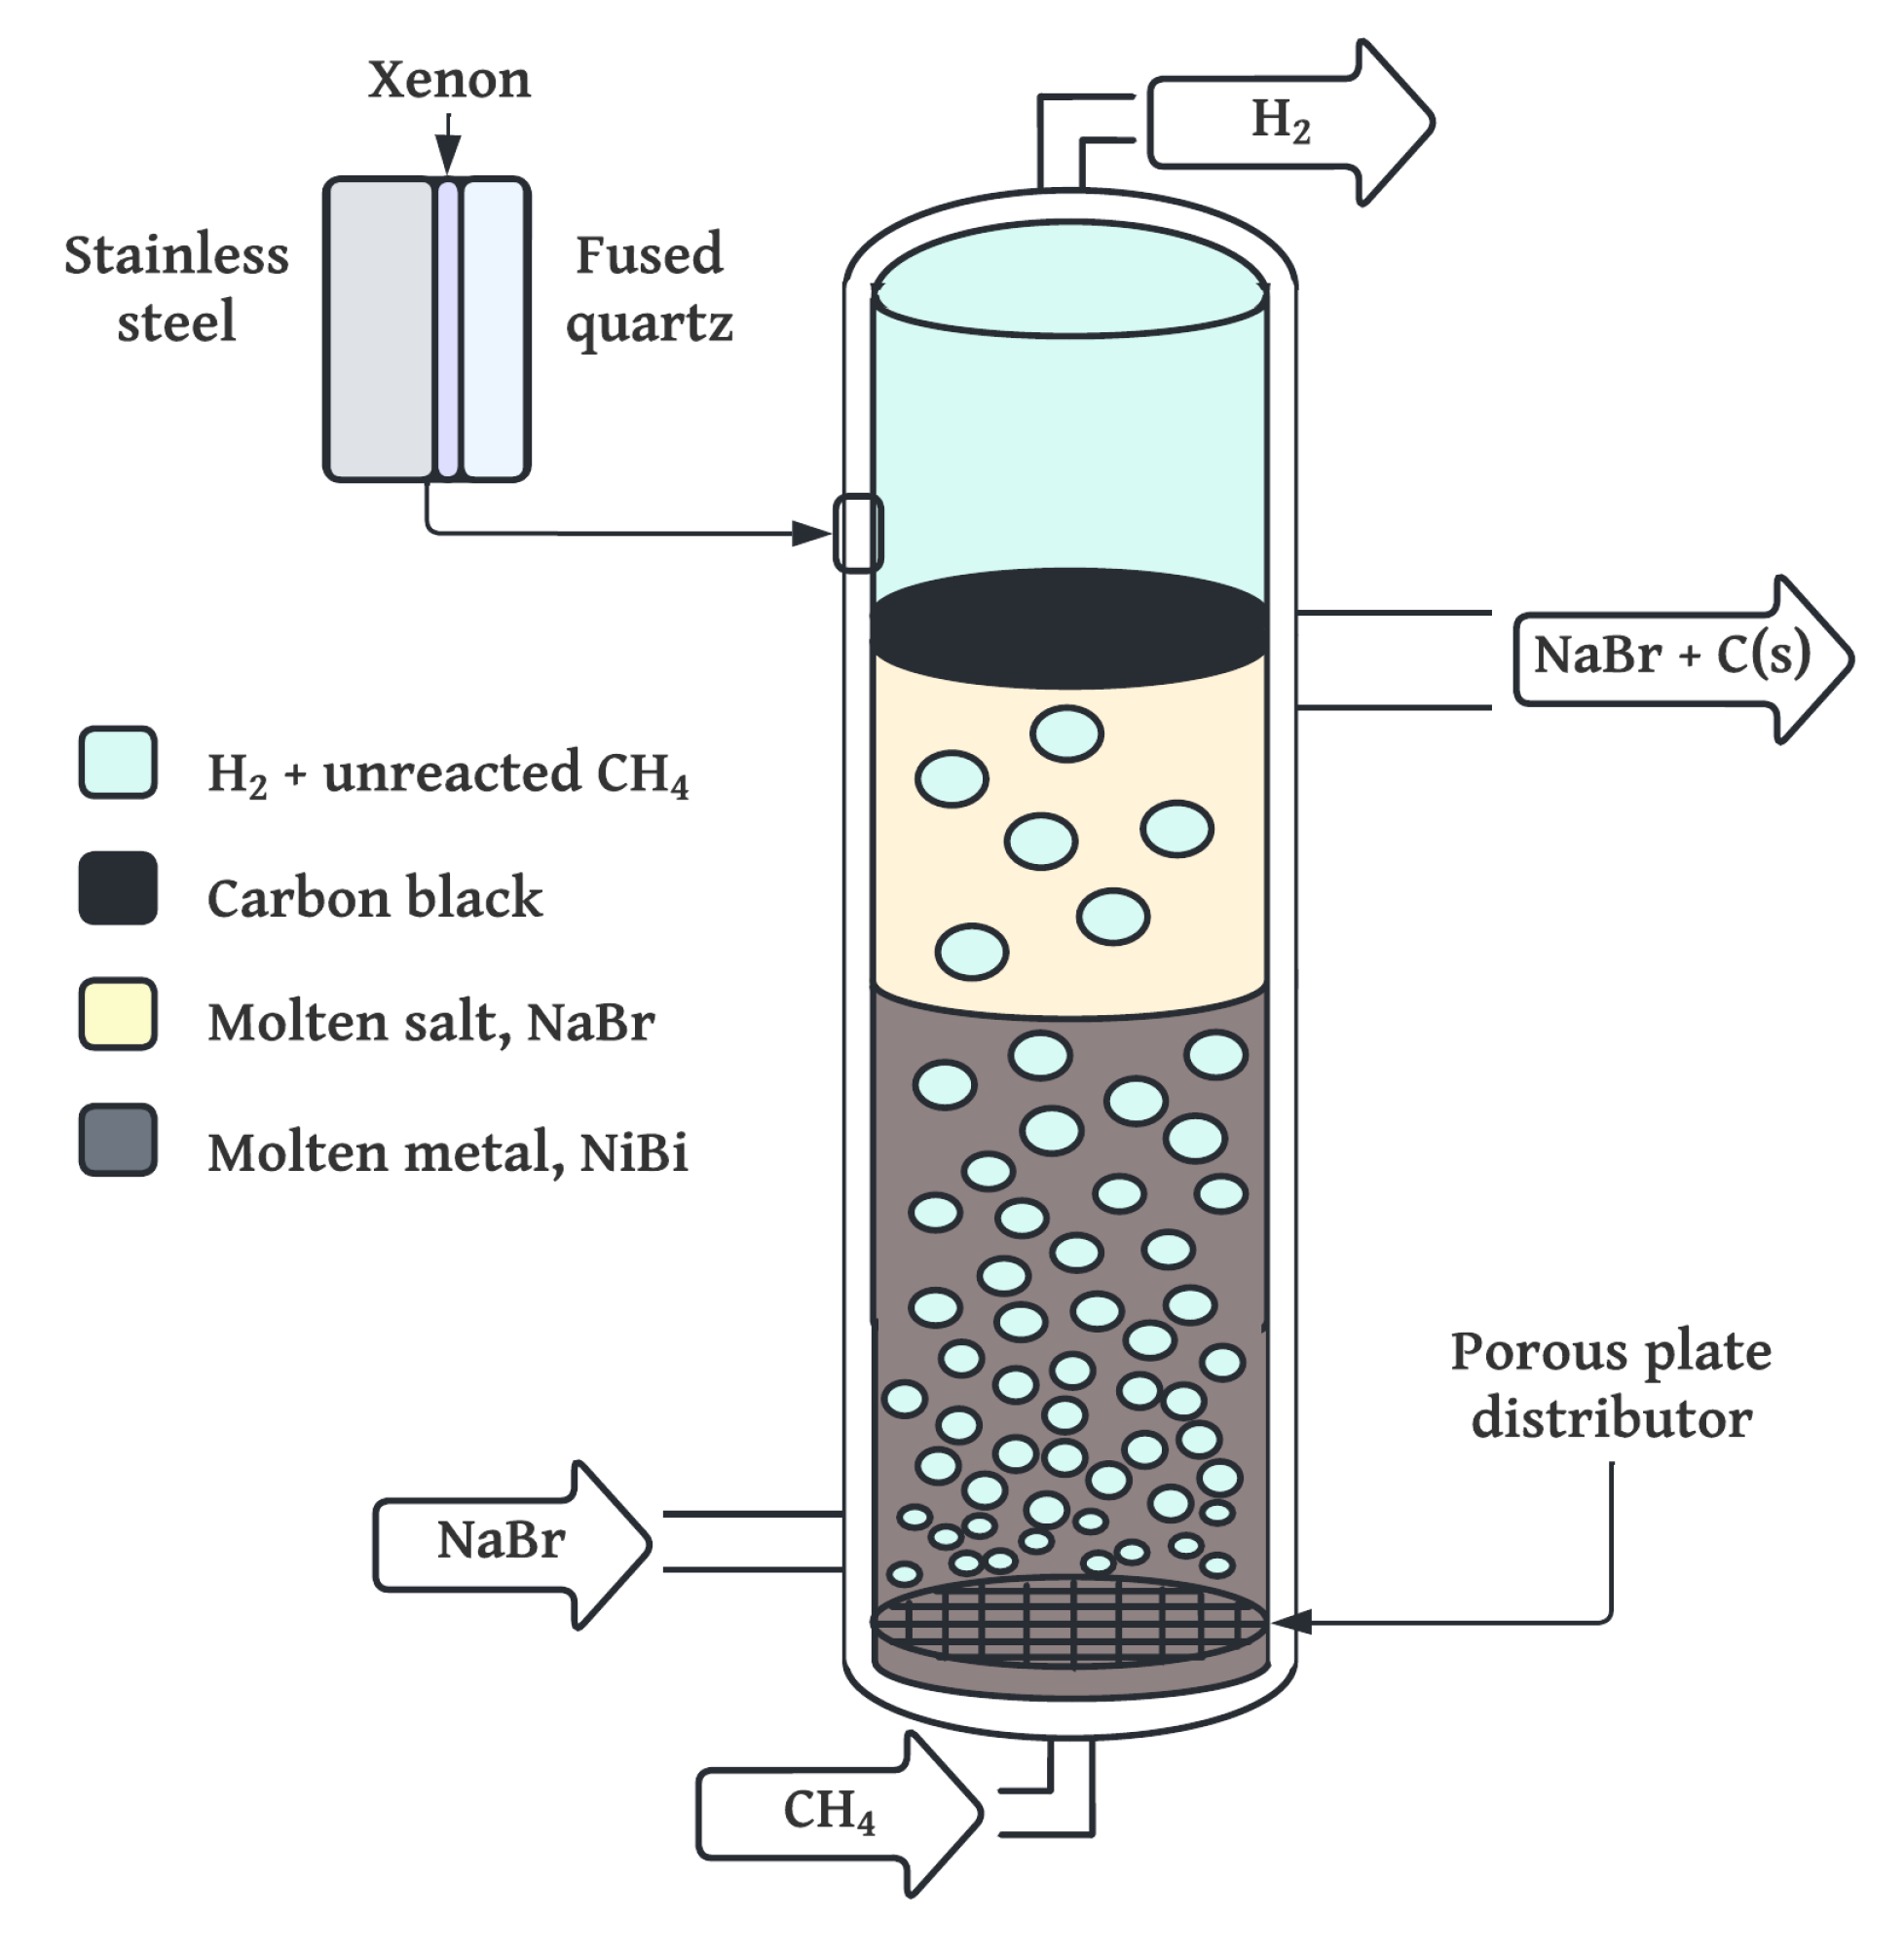
The reactor design for this study employs a liquid metal bubble column reactor (LMBCR), which facilitates efficient methane pyrolysis for hydrogen production without CO2 emissions. This reactor is configured with a dual-layer structure: a molten nickel-bismuth (Ni-Bi) alloy layer serving as the catalyst and a sodium-bromide (NaBr) layer functioning as both a heat transfer fluid and a carbon separation medium. The innovative combination of these molten layers addresses the issues associated with traditional solid catalysts, particularly deactivation from carbon deposition, while enabling continuous hydrogen production.
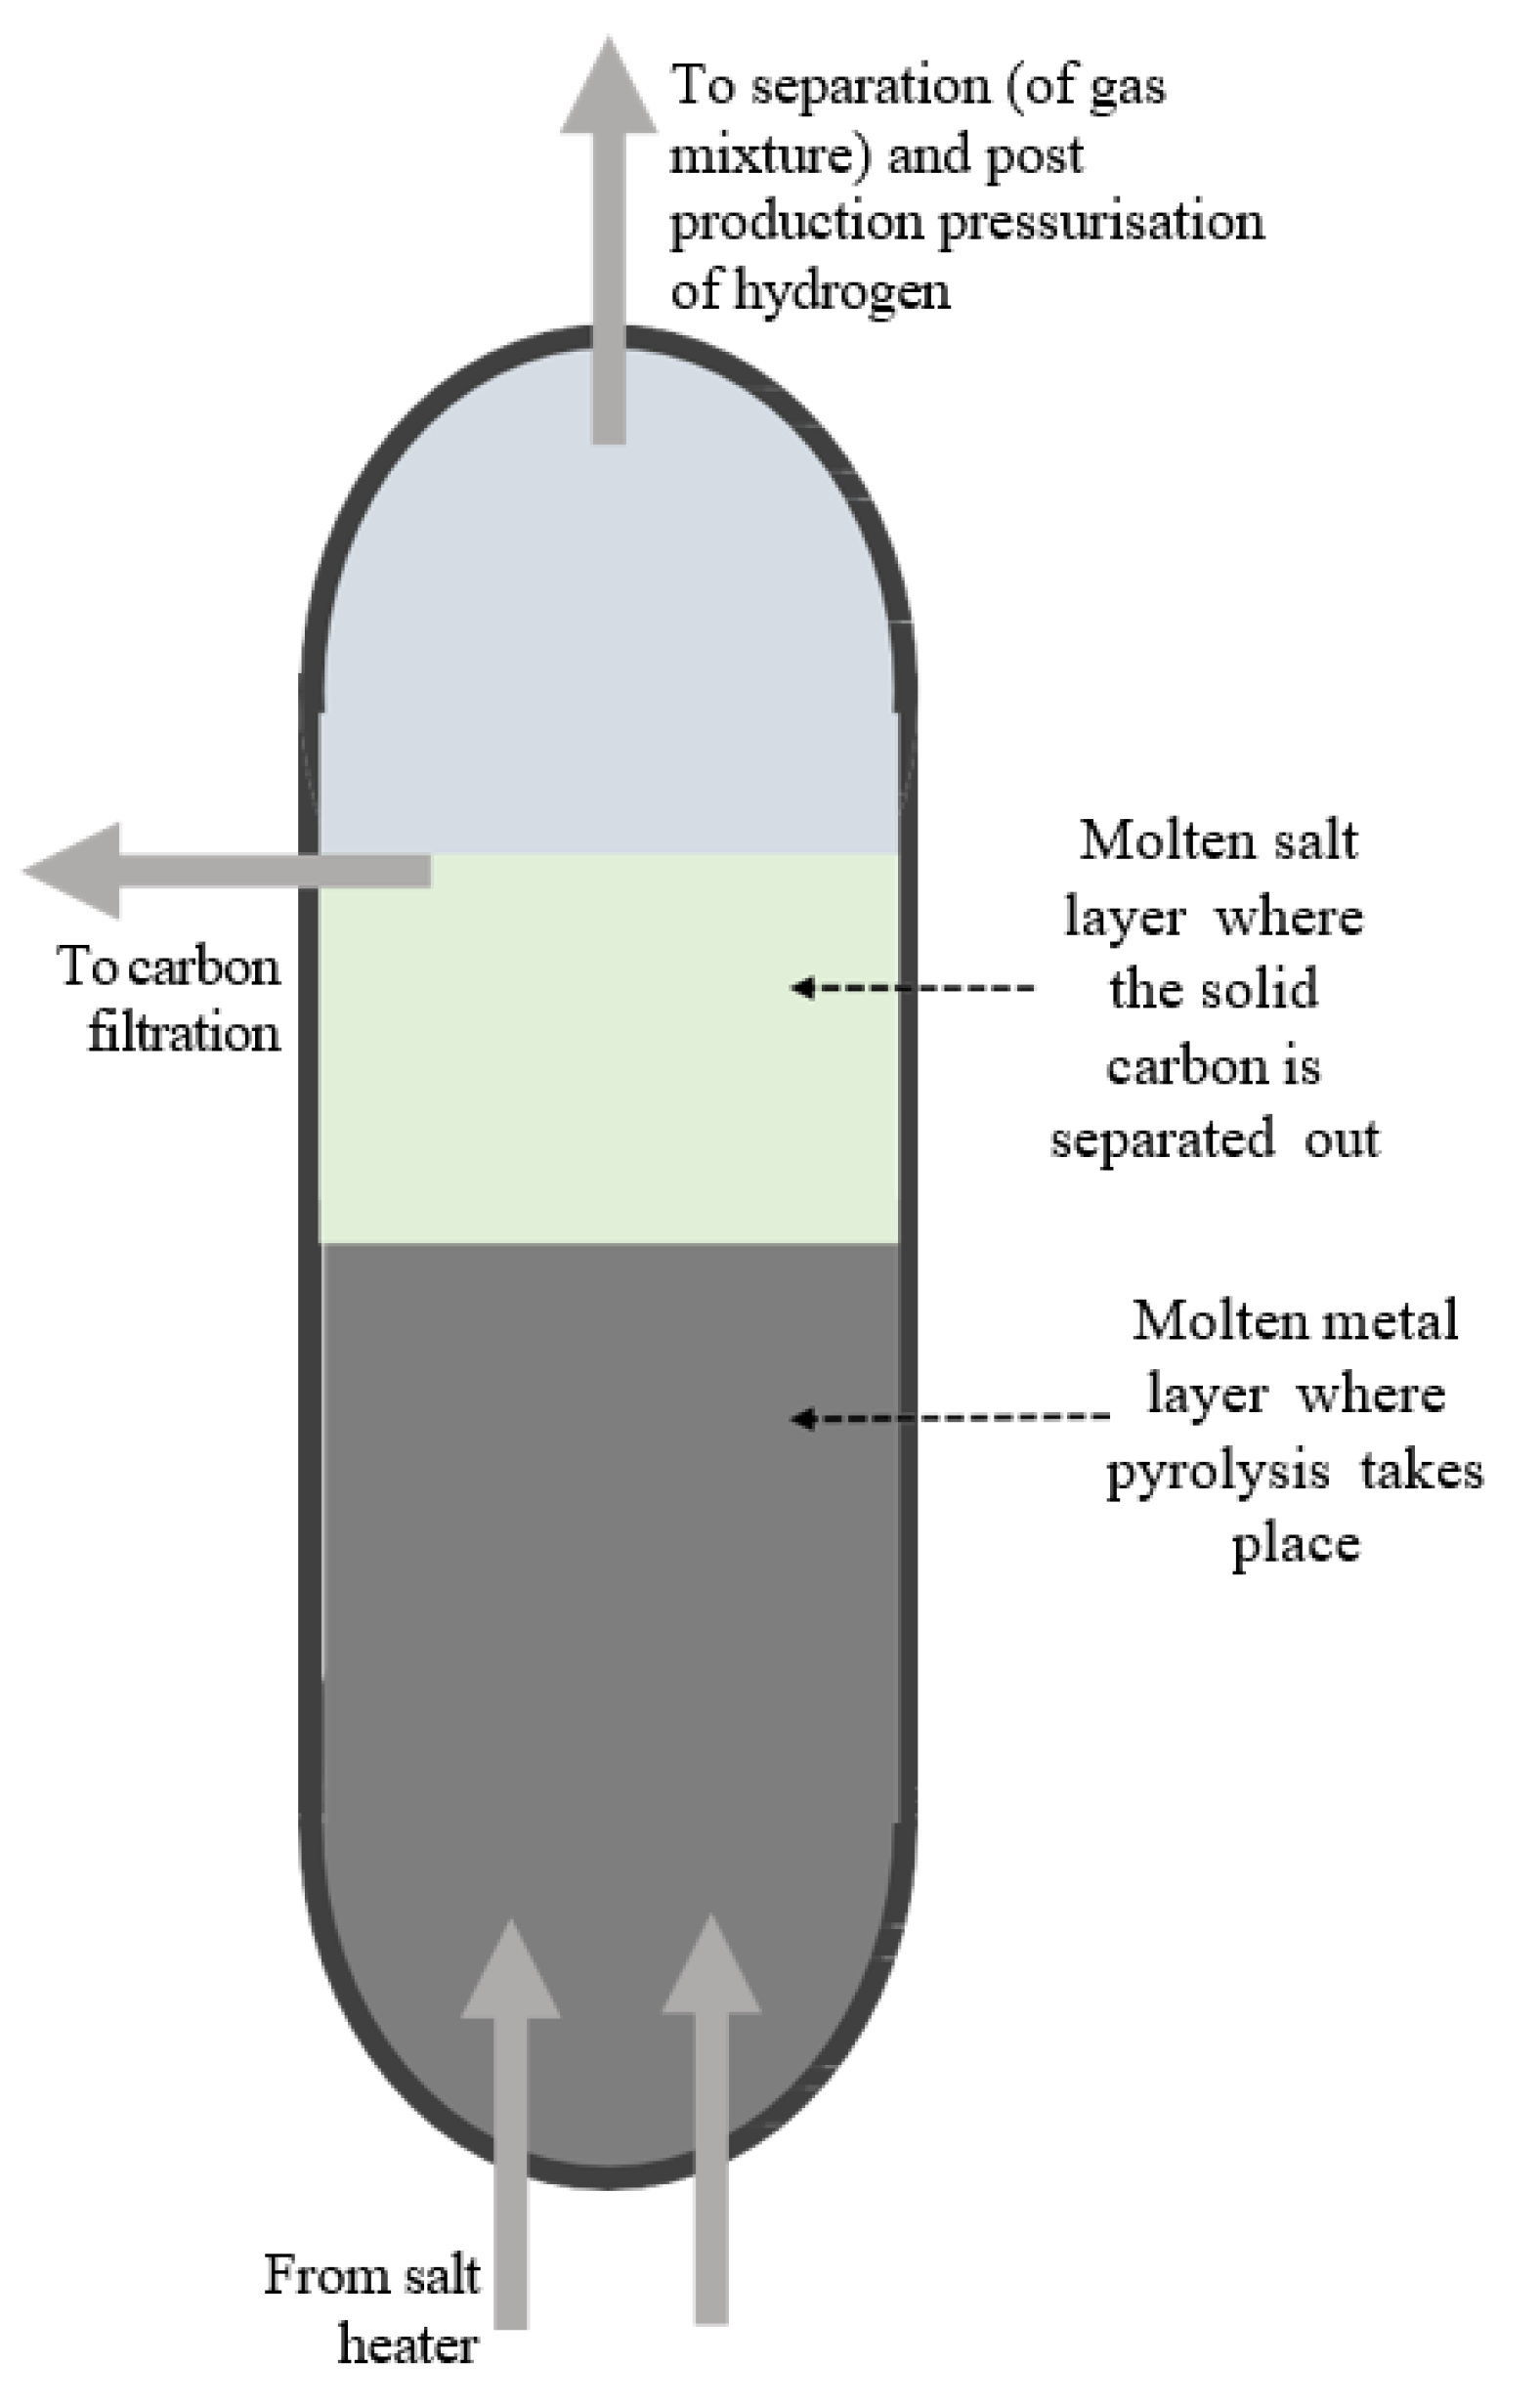
Figure 2 provides a simplified process flowsheet, illustrating the overall methane pyrolysis system. This flowsheet includes methane feed, hydrogen and carbon product separation, and purification steps, situating the reactor within the larger production process.

2.2.1. Reactor Structure and Materials

The reactor chamber is engineered to maintain high-pressure and high-temperature conditions, essential for effective methane pyrolysis. The chamber consists of a 50 mm thick electrically fused quartz lining for thermal insulation, supported by an outer 95 mm AISI 310 stainless steel shell, chosen for its resilience under sustained high temperatures and corrosive environments. To prevent thermal stress and expansion-related issues, a 5 mm xenon gas layer at 500 bar pressure is situated between the quartz lining and steel shell. The 500-bar xenon gas layer provides thermal buffering and prevents creep in the quartz lining, enhancing durability under prolonged high-temperature operation. This arrangement allows for controlled thermal expansion, ensuring stability throughout extended operational periods.
Research to determine ideal pressures and temperatures for the pyrolysis reactor to optimise methane conversion revealed that due to equilibrium conversion, high temperatures, greater than 1000 °C and pressures below 35 bar are desirable [9]. Strain temperature of the reactor’s quartz lining would undergo creep at temperatures greater than 1120 °C. For this reason, a slightly lower reactor temperature of 1100 °C was chosen. Given the temperature limitation, a high reactor inlet pressure of 20 bar was chosen to reduce the reactor volume while allowing a high methane conversion of approximately 90% to be achieved [9].
Although the nominal reactor operating temperature is maintained at 1100 °C, just below the quartz lining’s critical creep threshold of 1120 °C localised turbulent fluctuations in gas and molten media could temporarily raise wall temperatures. To mitigate this risk, the reactor design incorporates distributed methane injection and indirect external heating, promoting laminar gas flow near the wall and reducing peak thermal gradients. Thermal insulation and the buffering effect of the molten salt layer also help to stabilise wall temperature. Preliminary CFD analysis suggests that local fluctuations remain within ±10 °C, ensuring the structural integrity and long-term thermal stability of the quartz lining.
The reactor’s total volume is approximately 41.3 m3, partitioned as follows: 50% is occupied by the molten Ni-Bi alloy, 25% by the NaBr layer, and the remaining 25% is reserved for gas holdup [14]. This volume distribution is critical for balancing the thermal and catalytic requirements of the pyrolysis process. The pore size of the porous plate distributor is 200 µm, selected to ensure optimal methane bubbling and uniform dispersion in the molten Ni-Bi alloy. This pore size is not directly related to the NaBr layer properties but is optimised for efficient gas distribution and catalytic reaction. Methane enters the reactor through a porous plate distributor positioned at the reactor’s base, maximising surface contact between the gas and the molten metal for optimal methane conversion as the bubbles rise.
Figure 3 illustrates the reactor’s structural layout and spatial distribution of its components, offering a clear visual of the molten metal, salt, and gas phases.
While nickel-bismuth (Ni-Bi) has been selected in this study for its favourable catalytic properties, operational stability, and relatively low vapour pressure, other binary alloy systems such as copper-tin (Cu-Sn), iron-bismuth (Fe-Bi), and cobalt-bismuth (Co-Bi) have also been investigated in literature for methane pyrolysis. Table 1 provides a comparative overview of these molten metal systems with respect to key properties, including catalytic activity, melting point range, carbon solubility, and estimated cost per kilogram. Ni-Bi offers a balanced profile: moderate cost, high methane conversion, and stable molten-phase operation above 500 °C. In contrast, Cu-Sn and Fe-Bi systems may offer cost advantages but generally exhibit lower conversion efficiency or less favourable carbon solubility. Co-Bi systems can offer high activity but are more costly due to cobalt pricing and volatility under extended thermal cycling. The choice of Ni-Bi thus reflects a compromise between performance, thermal robustness, and economic viability.
These comparative properties are summarised in Table 2, which highlights the trade-offs between catalytic performance, thermal stability, and economic feasibility among the candidate molten alloy systems.

2.2.2. Catalytic and Heat Transfer Properties

The molten Ni-Bi alloy, with a nickel concentration of 27 mol%, serves as an effective catalyst for methane decomposition into hydrogen and solid carbon. Nickel’s catalytic properties are particularly well-suited for this process, promoting high methane conversion rates and hydrogen yield. The Ni0.27Bi0.73 alloy maintains catalytic stability under high temperatures, achieving conversion rates up to 95% at around 1065 °C, closely aligned with the reactor’s operating temperature. The molten Ni-Bi catalyst has a theoretical lifespan exceeding 5 years, depending on operational conditions. Unlike solid catalysts prone to deactivation from carbon fouling, the molten-phase system allows continuous operation with minimal loss.
The NaBr layer, located above the molten metal, plays a dual role as a heat transfer medium and a carbon separator. Its density is lower than that of Ni-Bi but higher than the carbon product, allowing carbon to rise through the molten metal and collect at the top of the NaBr layer. This separation strategy reduces impurities in the hydrogen product and minimises catalyst contamination by capturing carbon effectively within the NaBr layer.
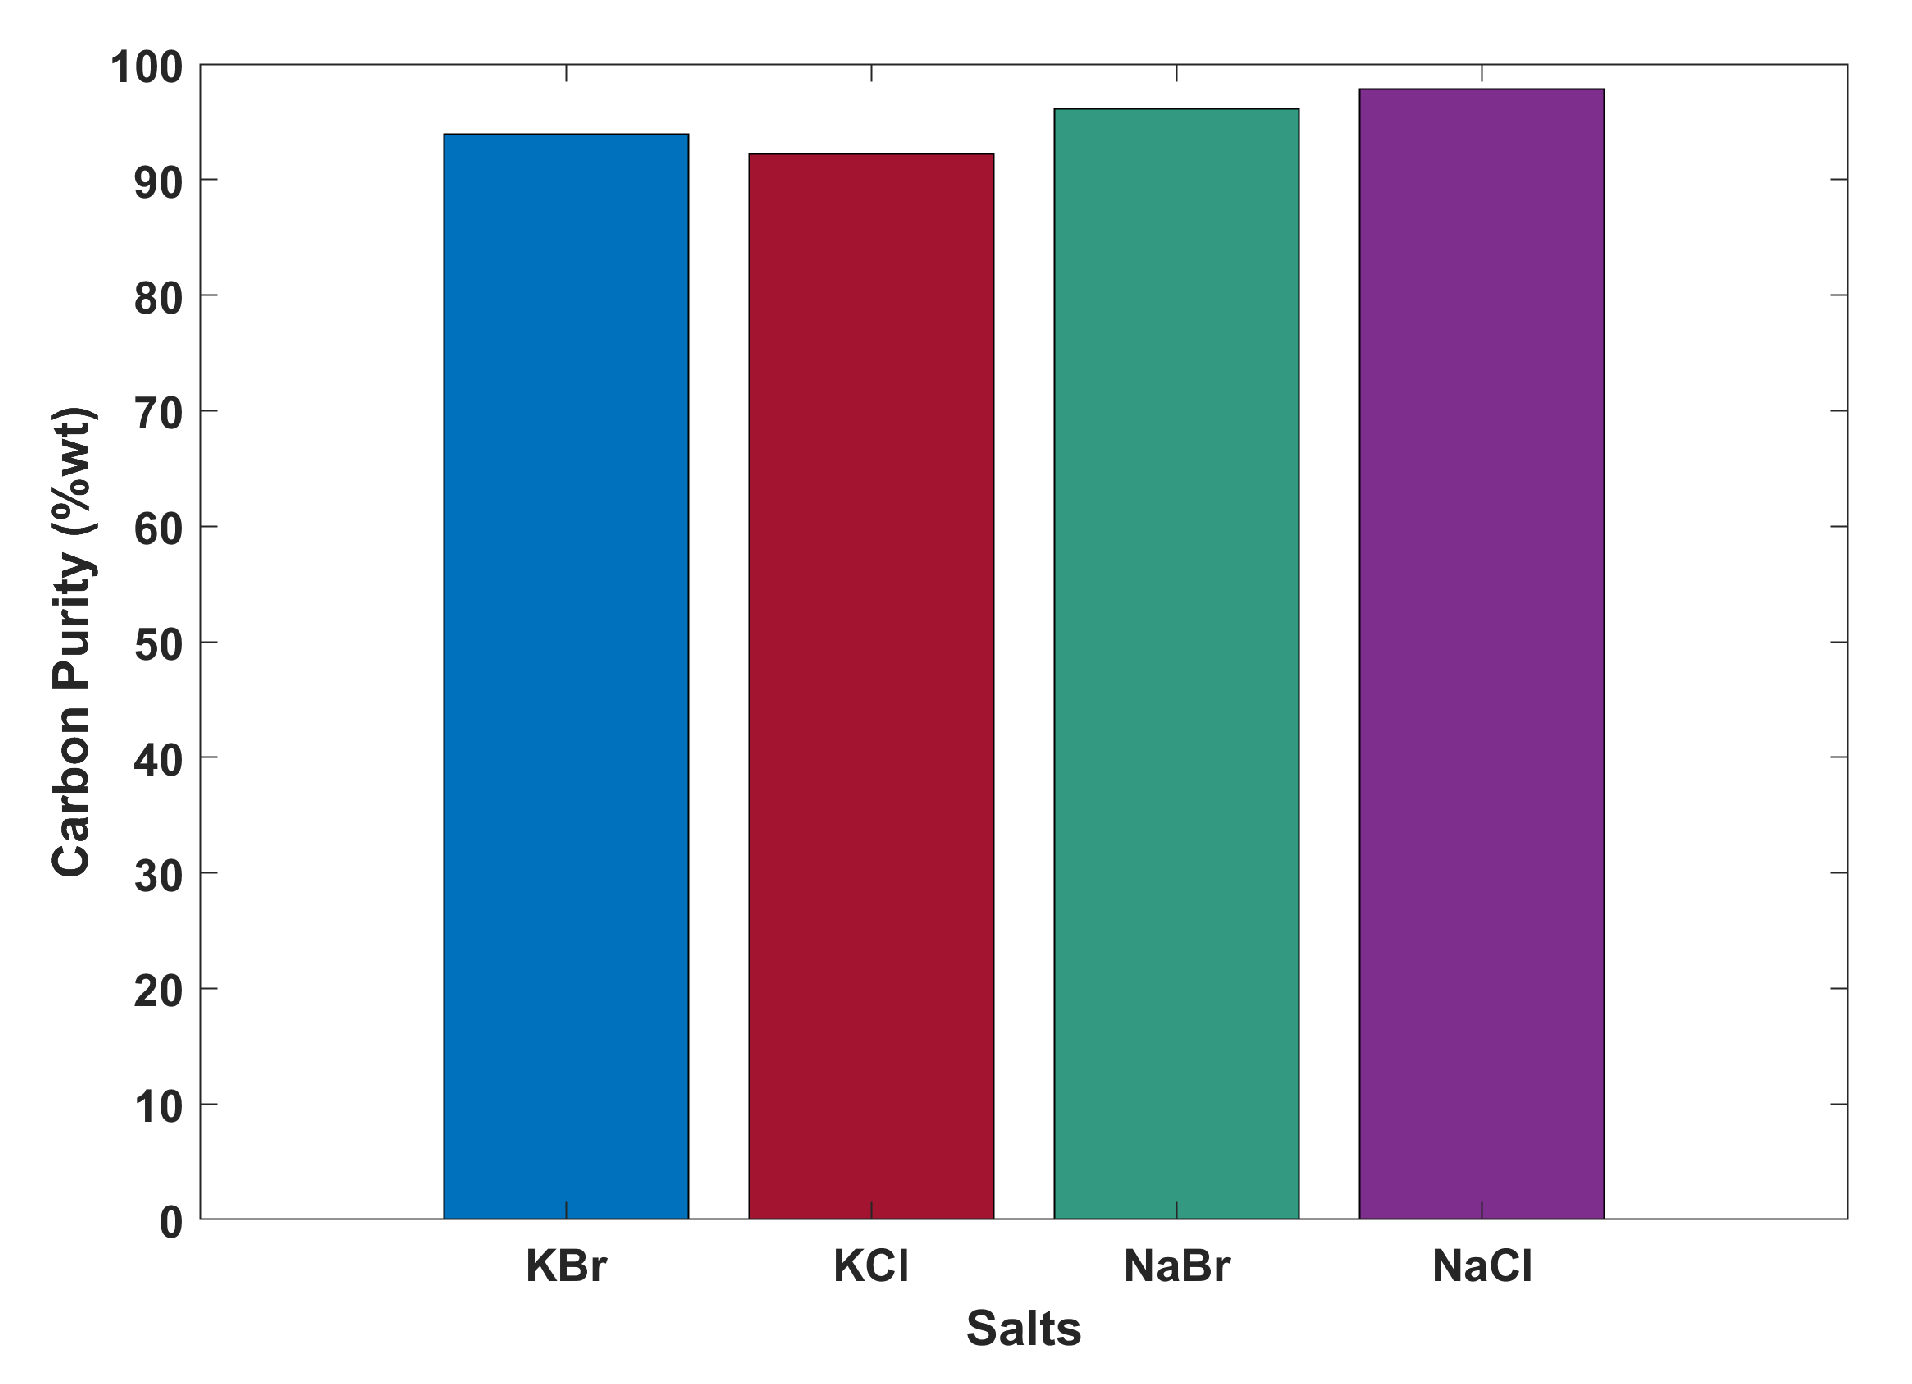
Figure 4 provides data on the purity levels achieved with various salt layers, measured at 1000 °C in 250 mm of tube of salt. These are equivalent to 60–90% by weight, but all can be raised to 95% weight by post-production heating and water or acid washes [15,17]. This figure demonstrates the effectiveness of NaBr in yielding high-purity carbon, which is essential for maintaining both reactor efficiency and carbon by-product marketability.

2.2.3. Operational Mechanics and Safety Features

To achieve the target hydrogen production rate of 200 kilotons per annum (kta), the reactor optimises methane conversion under carefully controlled conditions. The controlled xenon gas layer buffers thermal expansion, reducing stress on the reactor’s stainless steel shell and enhancing long-term safety. The AISI 310 stainless steel shell, chosen for its high corrosion resistance, adheres to industry standards (PD 5500-2021) [18] for continuous operation in high-pressure and high-temperature environments, ensuring durability and compliance with safety regulations.
The NaBr layer supports the reactor’s thermal management, circulating as a heat transfer fluid that is heated externally and reintroduced into the reactor. This continuous flow system, illustrated in Figure 5, enables stable temperature control without the need for costly induction heating, thereby optimising the reactor’s energy efficiency.
To provide a comprehensive view of the reactor, Figure 6 presents a rendered CAD model of the reactor structure. This 3D representation illustrates the arrangement and scale of each component, allowing for a more intuitive understanding of the reactor’s layout and functional design.
The LMBCR’s design leverages molten metal and salt layers to achieve high methane conversion, efficient carbon separation, and robust safety measures. This configuration addresses key challenges in methane pyrolysis, positioning the reactor as a promising solution for large-scale, CO2-free hydrogen production.

2.3. Simulation

A model of the plant-scale process has been built and run in ASPEN PLUS to obtain accurate thermodynamic results on which to build the techno-economic analysis. The pyrolysis vessel was modelled as a continuous stirred tank reactor (CSTR) and specified according to the parameters in Table 3. An iterative approach was taken to determine the number of reactors required to reach the 200 kta−1 H2 capacity. Although it was determined that a single 41.3 m3 reactor was capable of producing the required output with sufficient feedstock, CH4 conversion rates were comparatively low, and the heat duty required for the stated operating conditions increased exponentially due to the high methane flow rate. Increasing to 24 reactors with a total volume of 991.2 m3 was found to yield CH4 conversion of 88% per reactor, thus requiring reduced feedstock. This total volume is within 66% of the 600 m3 volume theorised by Upham for the production of 200 kta−1 H2 in an identical molten Ni0.27Bi0.73 melt and similar bubble column setup [14].
In the present model, the reactor volume was scaled up to accommodate the short residence time of methane bubbles rising through the molten phase under high-throughput operating conditions. At elevated temperatures (1100 °C) and moderate pressures (20 bar), bubble lifetimes are reduced due to increased gas diffusivity and surface tension effects. To ensure near-complete methane conversion and effective carbon separation, the reactor’s cross-sectional area and liquid height were increased to extend gas–liquid contact time while preserving flow stability. This approach balances practical heat transfer constraints with the kinetic requirements of molten-phase methane pyrolysis.
The conversion of CH4 to H2 and carbon was specified stoichiometrically according to Equation (2) and as a first-order reaction. Melt phase reaction rate kinetics were specified within the CSTR according to the power law relationship in Table 3 defined by Upham’s empirical analysis. Gas phase kinetics were also added according to Napier [19] for any methane conversion taking place away from the gas/metal bubble surface. The incorporation of this empirical data allows true conversion rates to be modelled, which differ slightly from the equilibrium conversion of methane [9]. It is assumed that conversion takes place only in the molten metal phase.
Heat integration around the plant has been prioritised to make use of high-grade heat as products leave the pyrolysis vessel. Countercurrent fluid heat exchangers use water as the heat transfer fluid to extract this heat, which is raised to steam to be expanded through a series of intermediate and low-pressure turbines. A Solex solids heat exchanger, capable of handling solids up to 2000 °C at a flow rate of 200,000 kg/h is also specified for heat recovery from the solid carbon stream to bring it down to a temperature of 30 °C [20]. A multi-stage compressor is modelled to bring the purified hydrogen to market conditions at 150 bar [9].

3. Assessment Methodology

3.1. Model Validation

The ASPEN PLUS simulation model was developed based on methane pyrolysis reaction kinetics and thermodynamic data sourced from established studies [14,15]. To ensure model reliability, we validated methane conversion rates and hydrogen yields against theoretical and empirical data from similar pyrolysis processes. Our model achieves methane conversions and hydrogen yields within the ranges documented in experimental studies on molten metal reactors, thereby supporting its predictive accuracy. Model outputs were validated by reproducing methane conversion rates and hydrogen yields reported by Upham et al. [14] for molten Ni-Bi systems, ensuring consistency with experimental data.

3.2. Thermodynamic Assessment

A thermodynamic analysis of the plant has been quantified through the plant performance indexes shown in Table 4, which have been adapted from Martinez et al.’s thermodynamic assessment of an SMR plant [21]. These allow for direct comparison of key parameters between the four case scenarios and also across similar studies.
A feature of Martinez’s work is the definition of an ‘equivalent’ methane flow rate, based on the consumption of methane for electricity derived from a conventional combined cycle gas turbine (CCGT) plant. However, a core assumption of this study is the use of electricity derived from 100% renewable sources. As such, there is no associated natural gas use, nor indirect CO2 emissions, as a result of electricity consumption. Therefore, the actual CH4 mass flow rate has instead been used to define aspects of the plant performance.
The heat rate (i.e., energy consumption) and process efficiency have been characterised by the energy capacity of the hydrogen product only, omitting that energy stored within the solid carbon. The carbon, although valuable, is deemed a secondary product to the aim of hydrogen production and therefore should not contribute to the thermodynamic assessment of the plant. Net electric power, Wel, is defined as positive for net electricity production as a result of the plant process.
Although the electricity input is considered CO2 neutral, the burning of natural gas to supply heat to the reactor (cases 1 and 3) and the combustion of flue gases (cases 1 and 2) both produce CO2 as a by-product. As such, CO2 indexes have been defined to characterise these emissions in the absence of carbon capture and storage (CCS) technology.

3.3. Techno-Economic Assessment

The techno-economic model is based on the 2021 revision of the U.S. Department of Energy National Energy Technology Laboratory (DOE-NETL) cost estimation methodology for assessments of power plant performance [22]. This stage of the project falls within Class 4, for which the method is said to be subject to −15% to +30% error in cost estimation.

3.3.1. Bare Erected Costs (BEC)

Bare erected costs are estimated by scaling reference components found in literature by size and cost year as appropriate. This calculation per component is carried out by Equation (3):
C i = C 0 · S S 0 f · C E P C I C E P C I y e a r
C0 represents the cost of a reference component of size S0, which is scaled by the actual component size, S, and a scaling factor f, which depends on the equipment type considered. The Chemical Engineering Plant Cost Index (CEPCI) ratio accounts for the change in equipment cost, including inflation, since the year of the reference component. The relevant information for calculation of the BEC is contained within Table 5.
Since the pyrolysis vessel has been designed to specification, it has also been costed as such by the previous research study. AISI 310 stainless steel between 1800 and 500 $/tonne yielded a cost of 0.818 M$ per reactor vessel. For each case scenario the cost of the required number of reactors has been scaled to 24 times this value.

3.3.2. Capital Expenditure (CAPEX)

The bare erected costs are the base of the economic model, on top of which are considered construction, contingency and financing costs. These additions yield a capital expenditure, CAPEX (written elsewhere as total overnight costs). Further considered is any escalation in the cost of debt financing over the capital expenditure period to reach a total as spent capital, TASC. The factor by which to obtain TASC from CAPEX is dependent on the capital expenditure period and other economic assumptions embedded within the DOE-NETL framework, found to be 1.093 for this project [22].
Set out in Table 6 are the costs intermediate between BEC and CAPEX, values of which are taken from Manzolini et al.’s economic assessment of CO2 capture in a natural gas combined cycle process [28].

3.3.3. Operating Expenditure (OPEX)

The operating expenditure of the plant is that which is required to operate the plant beyond the point at which it is built. The cost of various consumables is considered per unit, then multiplied by the rate at which these are consumed over a certain time period.
Here the OPEX is split between fixed and variable charges, as shown in Table 7. Fixed charges are expressed as fractions of the CAPEX since they generally scale with the size of the plant. Values for these multipliers have been taken from Spallina et al. [16].
Variable operational expenditures are those charges for which the cost of the consumable varies over time as a result of fluctuating market value. Base case values of variable operating expenditures are shown in Table 7, which are later adjusted to perform a sensitivity analysis. Despite a current rise in prices due to geopolitical circumstances, the price of methane, 5.00 $/MMBtu, is based on the 30-year levelised predicted cost of natural gas delivered to power plants in the US, as stated by the National Energy Technology Laboratory [29]. The stated electricity price, 50 $/MWh, is a conservative estimate based on a 2020 Hydrogen Council study which predicts that the levelised cost of energy from offshore wind will drop from 57 to 33 $/MWh by 2030 and is assumed to be dedicated to hydrogen production [30]. Recent projections by the IEA (2023) [4] indicate that increasing shares of wind and solar in power generation are likely to reduce average wholesale electricity prices in regions with high renewable penetration. However, price volatility and grid balancing costs may increase. To account for this, our analysis includes a wide electricity price range (30–120 $/MWh), capturing both low-cost renewables and high-peak market conditions observed in the EU and North America.
A CO2 tax (or ‘carbon tax’) is also applied to CO2 emissions resulting from the combustion of natural gas in the case scenarios considered. Although a carbon tax is only currently enforced in a number of US states, both the UN Framework Convention on Climate Change and the International Monetary Fund estimate that achieving the Paris Agreement’s goal of limiting warming to two degrees will require a universal carbon price of 75 $/tonne by 2030 [34].
The mid-range CO2 tax value of 75 $/tonne CO2 used in this study reflects projections by leading global institutions such as the International Monetary Fund (IMF) and the United Nations Framework Convention on Climate Change (UNFCCC). These organisations suggest that a universal carbon price in the range of 75–100 $/tonne will be required by 2030 to achieve the Paris Agreement goals and limit global warming to below 2 °C. This value represents a realistic policy benchmark under an emissions-constrained future, providing a conservative yet representative basis for evaluating the cost-effectiveness of hydrogen production technologies subject to carbon penalties. Furthermore, it aligns with previous techno-economic assessments in literature, such as Perez et al. [9] and Weger et al. [11], thereby supporting cross-study comparability and policy relevance.
Meanwhile, the solid carbon produced as a by-product of methane pyrolysis holds value primarily in the rubber tyre industry [35]. This is defined as a ‘negative cost’ for calculation purposes since it holds sale value; however, its true value is directly dependent on the quality and purity of carbon produced. 300 $/tonne is again a conservative base case estimate, also used by Perez et al. [9].

3.3.4. Levelised Cost of Hydrogen (LCOH)

A levelised cost of hydrogen, $/kg, is calculated based on the levelised cost of energy methodology provided in the DOE-NETL guidelines [22] according to the assumptions listed in Table 8.
A capacity factor of 0.9 is standard in industry [9] and equates to 7884 operational hours per year. The fixed charge rate (FCR) is calculated in line with other assumptions embedded within the analysis methodology, such as the capital expenditure period. This metric is widely used across the hydrogen industry to directly compare production costs, and the expression is shown by Equation (4):
L C O H = ( F C R · T A S C ) + O P E X f + ( O P E X v · h e q ) H 2 , p r o d · h e q
where:
  • FCR: fixed charge rate, based on financing structure [year−1]
  • TASC: total as spent capital [M$]
  • OPEXf: fixed operating and maintenance costs [$/year]
  • OPEXv: variable operating and maintenance costs [$/h]
  • H2,prod: hydrogen output mass flow rate [kg/h]
  • heq: equivalent working hours [h/year]

4. Results and Discussion

4.1. Thermodynamic Assessment

Table 9 summarises the thermodynamic performance of the 200 kta−1 H2 plant according to the plant indexes defined in Table 4. Mass and thermal flows of the CH4 feedstock and H2 and carbon products are also shown, along with a breakdown of the power consumed by electrical components.
It is immediately clear that cases 1 and 2, in which purge gases of the PSA unit are combusted to raise steam, are significantly higher consumers of methane feedstock than cases 3 and 4, which recycle purge gases to the reactor. This is primarily a result of unreacted methane leaving the pyrolysis vessel after only one pass during which 12% of methane remains unconverted. The continuous recycling of these purge gases in cases 3 and 4 allows the methane conversion to converge on 100%. This is shown by the H2 yield index parameter for case 4, which shows a hydrogen output of two moles for every one mole of methane, since this scenario does not consume methane elsewhere in the process. An equivalent 200 kta−1 H2 SMR facility consumes 658 kta−1 CH4 [36].
The advantage of combusting purge gases is apparent by the electricity generation provided by these setups. Whereas cases 3 and 4 are net consumers of electricity, cases 1 and 2 are net producers, 1040 MW and 720 MW, respectively. That said, it is apparent that the electricity produced in cases 1 and 2 is not sufficient to cover the increased energy consumption represented by higher methane input, as shown by the heat rate index. Thus the process efficiency of these cases, expressed as the lower heating value of hydrogen as a fraction of total energy consumption, is only 23.9% for case 1 and 26.2% for case 2.
Although case 3 uses a flue gas recycle setup, the methane used by the fired heater to supply heat to the pyrolysis vessel reduces its thermal efficiency compared to case 4. However, this also means it consumes less electric power than the EAF setup proposed in case 4, consuming only 11 MW.
It can be seen that all cases in which methane is combusted in air produce significant CO2 emissions, especially cases 1 and 2 at 25 kgCO2 and 20 kgCO2 per kilogram H2. A study into the impact of hydrogen decarbonisation on industry [5] found that SMR emits between 8 and 12 kgCO2/kgH2, while coal gasification emits around 20 kgCO2/kgH2. Meanwhile, as electricity producers, cases 1 and 2 are more CO2 intensive than the current world average for power grids at 0.48 kgCO2/kWhe [5]. It is clear by these comparisons that a CCS system should be employed in scenarios 1 and 2 to reduce their environmental impact compared to conventional methods of hydrogen and subsequent electricity production.
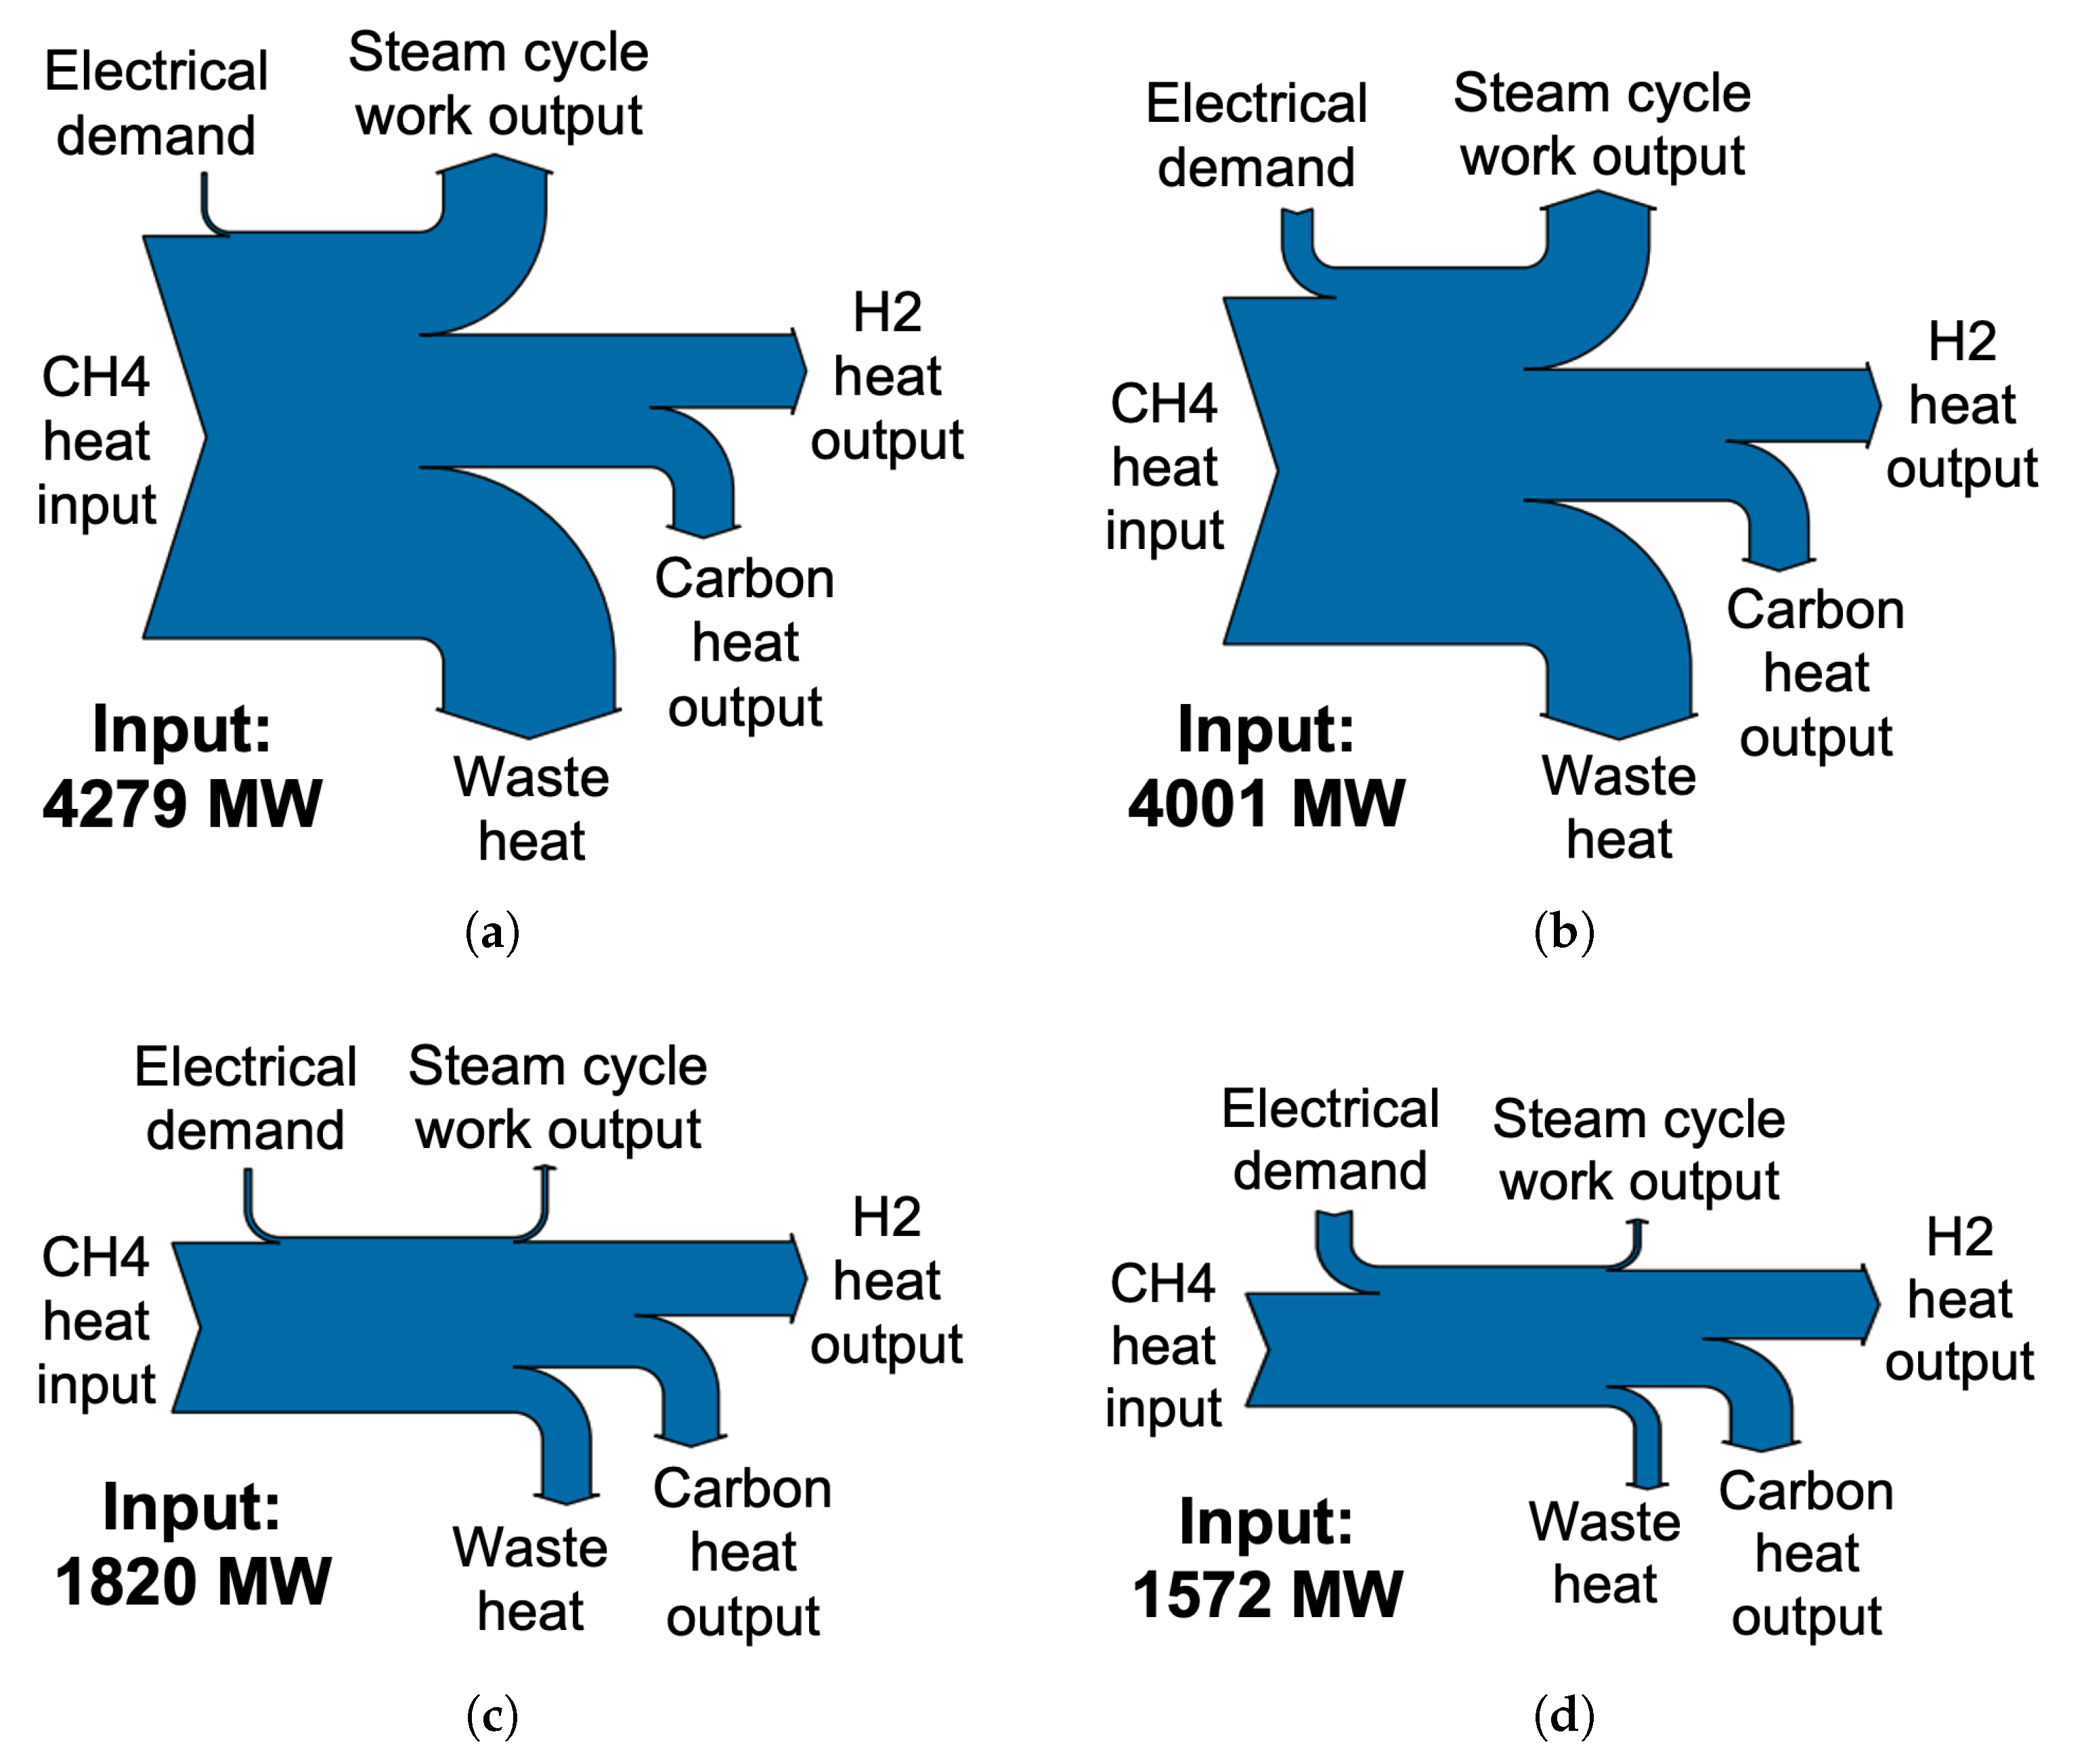
Figure 7 shows the process heat flows of each case scenario considered, each for the same H2 output and calculated by the lower heating values of each component. Significant waste heat in cases 1 and 2 is a result of the typically low thermal efficiency, around 45%, of electricity production from conventional steam cycles [37].

4.2. Techno-Economic Assessment

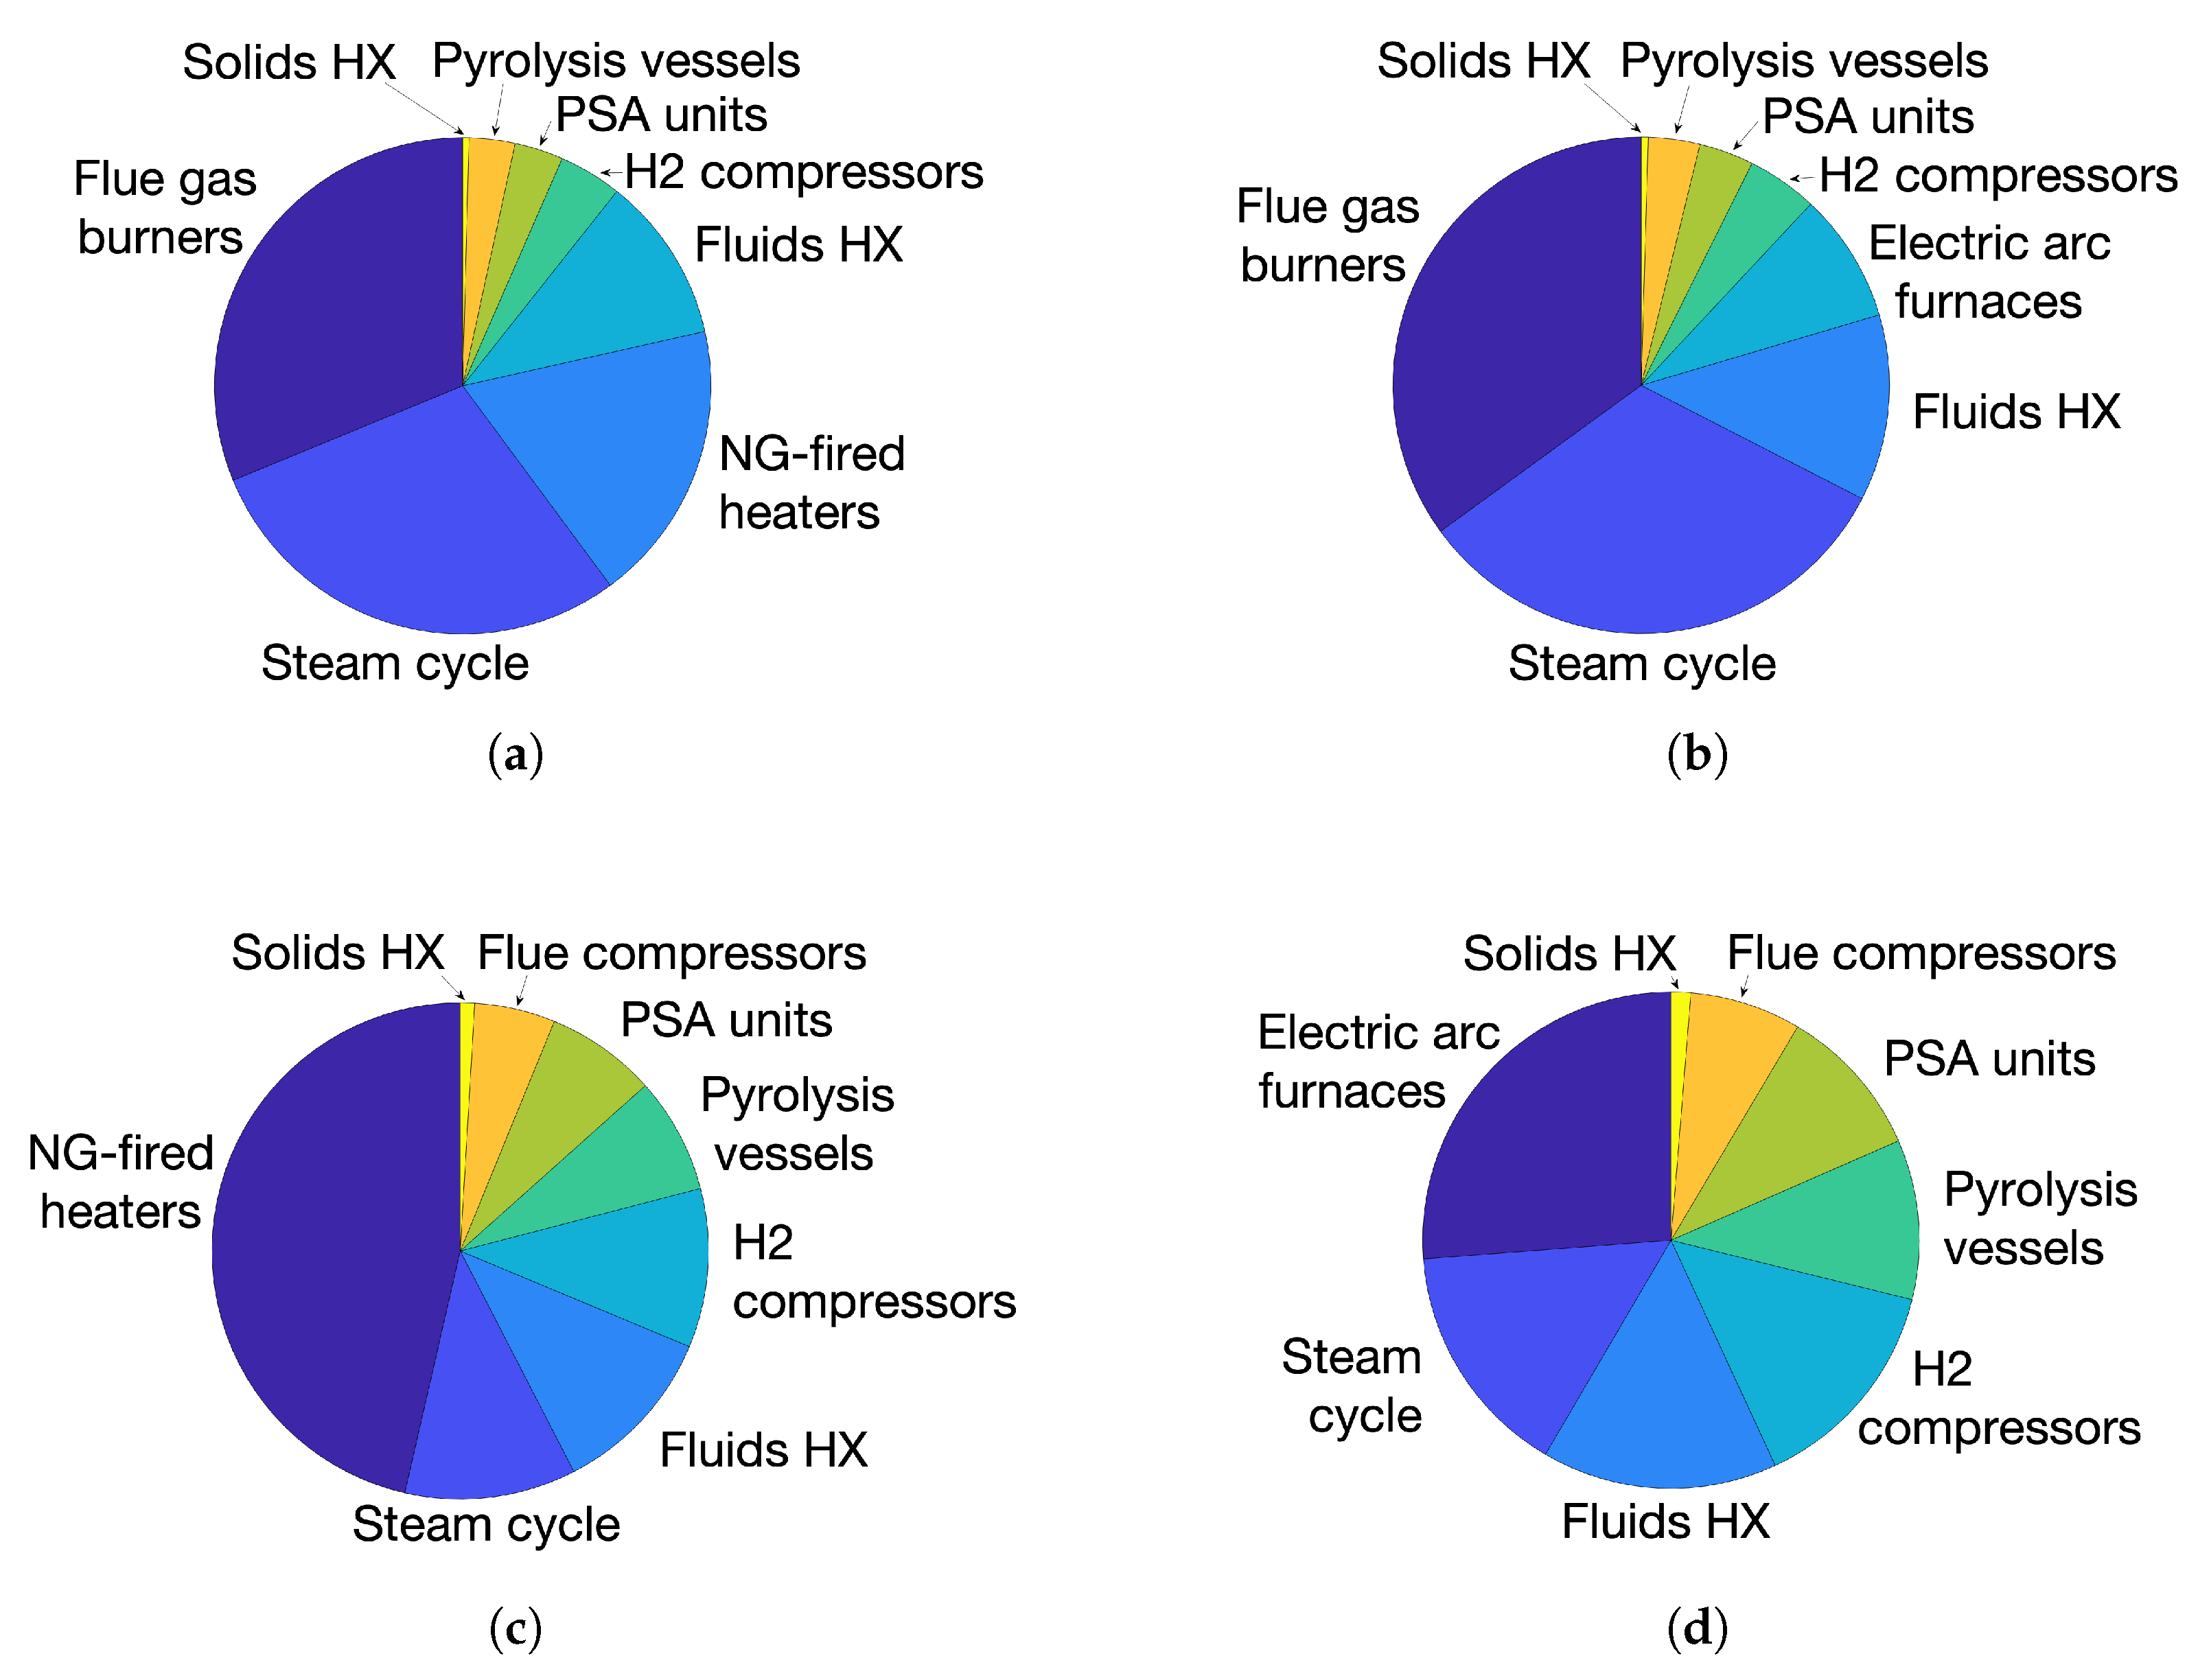
The full results of the techno-economic analysis can be found in Table 10. Listed for each case scenario are the bare erected costs, operating expenditure and total capital expenditure. Figure 8 represents graphically the split of BEC.
The impact of electricity production on BEC from cases 1 and 2 is evident by the cost of the steam cycle components, primarily multiple intermediate and low-pressure turbines. In each of these cases the steam cycle can be seen to make up around 30% of the total BEC, whereas the figure is roughly half that for cases 3 and 4.
The other significant cost of cases 1 and 2 above the others is that of the burners required to combust the purge gases. Although such burners are well-established in industry, it is their sheer scale, producing over a gigawatt of electricity in case 1, which makes them a significant cost factor.
The total operating expenditure of a methane pyrolysis plant is found to be between 198 and 390 M$/year. It can be seen that the OPEX in each case is dominated by four factors: CH4 price, electricity price, CO2 tax and the sale value of solid carbon black. Although the electricity export of cases 1 and 2 more than negates the high feedstock cost, they both suffer a heavy CO2 tax at the base case cost of 75 $/tonneCO2. The sale of the carbon black product recovers a portion of the operating expenses in all cases, given that the carbon is of sufficient quality to be sold at 300 $/tonne.
The high operating temperature (1100 °C) and pressure (20 bar) of the LMBCR system impose technical challenges that impact both capital and operational expenditures. From a CAPEX perspective, reactor materials must withstand prolonged thermal and chemical stress, necessitating the use of specialty alloys, high-purity ceramics, and insulation, all of which increase fabrication cost. Additionally, high-pressure piping, sealing components, and safety systems require enhanced compliance with pressure vessel standards, further elevating installation costs.
On the OPEX side, sustaining these conditions demands significant thermal energy input, particularly in the natural gas-fired or electrically heated variants. Electricity-based heating (e.g., via resistive or plasma arc methods) introduces energy inefficiencies and cost variability, while combustion-based heating adds emissions unless offset by flue gas recycling or CCS. Nonetheless, these elevated conditions are essential for high methane conversion and carbon purity, particularly in molten-phase reactors where kinetic limitations are mitigated at high temperatures.
In comparison, solid-state methane pyrolysis reactors, such as fluidised beds and fixed beds, typically operate at lower temperatures (800–1000 °C) and atmospheric pressure but face severe catalyst deactivation due to carbon deposition and thermal sintering. Plasma-based MP reactors achieve CH4 cracking at similar or higher temperatures (2000–3000 °C) but suffer from extremely high electricity demand (>10–15 kWh/kg H2), leading to very high OPEX and a need for renewable electricity to maintain decarbonisation benefits.
To mitigate OPEX and improve energy efficiency in the LMBCR system, heat integration strategies can be employed. These include using the sensible heat of hot solid carbon (≈900 °C) to preheat incoming methane feed via a solid–gas recuperator and recovering waste heat from flue gases through steam generation for auxiliary processes or electricity generation. Such integration could reduce the net thermal input and enhance overall process efficiency, offsetting the economic penalty of high operating temperatures.
The levelised cost of hydrogen given base case assumptions is found to be between 1.29 $/kg for the most cost-effective design, case 4, and 2.99 $/kg for the least cost-effective, case 1. Case scenario 2 gives an LCOH of 2.73 $/kg, and case 3 1.53 $/kg. These results show cases 3 and 4 to be competitive with SMR processes incorporating CCS technology, which typically costs 1.20–2.10 $/kg according to a 2019 study by the International Energy Agency [38]. The results are also comparable to Parkinson et al.’s 2018 findings of 1.40 $/kg for a design of methane pyrolysis in molten metal and molten salt [36]. All case scenarios considered are cheaper compared to electrolysis, currently considered the cleanest method of hydrogen production but costing between 3.00 and 6.55 $/kg [10].

4.3. Sensitivity Analysis

A sensitivity analysis has been carried out on the components of operating expenditure that were either judged to be subject to significant uncertainty or found to be particularly influential on the LCOH. Although some elements of CAPEX are subject to price fluctuations, such as steel price for the manufacture of pyrolysis vessels, none were found to have a greater impact on the LCOH than the factors expressed in Table 11.
In this study, a single-pass reactor model was used as a baseline for comparison; however, industrial-scale methane pyrolysis systems typically employ multi-pass configurations to enhance conversion efficiency. In a multi-pass system, the unconverted CH4–H2 mixture exiting the reactor is cooled and separated, and the residual methane is re-circulated into the reactor inlet. This iterative process gradually increases the overall CH4 conversion, approaching equilibrium limits over multiple cycles. As the hydrogen fraction increases with each pass, the forward reaction rate decreases due to product inhibition. Nonetheless, thermodynamic equilibrium progressively shifts in favour of hydrogen production under high temperatures and low partial pressures of methane. Future work could integrate a detailed recycle loop model to assess the trade-offs between conversion, compression energy, and heat integration requirements.
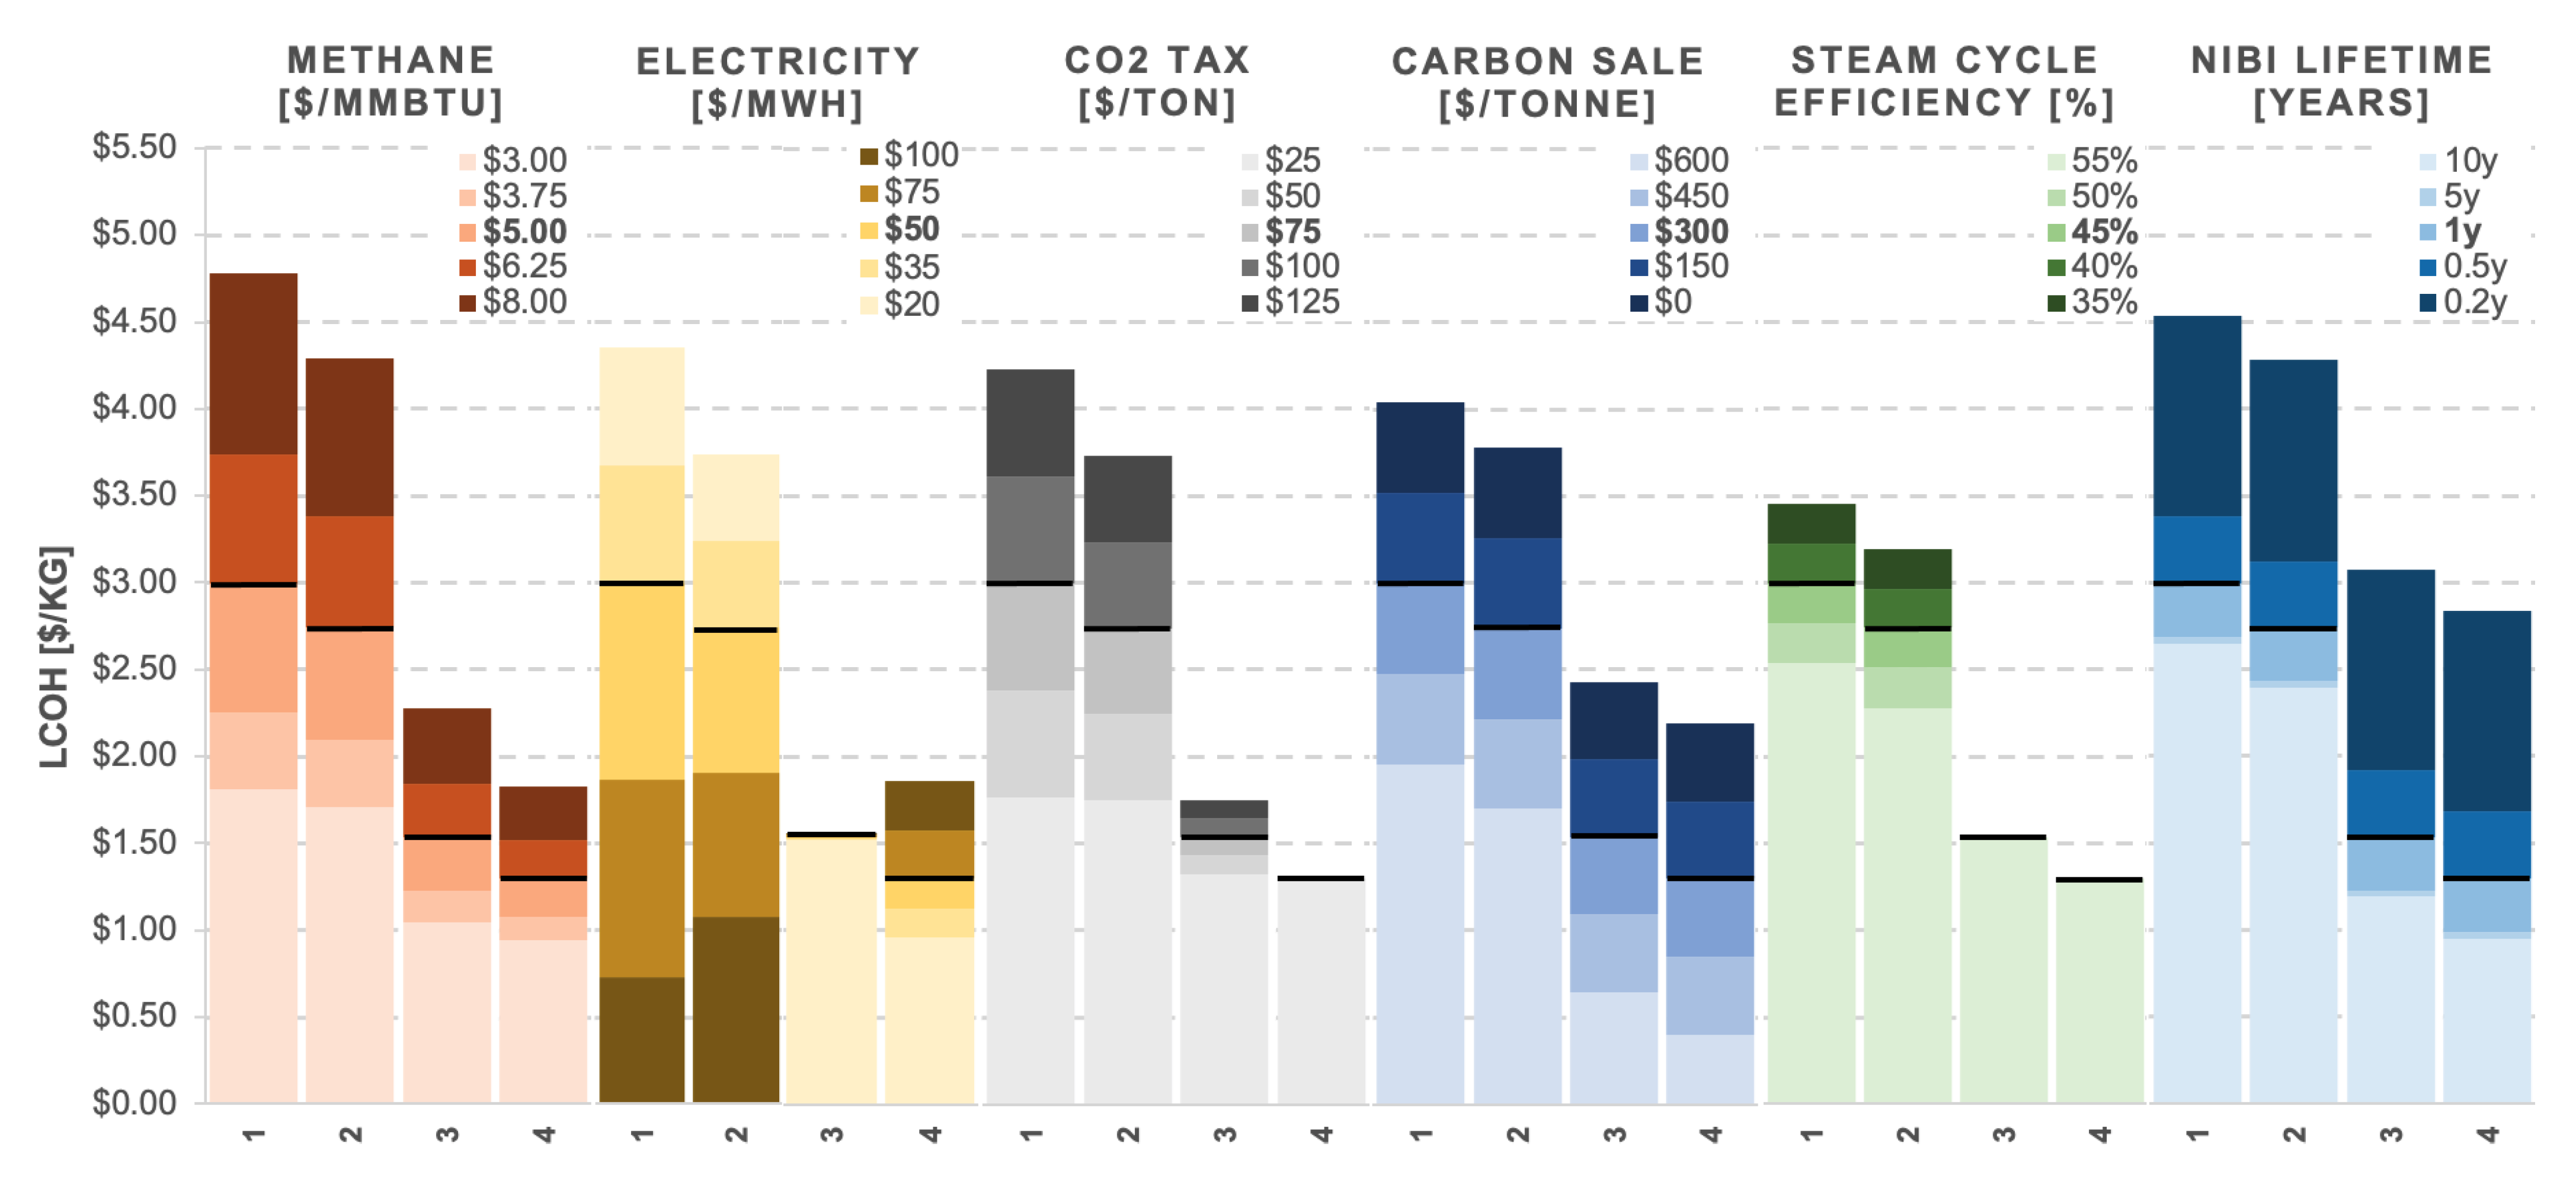
Figure 9 shows the result of the sensitivity testing, with each parameter tested as the single independent variable in the analysis. All other values remained at the base case assumptions. What is immediately evident is that case scenario 4, in which heat is supplied to the molten salt by an EAF and flue gases are recycled back into the reactor, is both the most cost-effective and least sensitive design. It is the least affected by fluctuations in methane price and steam cycle efficiency and is not impacted by CO2 tax since it has zero emissions. Cases 3 and 4, which are less sensitive to methane price, are likely to become more advantageous in the future as natural gas supplies continue to deplete and as it comes under greater price pressure from environmental regulation.
Case 3 is least sensitive to electricity price since its net use is close to zero, staying between 1.51 and 1.55 $/kg. As such, it could be favourable in an environment in which electricity prices are particularly unstable. Should the electricity price rise above 75 $/MWh, cases 1 and 2 would gain sufficient revenue by exporting back to the grid to become competitive with cases 3 and 4, with all scenarios between 1.50 and 2.00 $/kg. Case 1’s sensitivity to electricity price is the most significant of all sensitivities tested across the design proposals.
The level at which a CO2 tax in the US will be set in the coming years is unknown. However, if the aims of the Paris Agreement are to be respected, it is infeasible to imagine that such a tax would not impact the plant over its 30-year operational period. As such, the minimum tested value is 25 $/tonne, ranging up to 125 $/tonne. It can be seen that those cases which emit greater CO2 emissions are more greatly affected, with a 100 $/tonne tax pushing case 1 above 3.50 $/kg. This is an element to consider should legislation shift towards further increasing emissions tax as a form of environmental regulation.
The most consistently sensitive factor in the analysis is the value of the solid carbon product. A conservative base case estimate of 300 $/tonne may not represent the true value of the carbon if it were to be formed of the nanotube-like structures found by Rahimi [15]. That said, the quality of the product at such a scale and post-processing is unknown. Furthermore and equally impactful is the size of the carbon black market globally. Although on a small scale it may be feasible to sell the product for a good price, the scale of production would soon reduce its value by saturating the market, which is currently estimated at 16,400 kilotonnes annually, most of which is not domestic to the US [39]. Uses of carbon black outside of the tyre industry are also to be considered, such as a reducing agent for the production of silicon-carbide and as an addition or substitute for coke in metallurgical processes [39]. Given the potential market saturation of multiple plants of this size, the sale price has been varied between 600 $/kg for early adopter plants and 0 $/kg for nth -of-a-kind plants. Even for the best scenario in case 4, ‘selling’ carbon black at 0 $/kg would raise the LCOH to 2.18 $/kg, rendering it uncompetitive against SMR with CCS.
Although nickel-bismuth was chosen as a catalyst because it doesn’t deactivate, there is the possibility that the inventory will need to be replenished at regular intervals, especially given that this technology has not been tested at such a scale. The intervals in the sensitivity analysis have been varied between approximately 10 weeks and 10 years. Should the inventory lifetime be between ten weeks and half a year, case 1 would cost 3.37–4.53 $/kg and case 4 from 1.67–2.83 $/kg.
It can be seen from this analysis that recycling flue gases back into the reactor is not only more cost-effective than burning them but results in lower sensitivity to all parameters tested. The choice of heating method, by NG-fired heater or electric arc furnace, is less consequential economically but still found to be sensitive to methane and electricity prices.
Although not considered directly in this work, it can be concluded from this analysis that a likely design scenario is one in which the majority of flue gases are recycled back into the reactor to increase overall conversion rates, while the remainder are combusted for electricity generation. This could be designed in such a way that the plant’s electricity use is net zero, removing its sensitivity to electricity prices. Furthermore, should electricity prices rise such that it becomes profitable to be an exporter, the setup could be dynamically adjusted to reflect this. A carbon capture and storage system would likely need to be costed into the plant in this case to reduce CO2 emissions and make it environmentally justifiable. Of the proposed scenarios, an electric arc furnace would be the most cost-effective heating method.
5. Conclusions

The prospect of a cost-competitive and environmentally conscious technology for hydrogen production to bridge between steam methane reforming and electrolysis is fulfilled by methane pyrolysis. The absence of atmospheric oxygen from the conversion of methane to hydrogen and carbon bypasses the direct CO2 emissions produced in SMR, while the relative abundance of the methane feedstock keeps the levelised cost of produced hydrogen below that of electrolysis.
A detailed bubble column reactor design is proposed in this work, accommodating a molten metal and molten salt inventory in which catalytic methane pyrolysis takes place at 1100 °C and 20 bar. Specific reaction kinetics have been modelled using ASPEN PLUS, and four 200 kta−1 H2 plant designs have been proposed and assessed. The recycling of unconverted methane back into the pyrolysis vessel was found to be thermodynamically and economically favourable compared with its combustion for electricity production. Analysis showed the LCOH to be highly sensitive to the sale price of the carbon product in all cases, while cases with high CO2 emissions were heavily impacted by CO2 tax. Case 4 is both the least carbon-intensive and most cost-competitive scenario at an LCOH of 1.29 $/kg. With the Hydrogen Council reporting an 80% decrease in the cost of renewable and hydrogen technologies between 2010 and 2020, this is likely to decrease in time [30].
These findings contribute to the field by supporting methane pyrolysis as a practical pathway for low-carbon hydrogen production and as an intermediate technology toward fully renewable hydrogen solutions. Methane pyrolysis continues to be further explored, with the first pilot-level commercial plants in development validating the application of the technology in industry [40]. Alongside the novel use of molten salt for heat transfer in conjunction with catalytic molten metal that has been explored in this work, further research avenues remain open.

Author Contributions

Methodology, C.M., N.M.; Formal analysis, C.M.; Conceptualization, S.R., N.M., B.M. and A.S.; Writing—original draft, C.M.; Writing—review and editing, S.R., N.M. and A.S.; Supervision, S.R., N.M., B.M. and A.S.; Funding, A.S. All authors have read and agreed to the published version of the manuscript.

Funding

This research work was funded by the Engineering and Physical Science Research Council of UK (Grant numbers: EP/S032134/1, EP/T022949/1).

Data Availability Statement

The original contributions presented in this study are included in the article. Further inquiries can be directed to the corresponding author.

Acknowledgments

We would like to thank the Level 3 Engineering Design Students Oliver Rockey, Amber Gosling, Dominic Laurens, Harvey Leak-Smith, Thomas Pelan and Thomas Toland who performed the high level engineering design of the reactor.

Conflicts of Interest

Author Neal Morgan was employed by the company Shell Global Solutions (UK). The remaining authors declare that the research was conducted in the absence of any commercial or financial relationships that could be construed as a potential conflict of interest.

Abbreviations

BEC—Bare Erected Cost; CAPEX—Capital Expenditure; CCS—Carbon Capture and Stor-age; CEPCI—Chemical Engineering Plant Cost Index; CFD—Computational Fluid Dynamics; CSTR—Continuous Stirred Tank Reactor; EAF—Electric Arc Furnace; FCR—Fixed Charge Rate; GHG—Greenhouse Gas; HTF—Heat Transfer Fluid; LCOH—Levelised Cost of Hydrogen; LHV—Lower Heating Value; LMBCR—Liquid Metal Bubble Column Reactor; MMBtu—Million British Thermal Units; MJ—Megajoules; MWe—Megawatt Electrical; MWth—Megawatt Thermal; NaBr—Sodium Bromide; Ni-Bi—Nickel-Bismuth; OPEX—Operating Expenditure; PSA—Pressure Swing Adsorption; SMR—Steam Methane Reforming; TASC—Total As Spent Capital.

References

  1. Berkeley Earth. June 2021 Temperature Update. Available online: http://berkeleyearth.org/june-2021-temperature-update/ (accessed on 7 May 2025).
  2. Global Monitoring Laboratory. Trends in Atmospheric Carbon Dioxide. Available online: https://gml.noaa.gov/ccgg/trends/mlo.html (accessed on 7 May 2025).
  3. Megía, P.J.; Vizcaíno, A.J.; Calles, J.A.; Carrero, A. Hydrogen Production Technologies: From Fossil Fuels toward Renewable Sources. A Mini Review. Energy Fuels 2021, 35, 16403–16415. [Google Scholar] [CrossRef]
  4. IEA. Energy and Climate Change—World Energy Outlook Special Report. In Energy and Climate Change; IEA: Paris, France, 2015. [Google Scholar]
  5. Blank, T.K.; Molly, P. Hydrogen’s Decarbonization Impact for Industry; Rocky Mountain Institute: Basalt, CO, USA, 2020. [Google Scholar]
  6. Precedence Research. Hydrogen Generation Market—Global Industry Analysis, Size, Share, Growth, Trends, Regional Outlook, and Forecast 2021–2030; 2021. Available online: https://www.precedenceresearch.com/hydrogen-generation-market (accessed on 7 May 2025).
  7. Morris, J. Why Hydrogen Will Never Be the Future of Electric Cars. 2020. Available online: https://www.forbes.com/sites/jamesmorris/2020/07/04/why-hydrogen-will-never-be-the-future-of-electric-cars/ (accessed on 7 May 2025).
  8. Ashik, U.; Daud, W.W.; Abbas, H.F. Production of greenhouse gas free hydrogen by thermocatalytic decomposition of methane—A review. Renew. Sustain. Energy Rev. 2015, 44, 221–265. [Google Scholar] [CrossRef]
  9. Pérez, B.J.; Jiménez, J.A.; Bhardwaj, R.; Goetheer, E.; van Sint Annal, M.; Gallucci, F. Methane pyrolysis in a molten gallium bubble column reactor for sustainable hydrogen production: Proof of concept & techno-economic assessment. Int. J. Hydrogen Energy 2021, 46, 4917–4935. [Google Scholar] [CrossRef]
  10. European Commission. A Hydrogen Strategy for a Climate-Neutral Europe; European Commission: Brussels, Belgium, 2020. [Google Scholar]
  11. Weger, L.; Abánades, A.; Butler, T. Methane cracking as a bridge technology to the hydrogen economy. Int. J. Hydrogen Energy 2017, 42, 720–731. [Google Scholar] [CrossRef]
  12. Parkinson, B.; Matthews, J.W.; McConnaughy, T.B.; Upham, D.C.; McFarland, E.W. Techno-Economic Analysis of Methane Pyrolysis in Molten Metals: Decarbonizing Natural Gas. Chem. Eng. Technol. 2017, 40, 1022–1030. [Google Scholar] [CrossRef]
  13. Serrano, D.; Botas, J.; Guil-Lopez, R. H2 production from methane pyrolysis over commercial carbon catalysts: Kinetic and deactivation study. Int. J. Hydrogen Energy 2009, 34, 4488–4494. [Google Scholar] [CrossRef]
  14. Upham, D.C.; Agarwal, V.; Khechfe, A.; Snodgrass, Z.R.; Gordon, M.J.; Metiu, H.; McFarland, E.W. Catalytic molten metals for the direct conversion of methane to hydrogen and separable carbon. Science 2017, 358, 917–921. [Google Scholar] [CrossRef] [PubMed]
  15. Rahimi, N.; Kang, D.; Gelinas, J.; Menon, A.; Gordon, M.J.; Metiu, H.; McFarland, E.W. Solid carbon production and recovery from high temperature methane pyrolysis in bubble columns containing molten metals and molten salts. Carbon 2019, 151, 181–191. [Google Scholar] [CrossRef]
  16. Spallina, V.; Pandolfo, D.; Battistella, A.; Romano, M.; Annaland, M.V.S.; Gallucci, F. Techno-economic assessment of membrane assisted fluidized bed reactors for pure H2 production with CO2 capture. Energy Convers. Manag. 2016, 120, 257–273. [Google Scholar] [CrossRef]
  17. Parkinson, B.; Patzschke, C.F.; Nikolis, D.; Raman, S.; Dankworth, D.C.; Hellgardt, K. Methane pyrolysis in monovalent alkali halide salts: Kinetics and pyrolytic carbon properties. Int. J. Hydrogen Energy 2021, 46, 6225–6238. [Google Scholar] [CrossRef]
  18. PD 5500:2021; Specification for Unfired Fusion Welded Pressure Vessels. British Standards Institution: London, UK, 2021.
  19. Napier, D.H.; Subrahmanyam, N. Pyrolysis of methane in a single pulse shock tube. J. Appl. Chem. Biotechnol. 2007, 22, 303–317. [Google Scholar] [CrossRef]
  20. Solex Thermal Science. Our Technology. Available online: https://www.solexthermal.com/our-technology/cooling/ (accessed on 7 May 2025).
  21. Martínez, I.; Romano, M.; Chiesa, P.; Grasa, G.; Murillo, R. Hydrogen production through sorption enhanced steam reforming of natural gas: Thermodynamic plant assessment. Int. J. Hydrogen Energy 2013, 38, 15180–15199. [Google Scholar] [CrossRef]
  22. National Energy Technology Laboratory. Cost Estimation Methodology for NETL Assessments of Power Plant Performance. In Quality Guidelines for Energy System Studies; National Energy Technology Laboratory: Houston, TX, USA, 2021. [Google Scholar]
  23. Kreutz, T.; Williams, R.; Socolow, R.; Chiesa, P.; Lozza, G. Production of Hydrogen and Electricity from Coal with CO2 Capture. In Greenhouse Gas Control Technologies—6th International Conference, Proceedings of the 6th International Conference on Greenhouse Gas Control Technologies, Kyoto, Japan, 1–4 October 2002; Elsevier: Amsterdam, The Netherlands, 2003; pp. 141–147. [Google Scholar] [CrossRef]
  24. Kreutz, T.; Williams, R.; Consonni, S.; Chiesa, P. Co-production of hydrogen, electricity and CO from coal with commercially ready technology. Part B: Economic analysis. Int. J. Hydrogen Energy 2005, 30, 769–784. [Google Scholar] [CrossRef]
  25. Sjostrom, S. Optimizing the Costs of Solid Sorbent-Based CO2 Capture Process Through Heat Integration; Technical report; ADA-ES, Inc.: Highlands Ranch, CO, USA, 2016. [Google Scholar] [CrossRef]
  26. Ibsen, K. Equipment Design and Cost Estimation for Small Modular Biomass Systems, Synthesis Gas Cleanup, and Oxygen Separation Equipment; Technical report; Nexant Inc.: San Francisco, CA, USA, 2006. [Google Scholar]
  27. Tutterow, V.; Hovstadius, G.; McKane, A. Going with the Flow: Life Cycle Costing for Industrial Pumping Systems; Lawrence Berkeley National Laboratory: Berkeley, CA, USA, 1999. [Google Scholar]
  28. Manzolini, G.; Macchi, E.; Gazzani, M. CO2 capture in natural gas combined cycle with SEWGS. Part B: Economic assessment. Int. J. Greenh. Gas Control 2013, 12, 502–509. [Google Scholar] [CrossRef]
  29. National Energy Technology Laboratory. Quality Guidelines for Energy Systems Studies Fuel Prices for Selected Feedstocks in NETL Studies; National Energy Technology Laboratory: Washington, DC, USA, 2019. [Google Scholar]
  30. Hydrogen Council. Path to Hydrogen Competitiveness, a Cost Perspective; Hydrogen Council: Brussels, Belgium, 2020. [Google Scholar]
  31. Business Insider. Nickel Price Data. Available online: https://markets.businessinsider.com/commodities (accessed on 7 May 2025).
  32. Rotometals. Bismuth Price Data. Available online: https://www.rotometals.com/palletbismuth-ingots-99-99-1000-pounds/ (accessed on 7 May 2025).
  33. Made in China. NaBr Price Data. Available online: https://sheng-bang.en.made-in-china.com/product/zZxajqKVhPUf/China-Best-Price-Bulk-Bromide-Sodium-CAS-7647-15-6-Sodium-Bromide.html (accessed on 7 May 2025).
  34. Why the US Should Establish a Carbon Price Either Through Reconciliation or Other Legislation. 2021. Available online: https://www.brookings.edu/articles/why-the-us-should-establish-a-carbon-price-either-through-reconciliation-or-other-legislation/ (accessed on 7 May 2025).
  35. Carbon Black Market—Growth, Trends, COVID-19 Impact, and Forecast (2022–2027). 2021. Available online: https://www.mordorintelligence.com/industry-reports/carbon-black-market (accessed on 7 May 2025).
  36. Parkinson, B.; Tabatabaei, M.; Upham, D.C.; Ballinger, B.; Greig, C.; Smart, S.; McFarland, E. Hydrogen production using methane: Techno-economics of decarbonizing fuels and chemicals. Int. J. Hydrogen Energy 2018, 43, 2540–2555. [Google Scholar] [CrossRef]
  37. Gülen, S.C. Steam Turbine—Quo Vadis? Front. Energy Res. 2021, 8, 612731. [Google Scholar] [CrossRef]
  38. Global Average Levelised Cost of Hydrogen Production by Energy Source and Technology, 2019 and 2050; IEA: Paris, France, 2019.
  39. Sánchez-Bastardo, N.; Schlögl, R.; Ruland, H. Methane Pyrolysis for Zero-Emission Hydrogen Production: A Potential Bridge Technology from Fossil Fuels to a Renewable and Sustainable Hydrogen Economy. Ind. Eng. Chem. Res. 2021, 60, 11855–11881. [Google Scholar] [CrossRef]
  40. Commercial-Scale Methane Pyrolysis: The Key to Carbon-Negative Hydrogen. 2022. Available online: https://www.power-technology.com/sponsored/commercial-scale-methane-pyrolysis-the-key-to-carbon-negative-hydrogen/ (accessed on 7 May 2025).
Figure 1. Simplified process flowsheet for the production of 200 kta−1 H2 by methane pyrolysis.
Hydrogen 06 00066 g001
Figure 2. Liquid metal bubbling column reactor design for catalytic methane pyrolysis in molten metal and molten salt.
Hydrogen 06 00066 g002
Figure 3. Model of pyrolysis reactor as a cylinder, displaying volumes of metal, salt and gas, as well as reactor dimension.
Hydrogen 06 00066 g003
Figure 4. Purity of Salt from Different Salt Layers by Atomic Ratio.
Hydrogen 06 00066 g004
Figure 5. Two-Phase Continuous Process Diagram for the Methane Pyrolysis Reactor.
Hydrogen 06 00066 g005
Figure 6. Rendered CAD model of the reactor structure and associated heating/control system. Labels denote: A—Reactor body (molten metal/salt chamber for methane pyrolysis); B—Methane heat exchanger (preheats incoming feed gas); C—Coolant heat exchanger (removes excess heat from the salt loop); D—External gas heater (raises salt temperature to 1300 °C); and E—Salt circulation and pumping system (withdrawal, filtration, reinjection of NaBr phase).
Hydrogen 06 00066 g006
Figure 7. Process heat flows for case scenarios 1–4. (a) Case 1: NG-fired heater & flue burn. (b) Case 2: EAF & flue burn. (c) Case 3: NG-fired heater & recycling of the flue gases. (d) Case 4: EAF & recycling of the flue gases.
Hydrogen 06 00066 g007
Figure 8. Bare erected cost breakdown for case scenarios 1–4. (a) Case 1—$651M: NG-fired heater & flue burn. (b) Case 2—$580M: EAF & flue burn. (c) Case 3—$258M: NG-fired heater & recycling of the flue gases. (d) Case 4—$187M: EAF & recycling of the flue gases.
Hydrogen 06 00066 g008
Figure 9. Levelised cost of hydrogen for 200 kta−1 H2 output by methane pyrolysis across four case scenarios.
Hydrogen 06 00066 g009
Table 1. Process conditions for the production of hydrogen by methane pyrolysis in molten metal and salt.
LHVCH450.0 MJ/kg
LHVH2120.2 MJ/kg
H2 production capacity200 kta−1
Nickel-bismuth mole fractionNi0.27Bi0.73
Process Conditions
CH4 feed70 bar, 15 °C
Pre-pyrolysis sodium-bromide3 bar, 1300 °C
Pre-pyrolysis CH420 bar, 800 °C
Reactor vessel20 bar, 1100 °C
Equipment
PSA inlet conditions10 bar, 50 °C
PSA H2 purity99.999%
PSA recovery factor89%
Intermediate pressure (IP) steam turbine38 bar, 564 °C
Low pressure (LP) steam turbine3 bar, 229 °C
Product specifications
H2150 bar, 30 °C
Carbon black1 bar, 30 °C
Table 2. Comparison of molten metal alloy systems considered for methane pyrolysis.
Alloy SystemMelting Point (°C)CH4 Conversion EfficiencyCarbon Solubility (wt%)Estimated Cost (US$/kg)Remarks
Ni– Bi520–650High (90–95%)Moderate (0.3–0.5)15–18Widely studied benchmark alloy with good thermal stability and carbon separation characteristics
Cu–Sn230–300Moderate (60–75%)Low (0.1–0.2)9–11Cost-effective alternative with lower catalytic activity and carbon handling ability
Fe–Bi340–400Moderate (70–80%)Moderate (0.2–0.4)10–13Active at moderate temperatures, but more reactive with system components
Co–Bi410–460High (90–95%)High (0.5–0.6)25–30High activity and solubility; cost and volatility limit large-scale feasibility
Table 3. Parameters to model CH4 pyrolysis vessels and the surrounding 200 kta−1 H2 plant.
Setup properties
Specification methodPeng-Robinson
EstimationDo not estimate any parameters
H2 output design tolerance1%
Reactor inner dimensions
Height15.55 m
Diameter1.84 m
Volume41.3 m3
Reactor modelling
Reactor typeCSTR
Number of reactors24
Valid phasesVapour-Liquid
Condensed phase volume fraction0.5
Stoichiometry C H 4 ( g ) 2 H 2 ( g ) + C ( s )
Operating conditions20 bar, 1100 °C
Reactor volume ratios
Molten metal (NiBi)0.50
Molten salt (NaBr)0.25
Gas holdup0.25
Reaction rate kinetics
Melt phase reaction [14] k f , m = 7.2 × 10 6 e 207 R T
Gas phase reaction [19] k f , g = 3.8 × 10 13 e 392 R T
Auxiliary components
Heat exchangersCountercurrent
Compressor/TurbineIsentropic
Isentropic efficiency94%
Table 4. Thermodynamic plant performance indexes based on [21].
IndexUnitsMathematical Expression
H2 production efficiency[-] η H 2 = m ˙ H 2 · L H V H 2 m ˙ C H 4 · L H V C H 4
H2 yield[-] y H 2 = n ˙ H 2 n ˙ C H 4
Heat rate[MJ/kgH2]HRtot = ( m ˙ C H 4 · L H V C H 4 ) W e l m ˙ H 2
Process efficiency[-] η tot = L H V H 2 H R tot
CO2 intensity (H2)[kgCO2/kgH2]IH2 = m ˙ C O 2 m ˙ H 2
CO2 intensity (elec)[kgCO2/kWhe]ICO2 = m ˙ C O 2 W e l
Table 5. Parameters for the cost estimation of the bare erected costs, BEC.
EquipmentScaling ParameterS0C0 [M$]fCost YearCEPCIRef
PSA unitPurge gas flow [kmol/h]1706927.960.62007525.4[16]
H2 compressorPower [MWe]4250.70.822002395.6[23]
Steam cycleTurbine power [MWe]13661.50.672002395.6[24]
Flue gas burnerHeat duty [MWth]20.633.830.62021708[16]
Flue compressorPower [MWe]4250.70.822002395.6[23]
Electric arc furnacePower [MWe]175440.62016541.7[12]
NG-fired heaterVessel volume [m3]81.340.680.62017567[12]
Solids heat exchangerSolids capacity [tonne/h]119510.2950.62016541.7[25]
Fluids heat exchangerHeat duty [MMBtu/h]659.912.790.62006499.6[26]
PumpsPower [MWe]0.07450.02060.61999390.6[27]
Table 6. Method for the calculation of capital expenditure, CAPEX, adapted from [22,28].
Cost ComponentExpression
Total bare erected costs (TBEC) C1 + C2 + C3 + … + Cn
Direct costs as a percentage of TBEC
Total installation costs (TIC)80% TBEC
Total direct plant costs (TDPC)TBEC + TIC
Indirect costs (IC)14% TDPC
Engineering, procurement and construction cost (EPCC)TDPC + IC
Contingencies and owner’s costs (C&OC)
Contingency10% EPCC
Owner’s cost5% EPCC
Total C & OC15% EPCC
Total capital expenditure (CAPEX) EPCC + C&OC
Total as spent capital (TASC) 109.3% CAPEX
Table 7. Cost assumptions for the calculation of fixed and variable operating expenditure, OPEX (base case).
CostUnitReference
Fixed OPEX
Labour1.50M$[16]
Maintenance2.50% CAPEX[16]
Insurance2.00% CAPEX[16]
Variable OPEX
Methane (CH4)5.00$/MMBtu[29]
Electricity50$/MWh[30]
Nickel29.8$/kg[31]
Bismuth16.1$/kg[32]
Sodium-bromide1$/kg[33]
CO2 tax75$/tonneCO2[34]
Carbon black−300$/tonne[35]
Table 8. Economic assumptions for the calculation of the levelised cost of hydrogen, LCOH [22].
CAPEX period3 years
Operational peiod30 years
Fixed charge rate, FCR0.0707
Total as spent capital, TASC109.3% CAPEX
Capacity factor0.9
Equivalent working hours, heq7884 h
Table 9. Case-by-case thermodynamic performance according to performance indexes.
UnitCase 1:Case 2:Case 3:Case 4:
CH4 input[kta−1]262422791092785
H2 output[kta−1]200200200200
C(s) output[kta−1]697697599599
CH4 thermal input[MWLHVCH4]4237368117631269
H2 thermal output[MWLHVH2]764.4764.4764.4764.4
Power breakdown
Electric arc furnace[MWe]-−278.4-−247.2
Flue compressor[MWe]--−16.9−16.9
H2 compressor[MWe]−38.6−38.6−38.6−38.6
Pumps[MWe]−3.04−3.04−3.04−3.04
Steam cycles[MWe]1082.01082.046.146.1
Net electric power, Wel[MWe]1040.4762.0−10.7−257.9
Performance indexes
H2 efficiency, η H 2 (LHVH2/LHVCH4)0.180.210.430.60
H2 yield, yH2( n ˙ H2/ n ˙ CH4)0.600.691.442.00
Heat rate, HRtot[MJLHVH2/kgH2]502458278240
Process efficiency, η tot (%)23.926.243.150.1
CO2 intensity (H2), IH2(kgCO2/kgH2)24.619.84.27-
CO2 intensity (elec), Ie[kgCO2/kWhe]0.540.60--
Table 10. Cost breakdown of BEC, OPEX and LCOH by case scenario.
Case 1:Case 2:Case 3:Case 4:
BEC [M$] (% BEC)
Pyrolysis vessels19.63 (3.0%)19.63 (3.4%)19.63 (7.6%)19.63 (10.5%)
PSA units20.61 (3.2%)20.61 (3.6%)18.54 (7.2%)18.54 (9.9%)
H2 compressors26.65 (4.1%)26.65 (4.6%)26.65 (10.3%)26.65 (14.2%)
Steam cycle187.99 (28.9%)187.99 (32.4%)28.72 (11.1%)28.72 (15.3%)
Flue gas burners202.94 (31.2%)202.94 (35.0%)--
Flue compressors--13.54 (5.3%)13.54 (7.2%)
Electric arc furnaces-48.98 (8.4%)-48.98 (26.2%)
NG-fired heaters119.50 (18.4%)-119.50 (46.4%)-
Solids heat exchanger2.62 (0.4%)2.62 (0.5%)2.40 (0.9%)2.40 (1.3%)
Fluids heat exchangers70.31 (10.8%)70.31 (12.1%)28.67 (11.1%)28.67 (15.3%)
Pumps0.33 (0.1%)0.33 (0.1%)0.16 (0.1%)0.16 (0.1%)
Fixed OPEX [M$/y]71.2263.6629.1121.56
Variable OPEX [M$/y]
CH4596.66518.26248.22178.60
Electricity−455.69−333.754.69112.96
Nickel12.4712.4712.4712.47
Bismuth64.8664.8664.8664.86
Sodium-bromide10.0210.028.908.90
CO2 tax370.77298.3464.310.00
Carbon black−209.19−209.19−179.67−179.67
Total BEC [M$]650.57580.06257.80187.28
Total CAPEX [M$]1535.231368.82608.35441.94
Total OPEX [M$/y]389.90361.01223.78198.12
LCOH [$/kgH2]2.99 2.73 1.53 1.29
Table 11. Parameters for sensitivity analysis on the LCOH.
ParameterUnitBase Case ValueRange
CH4 price$/MMBtu5.003.00–8.00
Electricity price$/MWh5020–100
CO2 tax$/tonne7525–125
Carbon sale price$/tonne3000–600
Steam cycle efficiency%4535–55
NiBi lifetimeyears10.2–10
Disclaimer/Publisher’s Note: The statements, opinions and data contained in all publications are solely those of the individual author(s) and contributor(s) and not of MDPI and/or the editor(s). MDPI and/or the editor(s) disclaim responsibility for any injury to people or property resulting from any ideas, methods, instructions or products referred to in the content.