1. Introduction
Hydrogen has gained significant traction as a clean and efficient energy carrier in the global pursuit of carbon-neutral energy systems. Its high gravimetric energy density and zero-emission characteristics render it especially suitable for mobility and transport applications. Among various hydrogen storage technologies, Type IV composite overwrapped pressure vessels (COPVs)—featuring a polymer liner reinforced with high-strength fibers such as carbon, aramid (Kevlar), or glass within an epoxy matrix—are considered the most advanced due to their exceptional specific strength, corrosion resistance, and fatigue performance [
1,
2].
These vessels are typically designed to withstand nominal pressures of up to 70 MPa, where even minor manufacturing defects or service-induced damage can lead to catastrophic failures. Consequently, their design, manufacturing, and validation are regulated under rigorous international safety standards [
3], including ISO 19881 [
4], UN GTR No. 13 [
5], ECE R-134 [
6], KHKS [
7], and KGS [
8].
To accelerate the deployment of hydrogen-powered light-duty vehicles, the U.S. Department of Energy (DOE) has set a series of technical targets for onboard hydrogen storage systems. By 2025, these targets include achieving a gravimetric hydrogen capacity of 5.5 wt% and a volumetric capacity of 0.040 kg-H
2/L, with ultimate goals reaching 7.5 wt% and 0.070 kg-H
2/L, respectively. Additional requirements encompass a system cost below USD 333/kg-H
2, durability over 1500 full fill cycles, refueling within 3.3 min (for 5 kg H
2), and the ability to operate at pressures up to 82 MPa (
Table 1) [
9,
10]. Meeting these targets necessitates highly optimized composite vessel structures capable of withstanding diverse mechanical and environmental loading conditions.
Despite substantial efforts focused on modeling burst behavior under internal pressure, there is a noticeable lack of comprehensive evaluations under other standardized safety conditions. Prior research has successfully validated finite element (FE) models for burst failure [
11], developed high-fidelity material models for high-pressure environments [
12], introduced dome reinforcements to modify rupture zones [
13], and optimized fiber winding angles for weight reduction [
14]. More recently, advancements have included the application of genetic algorithms for layup sequence optimization [
15], improved dome reinforcement designs [
16], studies on liner degradation due to aging and interfacial weakening [
17], and proposals for cross-compatible structural evaluation frameworks [
18].
However, most of these investigations are confined to internal pressurization scenarios and do not sufficiently address real-world load cases such as axial preload, plug torque, low-velocity impact, or inclined drop conditions. These loadings are critical for safety validation and are mandated by regulatory protocols, yet remain underexplored in modeling practice.
To address this limitation, the present study proposes an integrated finite element analysis (FEA) framework that encompasses a full spectrum of safety-critical loading scenarios. This includes burst, axial compression, plug torque, low-velocity impact, and drop simulations, allowing for consistent structural evaluations across all standardized test conditions. The primary contribution of this work lies in broadening the scope of structural integrity assessment for hydrogen pressure vessels, by systematically identifying stress concentrations and failure-prone regions under diverse operational loads. These insights are intended to inform structural design improvements and enable the early-stage digital certification of next-generation hydrogen storage systems.
2. Finite Element Analysis (FEA) of Type IV COPV
To thoroughly assess the structural robustness of Type IV COPVs under multiple regulatory loading scenarios, a set of FEA models was constructed. The simulations encompassed critical safety tests, including burst, plug torque, axial compression, impact, and drop loading. Each test was modeled to reflect realistic boundary and load conditions, enabling an accurate prediction of vessel response under standardized evaluation protocols.
2.1. Modeling Approach
2.1.1. Geometric Design
The structural configuration of the COPV was developed based on Netting Theory [
19], wherein both 90° hoop and ±
θ helical fiber plies are assumed to carry the internal pressure load
P. The force equilibrium in the cylindrical section is given by
where
R is the radius of the cylindrical wall,
is the allowable tensile strength of the fiber, and
and
are the respective thicknesses of the helical and hoop layers. Rearranging Equation (1) provides the required ply thicknesses:
These analytical relations were used to define the ply structure in a 3D FEA model constructed using ABAQUS [
20,
21].
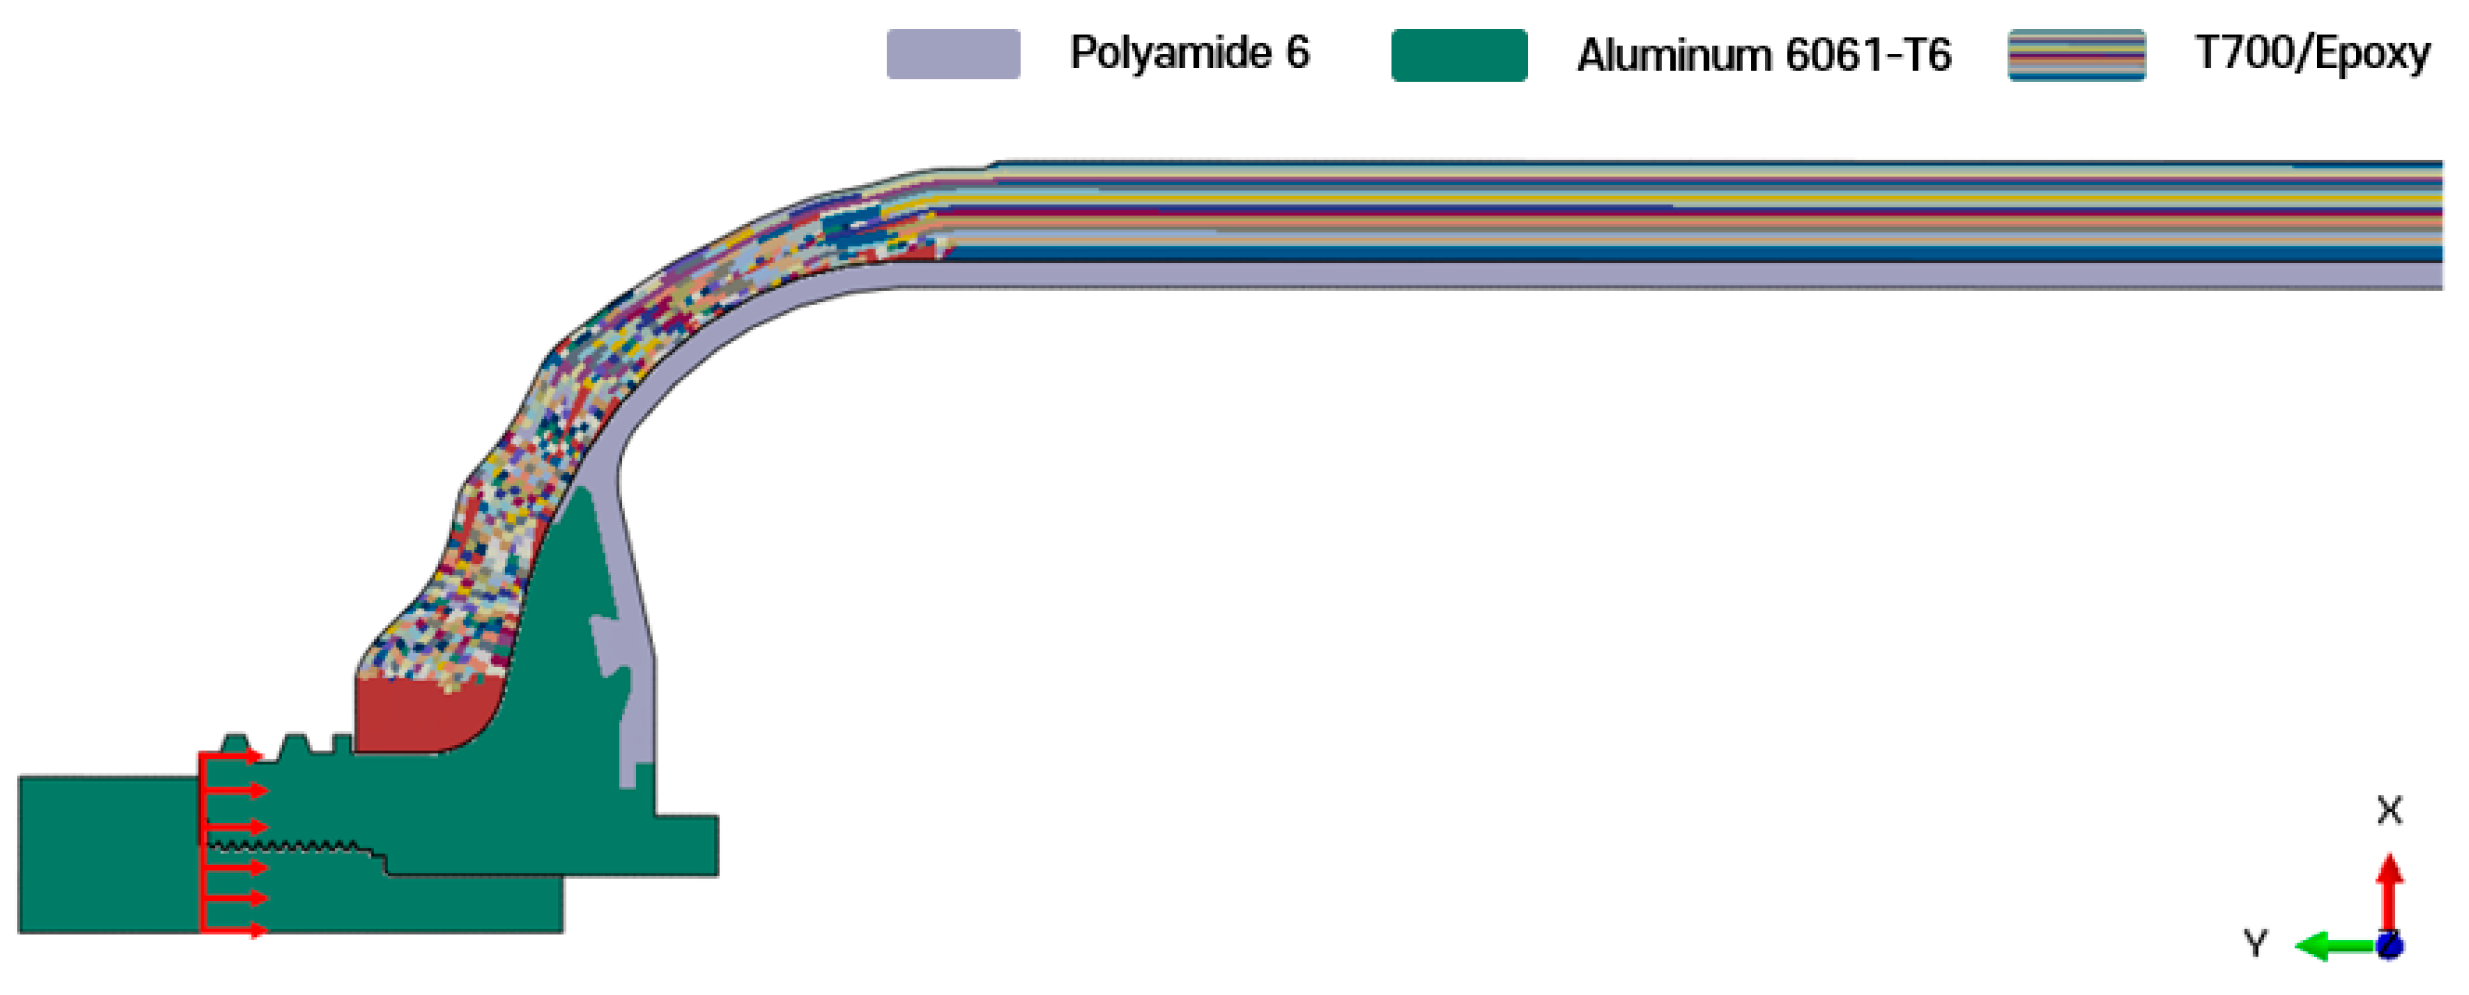
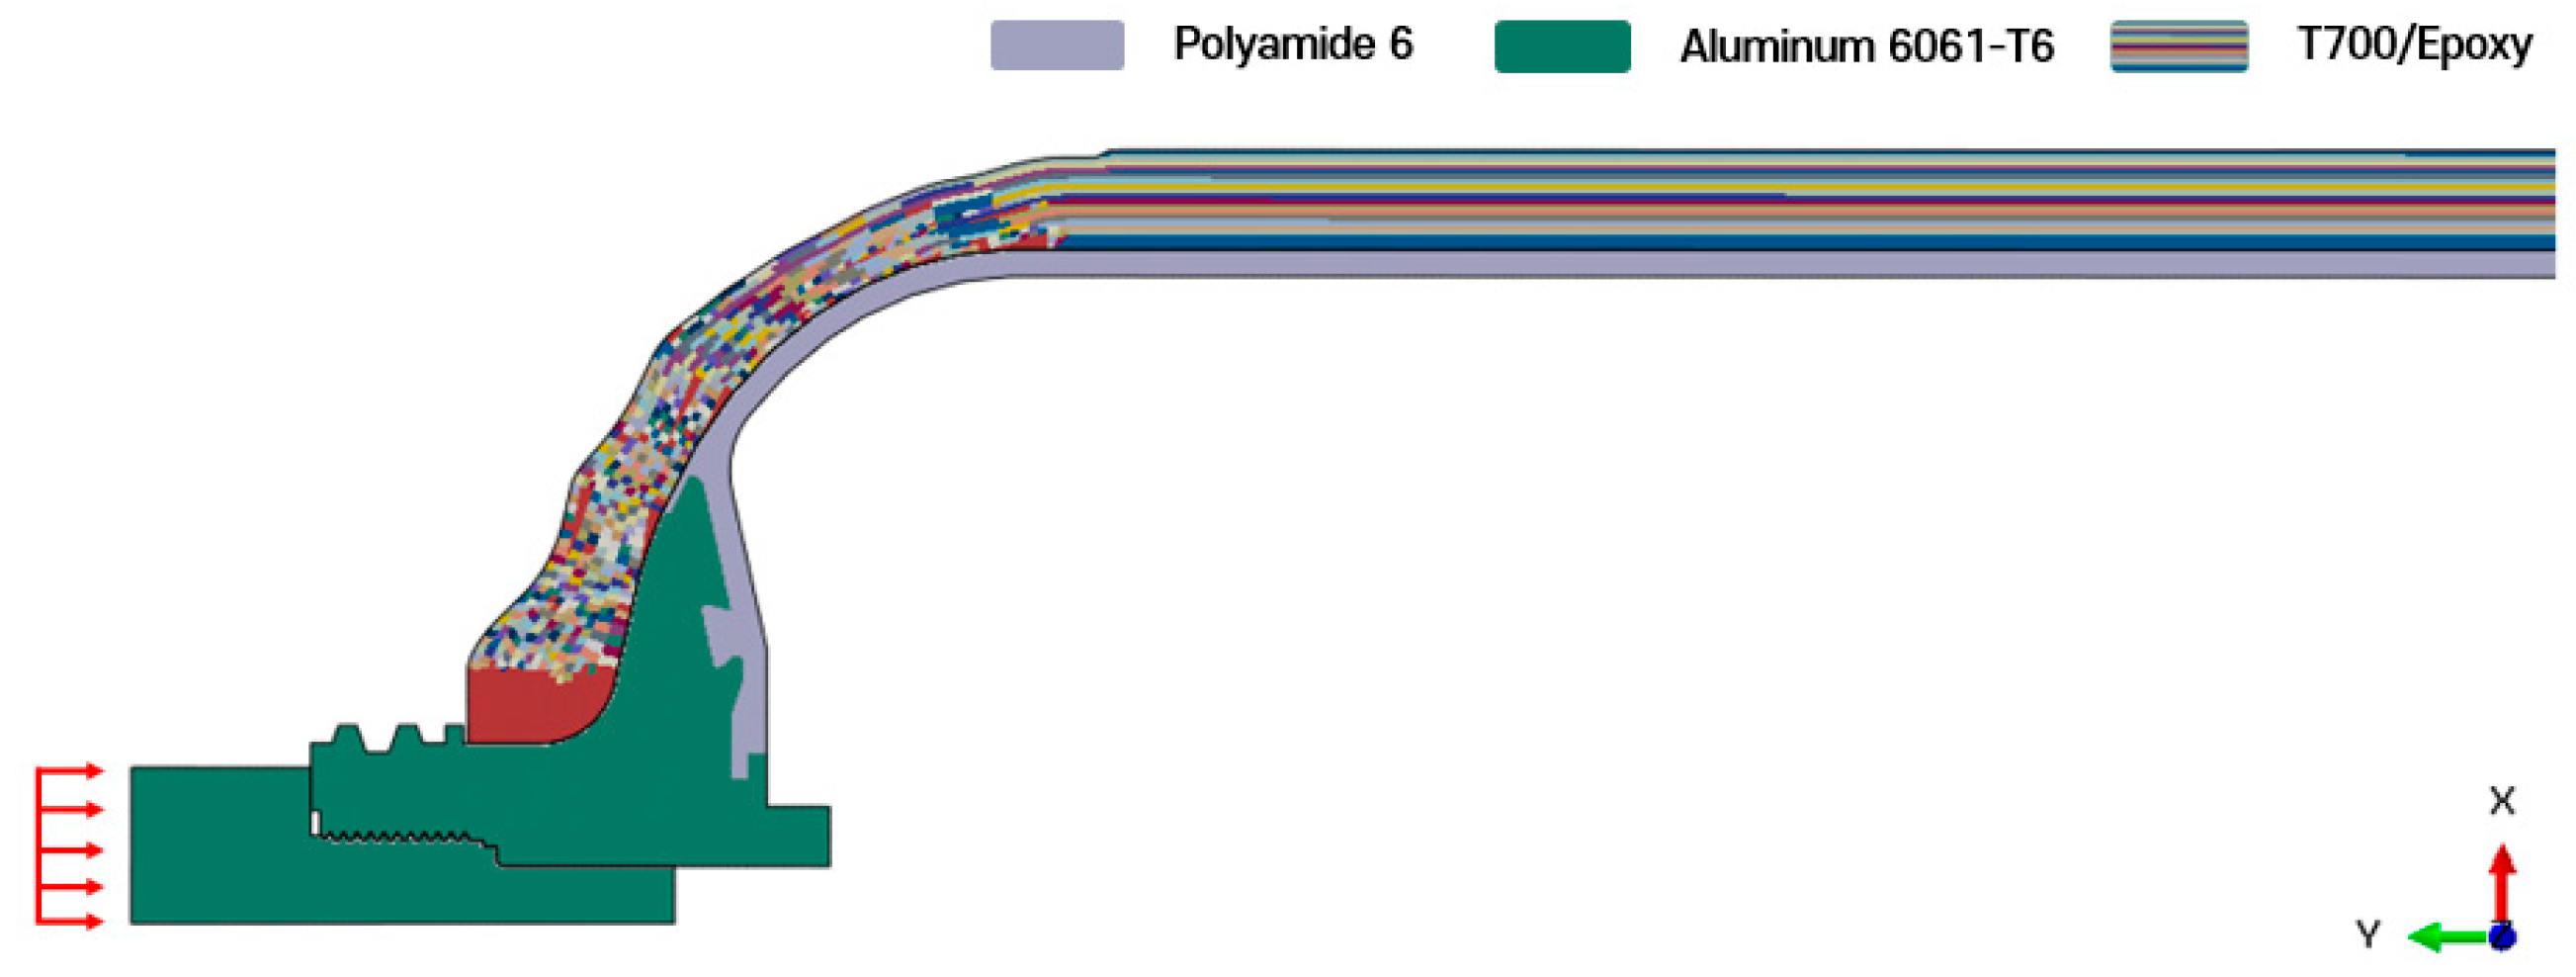
As shown in
Figure 1, the reference geometry includes a polymer liner with an outer radius of 74.9 mm and a half axial length of 742.5 mm. Detailed geometric parameters of the nozzle boss and liner are restricted under a non-disclosure agreement (NDA). The composite overwrap was generated via ABAQUS-WoundSim [
22] and consists of 18 plies, yielding a total shell thickness of approximately 11 mm. Each ±
θ helical ply is ~0.62 mm thick, while each 90° hoop ply is ~0.31 mm thick. The layup sequence is illustrated in
Figure 2.
Material properties for the aluminum boss (Al 6061-T6) and the polyamide liner (PA6) are summarized in
Table 2. These values were obtained from mechanical testing conducted by Iljin Hysolus Co., Ltd., Wanju, Republic of Korea. and are provided under confidentiality provisions.
2.1.2. Mesh Strategy and Element Quality Assessment
To assess mesh sensitivity and its influence on stress predictions, a reduced FEA model composed only of the PA6 liner and Al boss was subjected to a static internal pressure of 1 MPa. Four global seed sizes—2.0, 1.5, 1.0, and 0.5 mm—were tested, as illustrated in
Figure 3, and the corresponding mesh convergence data are summarized in
Table 3.
Refinement from 1.0 mm to 0.5 mm altered the von Mises stress in the Al boss by less than 0.3%, and the PA6 liner by less than 2%, while the computation time increased by nearly 24-fold. A significant increase in stress was observed between 1.5 mm and 1.0 mm mesh sizes, attributed to the inadequate resolution of high-curvature regions such as filets and sharp corners in the coarser meshes.
Based on the trade-off between numerical accuracy and computational cost, a global seed size of 1.0 mm was adopted for all simulations. This setting was applied using the by-size meshing strategy in ABAQUS. Curvature control was enabled using a maximum deviation factor of 0.1 and a minimum element-size factor of 0.1, ensuring element quality in both low- and high-curvature regions.
Figure 4 shows the final meshed COPV model, which served as the baseline for all subsequent simulations across various safety scenarios, with boundary and loading conditions tailored accordingly.
2.2. Burst Pressure Test
2.2.1. Test Procedure and Simulation Setup
The burst test is a fundamental qualification protocol designed to evaluate the ultimate structural capacity of high-pressure vessels. In this procedure, the COPV is gradually filled with water at ambient temperature and pressurized until rupture occurs [
23]. The use of water, an incompressible fluid, ensures minimal stored energy, thereby providing a clear representation of material failure in the liner, bosses, and composite under quasi-static conditions.
For numerical analysis, the baseline three-dimensional COPV model was simplified into a two-dimensional axisymmetric representation and analyzed using ABAQUS/Standard. The model employed four-node, reduced-integration axisymmetric elements (CAX4R), resulting in 30,393 nodes and 28,781 elements. An internal pressure of 157.5 MPa—equivalent to 2.25 times the nominal working pressure of 70 MPa—was applied uniformly along the inner surface of the liner, in compliance with ISO 19881 and UN GTR No. 13 safety standards.
To replicate experimental boundary conditions, one end of the boss was fully constrained while the opposite end remained free, allowing for realistic vessel deformation. All remaining external surfaces were treated as traction-free boundaries. The full axisymmetric finite element model used for this simulation is illustrated in
Figure 5.
2.2.2. Simulation Results
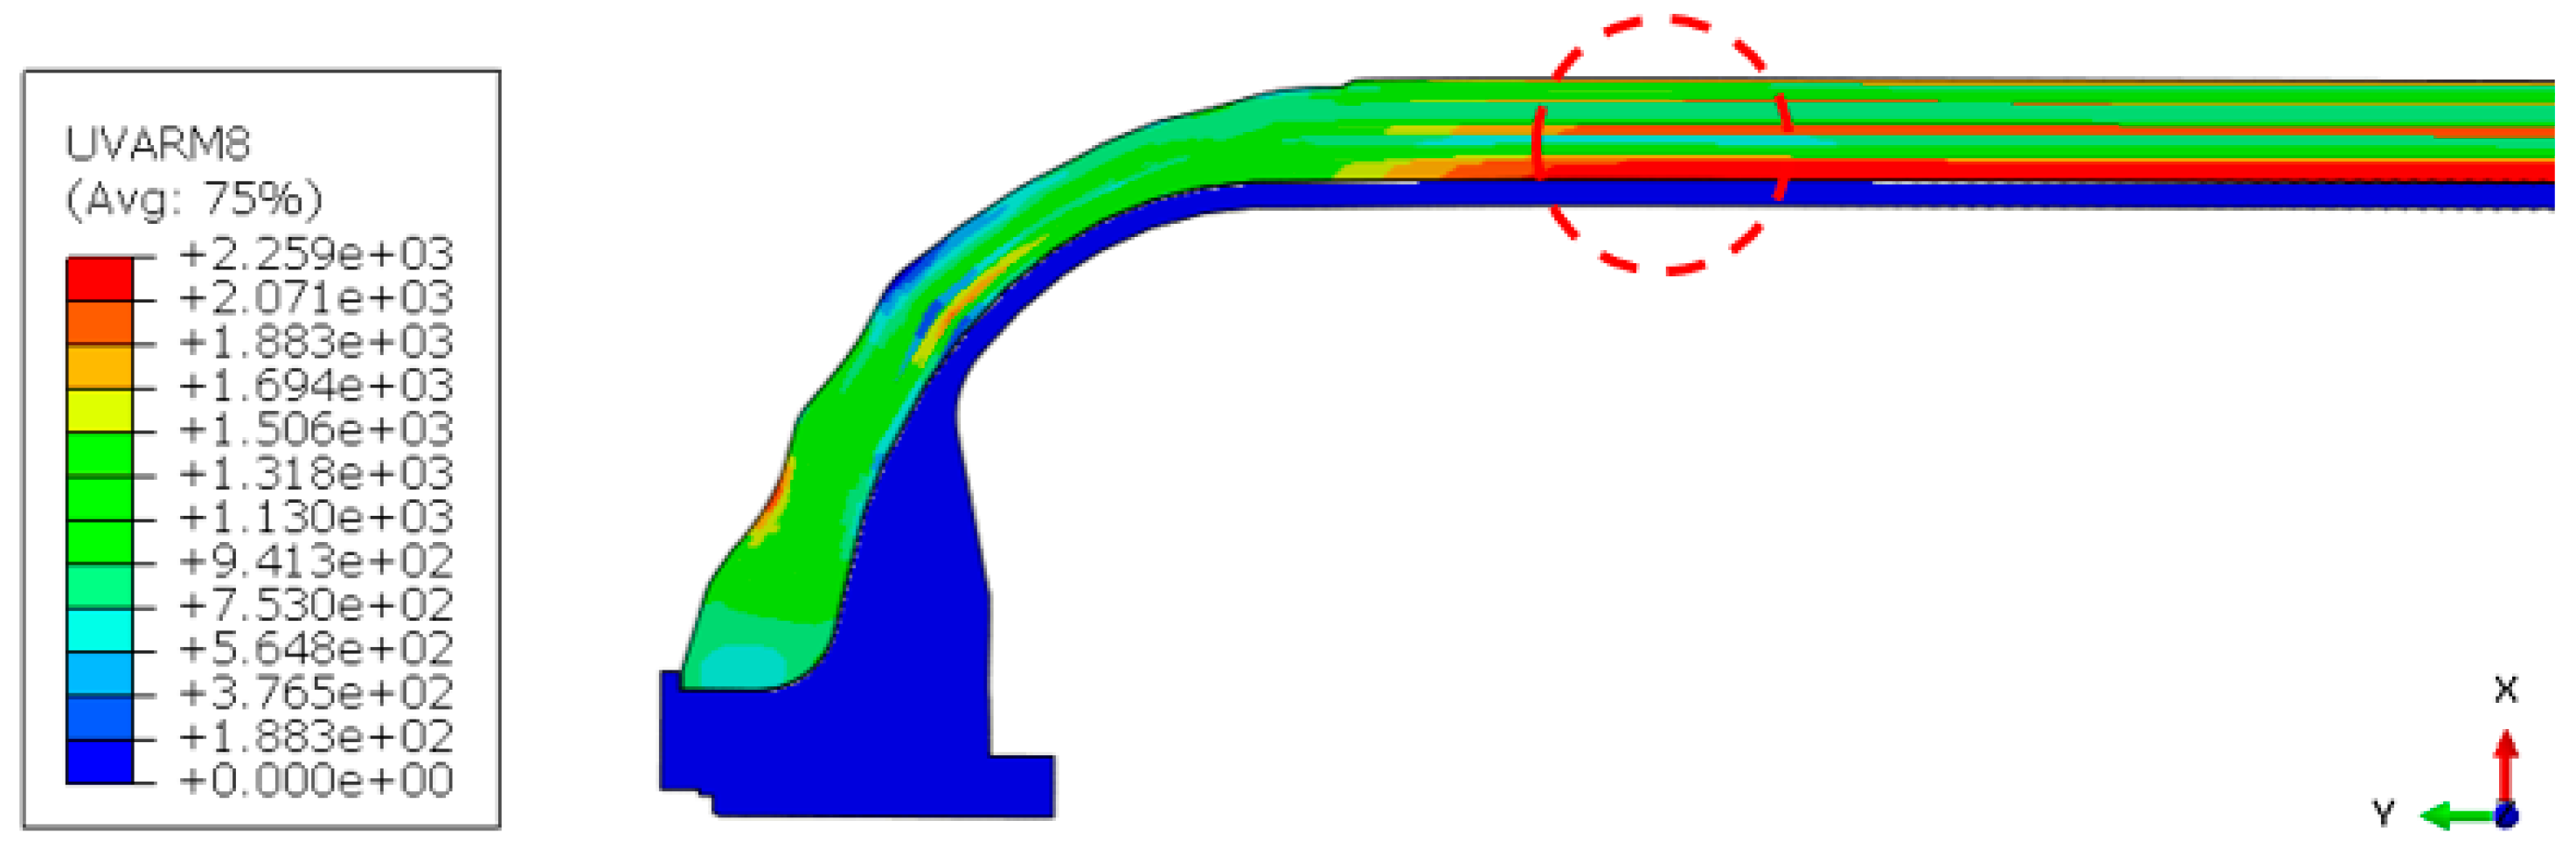
The FEA results revealed that the maximum fiber-direction tensile stress occurred within the cylindrical section of the composite overwrap, reaching a peak value of 2259 MPa under the burst pressure condition (see
Figure 6). This stress level remained below the tensile failure limit of carbon fiber (~2550 MPa), confirming that the structure satisfies safety requirements under the specified loading.
In real-world failures, rupture initiation often occurs in regions such as the dome or knuckle, which can lead to boss detachment and hazardous outcomes. By contrast, failure in the cylindrical section typically manifests as a longitudinal split along the vessel axis, enabling vertical hydrogen venting. This axial rupture mode is considered structurally favorable, as it facilitates controlled energy release and significantly mitigates explosive risk.
The stress concentration observed in the hoop direction is attributed to the greater radial compliance of the composite compared to its axial stiffness. These results are consistent with prior findings [
13], which emphasize the importance of adjusting the hoop-to-axial stiffness ratio to manipulate rupture behavior. Accordingly, introducing localized reinforcement in critical transition zones—such as the dome-to-cylinder interface—could further enhance burst performance and improve structural integrity.
2.3. Plug Torque Test
2.3.1. Test Procedure and Simulation Setup
The plug torque test investigates the vessel’s structural response under the combined action of mechanical tightening and internal pressure, which may induce significant localized stress concentrations near the boss–plug interface. During the procedure, the vessel is rotationally constrained while threaded plugs are installed into the nozzle bosses using a predefined torque value. Internal pressure is then applied to simulate operational loading, generating coupled stresses in the PA6 liner, Al boss, and composite.
To simulate this loading sequence, a two-step finite element analysis (FEA) was carried out using ABAQUS/Standard. The two-dimensional axisymmetric model developed for the burst simulation was updated to incorporate aluminum plug geometry at the interior faces of both upper and lower bosses. This adjustment ensures accurate contact behavior and load transfer representation. The model employed four-node, reduced-integration axisymmetric elements (CAX4R) and comprised 30,393 nodes and 28,346 elements. The final model configuration is shown in
Figure 7.
The simulation was performed in two sequential steps:
Step 1: Axial preload application to replicate plug tightening;
Step 2: Application of uniform internal pressure (70 MPa) to simulate service loading.
The axial preload
in Step 1 was calculated using the standard torque-preload equation [
24]:
where
T = 120 N·m: applied torque;
k = 0.20: torque coefficient; and
d = 20.325 mm: nominal thread diameter (M20 × 1.5 ISO, Class 6H, ISO 261/965 [
25,
26]).
Substituting the values yields
In Step 2, the vessel was subjected to a uniform internal pressure of 70 MPa, consistent with its rated service conditions. This simulation framework enables a coupled mechanical–hydraulic stress evaluation, particularly in the threaded regions, which are prone to failure under combined loading modes.
2.3.2. Simulation Results
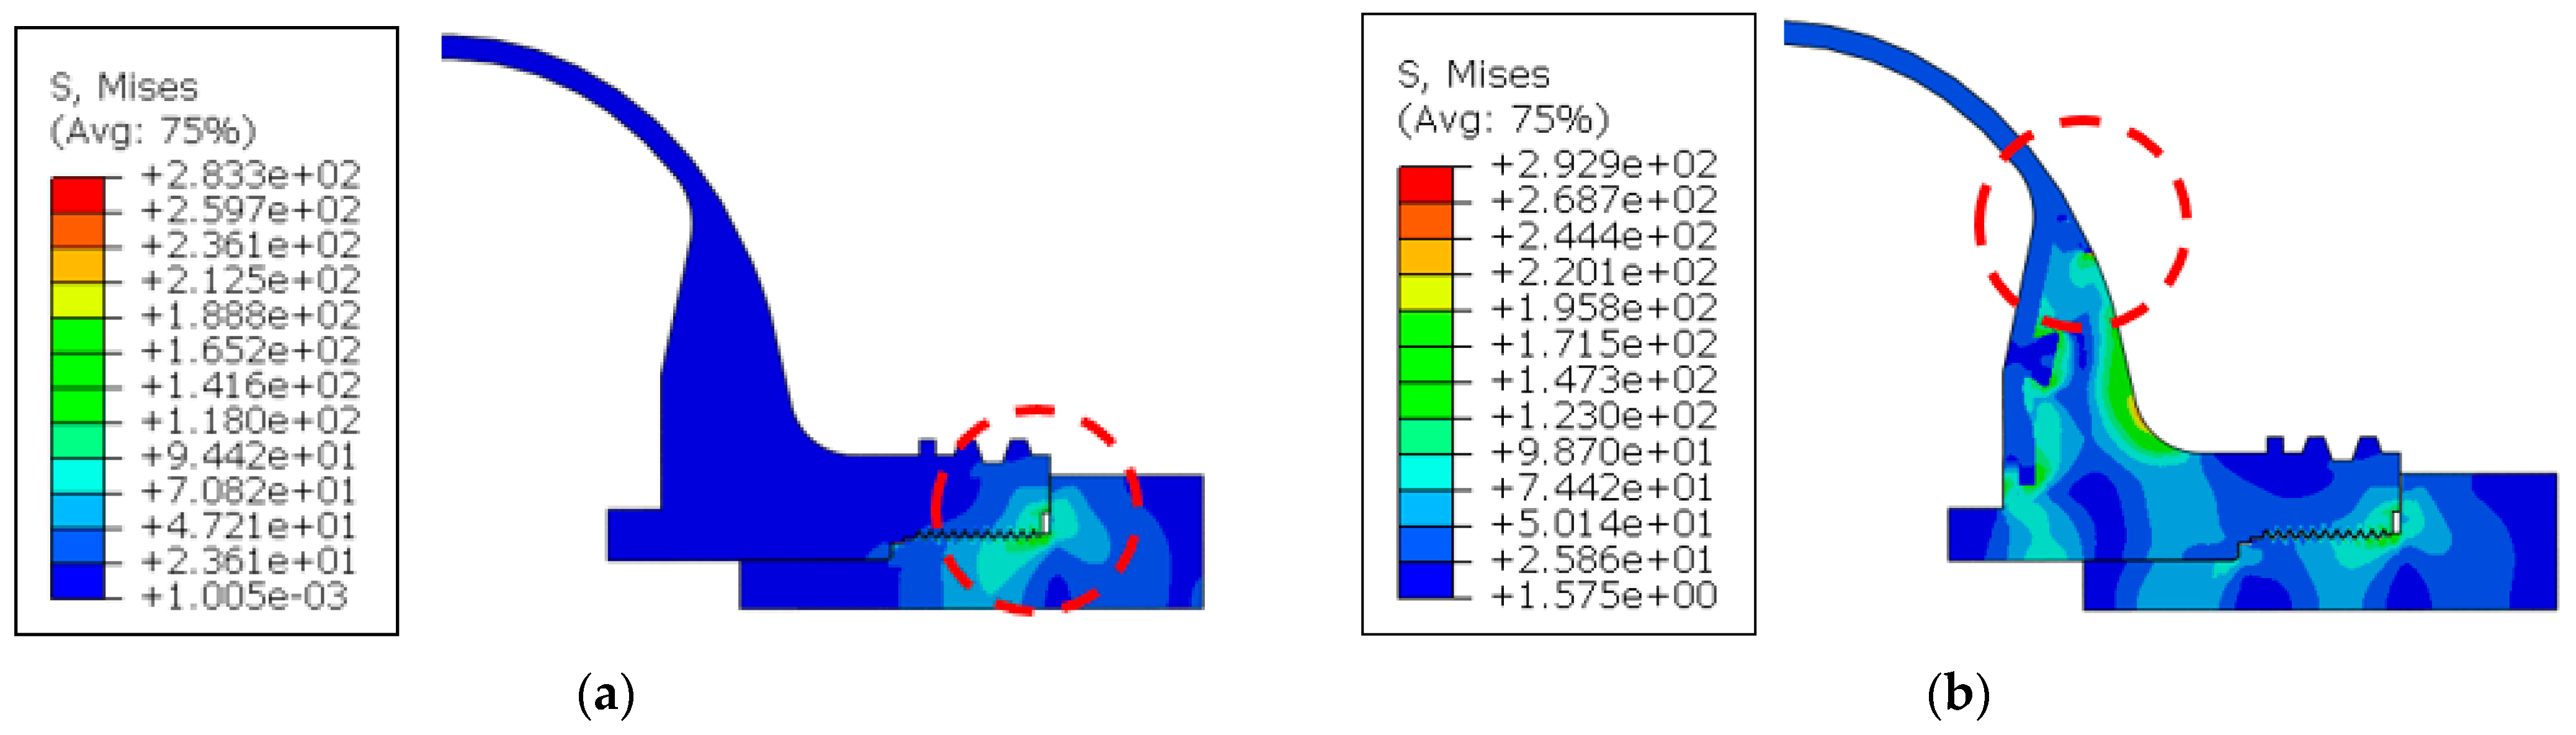
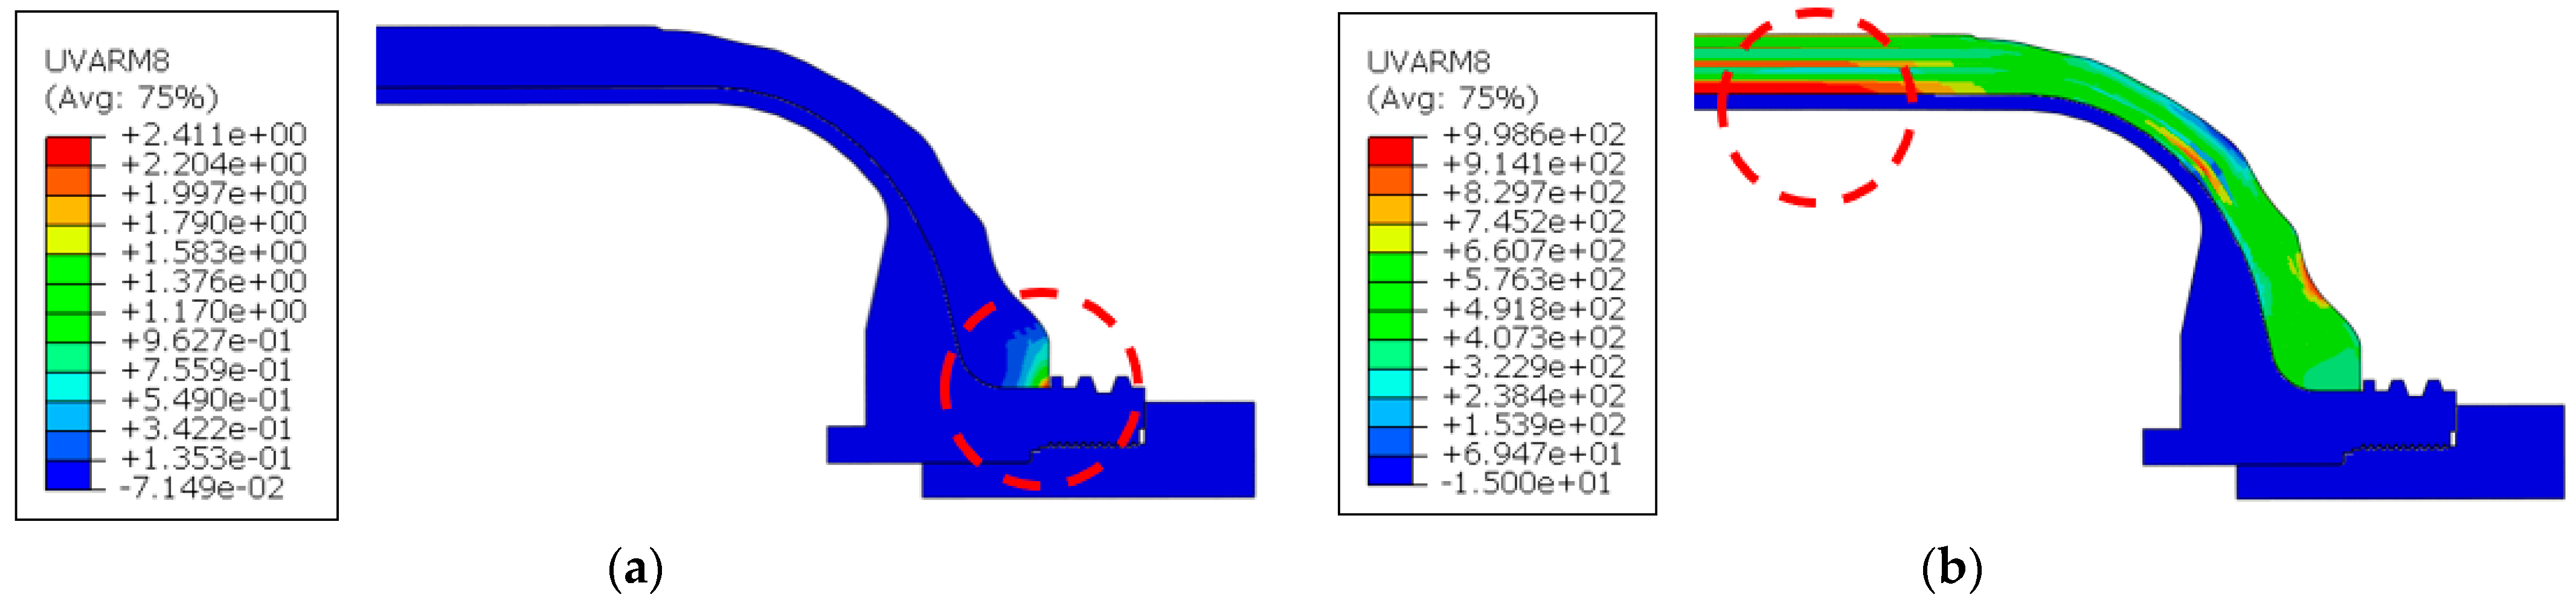
The plug torque simulation revealed that the maximum von Mises stress in the plug and Al boss regions reached 283.3 MPa during Step 1 (plug tightening) and increased to 292.9 MPa in Step 2 (internal pressurization). In the composite, fiber-direction tensile stress was relatively low at 2.41 MPa during tightening but escalated to 998.6 MPa under service pressure, as illustrated in
Figure 8 and
Figure 9.
The stress concentration observed in Step 1 was attributed to compressive contact between the plug and the composite edge, which aligns with the localized axial compression mechanism. In Step 2, excluding the threaded interface and the immediate nozzle–liner transition, the highest stresses were localized in the boss–neck region. This localization is primarily caused by a bending moment induced by an abrupt thickness transition in the boss and radial expansion of the liner.
The mismatch in stiffness between the ductile Al boss and the stiffer composite further amplifies interface stresses.
Figure 10 magnifies the stress state in the boss–neck region under 70 MPa of pressure, highlighting two key features: (i) the peak von Mises stress (shown in red contours), and (ii) the directional stress flow (indicated by yellow vectors) carried from the dome curvature into the boss–neck due to internal pressure-driven bending and radial expansion.
2.4. Axial Load Test
2.4.1. Test Procedure and Simulation Setup
The axial load test evaluates the structural performance of a Type IV COPV under longitudinal compressive loading. This scenario replicates real-world operational and handling conditions, such as installation, lifting, or impact events, where substantial axial forces may be transferred through the plug assembly.
While similar to the plug torque test, this procedure omits the torque-induced preload. Instead, a direct compressive load is applied axially to the top surface of the plug, followed by internal pressurization. This sequential approach enables an evaluation of combined mechanical and hydraulic stresses acting on the PA6 liner, Al boss, and composite.
The FEA model from
Section 2.3 was reused, with boundary conditions updated to reflect axial compression. The simulation proceeded in two consecutive steps:
The updated simulation configuration is presented in
Figure 11.
This setup facilitates the investigation of coupled stress phenomena, particularly in the transition region between the Al boss and composite. The analysis provides insight into how longitudinal compressive loading affects structural integrity at critical interfaces under compound load conditions.
2.4.2. Simulation Results
Under axial compression (Step 1), the maximum von Mises stress in the plug and Al boss reached 388.6 MPa. Following the application of internal pressure (Step 2), the peak stress in these regions decreased to 296.6 MPa, as the internal pressure offset a portion of the compressive load. In the composite, the fiber-direction tensile stress reached 289.3 MPa during Step 1 and rose sharply to 991.7 MPa under Step 2, as illustrated in
Figure 12 and
Figure 13.
These trends are consistent with the plug torque simulation, highlighting that axial preload induces localized deformation in the Al boss and amplifies stress at the boss–composite interface. In Step 2, the introduction of hoop stress resulted in a stress concentration shift toward the boss–neck region, driven by local bending caused by abrupt geometric transitions. The mismatch in stiffness between the ductile boss and stiffer composite exacerbated this stress amplification.
Additionally, axial loading led to elevated stress near the dome–cylinder junction, a geometrically sensitive area prone to curvature-induced strain accumulation. Compared to torque-only scenarios, axial compression generated more severe interaction effects at critical interfaces, especially between the boss and composite.
Based on these results, stress mitigation may be achieved by optimizing the winding angle and thickness of the composite in the dome region and refining the boss–neck geometry. These design strategies can enhance structural safety under compound mechanical and pressure loads.
2.5. Impact Test
2.5.1. Test Procedure and Simulation Setup
The impact test is designed to evaluate the dynamic structural resilience of a Type IV COPV subjected to accidental loading conditions such as velocity collisions. In the experimental configuration, the vessel is rigidly fixed at both boss ends to mimic in-service constraints, and a spherical impactor is launched perpendicular to the vessel’s longitudinal axis to induce localized deformation under dynamic contact.
To replicate this event numerically, a transient explicit dynamic analysis was performed using ABAQUS/Explicit. Owing to the inherently asymmetric loading conditions, the previously adopted axisymmetric shell models were insufficient. Instead, a full 360° three-dimensional solid model was constructed, incorporating the PA6 liner, Al bosses, and composite. Reduced-integration brick elements (C3D8R) were employed to maintain accuracy while minimizing computational cost. A small pre-contact clearance of 0.01 mm was defined between the impactor and vessel surface.
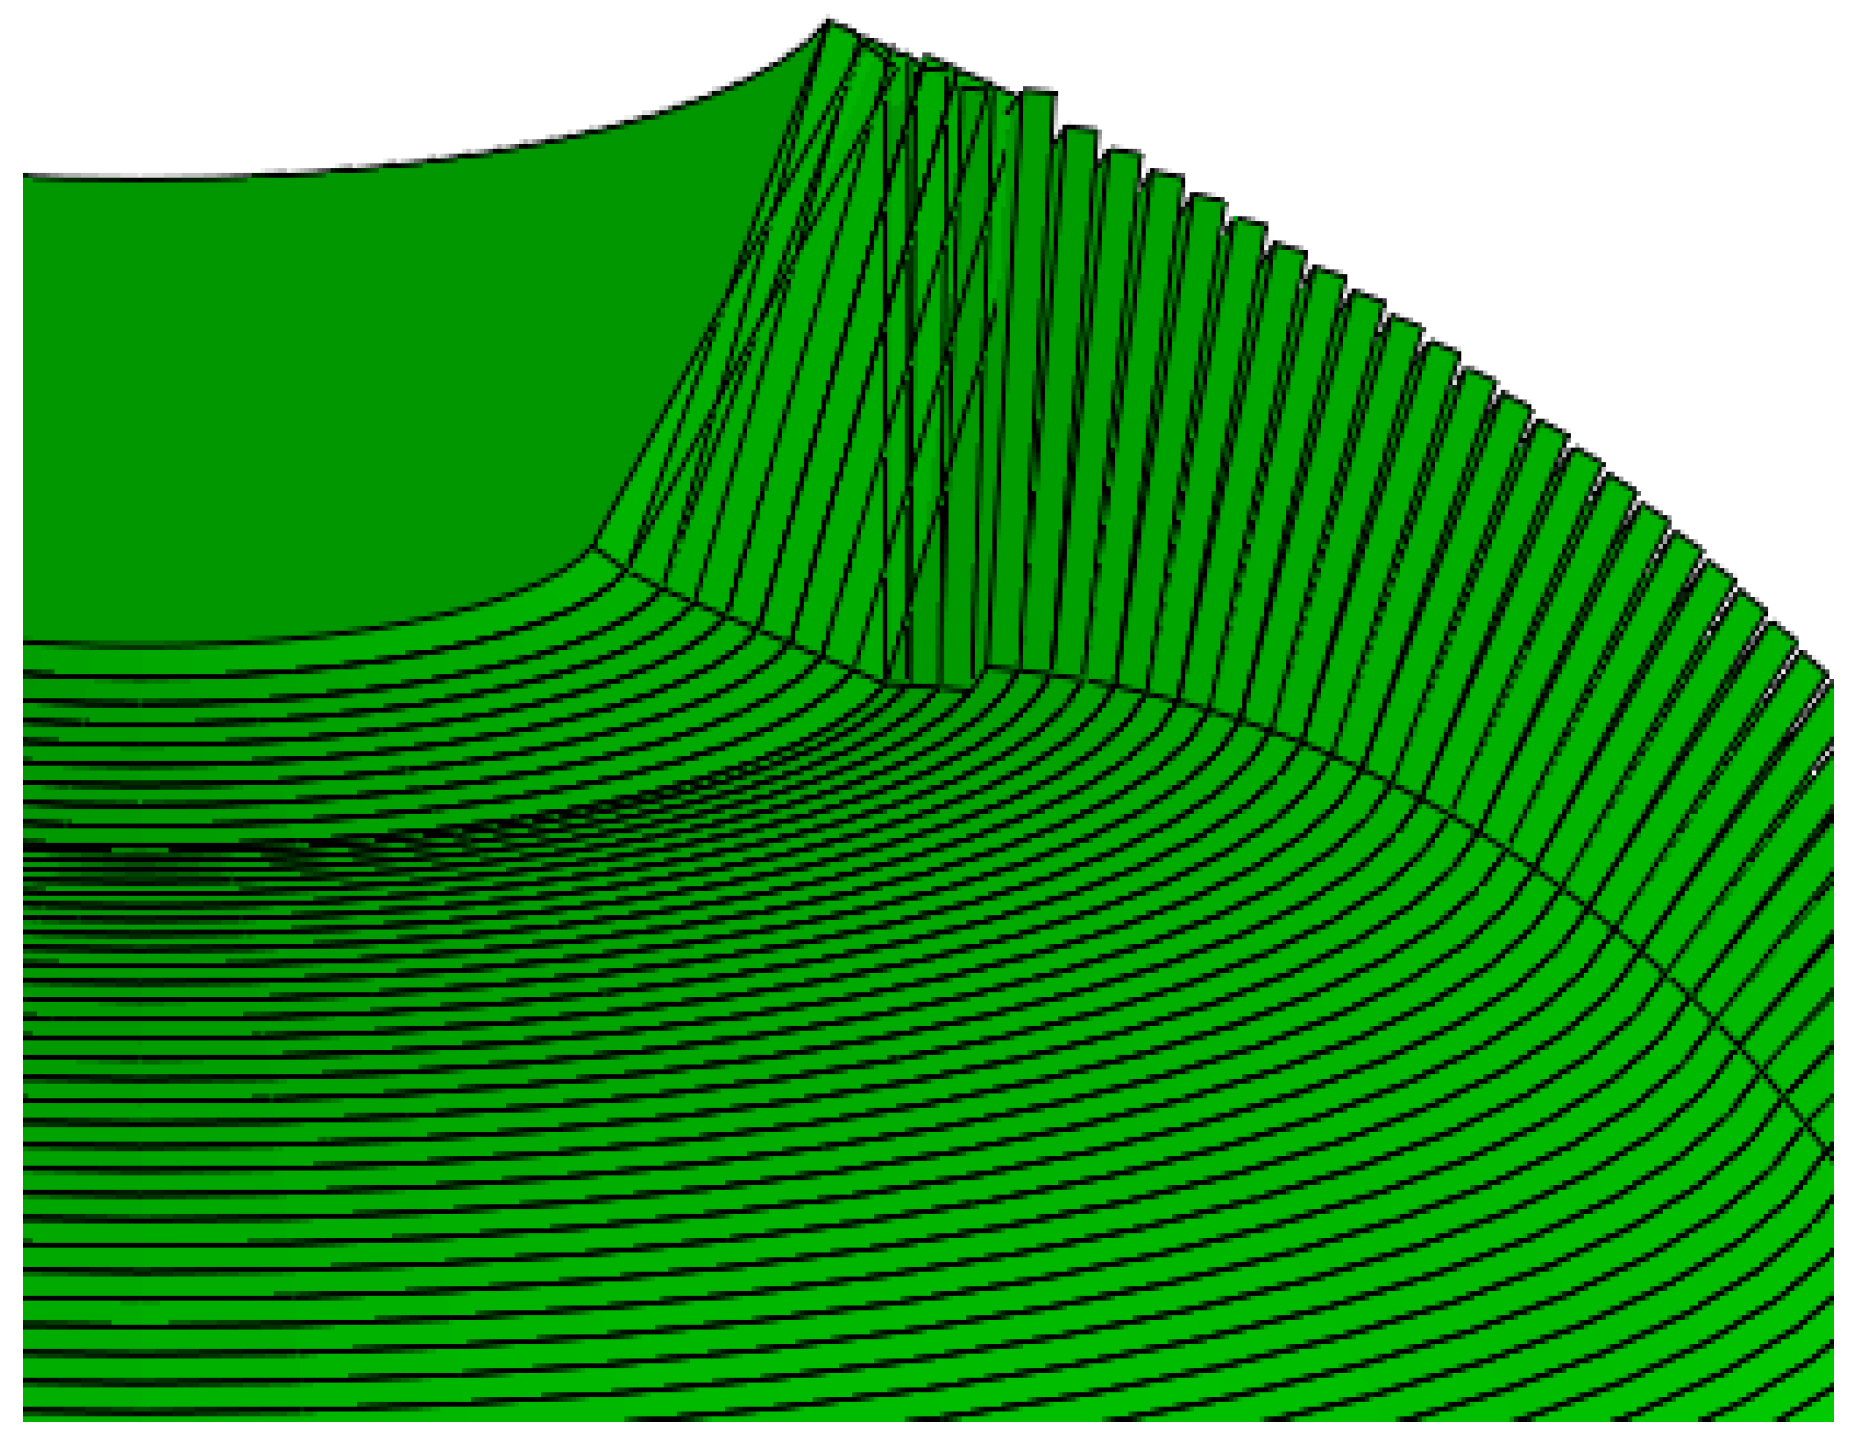
Although shell-based axisymmetric models offer computational efficiency, they fail to accurately resolve geometric discontinuities at the dome–neck transition, including taper angles and composite layup terminations, as shown in
Figure 14. These discontinuities are critical in impact simulations and necessitate full 3D modeling for reliable stress distribution predictions.
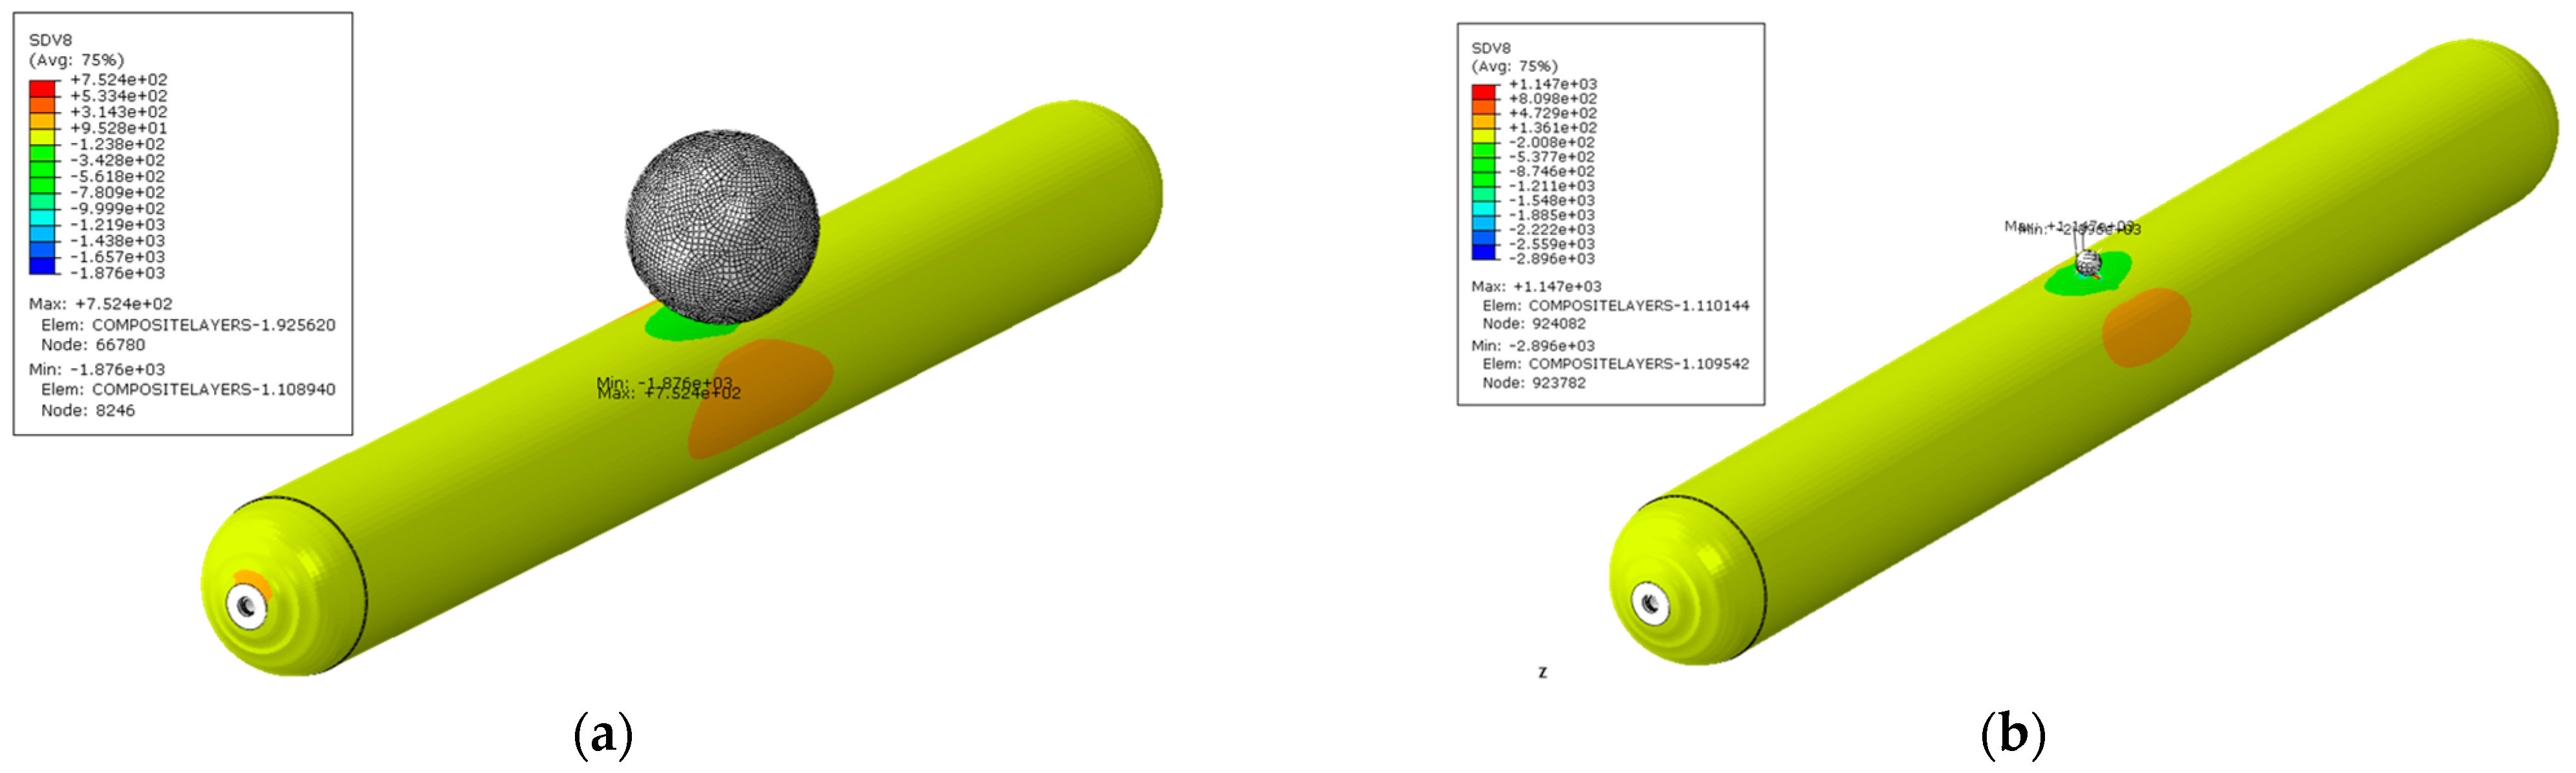
To examine contact area effects, two spherical impactors were modeled: one with a diameter of 180 mm and another with 25 mm. The corresponding FE models are shown in
Figure 15, enabling an analysis of contact-localized stress under varying impact geometries.
Boundary conditions were defined to reflect experimental protocols. The impactors were treated as rigid bodies constrained to vertical motion (normal to vessel axis), with all translational and rotational degrees of freedom fixed except the vertical displacement. The boss ends were fully clamped in all degrees of freedom to simulate fixed-end conditions.
To maintain a constant impact energy of 120 J for both impactor sizes, initial velocities were calculated using the kinetic energy equation:
where
is the kinetic energy,
m is the mass of the impactor (20 kg for 180 mm, 0.3 kg for 25 mm), and
v is the velocity. Solving yields initial velocities of 3464 mm/s for the 180 mm impactor and 28.284 mm/s for the 25 mm impactor.
2.5.2. Simulation Results
The results from the dynamic finite element analysis (FEA) revealed the transient stress evolution within the Type IV hydrogen storage vessel during impact events involving two distinct spherical impactors. The peak fiber-direction stress occurred immediately before the rebound phase of the impactor. The timing and corresponding stress magnitudes for each impactor diameter are summarized in
Table 4.
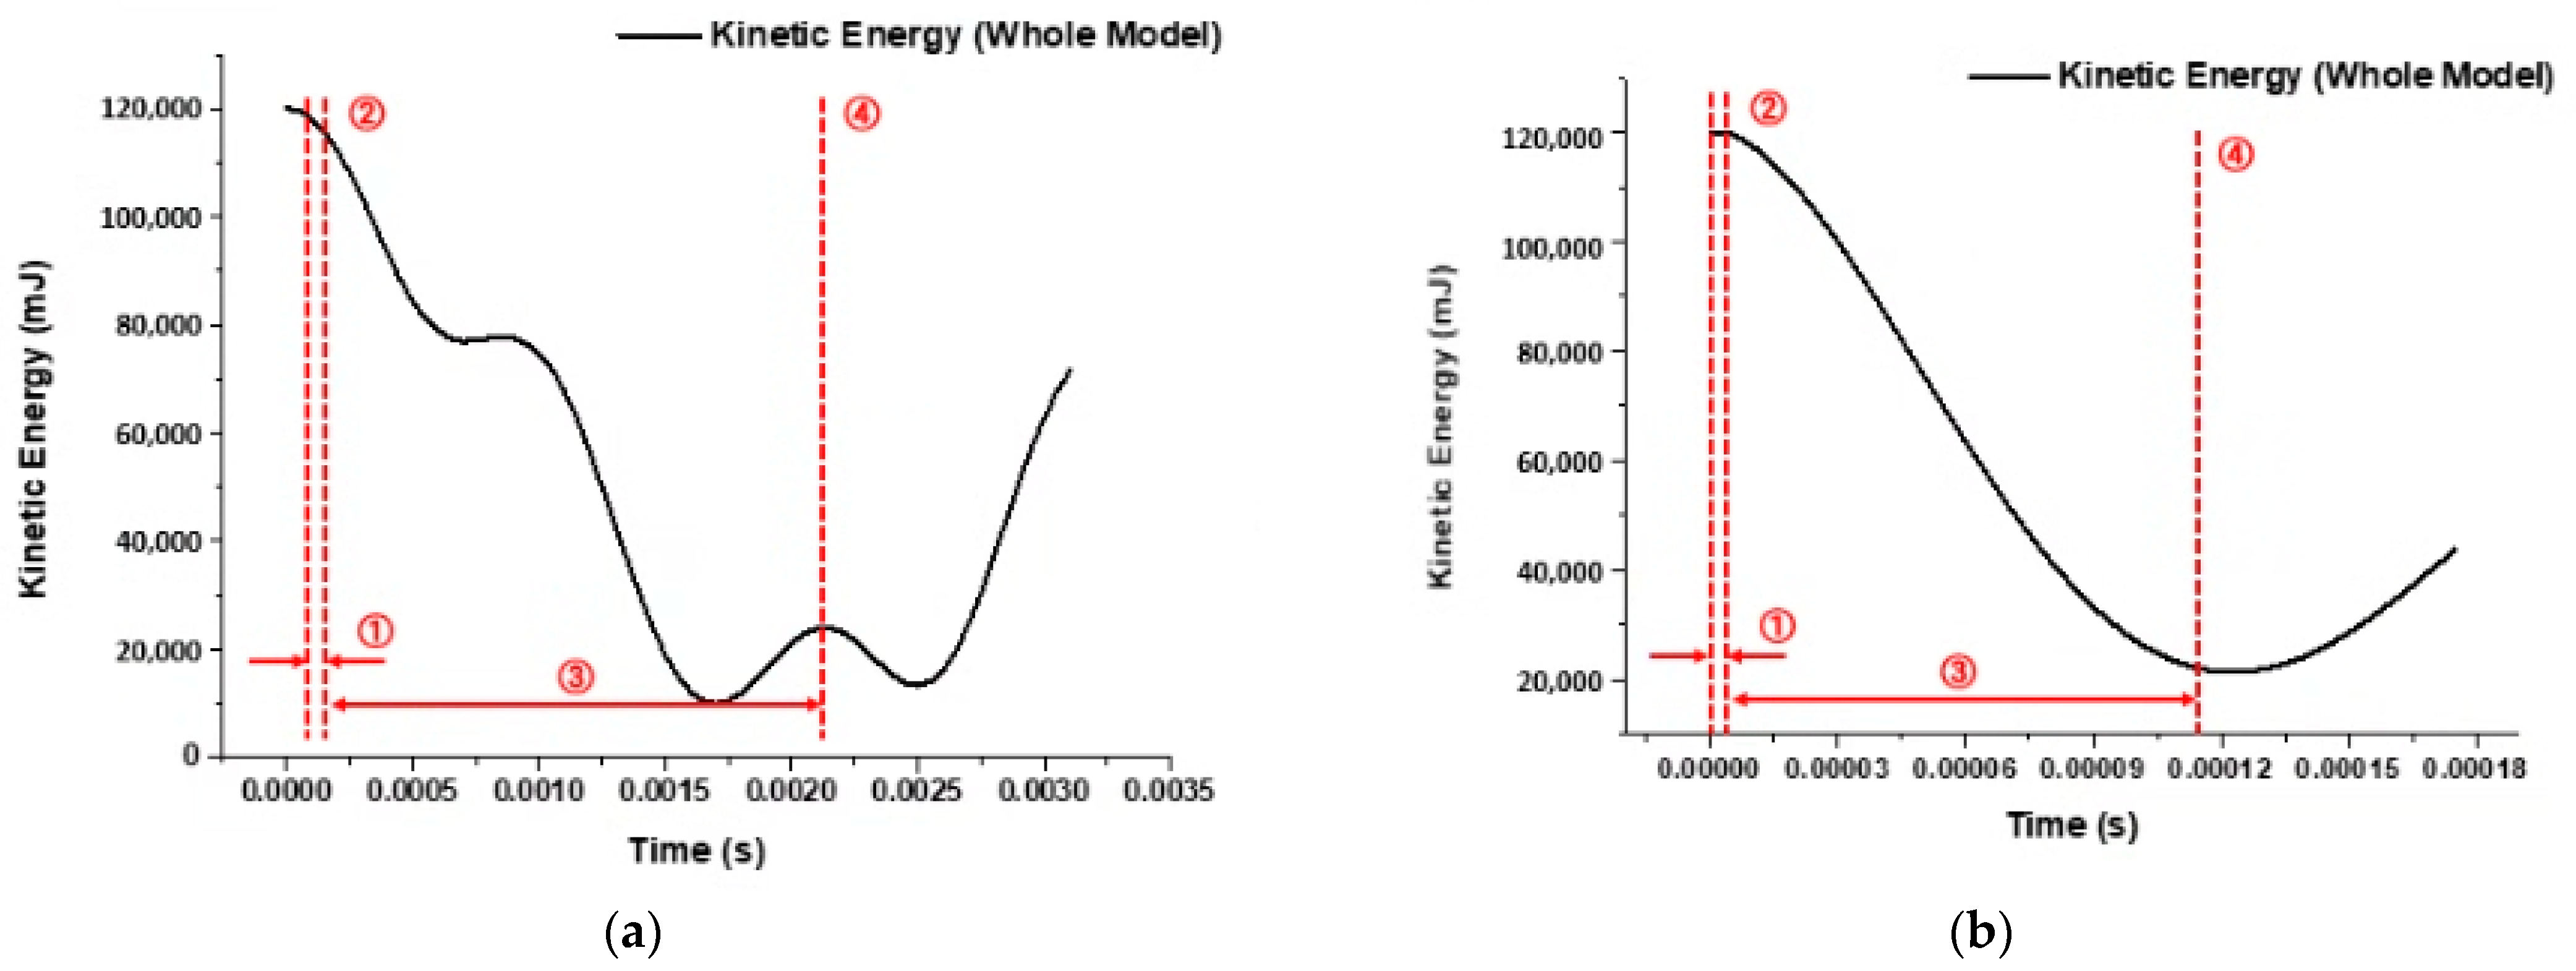
The stress–time history exhibited four distinct stages of structural response under impact loading:
Phase 1 (Pre-contact Descent): The impactor begins its motion, descending from a height of 0.01 mm above the vessel surface.
Phase 2 (Initial Contact): Contact is established between the impactor and the outer composite surface, initiating stress buildup.
Phase 3 (Penetration and Deformation): Continued motion causes localized indentation and out-of-plane deformation in the vessel wall.
Phase 4 (Rebound Onset): Just before the impactor rebounds, maximum fiber-direction stress and kinetic energy are recorded.
Despite delivering the same total impact energy (120 J), the 25 mm diameter impactor induced significantly higher local stress levels than the 180 mm impactor. This effect is attributed to the smaller contact area of the 25 mm sphere, which concentrates the impact force over a much smaller surface region. Specifically, the maximum fiber-direction tensile stress for the 25 mm case reached 1147 MPa, in contrast to 752.4 MPa for the 180 mm case.
These results underscore the critical role of contact geometry in impact-induced stress amplification. Notably, impact energy alone is not a sufficient predictor of structural severity; rather, the impactor size and contact profile have a dominant influence. Therefore, small-diameter impacts—despite often being overlooked—pose a heightened risk of local structural damage.
The ability of the proposed FEA framework to resolve such stress distributions and time-dependent behaviors validates its application as a predictive tool for impact safety assessment.
Figure 16 presents the peak fiber-direction stress fields, and
Figure 17 shows the kinetic energy evolution over time for both impactor scenarios.
2.6. Drop Test
2.6.1. Test Definition and Simulation Setup
The drop test is a standardized evaluation method used to assess the structural integrity of Type IV hydrogen storage vessels under accidental free-fall impact scenarios. International guidelines, including ISO 19881 and UN GTR No. 13, define drop heights based on vessel fill conditions:
A drop height of 1.8 m is applied for vessels in the empty state.
A reduced drop height of 1.2 m is specified when vessels are more than 50% filled with liquid (e.g., water).
The reduced height reflects the increased effective impact energy due to higher mass and is especially critical for lightweight storage systems, such as those used in unmanned aerial vehicles (UAVs) [
27].
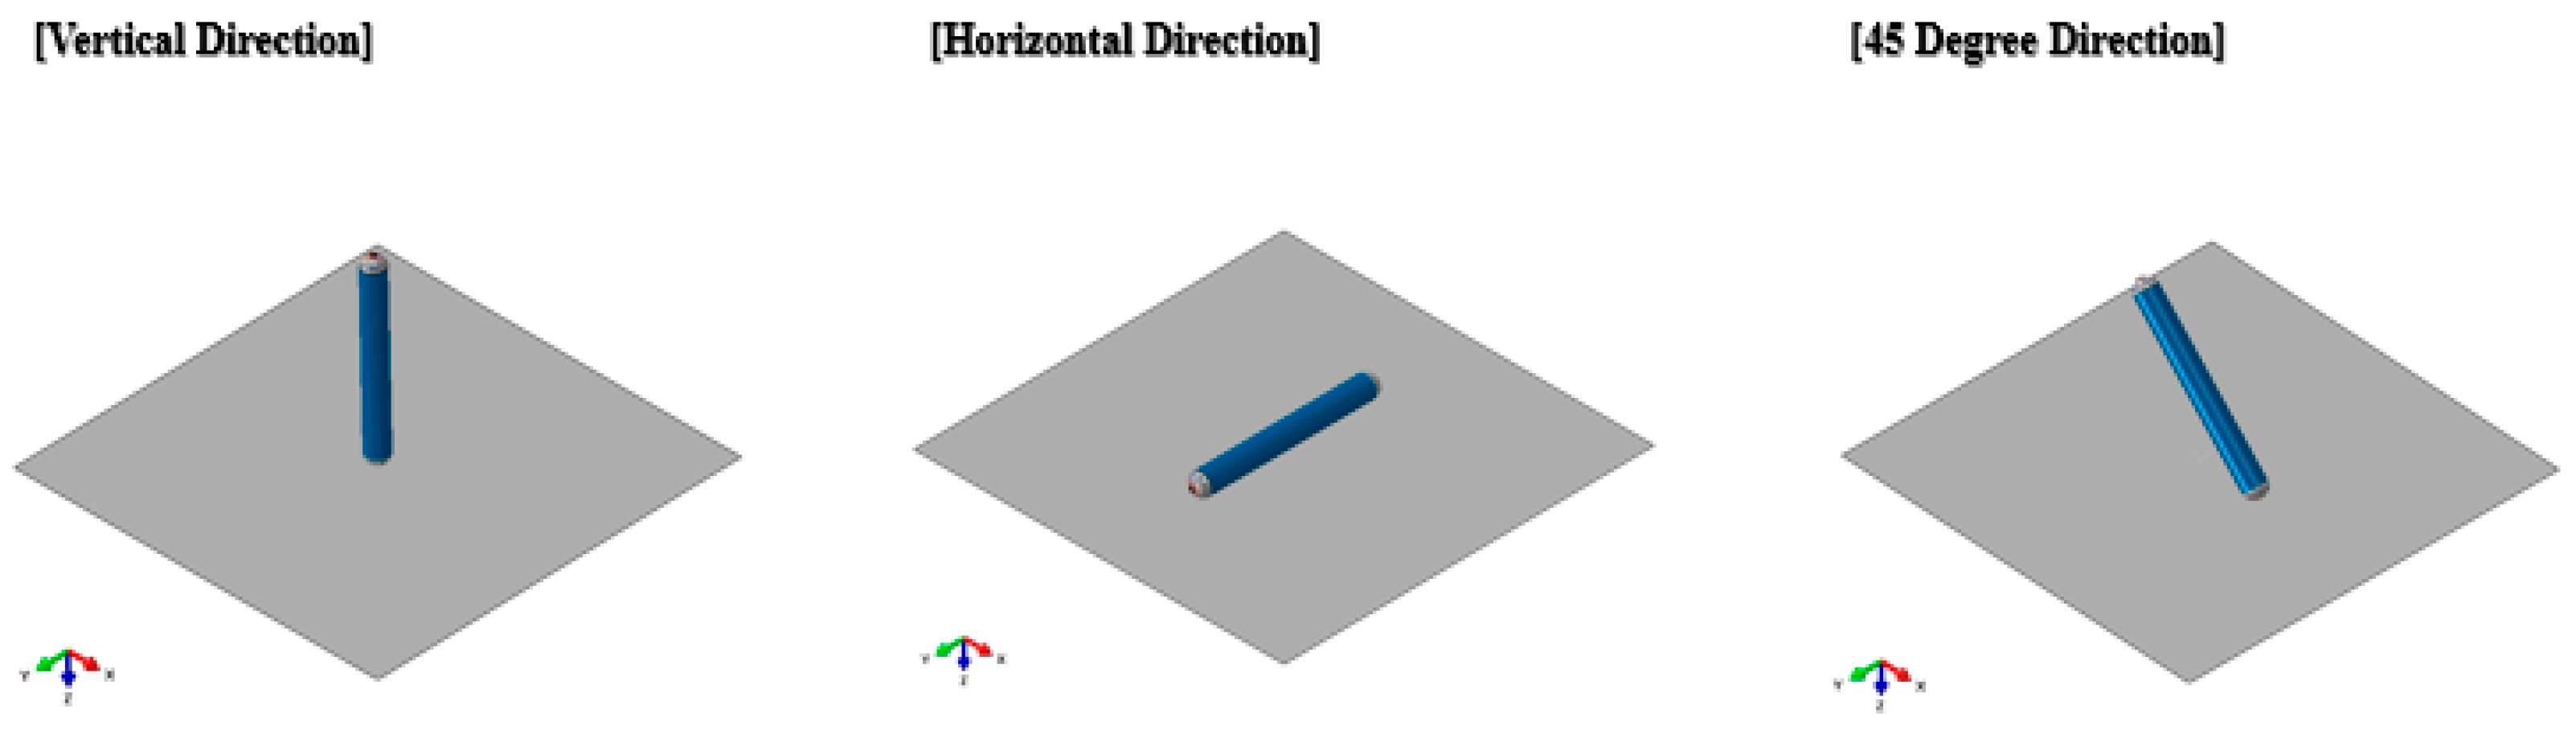
To replicate this behavior numerically, a full three-dimensional (3D) finite element (FE) model was developed using ABAQUS/Explicit. The model captured both external mechanical responses of the composite, liner, and boss components, and internal fluid–structure interactions caused by water motion during impact.
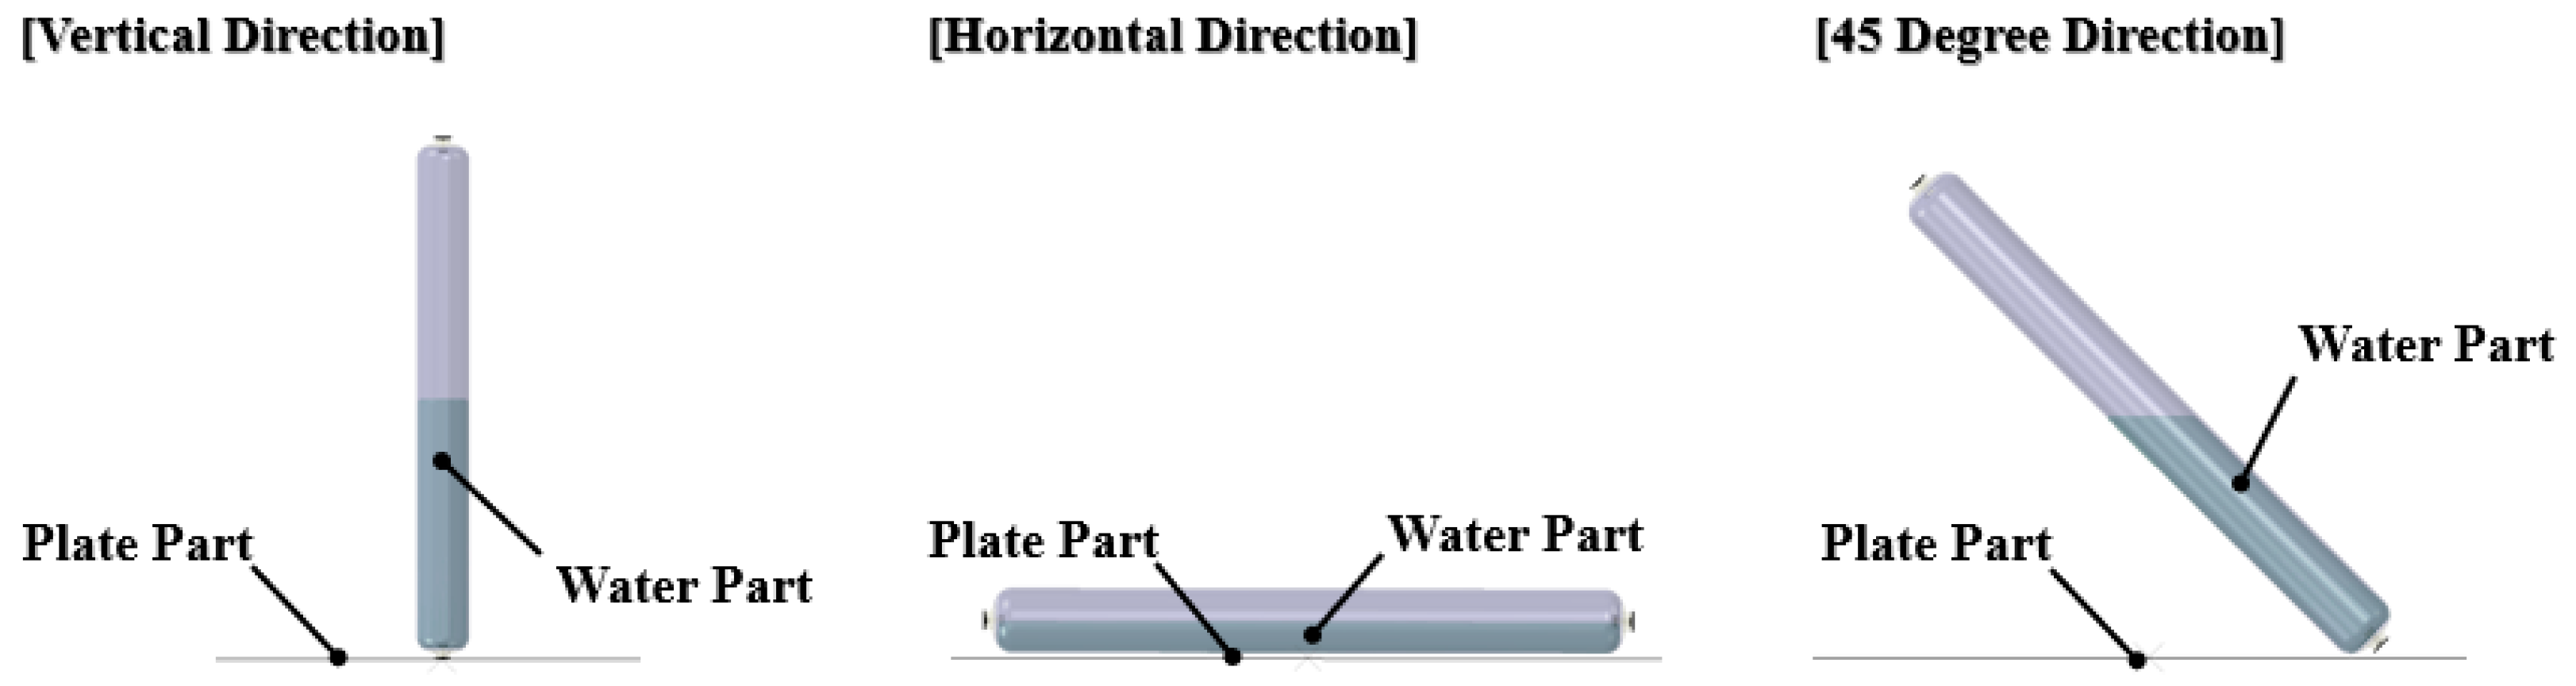
To resolve fluid–structure coupling under dynamic impact, the Coupled Eulerian–Lagrangian (CEL) method [
28] was employed. The water medium was represented using a Eulerian mesh domain, embedded within a Lagrangian mesh representing the structural vessel components—namely the polyamide (PA6) liner, aluminum bosses, and composite. The CEL setup is illustrated in
Figure 18 and
Figure 19.
The FE mesh was constructed using reduced-integration solid elements (C3D8R) for both computational stability and performance. Gravity (9810 mm/s2) was applied uniformly to all components.
The initial impact velocity for a 1.2 m drop was calculated using the free-fall equation:
where
v is the impact velocity (mm/s),
g = 9810 mm/s
2 is gravitational acceleration, and
S = 1200 mm is the drop height. This yielded an impact velocity of approximately 4850 mm/s, which was applied to the vessel using a predefined velocity field at the start of the simulation.
2.6.2. Simulation Results
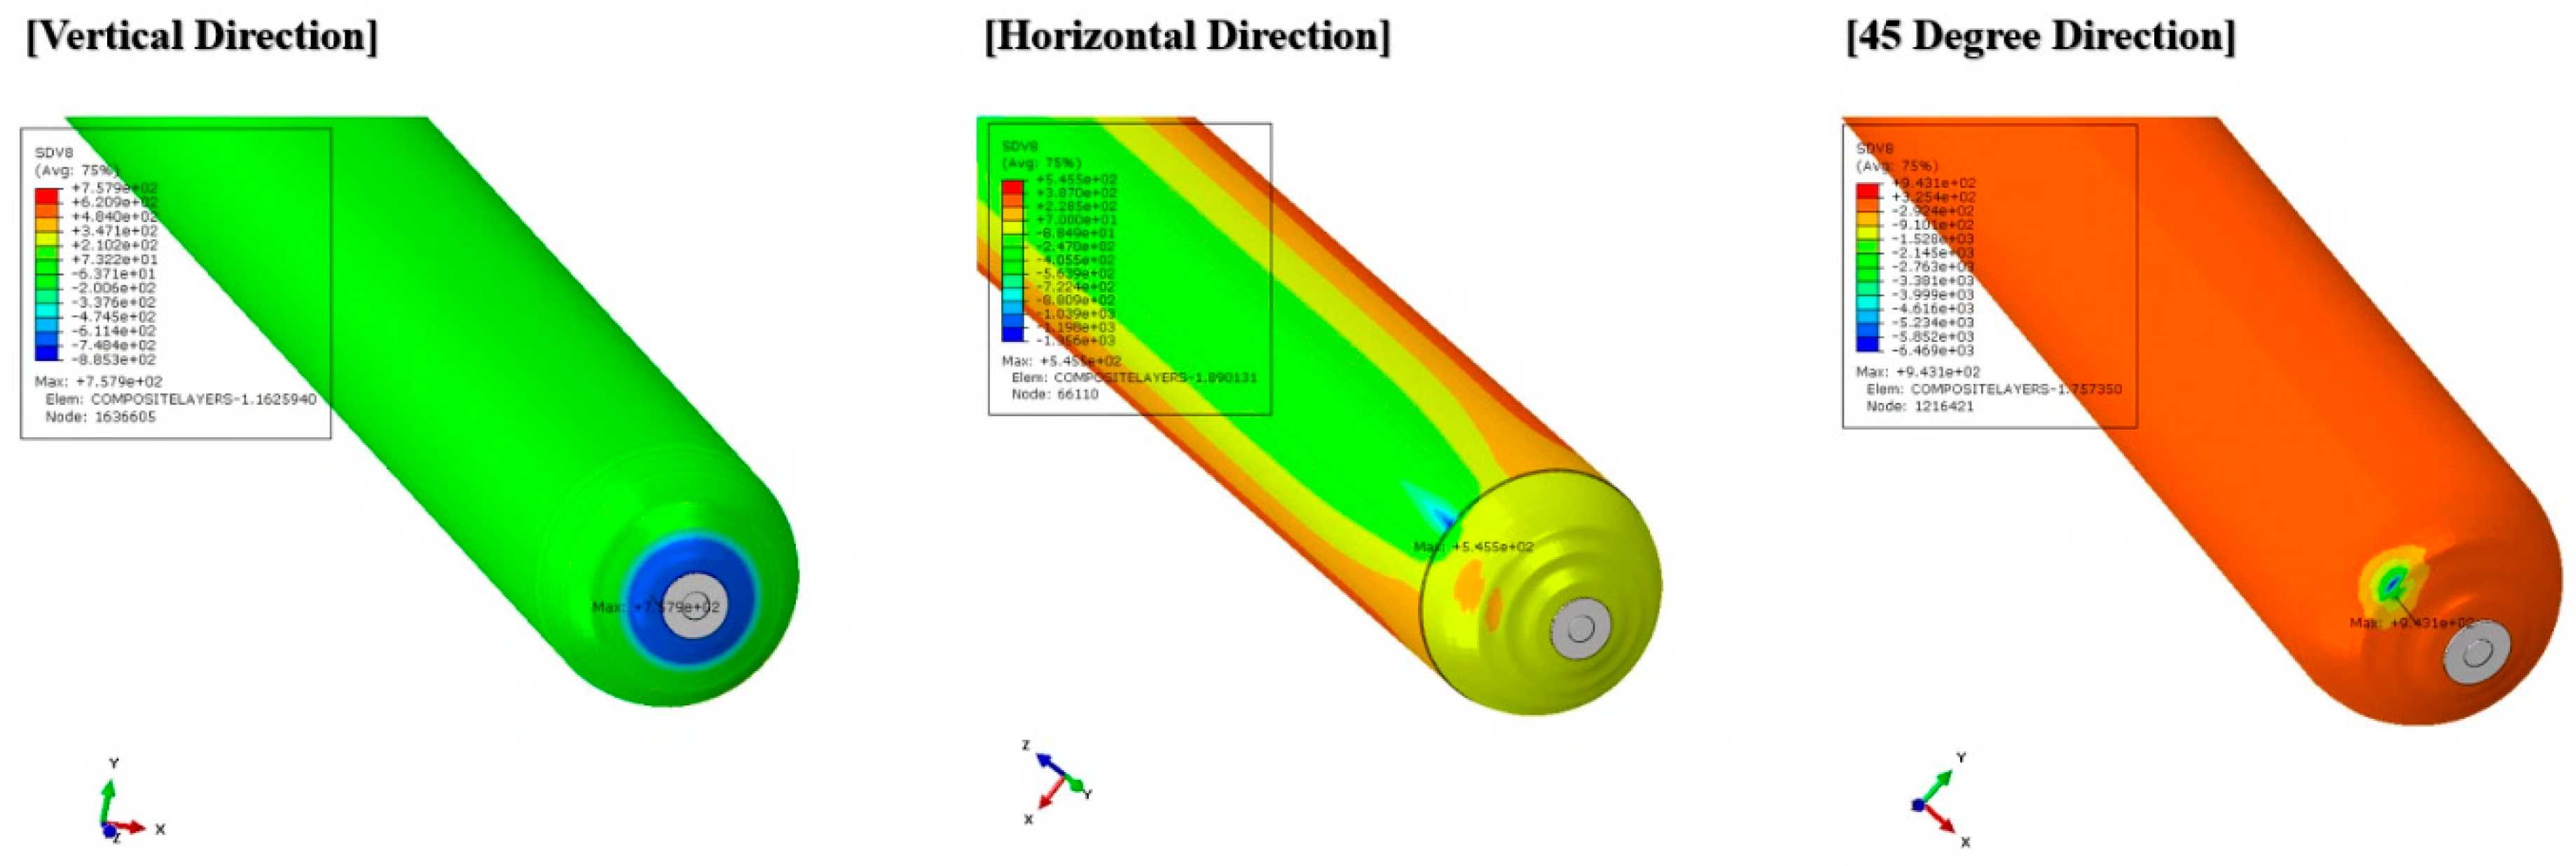
The simulation results derived from the developed finite element analysis (FEA) framework revealed the time-dependent stress responses of the vessel subjected to free-fall impacts at three orientations: vertical, horizontal, and 45-degree. (See
Figure 20) The first peak fiber-direction tensile and compressive stresses occurred immediately before the vessel began rebounding from the impact surface. These values, along with the corresponding times, are summarized in
Table 5.
As shown in
Figure 21, time-history plots of kinetic energy and deformation contours revealed four consistent phases across all orientations:
Phase 1 (Free-fall descent): The vessel begins falling from a height, with a 0.01 mm gap from the ground surface.
Phase 2 (Initial impact): The first contact occurs between the vessel and the rigid surface.
Phase 3 (Structural deformation): The vessel absorbs energy through deformation, particularly in vulnerable regions.
Phase 4 (Rebound onset): Maximum deformation is reached, after which the vessel begins upward motion.
Among the three orientations, the horizontal drop yielded the lowest tensile stress, attributable to the thicker cylindrical wall and orthogonal fiber orientations (hoop and helical) that enhance deformation resistance. In contrast, the 45-degree drop induced the highest tensile and compressive stresses, due to three factors:
The relatively thin dome wall at the impact point;
Lack of hoop reinforcement aligned with the oblique impact direction;
Reduced out-of-plane stiffness of the dome.
These stress amplification effects limit strain distribution and lead to localized failure-prone areas.
The simulation confirms that the proposed FEA framework effectively captures impact-dependent failure mechanisms, and the 45-degree drop scenario presents the highest risk, particularly for the dome region. Based on this analysis, the following structural enhancement strategies are recommended:
These strategies represent practical, design-integrated solutions to enhance dome durability and mitigate localized failure under accidental drop conditions in high-pressure hydrogen storage systems.
3. Limitations
This study presented a comprehensive finite element analysis (FEA) framework to assess the structural integrity of Type IV hydrogen storage vessels under multiple mechanical loading scenarios. Despite its utility, several limitations should be acknowledged:
First, the interaction between the composite and internal components (i.e., liner and boss) was modeled using a frictional contact formulation. While this partially accounts for the adhesive effects introduced by resin during the curing process, it does not capture the complete mechanics of interfacial bonding. Phenomena such as resin infiltration, curing-induced stress gradients, and local pressure variations were not explicitly modeled.
Second, structural materials—including the polyamide liner and aluminum boss—were modeled as elastic–plastic without incorporating time-dependent degradation phenomena. Important factors such as fatigue due to cyclic pressurization, long-term creep under sustained load, and hydrogen-assisted material degradation were excluded from this analysis.
Third, all FEA models developed in this study were constructed based on actual design data provided by an industrial collaborator. However, due to a non-disclosure agreement (NDA), some detailed geometric and microstructural information was omitted from the publication. Additionally, typical manufacturing defects—such as fiber waviness, resin-rich zones, voids, and interlaminar delamination—were not included in the simulation, and their potential effects on structural performance were not evaluated.
Fourth, in the dynamic simulations (impact and drop tests), progressive failure mechanisms—including matrix cracking, fiber rupture, and interlaminar delamination—were not implemented using failure progression models. Instead, fiber-direction stress fields were used to evaluate structural vulnerability. While this approach does not yield explicit failure modes, it provides practical insight into stress localization and risk-prone regions.
To improve the predictive fidelity of the proposed framework, future work should integrate advanced material degradation models, progressive damage criteria, and stochastic representations of manufacturing-induced imperfections.
4. Concluding Remarks
In this study, a comprehensive finite element analysis (FEA) framework was developed to assess the structural integrity of Type IV composite overwrapped pressure vessels (COPVs) under various regulatory mechanical loading conditions. The simulation suite included critical safety evaluations such as burst pressure, plug torque, axial compression, impact, and drop tests. Dedicated FEA models tailored for each test condition enabled the high-fidelity assessment of stress distributions and structural responses, serving as a predictive tool to guide future vessel design optimization.
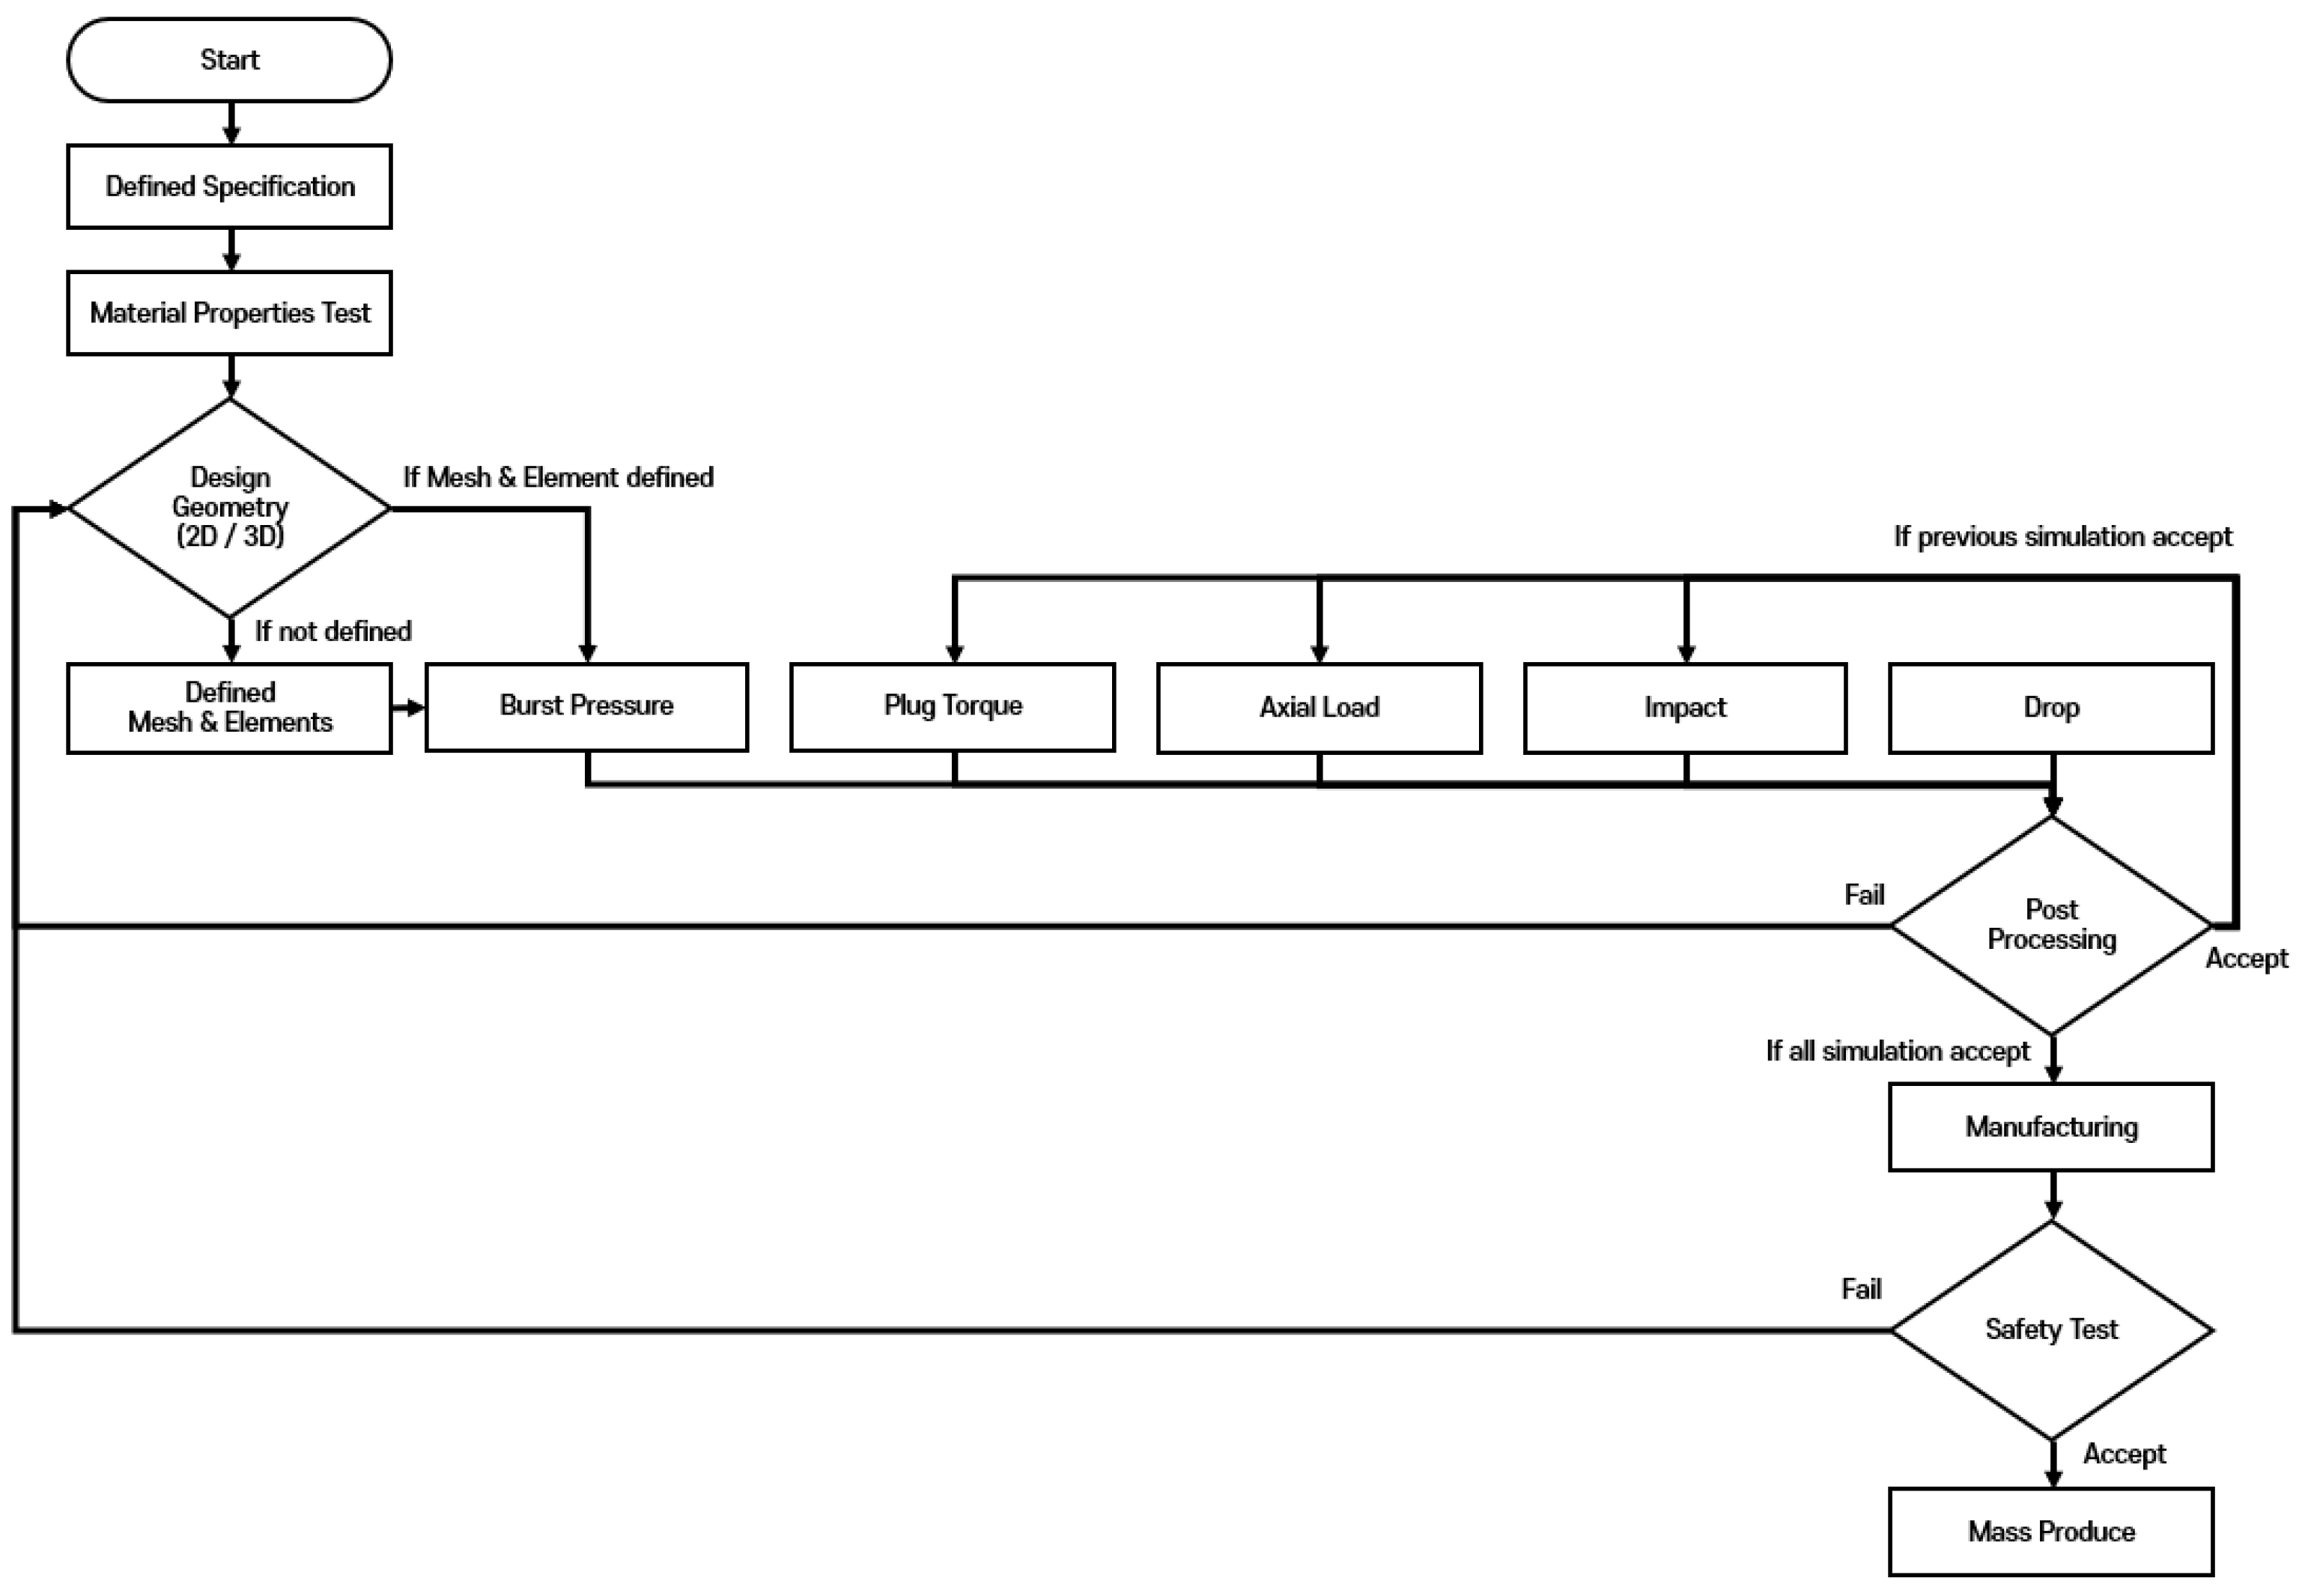
To enhance methodological clarity and ensure reproducibility, the simulation workflow was unified into a step-by-step process encompassing an initial specification definition, material characterization, model construction, execution, and post-processing (see
Figure 22). This approach reduced modeling redundancy, improved consistency across test cases, and provided a reusable framework for future high-pressure hydrogen storage systems.
The maximum fiber-direction stress appeared in the cylindrical region, confirming a longitudinal rupture mode—considered structurally favorable for energy dissipation. The stress concentration in the hoop direction was driven by radial compliance. To enhance rupture performance, localized reinforcement at the dome–cylinder transition or adjusting the hoop-to-axial stiffness ratio is recommended.
Both tests revealed significant stress concentrations at the boss–composite interface due to the compressive contact and stiffness mismatch. In axial compression, stresses migrated to the boss–neck owing to geometric discontinuity and local bending. Structural safety can be improved by optimizing the boss–neck profile and increasing laminate thickness or ±θ helical plies at the dome–boss junction.
Despite an equivalent impact energy (120 J), the smaller 25 mm impactor produced a higher localized stress than the 180 mm one, due to a reduced contact area. The cylindrical section experienced substantial deformation, indicating the need for external protective layers or internal shell stiffeners. Fiber-direction reinforcements aligned with anticipated impact directions are also advised.
Among vertical, horizontal, and 45-degree orientations, the 45-degree drop generated the highest stress in the dome due to a low out-of-plane stiffness, absence of hoop plies in that direction, and thin curvature. Reinforcement in the dome area, such as an optimized taper geometry, external dome protectors, and additional ±45° or hoop layers, is essential to mitigate failure under oblique impact.
The proposed FEA framework not only enables early-stage structural verification with high reliability but also facilitates cost-effective prototyping and regulatory compliance. It offers a practical tool for accelerating the design-to-certification cycle, reducing physical prototyping costs, and supporting the commercialization of next-generation hydrogen storage systems. Future enhancements should incorporate filament winding parameters, progressive damage modeling (e.g., matrix cracking, delamination), and stochastic defects to increase prediction accuracy. This study offers a scalable and reusable digital workflow for rapid structural validation in the design of hydrogen storage vessels used in automotive, aerospace, and energy applications.
Author Contributions
Conceptualization, G.K. and H.K. (Hansang Kim); methodology, G.K. and H.K. (Hansang Kim); validation, G.K., H.K. (Hyewon Kim), H.P. and H.K. (Hansang Kim); formal analysis, G.K., K.P., S.Y., H.L., J.K., J.K., G.Y., Y.Y., S.L. and H.K. (Hansang Kim); investigation, G.K., H.K. and H.P.; resources, G.K., S.Y., H.L., J.K., J.K., G.Y., Y.Y., S.L. and H.K. (Hansang Kim); data curation, G.K. and H.K. (Hansang Kim); writing—original draft preparation, G.K. and H.K. (Hansang Kim); writing—review and editing, G.K. and H.K. (Hansang Kim); visualization, G.K., H.K. (Hyewon Kim), H.P. and H.K. (Hansang Kim); supervision, G.K. and H.K. (Hansang Kim); project administration, G.K. and H.K. (Hansang Kim). All authors have read and agreed to the published version of the manuscript.
Funding
This work was supported by the Core Technology Development Program for Renewable Energy of the Ministry of Trade, Industry and Energy (MOTIE) and the Korea Institute of Energy Technology Evaluation and Planning (KETEP) under Grant No. 2022303004020A, and by the Technology Development Program for Materials and Components of the Ministry of Trade, Industry and Energy (MOTIE) and the Korea Evaluation Institute of Industrial Technology (KEIT) under Grant No. 20022511.
Data Availability Statement
The original contributions presented in the study are included in the article; further inquiries can be directed at the corresponding author.
Conflicts of Interest
The authors declare no conflicts of interest.
References
- Kim, C.-H.; Kim, G.-W.; Kim, H.-S. Analysis of Domestic and Foreign Policy and Technology Trends for Hydrogen In-dustry Development. Trans. Korean Hydrog. New Energy Soc. 2023, 34, 122–131. [Google Scholar] [CrossRef]
- Ma, Q.; Rejab, M.R.M.; Azeem, M.; Hassan, S.A.; Yang, B.; Kumar, A.P. Opportunities and challenges on composite pressure vessels (CPVs) from advanced filament winding machinery: A short communication. Int. J. Hydrogen Energy 2024, 57, 1364–1372. [Google Scholar] [CrossRef]
- Lee, J.-H.; Yoo, G.-H.; Heo, S.-B. High pressure hydrogen gas cylinder for fuel cell vehicle and station. Theor. Appl. Chem. Eng. 2007, 10, 1108–1111. [Google Scholar]
- ISO 19881; Gaseous Hydrogen—Land Vehicle Fuel Containers. International Organization for Standardization: Geneva, Switzerland, 2018.
- UN GTR No. 13; Global Technical Regulation on Hydrogen and Fuel Cell Vehicles. United Nations Economic Commission for Europe (UNECE): Geneva, Switzerland, 2023.
- ECE R-134; Uniform Provisions Concerning the Approval of Motor Vehicles Using Compressed Gaseous Hydrogen. UNECE: Geneva, Switzerland, 2019.
- KHKS Code; Technical Standards for Hydrogen Equipment. The High Pressure Gas Safety Institute of Japan (KHK): Tokyo, Japan, 2023.
- KGS Code; Technical Standards for Hydrogen Installations. Korea Gas Safety Corporation (KGS): Seoul, Republic of Korea, 2023.
- U.S. Department of Energy. Technical Targets for Onboard Hydrogen Storage Systems for Light-Duty Vehicles; Fuel Cell Technologies Office, Energy Efficiency and Renewable Energy: Washington, DC, USA, 2020. Available online: https://www.energy.gov/eere/fuelcells/doe-technical-targets-onboard-hydrogen-storage-light-duty-vehicles (accessed on 10 June 2025).
- U.S. Department of Energy. Hydrogen Storage; Fuel Cell Technologies Office, Energy Efficiency and Renewable Energy: Washington, DC, USA. Available online: https://www.energy.gov/eere/fuelcells/hydrogen-storage (accessed on 10 June 2025).
- Nebe, M.; Soriano, A.; Braun, C.; Middendorf, P.; Walther, F. Analysis on the mechanical response of composite pressure vessels during internal pressure loading: FE modeling and experimental correlation. Compos. Part B Eng. 2021, 212, 108550. [Google Scholar] [CrossRef]
- Magneville, B.; Gentilleau, B.; Villalonga, S.; Nony, F.; Galiano, H. Modeling, parameters identification and experimental validation of composite materials behavior law used in 700 bar type IV hydrogen high pressure storage vessel. Int. J. Hydrogen Energy 2015, 40, 13193–13205. [Google Scholar] [CrossRef]
- Hu, Z.; Chen, M.; Pan, B. Simulation and burst validation of 70 MPa type IV hydrogen storage vessel with dome reinforcement. Int. J. Hydrogen Energy 2021, 46, 23779–23794. [Google Scholar] [CrossRef]
- Kojima, K.; Fukazawa, K. Current status and future outlook of fuel cell vehicle development in Toyota. Electrochem. Soc. 2015, 37, 1310. [Google Scholar]
- Leh, D.; Magneville, B.; Saffré, P.; Francescato, P.; Arrieux, R.; Villalonga, S. Optimisation of 700 bar type IV hydrogen pressure vessel considering composite damage and dome multi-sequencing. Int. J. Hydrogen Energy 2015, 40, 13215–13230. [Google Scholar] [CrossRef]
- Bouhala, L.; Karatrantos, A.; Reinhardt, H.; Schramm, N.; Akin, B.; Rauscher, A.; Mauersberger, A.; Taşkıran, S.T.; Ulaşlı, M.E.; Aktaş, E.; et al. Advancement in the modeling and design of composite pressure vessels for hydrogen storage: A comprehensive review. J. Compos. Sci. 2024, 8, 339. [Google Scholar] [CrossRef]
- Kis, D.I.; Kokai, E. A review on the factors of liner collapse in type IV hydrogen storage vessels. Int. J. Hydrogen Energy 2024, 50, 236–253. [Google Scholar] [CrossRef]
- Mikroni, M.; Koutsoukis, G.; Vlachos, D.; Kostopoulos, V.; Vavouliotis, A.; Trakakis, G.; Athinaios, D.; Nikolakea, C.; Zacharakis, D. Design, analysis, and testing of a Type V composite pressure vessel for hydrogen storage. Polymers 2024, 16, 3576. [Google Scholar] [CrossRef] [PubMed]
- Atul, S.; Bhat, S.; Chavan, S.; Kamble, S.B.; Kulkarni, A.P.; Sangale, S.B. Finite element analysis of composite overwrapped pressure vessel for hydrogen storage. In Proceedings of the International Conference on Advances in Computing, Communications and Informatics 2016, Jaipur, India, 21–24 September 2016; pp. 430–436. [Google Scholar]
- Ramirez, J.P.B.; Halm, D.; Grandidier, J.-C.; Villalonga, S.; Nony, F. 700 bar type IV high pressure hydrogen storage vessel burst—Simulation and experimental validation. Int. J. Hydrogen Energy 2015, 40, 13183–13192. [Google Scholar] [CrossRef]
- Zhang, Q.; Xu, H.; Jia, X.; Zu, L.; Cheng, S.; Wang, H. Design of a 70 MPa type IV hydrogen storage vessel using accurate modeling techniques for dome thickness prediction. Compos. Struct. 2020, 236, 111915. [Google Scholar] [CrossRef]
- Zu, L.; Xu, H.; Jia, X.; Zhang, Q.; Wang, H.; Zhang, B. Winding path design based on mandrel profile updates of composite pressure vessels. Compos. Struct. 2020, 235, 111766. [Google Scholar] [CrossRef]
- Liu, P.F.; Chu, J.K.; Hou, S.J.; Xu, P.; Zheng, J.Y. Numerical simulation and optimal design for composite high-pressure hydrogen storage vessel: A review. Renew. Sustain. Energy Rev. 2012, 16, 1817–1827. [Google Scholar] [CrossRef]
- Choi, D.-Y.; Choi, J.-C.; Han, J.-U. A Study of Bolt Tightening Changing Factor according to Durability Degradation. J. Auto-Veh. Saf. Assoc. 2015, 7, 20–26. [Google Scholar]
- ISO 261:1998; ISO General Purpose Metric Screw Threads—General Plan. Publisher: International Organization for Standardization: Geneva, Switzerland, 1998.
- ISO 965-1:2013; ISO General Purpose Metric Screw Threads—Tolerances—Part 1: Principles and basic data. Publisher: International Organization for Standardization: Geneva, Switzerland, 2013.
- Yoo, G.-H.; Ju, Y.-S.; Heo, S.-B.; Jeon, S.-J.; Kim, J.-Y.; Lee, J.-H. Development of the High-Pressure Hydrogen Gas Cylinder (Type 4) for Fuel Cell Vehicle; Design Qualification Tests; The Korea Society for New and Renewable Energy: Seoul, Republic of Korea, 2007; pp. 193–196. [Google Scholar]
- Qin, H.; Mu, L.; Tang, W.; Hu, Z. A Concurrent Multi-Process Refinement method applied in two-dimensional strong-coupled fluid-structure interaction problems. Ocean Eng. 2020, 197, 106912. [Google Scholar] [CrossRef]
- Dong, L.; Zhang, Z.; Jiang, Y.; Yu, F. Drop damage analysis of automotive high-pressure composite hydrogen storage cylinders. J. Energy Storage 2024, 75, 109066. [Google Scholar] [CrossRef]
Figure 1.
Finite element model of COPV: (a) full vessel layout showing nozzle boss, liner, and composite; (b) dimensional representation of reference geometry.
Figure 1.
Finite element model of COPV: (a) full vessel layout showing nozzle boss, liner, and composite; (b) dimensional representation of reference geometry.
Figure 2.
Composite layup sequence modeled in ABAQUS-WoundSim.
Figure 2.
Composite layup sequence modeled in ABAQUS-WoundSim.
Figure 3.
Comparison of global seed sizes applied to liner-boss model: (a) 2.0 mm; (b) 1.5 mm; (c) 1.0 mm; (d) 0.5 mm.
Figure 3.
Comparison of global seed sizes applied to liner-boss model: (a) 2.0 mm; (b) 1.5 mm; (c) 1.0 mm; (d) 0.5 mm.
Figure 4.
Final meshed model of Type IV COPV used for safety test simulations.
Figure 4.
Final meshed model of Type IV COPV used for safety test simulations.
Figure 5.
Two-dimensional axisymmetric FEA model for burst pressure simulation, based on ISO 19881 and UN GTR No. 13 protocol.
Figure 5.
Two-dimensional axisymmetric FEA model for burst pressure simulation, based on ISO 19881 and UN GTR No. 13 protocol.
Figure 6.
Fiber-direction tensile stress distribution in the composite under burst loading. The red circle indicates the location of the maximum fiber-direction tensile stress.
Figure 6.
Fiber-direction tensile stress distribution in the composite under burst loading. The red circle indicates the location of the maximum fiber-direction tensile stress.
Figure 7.
Axisymmetric FEA model for plug torque test, including plug geometry and load direction. The red arrows indicate the location and direction of the applied load.
Figure 7.
Axisymmetric FEA model for plug torque test, including plug geometry and load direction. The red arrows indicate the location and direction of the applied load.
Figure 8.
Von Mises stress distributions in the plug and boss during (a) plug tightening and (b) internal pressurization. The red circle indicates the location of the maximum von-mises stress.
Figure 8.
Von Mises stress distributions in the plug and boss during (a) plug tightening and (b) internal pressurization. The red circle indicates the location of the maximum von-mises stress.
Figure 9.
Fiber-direction tensile stresses in the composite during (a) plug tightening and (b) internal pressurization. The red circle indicates the location of the maximum von-mises stress and the maximum fiber-direction tensile stress.
Figure 9.
Fiber-direction tensile stresses in the composite during (a) plug tightening and (b) internal pressurization. The red circle indicates the location of the maximum von-mises stress and the maximum fiber-direction tensile stress.
Figure 10.
Peak stress concentrations and stress-flow trajectories in the boss–neck region under 70 MPa pressure. The red circle indicates the location of the maximum von-mises stress.
Figure 10.
Peak stress concentrations and stress-flow trajectories in the boss–neck region under 70 MPa pressure. The red circle indicates the location of the maximum von-mises stress.
Figure 11.
Axisymmetric FEA model for axial load test, showing axial force application. The red arrows indicate the location and direction of the applied load.
Figure 11.
Axisymmetric FEA model for axial load test, showing axial force application. The red arrows indicate the location and direction of the applied load.
Figure 12.
Von Mises stress distribution in the plug and boss during (a) axial compression and (b) internal pressurization. The red circle indicates the location of the maximum von-mises stress.
Figure 12.
Von Mises stress distribution in the plug and boss during (a) axial compression and (b) internal pressurization. The red circle indicates the location of the maximum von-mises stress.
Figure 13.
Fiber-direction tensile stress distribution in the composite during (a) axial compression and (b) internal pressurization. The red circle indicates the location of the maximum fiber-direction tensile stress.
Figure 13.
Fiber-direction tensile stress distribution in the composite during (a) axial compression and (b) internal pressurization. The red circle indicates the location of the maximum fiber-direction tensile stress.
Figure 14.
Limitations of shell-based modeling at the dome–neck junction, showing taper and laminate termination not captured in 2D axisymmetric geometry.
Figure 14.
Limitations of shell-based modeling at the dome–neck junction, showing taper and laminate termination not captured in 2D axisymmetric geometry.
Figure 15.
Three-dimensional FE models for impact test with spherical impactors: (a) 180 mm and (b) 25 mm.
Figure 15.
Three-dimensional FE models for impact test with spherical impactors: (a) 180 mm and (b) 25 mm.
Figure 16.
Fiber-direction stress distribution for two impactor diameters: (a) 180 mm and (b) 25 mm.
Figure 16.
Fiber-direction stress distribution for two impactor diameters: (a) 180 mm and (b) 25 mm.
Figure 17.
Time history of kinetic energy for (a) 180 mm impactor and (b) 25 mm impactor. The red line indicates the division between each phase of the impact event. Labels ①–④ correspond to each phase of the impact event: (1) Pre-contact Descent, (2) Initial Contact, (3) Penetration and Deformation, and (4) Rebound Onset.
Figure 18.
Internal water modeled with Eulerian mesh domain in CEL-based drop simulation.
Figure 18.
Internal water modeled with Eulerian mesh domain in CEL-based drop simulation.
Figure 19.
Full 3D finite element model for drop impact simulation.
Figure 19.
Full 3D finite element model for drop impact simulation.
Figure 20.
Fiber-direction stress contours in the composite under vertical, horizontal, and 45-degree drop impact conditions.
Figure 20.
Fiber-direction stress contours in the composite under vertical, horizontal, and 45-degree drop impact conditions.
Figure 21.
Time-history of total kinetic energy during drop impact simulation for different orientations.
Figure 21.
Time-history of total kinetic energy during drop impact simulation for different orientations.
Figure 22.
Unified FEA workflow for design, analysis, and validation of Type IV hydrogen vessels.
Figure 22.
Unified FEA workflow for design, analysis, and validation of Type IV hydrogen vessels.
Table 1.
DOE technical targets for onboard hydrogen storage systems in light-duty vehicles.
Table 1.
DOE technical targets for onboard hydrogen storage systems in light-duty vehicles.
| Parameter | Unit | 2020 Status | 2025 Target | Ultimate Target |
|---|
System
Gravimetric Capacity | kg /kg-system | 0.045 | 0.055 | 0.075 |
System
Volumetric
Capacity | kg /L-system | 0.030 | 0.040 | 0.070 |
| System Cost | USD/kg | USD 370 | USD 333 | USD 125 |
Fill Time
(5 kg ) | Minutes | 4.2 | 3.3 | 2.5 |
Cycle Life
(Full-fills to EOL) | # cycle | 1500 | 1500 | 1500 |
Operating
Pressure
(Nominal) | MPa | 70 | 70 | 82 |
On-board
Efficiency | % | 85 | 90 | 90 |
| Min. Delivery Temperature | °C | −40 | −40 | −40 |
Max. Delivery
Temperature | °C | 85 | 85 | 85 |
Min. Delivery
Pressure | MPa | 5 | 5 | 5 |
Max. Delivery
Pressure | MPa | 100 | 100 | 100 |
Life Time
(Service) | Years | 15 | 15 | 15 |
Table 2.
Mechanical properties of boss and liner materials.
Table 2.
Mechanical properties of boss and liner materials.
| Material | Young’s Modulus (MPa) | Poisson’s
Ratio | Yield Strength
(MPa) | Ultimate Strength
(MPa) |
|---|
| PA6 | 1900 | 0.30 | 36.9 | - |
| Al6061-T6 | 70,000 | 0.33 | 294.9 | 388.5 |
Table 3.
Mesh convergence results for the reduced sub-model under 1 MPa of internal pressure.
Table 3.
Mesh convergence results for the reduced sub-model under 1 MPa of internal pressure.
| Mesh Size (mm) | Region | Max. Stress (MPa) | Diff. (%) | No. of Elements | CPU Time (s) |
|---|
| 2.0 | Boss | 31.23 | - | 34,884 | 55 |
| Liner | 22.70 | - |
| 1.5 | Boss | 32.58 | +4.32 | 63,793 | 100 |
| Liner | 22.16 | −2.38 |
| 1.0 | Boss | 36.69 | +17.48 | 210,190 | 415 |
| Liner | 22.31 | −1.72 |
| 0.5 | Boss | 36.58 | +17.13 | 1,821,812 | 9919 |
| Liner | 22.50 | −0.88 |
Table 4.
First peak fiber-direction stress and corresponding time for different impactor diameters.
Table 4.
First peak fiber-direction stress and corresponding time for different impactor diameters.
| Impact Diameter | Time (s) | Max. Tensile Stress (MPa) | Max. Compressive Stress (MPa) |
|---|
| 180 mm | | 752.4 | 1876 |
| 25 mm | | 1147 | 2896 |
Table 5.
First peak fiber-direction stress and corresponding time by drop angle.
Table 5.
First peak fiber-direction stress and corresponding time by drop angle.
| Drop Orientation | Time (s) | Max. Tensile Stress (MPa) | Max. Compressive Stress (MPa) |
|---|
| Vertical | | 757.9 | 885.3 |
| Horizontal | | 545.5 | 1356 |
| 45-Degree | | 943.1 | 6469 |
| Disclaimer/Publisher’s Note: The statements, opinions and data contained in all publications are solely those of the individual author(s) and contributor(s) and not of MDPI and/or the editor(s). MDPI and/or the editor(s) disclaim responsibility for any injury to people or property resulting from any ideas, methods, instructions or products referred to in the content. |
© 2025 by the authors. Licensee MDPI, Basel, Switzerland. This article is an open access article distributed under the terms and conditions of the Creative Commons Attribution (CC BY) license (https://creativecommons.org/licenses/by/4.0/).


 ,
, 


