Abstract
International projects study the safety aspects of the storage and long-distance transportation of liquid hydrogen at large scales. Catalytic recombiners, which are today key elements of hydrogen risk mitigation in nuclear power plants, could become an efficient safety device to prevent flammable gas mixtures after liquid hydrogen leakages in closed rooms. This study tackles fundamental questions about the operational behavior of typical recombiner catalysts related to the conditions of the start-up and the termination of the catalytic reaction. For this purpose, small-scale catalyst sheets with coatings containing either platinum or palladium as active materials were exposed to gas mixtures of air and hydrogen of up to 4 vol.% at temperatures between −50 °C and 20 °C. Both platinum and palladium showed variation to performance and had stochastic results. Overall, the initialized platinum catalyst was better than the palladium. The experimental results show that the transfer of the recombiner technology from its current application is not easily possible.
1. Introduction
Hydrogen is considered in many countries as an option to support the renewable energy transition. It could be produced from green energy sources like electrolyzer power via wind turbines, hydropower, etc., and be used in a large variety of applications in the energy sector as fuel or energy carrier. Storing hydrogen in the liquid state is advantageous as its long-term storage capacity is significantly higher than conventional battery storage [1]. Another favorable aspect is the potential for large-scale transportation over long distances by ship [2].
The safety of liquid hydrogen (LH2) storage and transportation has recently become an important research field, aiming to understand the fundamental safety characteristics to protect infrastructures, personnel involved, and investments [3,4]. In this context, international research projects, such as PRESLHY (Performative Research for Safe Use of Liquid Hydrogen [5]), ELVHYS (Enhancing Safety of Liquid and Vaporised Hydrogen Transfer Technologies in Public Areas for Mobile Applications [6]), and STACY (Towards Safe Storage and Transportation of Cryogenic Hydrogen [7]) address issues and open questions related to LH2 safety.
The high diffusion coefficient and low density are two properties of gaseous hydrogen that have different safety implications depending on the conditions considered. In open spaces, these two properties positively influence safety as hydrogen will quickly disperse in the atmosphere. However, in confined spaces, hydrogen could quite easily accumulate, mix with air, and surpass the lower flammability limit [8]. One option to cope with hydrogen accumulations in confined spaces could be so-called catalytic recombiners.
Catalytic recombiners are well-known safety devices installed in nuclear power plants for hydrogen mitigation [9]. In this context, they are referred to as “Passive Auto-catalytic Recombiners (PARs)”, as they do not need operator intervention or electricity to be set into operation. In the event of hydrogen leaking into the air, both hydrogen and oxygen adsorb on the recombiner’s catalytic surface. Hydrogen and oxygen then react on the surface to form water and heat according to the reaction equation
H2 + O2 → H2O + 242 kJ/mol.
The water desorbs as vapor thus reducing the hydrogen concentration in the environment. While several different catalyst designs developed by different manufactures exist, the typical catalyst material is either platinum or palladium [10].
Hydrogen releases in nuclear power plants are occurring in so-called “severe accidents” involving the degradation of the reactor core. As a consequence, existing catalytic recombiners are designed for typical operating conditions between 70 and 150 °C and up to 5 bar [11]. However, the operating conditions will be very different in the event of accidents involving liquid hydrogen, like the lower temperatures and an acceptance for hydrogen concentrations below 4 vol.%.
In 2020, DNV performed a series of LH2 release experiments for the Norwegian Public Road Administration [12]. These tests were carried out to obtain more information on gaseous hydrogen distribution after leakages. The LH2 releases were performed in a 30 m3 closed container with a 13 m high vent stack. The enclosed space was equipped with thermocouples and oxygen sensors. The thermocouples that were consistently at the same elevations throughout all experiments were TT25 (top-central) and TT21 (top-east corner). These locations, which can be seen in Figure 1 [12], are considered possible positions to install catalytic recombiners.
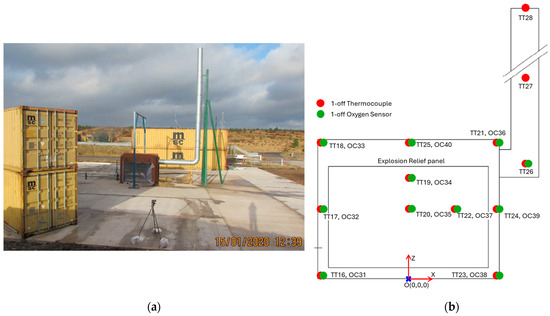
Figure 1.
(a) Photograph of the DNV test facility [12]; (b) Sensor positions [12].
Analyzing the public data, the thermocouple TT_25 averaged to −58 °C, with a maximum of −31.3 °C and a minimum of −91.6 °C. TT_21 averaged to −52.7 °C with a maximum of −11.0 °C and a minimum −78.8 °C. Based on the experimental results for the typical placement of a recombiner close to the ceiling, and in view of the experimental constraints, the temperature range from 20 °C to −50 °C was determined appropriate for the experiments presented in this paper.
Kelm et al. [13] simulated the operation of catalytic recombiners on board of a maritime LH2 carrier. However, the authors considered a leakage of gaseous hydrogen from a pipeline containing boil-off gas under environmental conditions. The experimental test series presented in this paper aims at providing fundamental information on the performance behavior of catalysts used in catalytic recombiners at significantly lower temperatures.
2. Materials and Methods
The experiments were performed with the REKO-1 facility, see Figure 2, a flow tube reactor located in the Hydrogen Lab on the Forschungszentrum Jülich campus in Germany. Experimentation with the REKO-1 facility allows for the investigation of the catalytic sheets under well-defined boundary conditions, such as a forced flow steady state conditions [14].
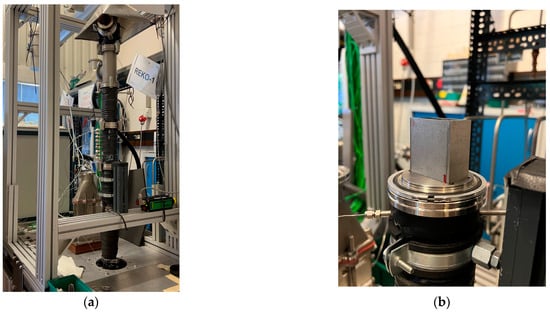
Figure 2.
(a) REKO-1 experimental facility; (b) Catalyst housing used in REKO-1.
2.1. Experimental Set-Up
REKO-1 is a vertical modular flow tube reactor. The flow channel is an assembly of several cylindrical stainless-steel tube modules with a wall thickness of 2 mm. The cylindrical channel has a total height of approximately 100 cm with an inner diameter of 70 mm. Figure 3 shows the flow diagram of the set-up which consists of the instrumented cylindrical flow tube (A) attached to a gas supply infrastructure (B). The gases are injected into the bottom and flow vertically to the outlet, passing through the flow reactor before entering a venting line on top. Before entering the venting line, a gas probe is continuously sampled by the gas analyzer system (C) to determine the outlet gas composition. The REKO-1 facility operates at ambient pressure.
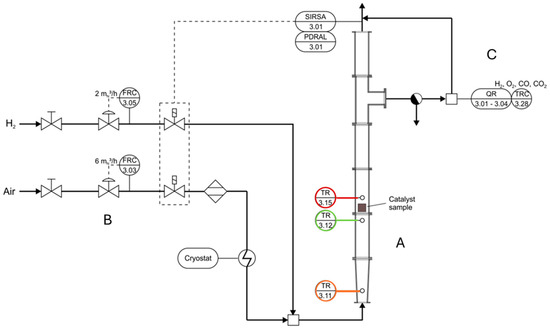
Figure 3.
Flow chart of REKO–1, indicating the positions of the mass flow controllers (FRCs), thermocouples (TRs), and gas analyzer (QR).
The inlet gas mixture is set using mass flow controllers (MFCs) for air and hydrogen. Air is injected at a maximum rate of 6 n-m3/h. The air flow is cooled down to temperatures up to −50 °C by means of a Huber Unistat P825 cryostat via a counter current heat exchanger. A heatless adsorption dryer has been installed between the air MFC and the heat exchanger to avoid ice formation. A hydrogen flow of up to 0.5 n-m3/h is mixed with the cold air flow and enters the reaction channel at the bottom of the facility. Both the hydrogen and the air MFC have a measurement uncertainty of ≤±1% of the measurement range.
In order to measure the gas temperature at the inlet, two thermocouples type K are used. TR3.11 is located near the injection point of the gases into REKO-1. TR3.12 is positioned immediately below the catalyst sheets. The two thermocouples are programmed for the range of −100 °C to 100 °C with an uncertainty of ±2.5 °C. Above the catalyst sheets, thermocouple TR3.15 is placed to measure the gas temperature behind the sheets. The measurement range has been programmed to be −80 °C to 400 °C with a temperature-dependent uncertainty between ±2.5 and 5.0 °C. After the gas passes by TR3.15, a sample of the gas mixture is continuously pumped through a heated line to an external gas analyzer to determine the composition of the mixture. The gas analyzer uses a heat conductivity sensor to measure the hydrogen concentration and a paramagnetic sensor to measure the oxygen concentration.
2.2. Catalysts
The experiments were performed with catalyst samples having a size of 5 × 5 cm2, as shown in Figure 4a. The generic catalysts were manufactured by company Chemical Consulting Dornseiffer in Aachen/Germany. The supporting material is a thin sheet of stainless steel with a thickness of 50 µm. The ceramic washcoat consists of 4 mg/cm2 γ-Al2O3. The amount of catalytic active material (either platinum or palladium) is 1 mg/cm2.
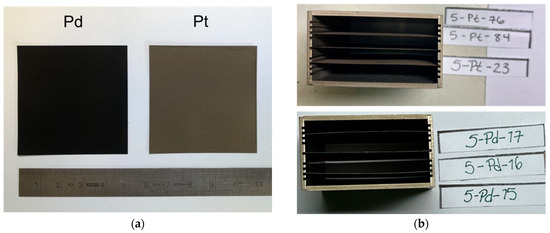
Figure 4.
(a) Catalyst sheets; (b) Arrangement of catalyst sheets inside a small housing.
In each test, three catalyst sheets were mounted inside the reaction channel. They are placed in a small rectangular housing with a separation of 0.5 mm apart from each other, as can be seen in Figure 4b.
2.3. Experimental Procedure
The experiments focused on the operational behavior of the typical recombiner catalysts in a temperature range of 20 °C to −50 °C at different hydrogen concentrations from 0.5 vol.% to 4 vol.%. Three different test series were performed with the two catalytic active materials typically used in catalytic recombiners: platinum and palladium. Three fundamental aspects were set to be answered:
At what hydrogen concentration does the reaction start (i.e., catalyst light-off)?
At what temperature does the reaction start?
At what temperature does the reaction stop?
In the first series of experiments, the light-off concentration is determined at specific temperatures. For this purpose, the procedure is as follows:
- Inject pre-cooled air until both inlet and outlet temperature are at the desired value.
- Inject hydrogen starting at 0.5 vol.%, increasing by steps of 0.5 vol.% every 5 min up to 4 vol.% until light-off occurs.
- Once the maximum operational temperature is sustained for ~5 min, stop hydrogen injection.
- Repeat the process from 0 °C to −50 °C in −10 °C steps.
In the second experimental series, the temperature at which the reaction starts is determined for specific hydrogen concentrations. The following procedure is applied:
- Inject pre-cooled air until both inlet and outlet temperature are at −50 °C.
- Inject a constant hydrogen/air mixture with the desired hydrogen fraction.
- Gradually increase the mixture inlet temperature until the reaction starts.
In the third series of experiments, the temperature at which the reaction stops is determined for specific hydrogen concentrations. For this purpose, the procedure is as follows:
- Inject a constant hydrogen/air mixture at ambient temperature.
- Reach the maximum operational temperature.
- Gradually decrease the mixture inlet temperature until −50 °C or until the reaction stops.
The experimental test matrix is shown in Table 1. Each experiment is performed three times to obtain a sound database. Since neither Pd nor Pt reacted at −50 °C, it was determined that reaching −40 °C for all subsequent light-off and other experiments was sufficient and backed up by the experiments.

Table 1.
Experimental test matrix for the three different test programs.
In order to ensure that the catalytic behavior is not dependent on a specific catalyst sample, multiple samples are used throughout the experimental program. Table 2 identifies the catalyst samples used in the respective experiments. The identification convention used is 5-AA-NN/NN/NN, where AA is the precious metal (Pt or Pd) and NN the individual sample number, respectively.
Table 2.
Catalyst sample number and the corresponding experiment they were used in.
The accuracy of the gas analyzer for different mixture temperatures was first determined. Figure 5 shows the histories of measured gas temperatures and gas concentrations. The inlet concentrations are set using the mass flow controllers. The primary y axis gives the gas temperature in °C, while the secondary y axis gives the hydrogen concentration in vol.%. Good agreement is observed between the known inlet and measured outlet concentrations as well as with the capability to cool down the gas to −50 °C at the inlet. Furthermore, the measurements are independent of the inlet temperature.
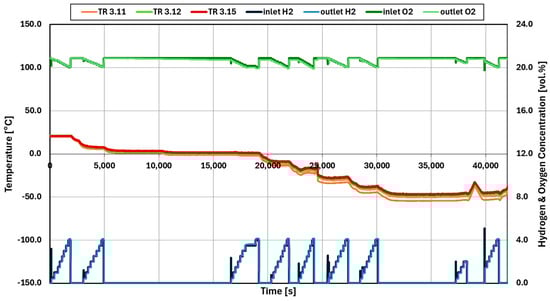
Figure 5.
Readings of the gas temperatures and the hydrogen concentration of the gas analyzer check.
3. Results
The test results are described in the following order: Light-off concentration, reaction start temperature, and termination temperature. For each test series, exemplary data progressions are shown.
3.1. Light-Off
Figure 6 shows the data history of experiment 005 using palladium catalysts. At an inlet temperature of −10 °C the light-off occurs with a hydrogen concentration of 1.0 vol.%. Light-off is determined by the steep rise in the outlet temperature (TR3.15). In addition, the outlet concentration decreases below the inlet hydrogen concentration. Following the procedure explained, the light-off is determined at each temperature step until −50 °C. There is no light-off occurring at −40 °C and −50 °C with a maximum concentration of hydrogen of 4 vol.%. This is confirmed by the absence of an increase in the outlet temperature (TR3.15) as well as the absence of a decrease in hydrogen concentration at the outlet.
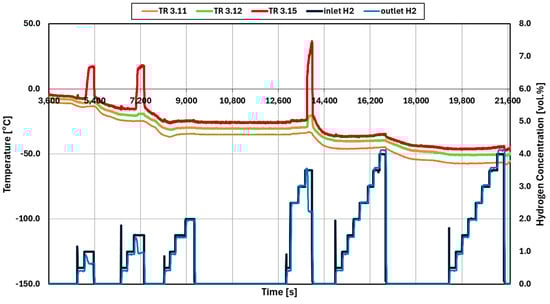
Figure 6.
Temperature and hydrogen concentration data of test 005 (Pd catalysts).
A crucial difference in the use of platinum versus palladium catalyst is the need for an initialization step. Initialization is completed by injecting hydrogen at ambient temperature until the catalyst lights-off. The importance is demonstrated by comparing the results from tests 007 and 009. The results from test 007 are shown Figure 7. Here, the same experimental procedure is followed as with test 005 for palladium, starting at 0 °C and stepwise increasing the hydrogen concentration until 4 vol.%. However, in contrast to Figure 6, we observe that no reaction occurs. No temperature increase at the outlet nor a decrease in the outlet hydrogen concentration is observed at any point in the experiment.
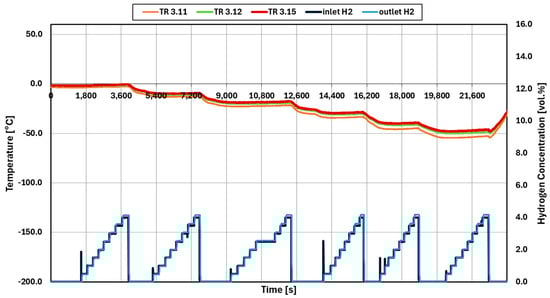
Figure 7.
Temperature and hydrogen concentration data of the non-initialized experiment 007 (Pt catalysts).
From the results of experiment 009, as shown in Figure 8, light-off is observed to occur only after a prolonged wait of 6045 s at an inlet temperature of about 0 °C. The inlet hydrogen concentration at this point is 0.5 vol.%. Light-off is confirmed by the steep increase in the outlet temperature (TR3.15) and the decrease in the outlet hydrogen concentration. Only after following this initialization procedure can subsequent light-off concentrations be determined. These concentrations were obtained at each temperature step until −50 °C. No light-off occurred at −40 °C and −50 °C with a maximum concentration of hydrogen of 4 vol.%.
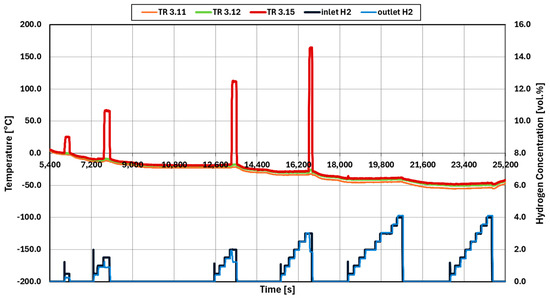
Figure 8.
Temperature and hydrogen concentration data of initialized test 009 (Pt catalysts).
The summarized results are discussed in Section 4.
3.2. Reaction Start and Termination Temperature
These experiments are performed in a combined way. First, the catalytic reaction is terminated by cooling down the feed gas. Then, the reaction start is identified by increasing the temperature of the injected gas flow. For experiment 035, see Figure 9, the catalysts used are palladium-based.
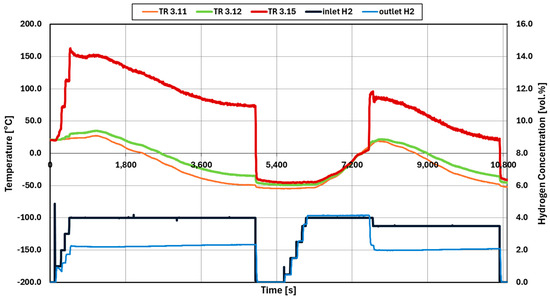
Figure 9.
Temperature and hydrogen concentration data of non-initialized experiment 035 (Pd catalysts).
The first hydrogen injection is 4 vol.% at 20 °C (dark blue line). The reaction begins soon after injection occurs, confirmed by the increase in the outlet temperature (TR3.15) and the light blue line of the gas analyzer. The inlet temperature is then decreased to −50 °C while the reaction is occurring. Since the heat produced from the reaction is very high at 4 vol.%, heat radiation causes an increase in the temperature below the catalyst, see the reading of TR3.12 (green). After reaching −40 °C, the hydrogen injection is stopped and the catalyst is cooled. In this test, the reaction did not stop as the inlet temperature was decreased.
In the second test phase, hydrogen is injected step wise until 4 vol.%. Once it is confirmed that there was no reaction occurring at −40 °C and 4 vol.%, the inlet temperature is increased until a reaction occurs. In this test, the reaction starts around 7602 s, confirmed by the steep increase in the outlet temperature (TR3.15) and the decrease in the outlet concentration of hydrogen.
Figure 10 shows experiment 016, where the reaction on palladium catalysts stops during cooling. During the test, 1.0 vol.% hydrogen is injected in reaction channel. The reaction starts shortly after the injection. Then, the inlet temperature is decreased. In contrast to test 035 (Figure 9), the reaction and heat produced is not able to be sustained while the inlet temperature decreases. At 9950 s, the inlet temperature (TR3.12) and outlet temperature (TR3.15) reach the same value at 0 °C. In addition, at 10,005 s, the inlet and outlet concentrations of hydrogen are equal at 1.0 vol.%.
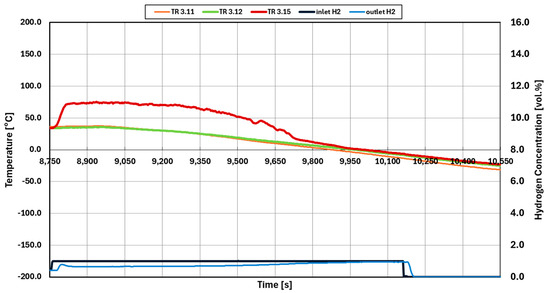
Figure 10.
Termination temperature for 1.0 vol.% hydrogen concentration of non-initialized experiment 016.
Figure 11 shows the experiment 033 which is using platinum catalysts. Not shown is the initialization as described earlier. The test program starts with lowering the temperature of the mixture of 3.5 vol.% hydrogen in air to −50 °C. After confirming that no reaction occurs, the temperature of the inlet gas is increased until a reaction occurs. The reaction starts at 22,113 s, visible from the increase in the outlet temperature and the decrease in the outlet concentration of hydrogen.
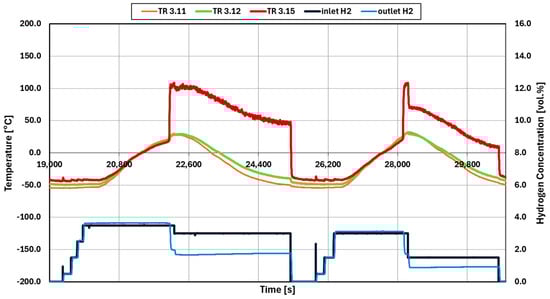
Figure 11.
Temperature and hydrogen concentration data of initialized experiment 033 (Pt catalysts).
After reaching an inlet temperature of around −40 °C, the hydrogen injection of 3.5 vol.% is stopped. The catalyst is then given time to cool. When the temperatures are close together again at −40 °C, the hydrogen is then injected step wise until 3.0 vol.%. Around 28,122 s, the reaction began, confirmed by the increase in the outlet temperature, TR3.15, and decrease in outlet concentration of hydrogen.
4. Discussion
The results of the light-off experiments (see Section 3.1) are summarized in Figure 12 (platinum catalyst) and Figure 13 (palladium catalyst). The diagrams show the minimum hydrogen concentrations required for catalytic reaction at the given inlet temperature.
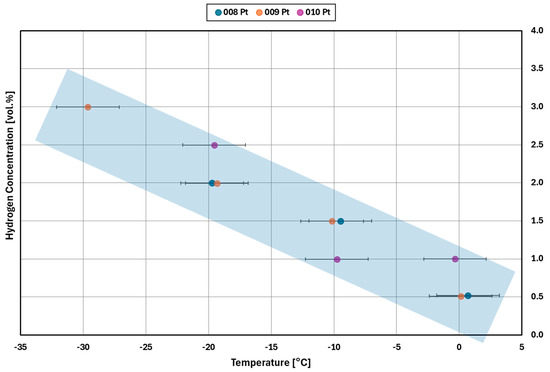
Figure 12.
Light–off concentration for different inlet gas temperatures for the platinum catalyst for three replicate measurements (experiments 008, 009, and 010).
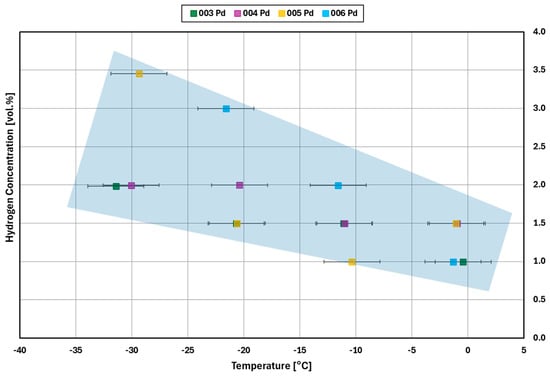
Figure 13.
Light–off concentration for different inlet gas temperatures for the palladium catalyst for four replicate measurements (experiments 003, 004, 005, 006).
For the platinum catalyst (Figure 12), the results show quite consistently that a higher concentration of hydrogen is needed for the light-off to occur as the inlet temperature decreases. No light-off is observed for temperatures below −30 °C. The comparison of the results of tests 008 and 009 confirms that the initialization does not impact the repeatability of the tests. The same results are obtained down to −30 °C, where the first deviation occurs between the two tests.
Similar to the platinum catalysts, the results for palladium show that for a decreasing inlet temperature, a higher hydrogen concentration is needed for the light-off to occur (Figure 13). With the palladium catalysts, light-off occurred at −30 °C in all three tests, while there is only one such result for platinum (see Figure 12). However, the results for palladium appear to be stochastic. As for platinum, there is no light-off observed for temperatures significantly below −30 °C for hydrogen concentrations from 0.0 vol.% to 4.0 vol.%.
Figure 14 and Figure 15 summarize the results for the temperature required for the reaction to start at a given hydrogen concentration for platinum and palladium catalysts, respectively. While some of the experiments saw a reaction starting around −15 °C, the majority of experiments saw a reaction only around +10 °C and above, independent from the hydrogen concentration.
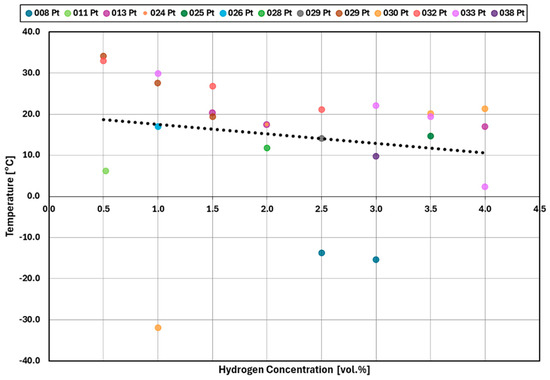
Figure 14.
Temperature at which the catalytic reaction started for platinum.
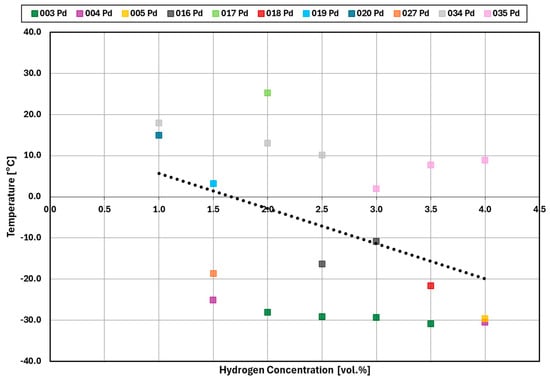
Figure 15.
Temperature at which the catalytic reaction started for palladium.
For a hydrogen concentration greater than or equal to 1.5 vol.%, the platinum catalyst reaction starts at around 20 °C while the palladium catalyst reaction starts at around an average of −10 °C.
For hydrogen concentrations at 1.0 vol.% the palladium reaction either started around +15 °C or the reaction did not start. In the case of platinum, the reaction started at around 30 °C. Unlike platinum, the reactions with 0.5 vol.% and 1.0 vol% did not start for palladium. The results for both platinum and palladium are again stochastic and appear to have random variation in catalytic performance.
Table 3 is the accumulation of the data from the experiments using the palladium catalyst in order to determine whether the reaction stops when the inlet temperature decreases. The palladium catalyst that was less than or equal to 1.0 vol.% the reaction stopped. However, a palladium catalyst greater than or equal to 2.0 vol.% reaction did not stop even with a decrease in the inlet temperature to around −40 °C.
Table 3.
Palladium catalyst for determining the concentration at which the reaction stopped.
Table 4 is the accumulation of the data from the experiments using the platinum catalyst in order to determine whether the reaction stops when the inlet temperature decreases. The platinum catalyst less than or equal to 0.5 vol.% the reaction stopped. However, a palladium catalyst greater than or equal to 1.0 vol% reaction did not stop even with a decrease in the inlet temperature to around −40 °C.
Table 4.
Platinum catalyst for determining what concentration the reaction stopped.
The platinum catalyst is able to continue/sustain a reaction greater than or equal to 1.0 vol.% with a decreasing inlet temperature. On the other hand, palladium is unable to continue or sustain a reaction with a hydrogen concentration of less than or equal to 1.5 vol.%.
Most of the catalyst samples are used more than once, see Table 2, with tests ranging from 7 h to over an hour. This shows the ability for the low temperature cycling without a clear pattern of activity decay. For example, experiments 008 and 009 show similar results for platinum in Figure 12 with a difference in behavior at −30 °C. However, with palladium results in Figure 13, the second experiment performed with a catalyst sample, 004 and 006, and required more hydrogen at all temperature steps except for −30 °C.
5. Conclusions
The goal of the present study was to provide information on the performance behavior of catalysts used currently in catalytic recombiners at low temperatures. The light-off hydrogen concentration, the temperature at which the reaction starts, and the termination temperature were all examined. For this purpose, experiments were conducted in a temperature range of 20 °C down to −50 °C with the REKO-1 facility using platinum and palladium catalysts.
Within the tested concentration range of up to 4 vol.% of hydrogen in air, the platinum catalyst exhibited better performance overall as compared to the palladium catalyst. Both catalysts required a higher hydrogen concentration as the temperature decreased.
The test results show that the transfer of the recombiner technology to applications beyond nuclear power plants will be difficult. In particular, the start-up behavior is subject to significant restrictions. Both catalysts require higher inlet concentrations for starting at lower temperatures. Once the catalyst is activated, it remains active only down to temperatures of around −40 °C. Furthermore, the results indicated that starting the catalyst at low temperatures varied and was not consistent. On the other hand, once a reaction was started and heat was produced, lowering the inlet temperature did not have a large impact on the recombination.
In the hypothetical case of temperatures even lower than those investigated in the experiments, it can be assumed that increasing the hydrogen concentrations will be required for the operation of the recombiner. This would probably mean that the goal of keeping the hydrogen concentration below the lower ignition limit cannot be achieved and additional safety measures would have to be taken. Therefore, having catalyst sheets slightly warmed would allow for the quicker startup of the recombiner operation. It is therefore recommended that the future evaluation of recombiners include having heated catalysts.
Most catalyst samples were used more than once, giving a first impression of the cyclic durability of the catalysts. However, more rigorous testing in combination with surface analytical techniques could provide more profound insights. For example, a change in the catalyst surface, which could be analyzed using analytical techniques such as X-ray diffraction, could be responsible for the high randomness of the results. Such a combination of data could support the development of different catalyst compositions that are more suitable for use in cold conditions. The present results show the improvements necessary for the applicability of recombiners for LH2 safety. A more detailed recombiner design would require additional testing to account for further aspects, such as catalyst poisoning.
Author Contributions
Conceptualization, methodology, experimental investigation, formal analysis, data curation, visualization, writing—original draft preparation: S.K.; supervision, project administration, funding acquisition, writing—review and editing: E.-A.R. Writing—review and editing—A.P.A. All authors have read and agreed to the published version of the manuscript.
Funding
This research was funded by German Federal Ministry of Education and Research, grant number 01DR22007.
Data Availability Statement
The datasets presented in this article are not readily available because the work is part of an unpublished doctoral thesis. Requests to access the datasets after August 2025 should be directed to Ernst-Arndt Reinecke.
Conflicts of Interest
Author Shannon Krenz and Ernst-Arndt Reinecke was employed by the company Forschungszentrum Jülich GmbH. The remaining authors declare that the research was conducted in the absence of any commercial or financial relationships that could be construed as a potential conflict of interest.
Abbreviations
The following abbreviations are used in this manuscript:
| LH2 | Liquid hydrogen |
| MFC | Mass flow controller |
| Pd | Palladium |
| Pt | Platinum |
References
- GTI-Energy-Storage-White-Paper-05-2022.pdf. Available online: https://www.gti.energy/wp-content/uploads/2022/05/GTI-Energy-Storage-White-Paper-05-2022.pdf (accessed on 16 April 2024).
- Ustolin, F.; Campari, A.; Taccani, R. An extensive review of liquid hydrogen in transportation with focus on the maritime sector. J. Mar. Sci. Eng. 2022, 10, 1222. [Google Scholar] [CrossRef]
- Liang, B.; Gao, Y.; Wei, H.; Zhang, T.; Hou, Y. Review of liquid hydrogen leakage: Factors and safety measures. In Proceedings of the 10th Hydrogen Technology Convention, Foshan, China, 22–26 May 2023; Springer: Singapore, 2023; pp. 7–19. [Google Scholar] [CrossRef]
- Schiaroli, A.; Claussner, L.; Campari, A.; Cirrone, D.; Linseisen, B.; Friedrich, A.; de Ritter, E.T.; Kuznetsov, M.; Ustolin, F. A comprehensive review on liquid hydrogen transfer operations and safety considerations for mobile applications. Int. J. Hydrogen Energy 2025, 107, 164–182. [Google Scholar] [CrossRef]
- Jordan, T.; Jallais, S.; Bernard, L.; Venetsanos, A.; Coldrick, S.; Kuznetsov, M.; Cirrone, D. Status of the pre-normative research project PRESLHY for the safe use of liquid hydrogen. In Proceedings of the International Conference on Hydrogen Safety, Adelaide, Australia, 24–26 September 2019. [Google Scholar]
- Ustolin, F.; Cirrone, D.; Molkov, V.V.; Makarov, D.; Venetsanos, A.G.; Giannissi, S.G.; Scarponi, G.E.; Tugnoli, A.; Salzano, E.; Cozzani, V.; et al. Enhancing safety of liquid and vaporised hydrogen transfer technologies in public areas for mobile applications. In Proceedings of the International Conference on Hydrogen Safety, Quebec, Canada, 19–21 September 2023. [Google Scholar]
- Tanaka, H.; Reinecke, E.A.; Chaumeix, N.; Bentaib, A.; Taniguchi, M.; Matsumura, D.; Krenz, S.; Jinjo, I.; Nakayama, T.; Uegaki, S.; et al. Experimental verification to developing safety technology for liquefied hydrogen in the project “STACY”. Int. J. Hydrogen Energy 2025. [Google Scholar] [CrossRef]
- XRocourt; Mélani, L.; Sochet, I.; Jallais, S. Flammability limits of hydrogen mixtures diffusing in air. In Proceedings of the 31st Meeting of the Italian Section of The Combustion Institute, Torino, Italy, 17–20 June 2008. [Google Scholar]
- Bachellerie, E.; Arnould, F.; Auglaire, M.; de Boeck, B.; Braillard, O.; Eckardt, B.; Ferroni, F.; Moffett, R. Generic approach for designing and implementing a passive autocatalytic recombiner PAR-system in nuclear power plant containments. Nucl. Eng. Des. 2003, 221, 151–165. [Google Scholar] [CrossRef]
- Man, T.; Feng, Y.; Zhou, X.; Guo, Z.; Ding, M. A review on PAR operating characteristics and impact on hydrogen behaviors in containment of PWRs. Nucl. Eng. Des. 2025, 432, 113806. [Google Scholar] [CrossRef]
- Reinecke, E.A.; Gabriela, N.; Bentaib, A.; Araceli, D.B.; Gonzalo, J.; Matthias, B.; Stephan, S.; Claudia, D.; Michael, K. Outcomes of the experimental and numerical work on the operational behavior of passive autocatalytic recombiners in the late phase of a severe accident in the framework of the AMHYCO project. In Proceedings of the 11th European Review Meeting on Severe Accident Research, Stockholm, Sweden, 13–16 May 2024. [Google Scholar]
- Aaneby, J.; Gjesdal, T.; Voie, Ø. Large Scale Leakage of Liquid Hydrogen (LH2)—Tests Related to Bunkering and Maritime Use of Liquid Hydrogen. Norway, FFI-Rapp. 2003101, January 2021. Available online: https://www.ffi.no/en/publications-archive/large-scale-leakage-of-liquid-hydrogen-lh2-tests-related-to-bunkering-and-maritime-use-of-liquid-hydrogen (accessed on 2 February 2025).
- Kelm, S.; Baggemann, J.; Reinecke, E.-A.; Verfondern, K.; Kamiya, S. Simulation of hydrogen mixing and PAR operation during accidental release in a LH2 carrier engine room. In Proceedings of the International Conference on Hydrogen Safety 2021, Edinburgh, UK, 21–24 September 2021; Available online: https://hysafe.info/ichs2021/conference-papers-and-presentations/ (accessed on 29 January 2025).
- Payot, F.; Reinecke, E.-A.; Morfin, F.; Sabroux, J.-C.; Meynet, N.; Bentaib, A.; March, P.; Zeyen, R. Understanding of the operation behaviour of a Passive Autocatalytic Recombiner (PAR) for hydrogen mitigation in realistic containment conditions during a severe Light Water nuclear Reactor (LWR) accident. Nucl. Eng. Des. 2012, 248, 178–196. [Google Scholar] [CrossRef]
Disclaimer/Publisher’s Note: The statements, opinions and data contained in all publications are solely those of the individual author(s) and contributor(s) and not of MDPI and/or the editor(s). MDPI and/or the editor(s) disclaim responsibility for any injury to people or property resulting from any ideas, methods, instructions or products referred to in the content. |
© 2025 by the authors. Licensee MDPI, Basel, Switzerland. This article is an open access article distributed under the terms and conditions of the Creative Commons Attribution (CC BY) license (https://creativecommons.org/licenses/by/4.0/).