Abstract
Efficient hydrogen storage is critical for advancing hydrogen-based technologies. This study investigates the effects of pressure and surface area on hydrogen storage in three carbon-based materials: graphite, graphene oxide, and reduced graphene oxide. Hydrogen adsorption–desorption experiments under pressures ranging from 1 to 9 bar revealed nonlinear storage capacity responses, with optimal performance at around 5 bar. The specific surface area plays a pivotal role, with reduced graphene oxide and exhibiting a surface area of 70.31 m2/g, outperforming graphene oxide (33.75 m2/g) and graphite (7.27 m2/g). Reduced graphene oxide achieved the highest hydrogen storage capacity, with 768 sccm and a 3 wt.% increase over the other materials. In assessing proton-exchange fuel cell performance, this study found that increased hydrogen storage correlates with enhanced power density, with reduced graphene oxide reaching a maximum of 0.082 W/cm2, compared to 0.071 W/cm2 for graphite and 0.017 W/cm2 for graphene oxide. However, desorption rates impose temporal constraints on fuel cell operation. These findings enhance our understanding of pressure–surface interactions and underscore the balance between hydrogen storage capacity, surface area, and practical performance in carbon-based materials, offering valuable insights for hydrogen storage and fuel cell applications.
Keywords:
hydrogen storage; graphite; GO; rGO; PEM fuel cells; pressure; surface area; power density; adsorption–desorption 1. Introduction
Hydrogen can be one of the best alternatives to fossil fuels due to its safe, clean, abundant, non-polluting, and reasonably economical nature. Hydrogen is considered one of the most promising energy carriers due to its clean combustion and minimal greenhouse gas emissions. Although hydrogen does not exist in substantial quantities in its elemental form in nature, technological advances in large-scale renewable energy have created opportunities for green hydrogen production. In particular, water electrolysis powered by renewables effectively addresses the intermittency and variability of clean energy sources. This integrated approach not only supplies hydrogen for various applications but also contributes to global efforts aimed at large-scale deep decarbonization [1]. Even though hydrogen has remarkable properties, it is difficult to store and transport and possesses risks regarding flammability [2,3]. Many hydrogen storage methods have been investigated, and compressed hydrogen, liquid hydrogen, and solid-state hydrogen storage methods have been proposed [4,5,6]. However, almost all hydrogen storage methods have essential disadvantages, such as requirements for a high-pressure tank, cryogenic storage, and high-cost storage equipment [4]. The solid-state hydrogen storage method provides economic and safety benefits for hydrogen storage. Metal hydrides are commonly employed for this purpose, with light metals (Li, Be, Na, Mg, B, and Al) forming various metal–hydrogen compounds [7,8]. However, metal hydrides used for hydrogen storage present several limitations, including the need for high temperatures to release hydrogen, sluggish desorption kinetics, and high sensitivity or reactivity to air and oxygen [7]. Along with the suggested approaches for storage, there has been a surge of interest in finding and developing new types of materials to provide alternative solutions for hydrogen storage. Recently, researchers have investigated new materials to overcome hydrogen storage challenges. Therefore, new material combinations can exhibit high volumetric/gravimetric hydrogen adsorption potential and fast kinetics at room temperature. One such material, carbon, is one of the most effective adsorbents for gases as carbon-based nanostructured materials have dramatically different and attractive chemical, physical, thermodynamic, and transport properties [9,10]. Carbon-based materials exhibit interesting morphologies with highly porous structures, as well as particular interactions between the carbon atoms and gas molecules [11,12]. One of the most popular carbon materials is graphite, which is found in nature. Graphite has sp2 hybridization graphite layers that are weakly bonded by Van der Waal’s forces, which hold the layers together above and below [13]. Density functional theory (DFT) was used to determine the molecular hydrogen storage of graphite that has a wider layer distance at room temperature. The hydrogen storage ratio was determined as 3.48 wt.%, and it was reported at a temperature of 300 K and a pressure of 0.1 GPa [14]. Angela D. Lueking et al. used graphite as a hydrogen storage material and obtained 1.2% hydrogen uptake at 77 K and 20 bar [15]. Recent studies have demonstrated that functionalization (through oxygen-, sulfur-, or phosphorus-containing groups) and heteroatom doping (with nitrogen, boron, or sulfur) in carbon-based materials can effectively alter the electron density and binding energies, thus creating additional adsorption sites and enhancing hydrogen uptake, even under moderate pressures [16,17]. Furthermore, metal and metal oxide decoration of graphene (e.g., Pt, Pd, and MgO) is known to promote hydrogen spillover, potentially lowering the operational pressure required for appreciable storage capacity [18,19]. Despite these advances, many current approaches still depend heavily on high-pressure hydrogen environments for sufficient storage densities, posing safety and economic challenges. Addressing this query has direct relevance for proton-exchange membrane (PEM) fuel cells, which require a stable, high-purity hydrogen supply to maintain optimal power output and efficiency [20]. By coupling judicious material designs via doping, functionalization, and defect engineering with moderate-pressure operation, future research may pave the way for scalable, safer, and more cost-effective hydrogen storage systems that seamlessly integrate with PEM fuel cells, ultimately facilitating the widespread adoption of hydrogen technologies in the clean energy transition.
Graphene is the most popular carbon material and it exhibits superior properties in the 2D materials family. It was isolated from graphite in 2004 by Geim and Novoselov. Graphene has hydrogen storage potential because of its large surface area (2630 m2/g), high activity, and high thermal conductivity (5000 W/mK) [21]. G. Srinivas et al. showed that hydrogen adsorption–desorption potential was determined in the temperature range of 77–298 K and at pressures of up to 10 bar. They determined that graphene oxide (GO) possessed hydrogen storage potentials of approximately 1.2 wt.% and 0.1 wt.% at 77 K and 298 K, respectively [22]. Byung Hoon Kim et al. obtained a maximum hydrogen storage capacity of 4.8 wt.% at 9 MPa pressure and 77 Kelvin, and there was an interlayer distance of 6.5 Å in the GO structure [23]. Rajveer Singh Rajaura et al. investigated the role of interlayer spacing and functional groups on the hydrogen storage capacity of reduced graphene oxide (rGO). They showed that inert-layer spacing provides greater hydrogen storage potential. In this study, the hydrogen storage capacity of rGO was determined as 1.34 wt.% at room temperature and a pressure of 80 bar [24].
In the present study, the hydrogen storage potential of graphite, GO, and rGO was determined under different pressures (1–9 bar). In this regard, the hydrogen storage ability of these materials was compared. The specific surface area of graphite, GO, and rGO was determined, and its effect on hydrogen storage was observed. In addition, the effect of hydrogen pressure on hydrogen storage was examined for different groups of materials. After determining the hydrogen storage potential of graphite, GO, and rGO, these solid materials were used as hydrogen sources in proton-exchange membrane (PEM) fuel cells. The hydrogen storage potential of graphite, GO, and rGO in PEM fuel cells was demonstrated. Furthermore, the effect of solid-state hydrogen storage on the operating performance of PEM fuel cells was observed.
2. Materials and Methods
2.1. Synthesis of Graphene Oxide and Reduced Graphene Oxide
Graphite powder (99%) was acquired from USA Sigma Aldrich. To prepare GO using a modified Hummers method, 10 mL of sulfuric acid (H2SO4) was first combined with 1 g of potassium permanganate (KMnO4) and stirred for 30 min. Next, 2 g of graphite powder was introduced to the mixture under constant stirring. Following this step, 200 mL of deionized (DI) water was added until the mixture turned dark brown. Hydrogen peroxide (H2O2) was then incorporated as the final reagent. Afterward, the resulting mixture was filtered and dried at 50 °C in a furnace, producing a solid mostly composed of graphite oxide. To enhance layer separation, this dried material was resuspended in DI water and sonicated for several hours, ultimately yielding GO after separating the exfoliated layers. Subsequently, a reduction process was carried out to obtain rGO. Specifically, hydrazine hydrate (N2H4) was employed as the reducing agent by slowly adding 5 mL to 100 mL of the GO solution, which remained in an ultrasonic bath for 5–6 h. The mixture was then filtered, washed with distilled water, and dried at 70 °C. The resulting solid, confirmed to be rGO by spectroscopic analysis, exhibited characteristic structural features of reduced graphene oxide.
2.2. Hydrogen Adsorption–Desorption Processes
Graphite, GO, and rGO were investigated regarding hydrogen adsorption. First, 1 g of graphite, GO, and rGO was placed into a steel reactor. The whole system was evacuated before being exposed to hydrogen for 20 min until a 10−2 Torr vacuum removed impurities such as the adsorbed water, oxide layers, nitrogen, and other gases from the reactor. The hydrogen adsorption experiments were conducted at a controlled temperature of 25 ± 1 °C using a thermostatically regulated environment to ensure consistency across all measurements. The system was monitored to prevent temperature fluctuations that could affect hydrogen adsorption behavior. Then hydrogen adsorption was implemented under a hydrogen pressure of 1, 3, 5, 7, and 9 bar for graphite, GO, and rGO for 30 min. A gas regulator and barometer were used to determine the hydrogen gas pressure. Once the hydrogen adsorption process had finished, the reactor was placed onto the hot plate at 200 °C for the desorption of hydrogen. The adsorption and desorption of hydrogen were measured using a mass flow controller (MFC) (standard cubic centimeters per minute—sccm) and an accurate scale to measure the weight of the adsorbed hydrogen precisely. Ahead of the real experiments, the system (reactor) was calibrated while it was empty. To do this, the empty reactor was pressurized with high-purity hydrogen (99.99%) at various hydrogen pressures (1–9 bar). Then, the hydrogen in the reactor was evacuated at 200 °C to remove the hydrogen by tracking the hydrogen flow.
2.3. Characterization of Graphite, Graphene Oxide, and rGO
The crystallite quality and phase composition of the samples were analyzed using X-ray diffraction (XRD) with a PANalytical-EMPYREAN instrument, NL operating at a wavelength of 1.5406 Å. Raman spectroscopy was performed with a Renishaw inVia Spectrometer, UK, offering a spectral resolution of approximately 1 cm⁻1 and employing a 633 nm excitation wavelength. Surface morphology was examined using a ZEISS-GeminiSEM scanning electron microscope (SEM), Germany. The specific surface area and porosity of the materials were determined via the Brunauer–Emmett–Teller (BET) method. Additionally, gas desorption behavior was evaluated using a mass flow controller (MFC).
2.4. PEM Fuel Cell Application
The hydrogen gas was introduced to the system from a reactor, and to facilitate its transport, the reactor was connected to the cell station. The reactor with hydrogen adsorbed in H-Gr, H-GO, and H-rGO materials was integrated into the system from the hydrogen inlet of the PEM fuel cell. Before the stored hydrogen was sent to the system, fuel cell activation was achieved by sending 100 sccm of hydrogen for 30 s. The anode side was completely sealed from the ambient atmosphere to ensure that the hydrogen in the tube was sent to the fuel cell without leakage.
During the experiments, commercially available membrane electrode assembly (MEA), stainless steel bipolar plates, and end plates were utilized. The bipolar plates had dimensions of 55.25 mm width, 92 mm length, and 2 mm thickness, which were specifically chosen to match previously fabricated and experimentally investigated flow plates [25]. To enhance electrical conductivity, stainless steel bipolar plates were coated with a 50 nm gold layer using magnetron sputtering.
Fuel cell power measurements were conducted using a Brand Test Station (Arbin Instruments, FCTS-800, College Station, TX, USA) with the cathode side exposed to the ambient atmosphere. The operating temperature was maintained at 75 °C. Once the system reached the desired temperature, the cells were supplied with humidified hydrogen and air. The test setup employed Nafion™ XL-based five-layer membrane electrode assemblies (MEAs), each with a platinum catalyst loading of 0.5 mg/cm2 on both the anode and cathode sides. Silicon gaskets were used for sealing, and gold-plated copper was utilized for current collection. Aluminum T6 end plates were included for structural support. The active area of each MEA was approximately 25 cm2.
3. Results
3.1. Hydrogen Storage Properties of Graphite
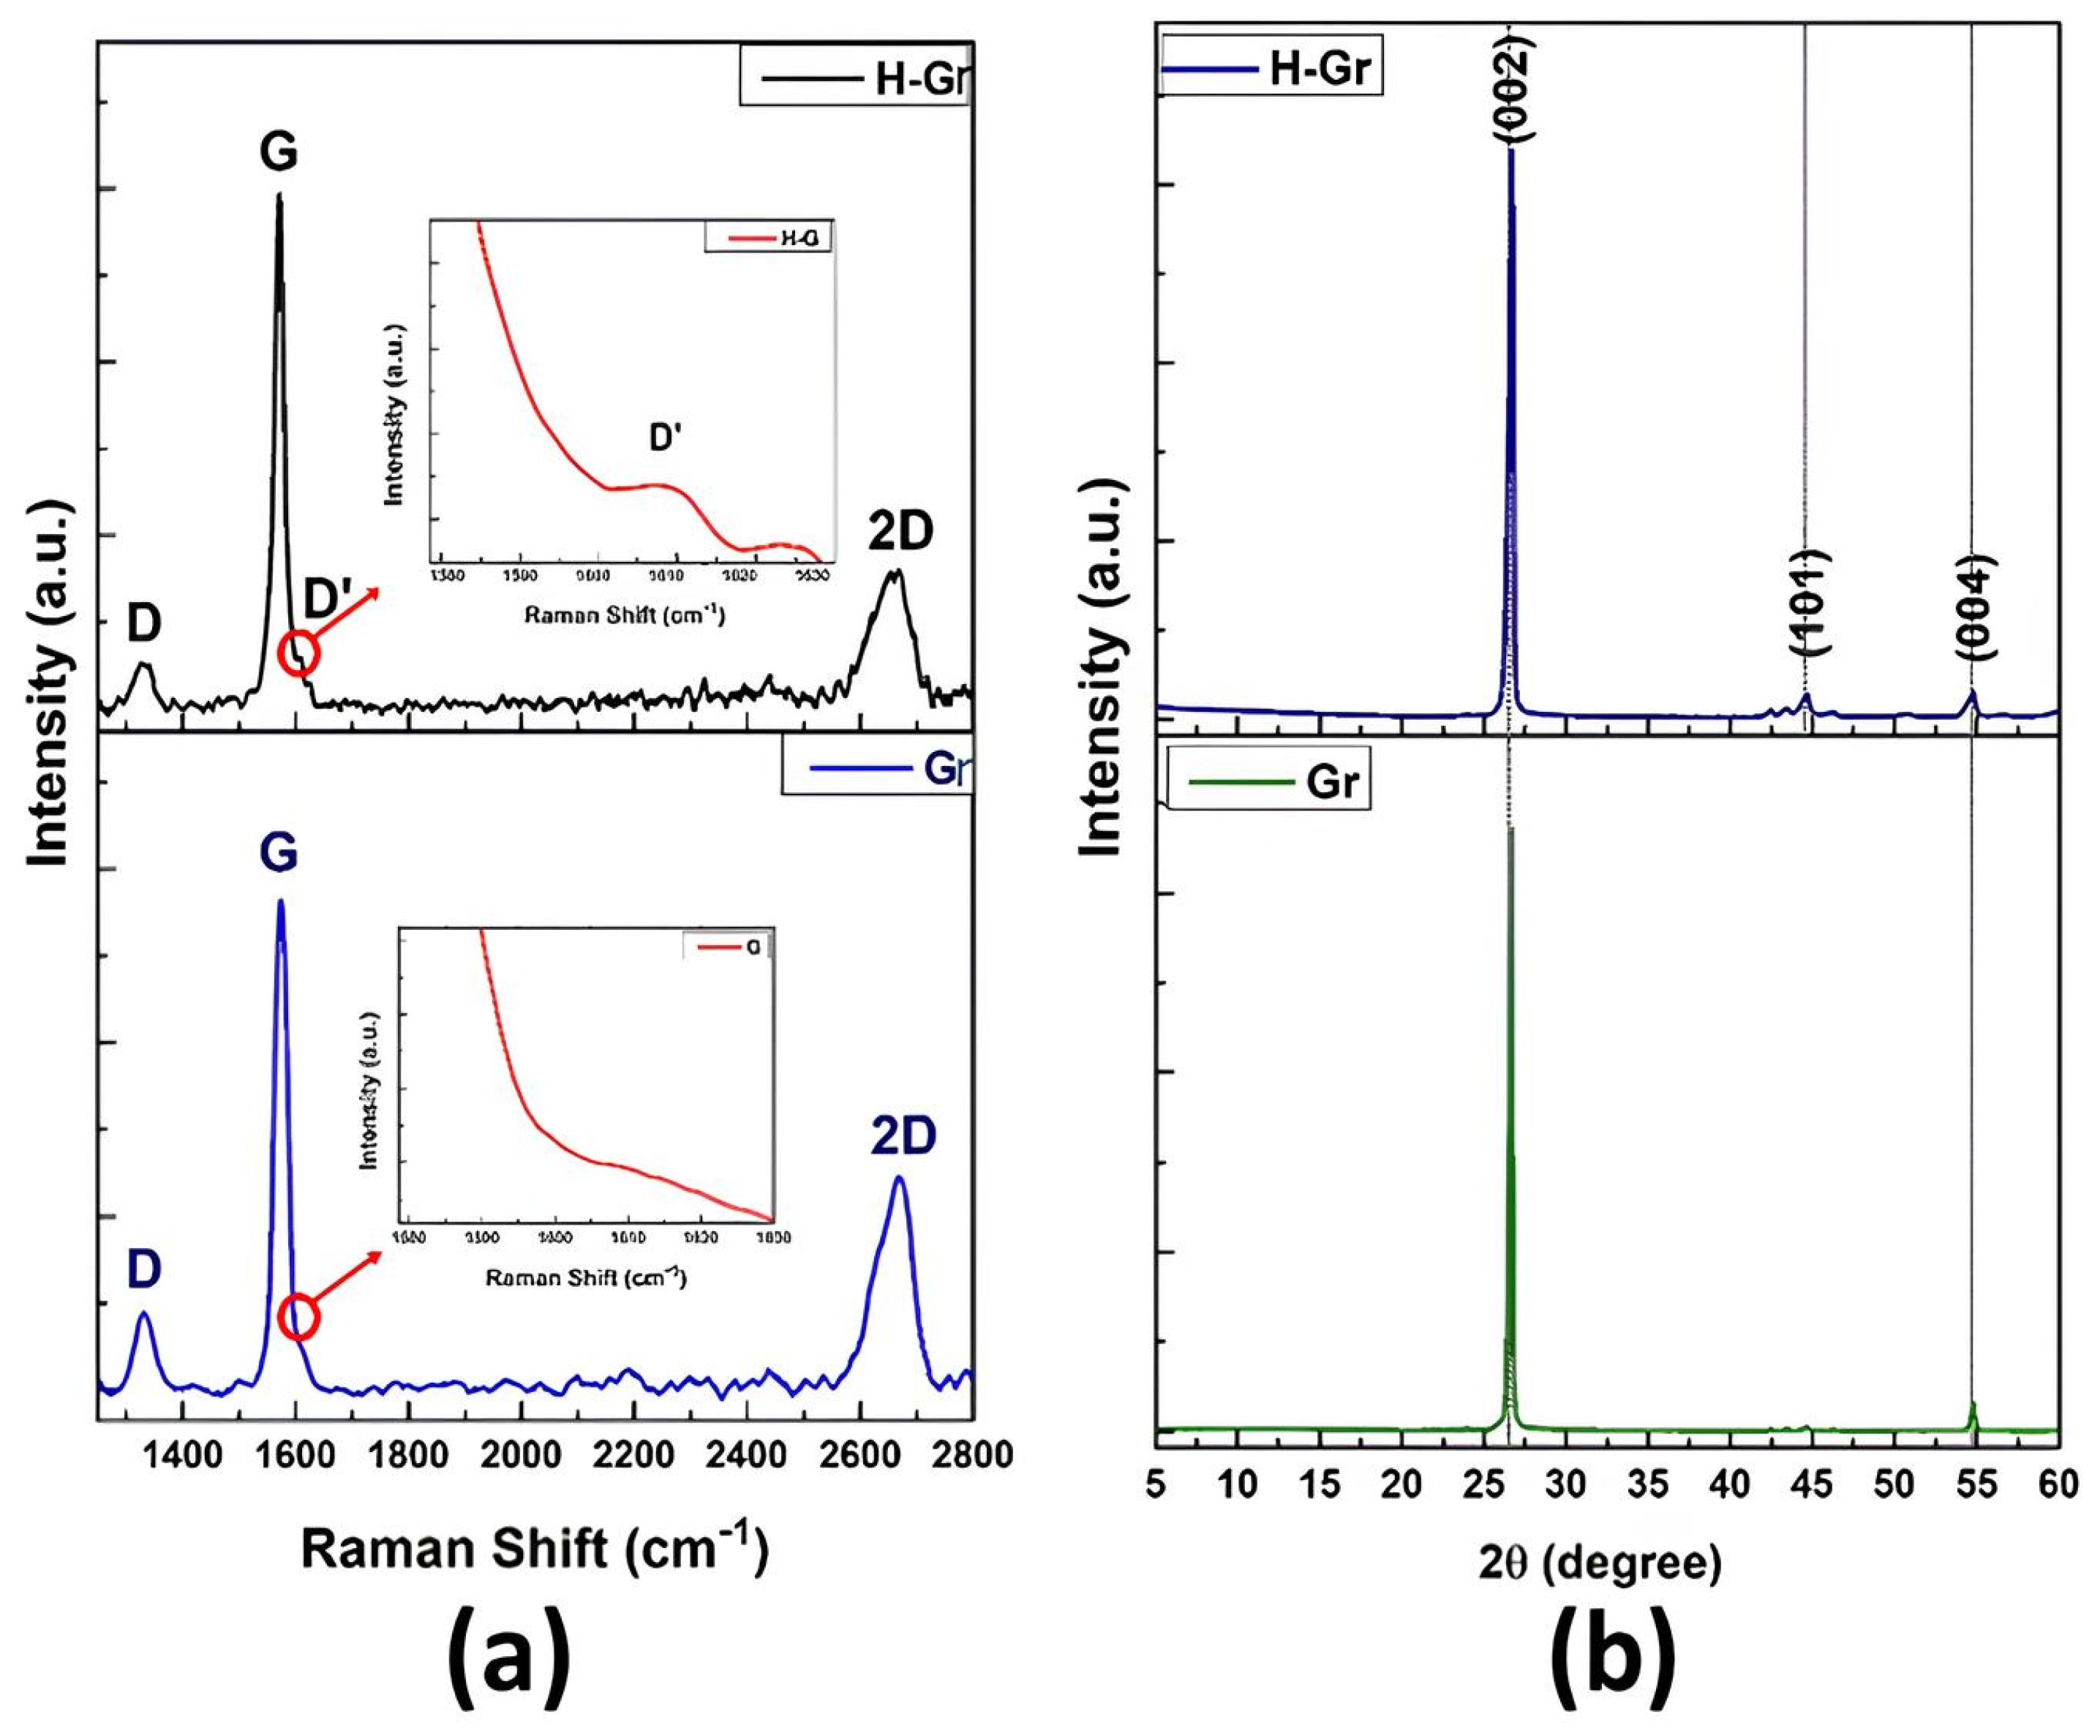
Raman spectroscopy is an important tool for determining the sp2 and sp3 hybridization of carbon atoms in graphitic structures. In this regard, the structural investigation of graphite (Gr) and hydrogen-adsorbed graphite (H-Gr) was performed using a Raman spectrometer. Carbon-based materials mainly show three main bands, D, G, and 2D, in their Raman spectrums. The D band is associated with defects and impurities in the graphitic structure. The G band shows the crystalline quality of carbon and arises due to vibrations of sp2 carbon atoms [26,27]. The 2D band can be used for thickness identification and is due to two phonons with opposite momentums [28]. The Raman spectra of Gr and H-Gr are given in Figure 1a and Raman band position are presented in Table 1. One of the most noticeable items in the spectra is the appearance of a D’ band. The D’ band appeared at 1620 cm−1 after hydrogen adsorption and was not observed in pristine graphene. This band is associated with impurities in the carbon structure [29,30]. In addition, the FWHM of the 2D band slightly expanded and the intensity decreased in contrast to the G band. Thus, the I2D/G ratio of Gr is higher than H-Gr, which is due to the hydrogen atoms potentially causing distortion in the structure. The D band was detected at 1332 cm−1 and 1329 cm−1 for Gr and H-Gr, respectively. The development of the D band’s intensity in H-Gr can be attributed to the interruption of π electron delocalization resulting from the formation of C-H sp3 bonds due to hydrogen adsorption [31].
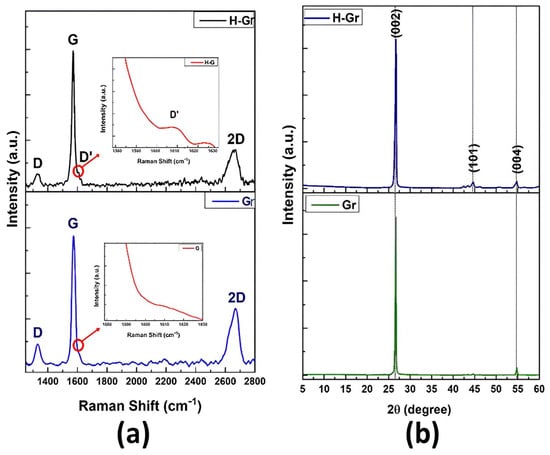
Figure 1.
Raman spectra of Gr and H−Gr (a) and XRD patterns of Gr and H−Gr (b).

Table 1.
Raman band positions of Gr and H-Gr.
The XRD patterns of Gr and H-Gr are given in Figure 1b and the structure was assigned to JCPDS (00-041-1487) hexagonal graphite. The diffraction pattern of Gr and H-Gr has the most intense peaks, appearing at 2θ = 26.65° and 2θ = 26.69° and corresponding to the (002) plane of graphite. Additionally, there is another peak in both diffraction patterns, indicating (004) planes [32]. However, the peak observed at 44.55° in the 2θ range for H-Gr corresponds to the contribution of the graphite (101) peak within the hexagonal graphite structure. Furthermore, the presence of the (101) peak from the rhombohedral symmetry phase indicates deformations within the hexagonal graphite structure [33]. This deformation could potentially be attributed to interactions between carbon and hydrogen. Additionally, Scherrer’s formula [34] was employed to calculate the crystallite size based on the full width at half maximum (FWHM) values. The FWHM values of crystallite sizes, as shown in Table 2, demonstrate an increase following hydrogen adsorption. This outcome is attributed to the deformation of the carbon structure.
Table 2.
The FWHM value of the (002) diffraction peak was extracted from the XRD data and used to calculate the crystallite size using Scherrer’s equation.
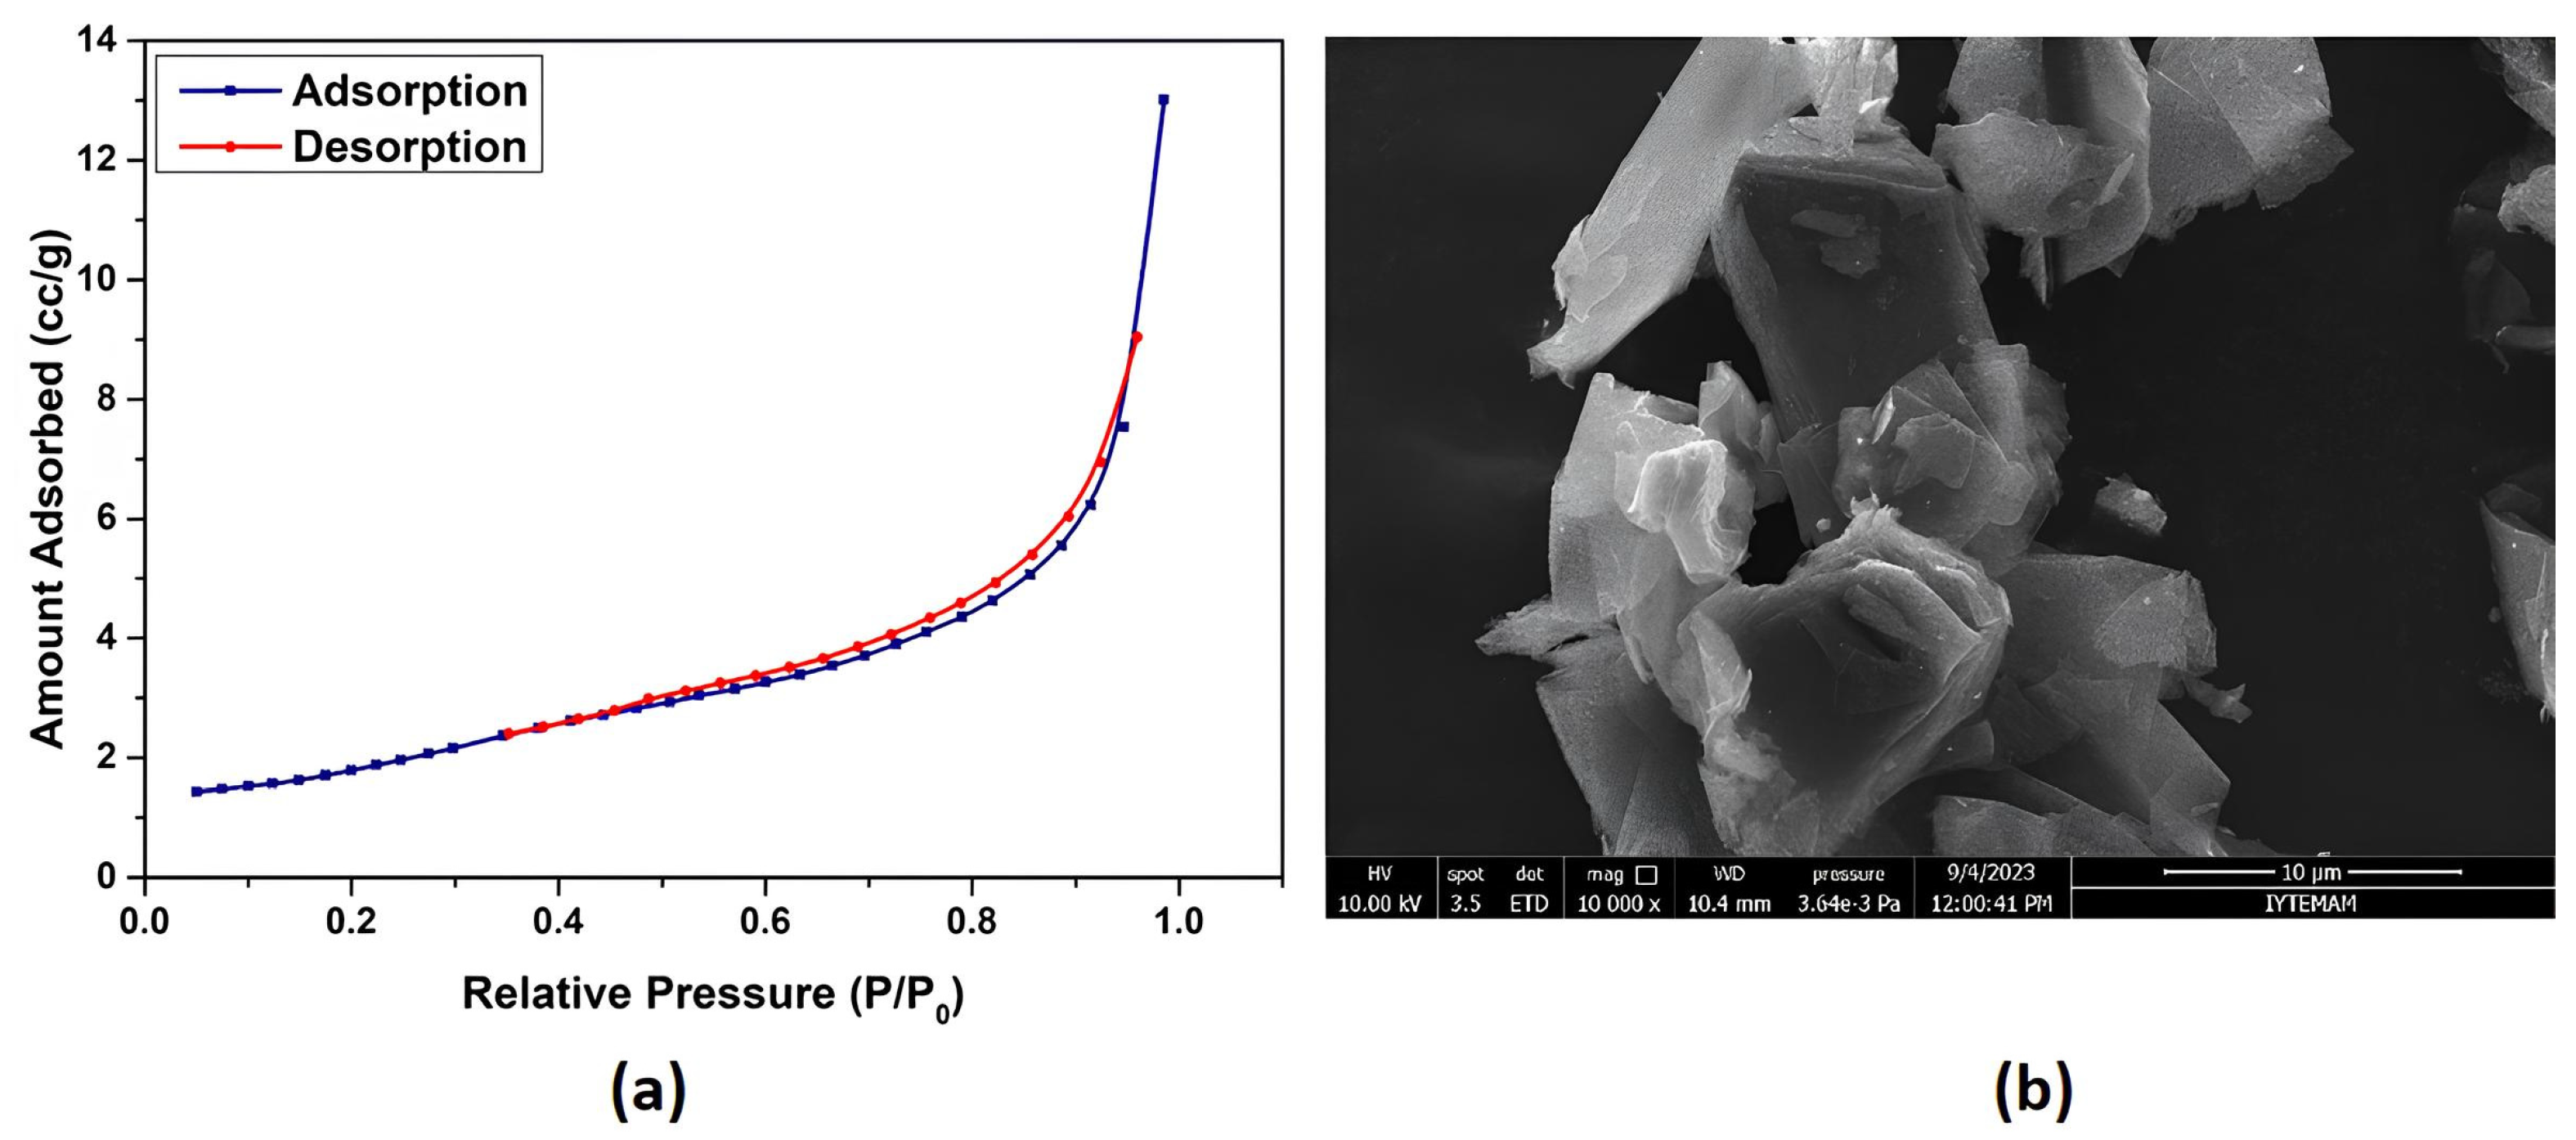
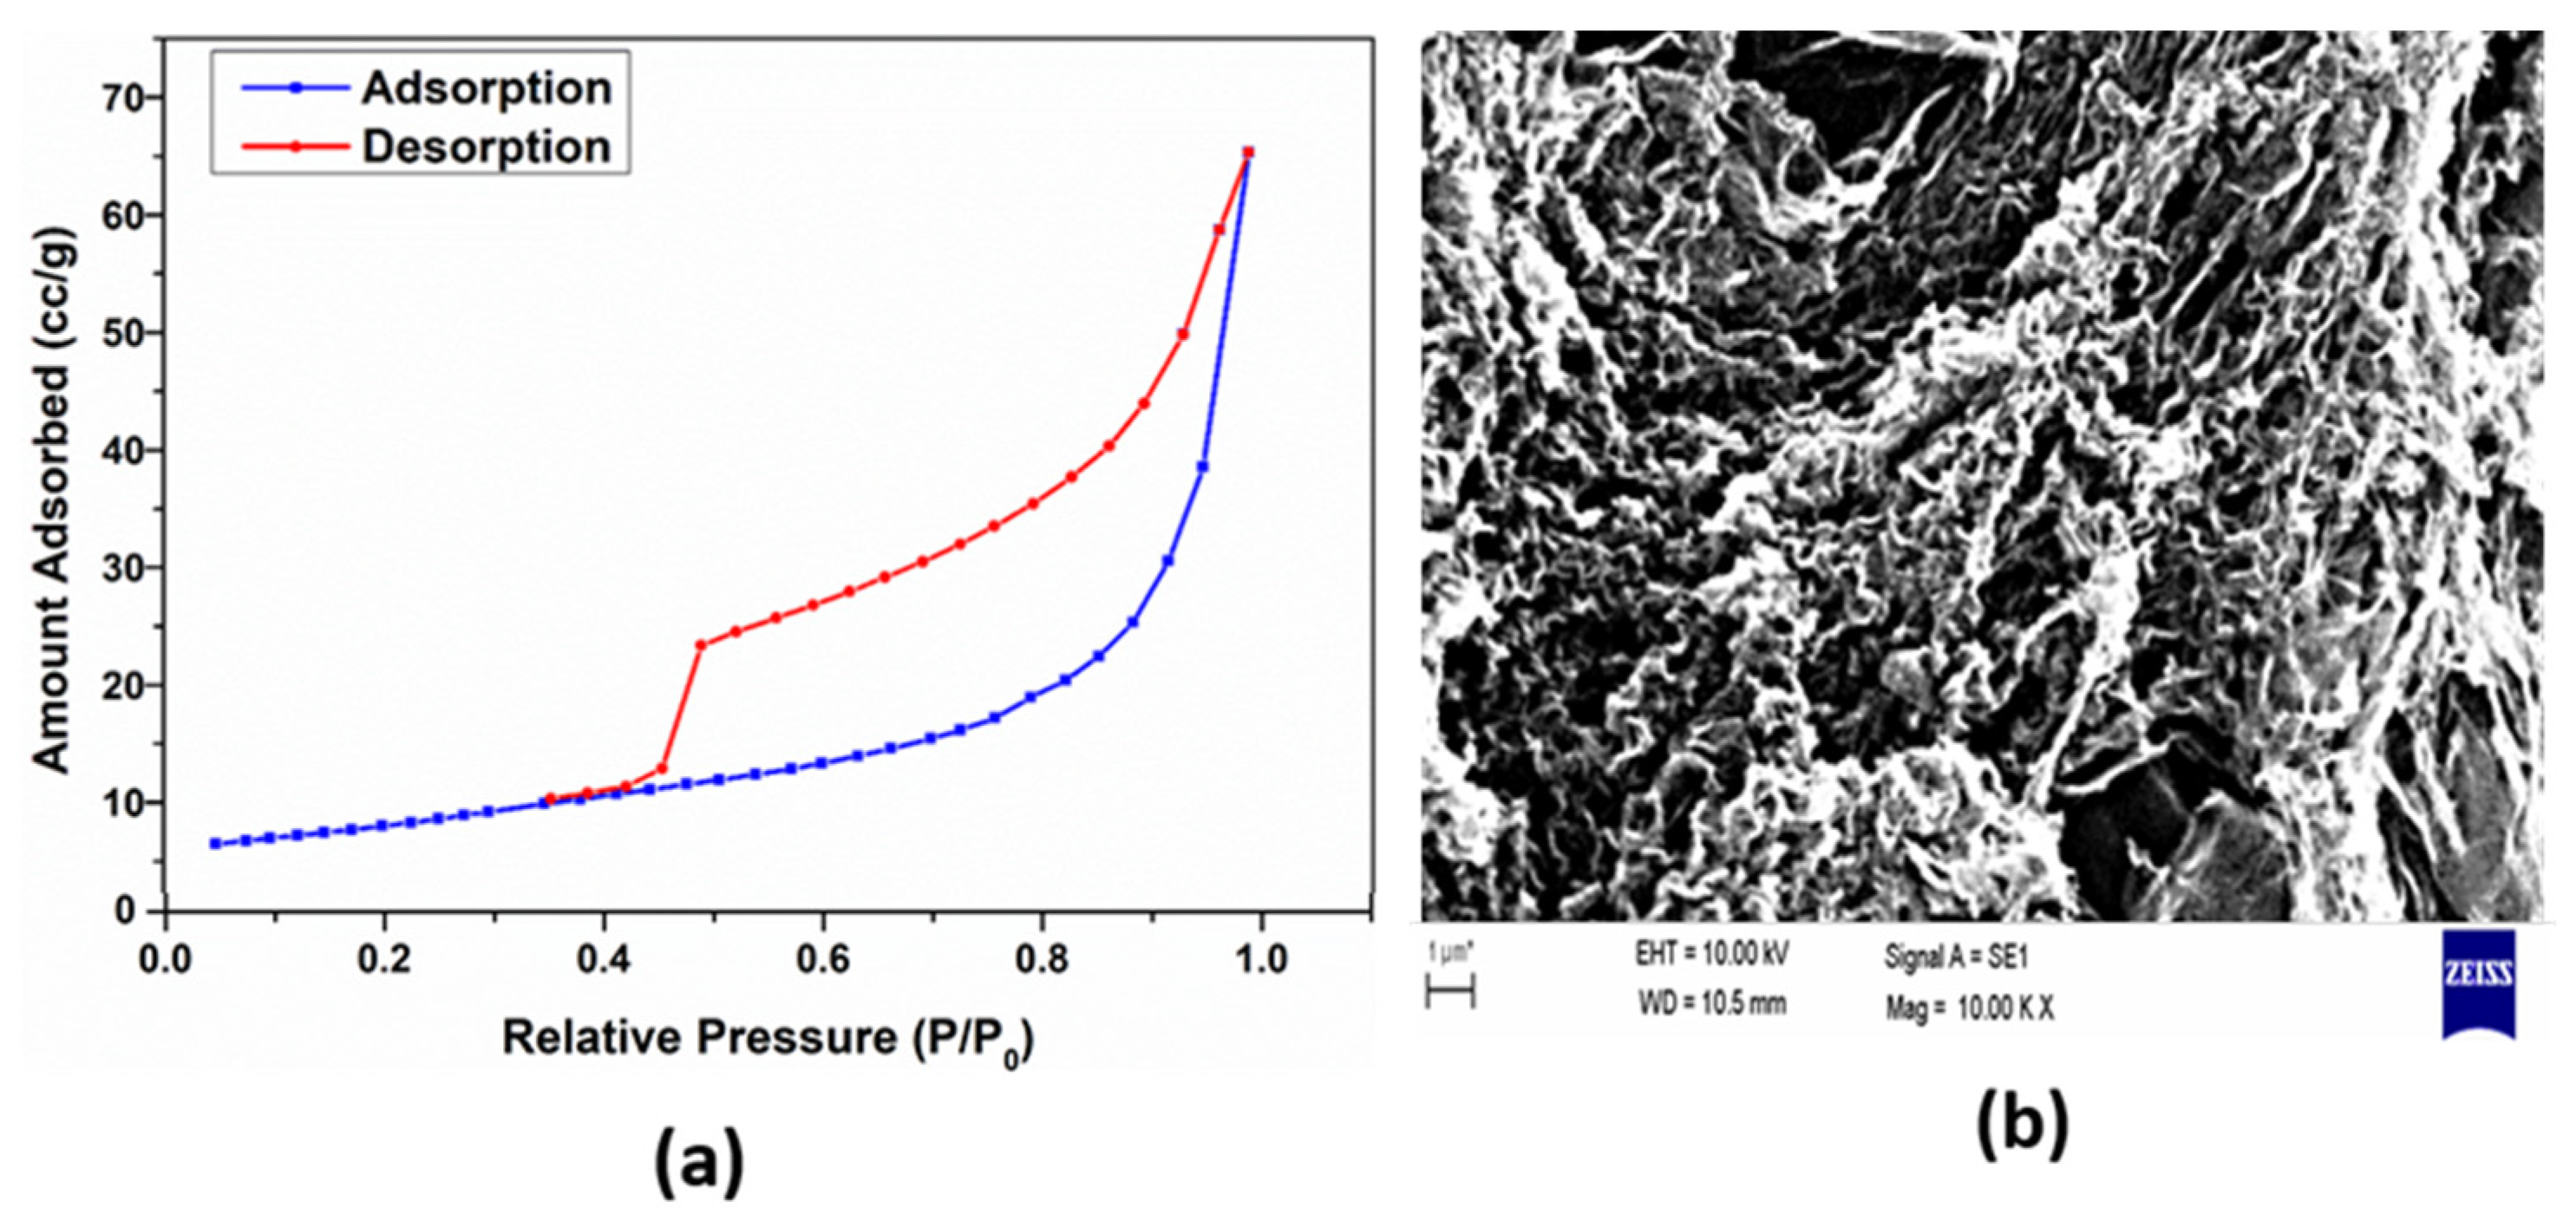
BET is another essential approach for determining surface area and pore size; therefore, the nitrogen adsorption isotherm at 77°K was obtained for Gr and H-Gr. The isotherms are shown in Figure 2a and mesoporous structures were determined in these samples, with a type IV curve indicating their presence. The BET surface area and pore size were determined to be 7.27 m2/g and ≤66.67 nm, respectively. The BET surface area and pore size are in good agreement with both theoretical predictions and experimental findings reported in the literature [35,36]. Figure 2b displays the SEM micrograph of Gr, revealing its surface morphology. The observed layer-by-layer structure in Gr is associated with the underlying bulk carbon arrangement. Additionally, a predominance of closely packed flake layers exhibiting a smooth and uniform surface is evident in the image.
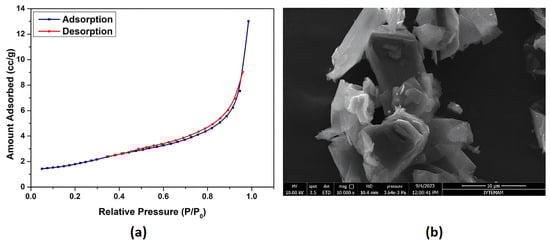
Figure 2.
BET analysis of surface area for Gr (a) and SEM image of Gr (b).
3.2. Hydrogen Storage Properties of GO
The Raman spectrum of GO and hydrogen-adsorbed GO (H-GO) are shown in Figure 3a. GO has two main peaks, the D peak at 1350 cm−1 and the G peak at 1603 cm−1, with a corresponding ID/IG ratio of ~0.97. In comparison to GO, a decrease in the intensity of the G peak and an increase in the intensity of the D peak were observed in the Raman spectrum of H-GO. H-GO’s peak positions were determined as 1339 cm−1 for the D peak and 1588 cm−1 for the G peak, with a corresponding ID/G ratio of ~1.11. The increasing D peak intensity is attributed to increasing defect states in the structure. In addition, the H-GO, D, and G bands shifted to a lower Raman shift for 11 cm−1 and 5 cm−1, respectively. In addition, the ID/G ratio increased to ~1.36. This increase in the ID/G ratio in H-GO indicates the deterioration of the carbonaceous structure after hydrogenation. Otherwise, the broadening of the G band in H-GO may be related to the hydrogenation of the carbon structure [37].
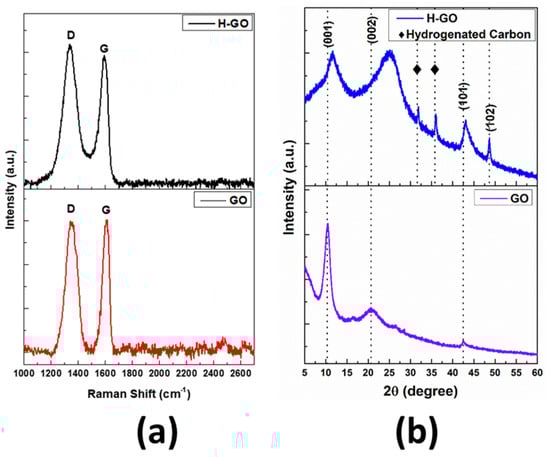
Figure 3.
Raman spectra of GO and H−GO (a) and XRD patterns of GO and H−GO (b).
The crystal structure of the synthesized GO and H-GO was determined by analyzing the XRD patterns. The XRD pattern of GO is shown in Figure 3b, and it has a sharp and high-intensity peak at 2θ= 10.43°, which corresponds to the (001) plane [38,39]. The additional peaks of GO are located at 2θ =20.59° and 2θ = 42.46°, corresponding to the (002) and (101) crystallographic planes, respectively (indexed as per JCPDS No: 00-004-0345 and JCPDS No: 01-075-2078) [39]. Table 3 shows that the crystal structure of H-GO displays distinct properties compared to GO. The 2θ peaks have high intensities at lower 2θ values for H-GO, and the FWHM of the peak has increased. These results can be attributed to a higher degree of disorder in GO [33]. In addition, the heteroatom relationship in the graphene structure gives rise to defect sites and destruction in the carbon lattice. These results are associated with low crystallinity, and very small changes occur in the 2θ values [40]. Additionally, H-GO exhibits additional peaks at 2θ = 31.84° and 2θ = 36.00°, which are attributed to the presence of hydrogen within the structure (referenced as per JCPDS No: 98-006-2015). These peaks could potentially be associated with interactions between carbon and hydrogen.
Table 3.
The crystallite size was determined using Scherrer’s equation, based on the FWHM of the (002) diffraction peak extracted from the XRD data.
BET isotherms were applied to measure the specific surface area of GO, and the results are shown in Figure 4a. The specific surface area and pore size of GO were determined as 33.75 m2/g and ≤73.57 nm, respectively, as these values are in agreement with the literature [41,42,43,44]. Moreover, GO exhibits a type IV curve with a hysteresis loop. The isotherms are shown as mesoporous structures in these samples, which indicates their presence [38]. The morphological analyses of GO were examined using SEM (Figure 4b). The layered structure, along with the wrinkled areas of GO, clearly appears because of the chemical exfoliation of graphite. In addition, crumpled GO layers are randomly aggregated and connected with each other.
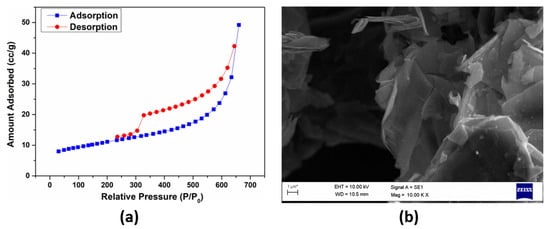
Figure 4.
BET analysis of surface area for GO (a) and SEM image of GO (b) (* The 1 µm scale bar shown here is based on the SEM’s calibration at 10 kV and a working distance of 10.5 mm, and may have minor deviations due to sample tilt or instrumental settings).
3.3. Hydrogen Storage Properties of rGO
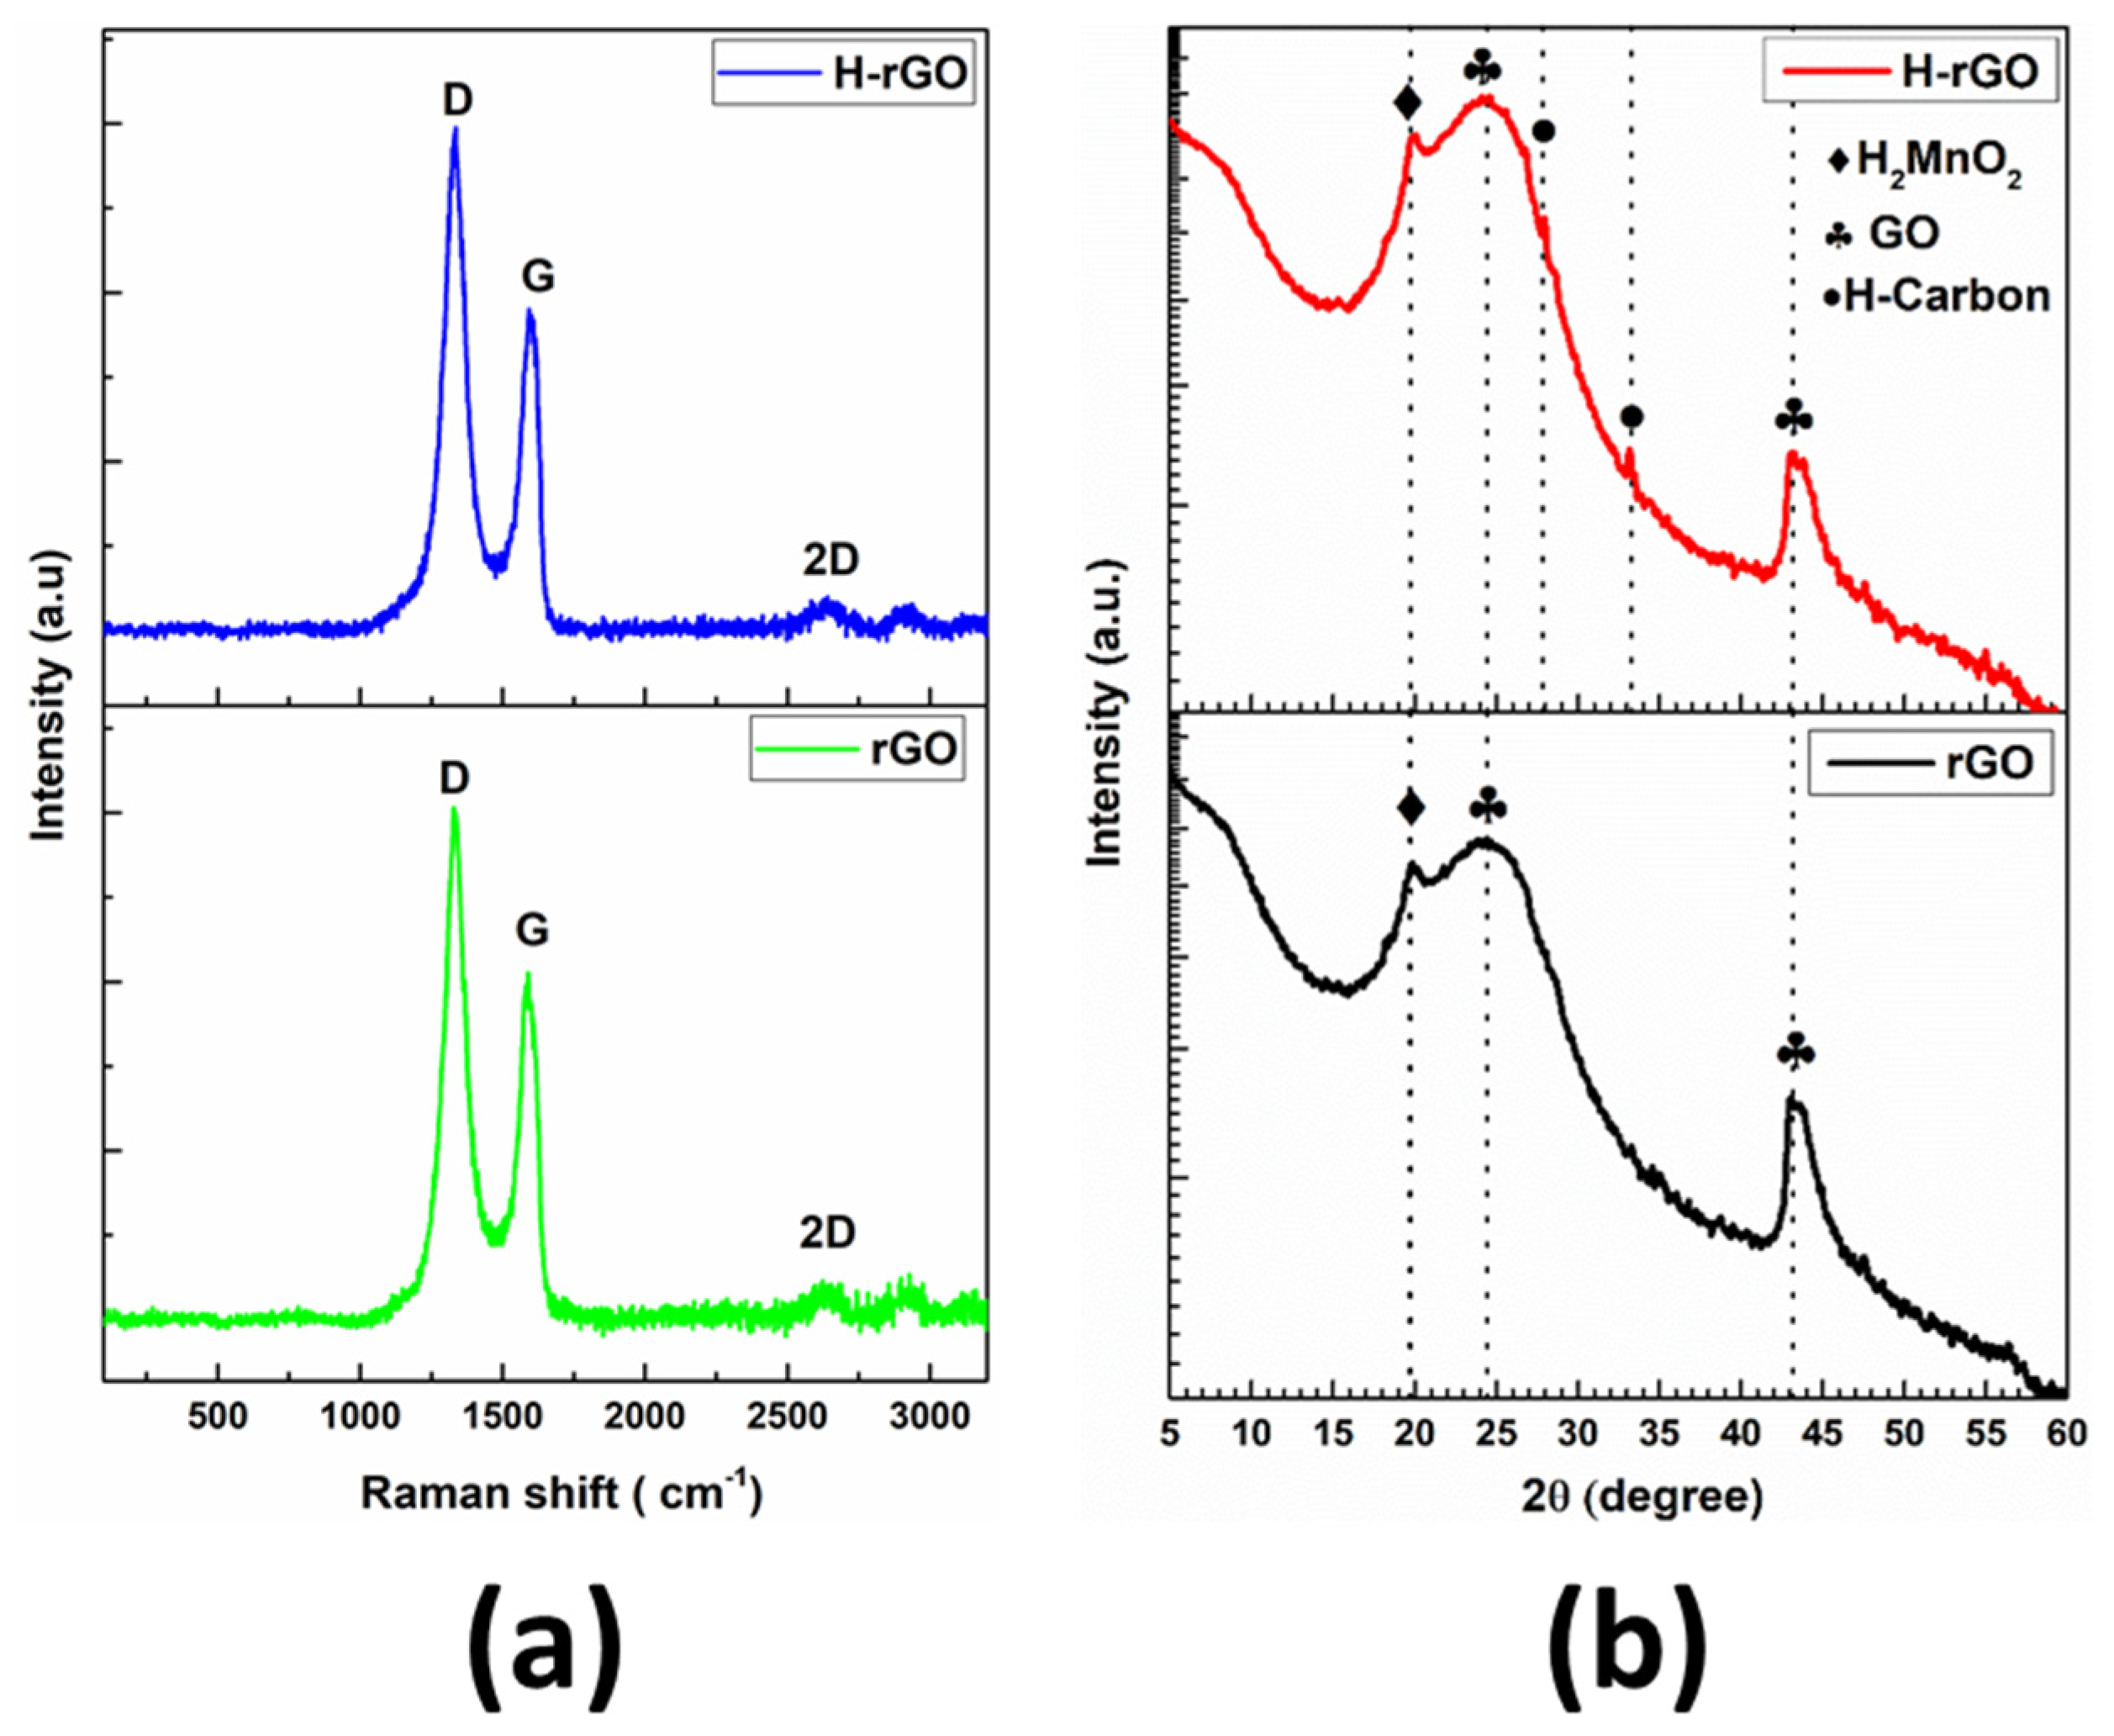
The Raman spectra of rGO and hydrogen-adsorbed rGO (H-rGO) are shown in Figure 5a. The intensities of the D and G bands are shifted after hydrogen adsorption. The positions of the D, G, and 2D bands are around 1331 cm⁻1, 1593 cm⁻1, and 2639 cm⁻1 for rGO, respectively. These results indicate the formation of new sp2 structures instead of functional groups and thus an increase in the amount of regular structures. After the hydrogen adsorption of rGO, the positions of the D, G, and 2D bands are around 1328 cm⁻1, 1588 cm⁻1, and 2635 cm⁻1, respectively. The D band and G band of rGO were found to be shifted by 3 cm⁻1 and 5 cm⁻1, respectively. This shift is attributed to hydrogenation in the carbon structure. In addition, after the hydrogen adsorption process, the band’s position can be shifted downwards due to increasing electron concentrations. When comparing rGO and H-rGO peak intensities, the D band of rGO is much stronger than H-rGO’s D band. The ID/G ratio is 1.48 and 1.56, respectively. The higher value of the intensity ratio can be attributed to the presence of defects in the structure [24,45].
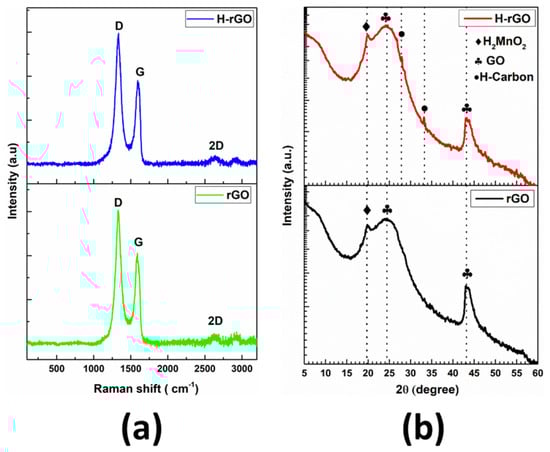
Figure 5.
Raman spectra of rGO and H−rGO (a) and XRD patterns of rGO and H−rGO (b).
Figure 5b presents the XRD patterns of rGO and H-rGO, with diffraction peaks assigned to carbon phases indexed according to JCPDS card number 98-018-2760. The XRD pattern of rGO exhibits a prominent peak at 2θ = 24.42°, corresponding to the (002) plane, and a secondary peak at 2θ = 43.16°, attributed to the (100) plane [22,46,47]. In addition, H-rGO showed similar carbon peaks and positions to rGO. However, after hydrogenation, new peaks appeared at 2θ = 27.82° and 2θ = 33.26° which were attributed to hydrogenated carbon (H-Carbon) according to JCPDS card number 98-006-2005. In addition, rGO and H-rGO have another peak at 2θ = 9.73°. This peak is attributed to H2MnO2 according to JCPDS card number 98-005-3951. This peak is related to the chemical reaction used in the rGO synthesis process. Nevertheless, its role in hydrogen adsorption will be negligible. The amount of H2MnO2 is relatively low, and its presence does not significantly alter the specific surface area of rGO. Furthermore, H2MnO2 does not have a porous structure; thus, it will not play an important role in hydrogen adsorption via desorption processes. In addition, the FWHM value of the (002) diffraction peak and the crystallite size are illustrated in Table 4 and changed after hydrogen adsorption. These results are attributed to the removal of the functional group from rGO’s structure [24].
Table 4.
The 2θ, FWHM value and crystallite size of rGO.
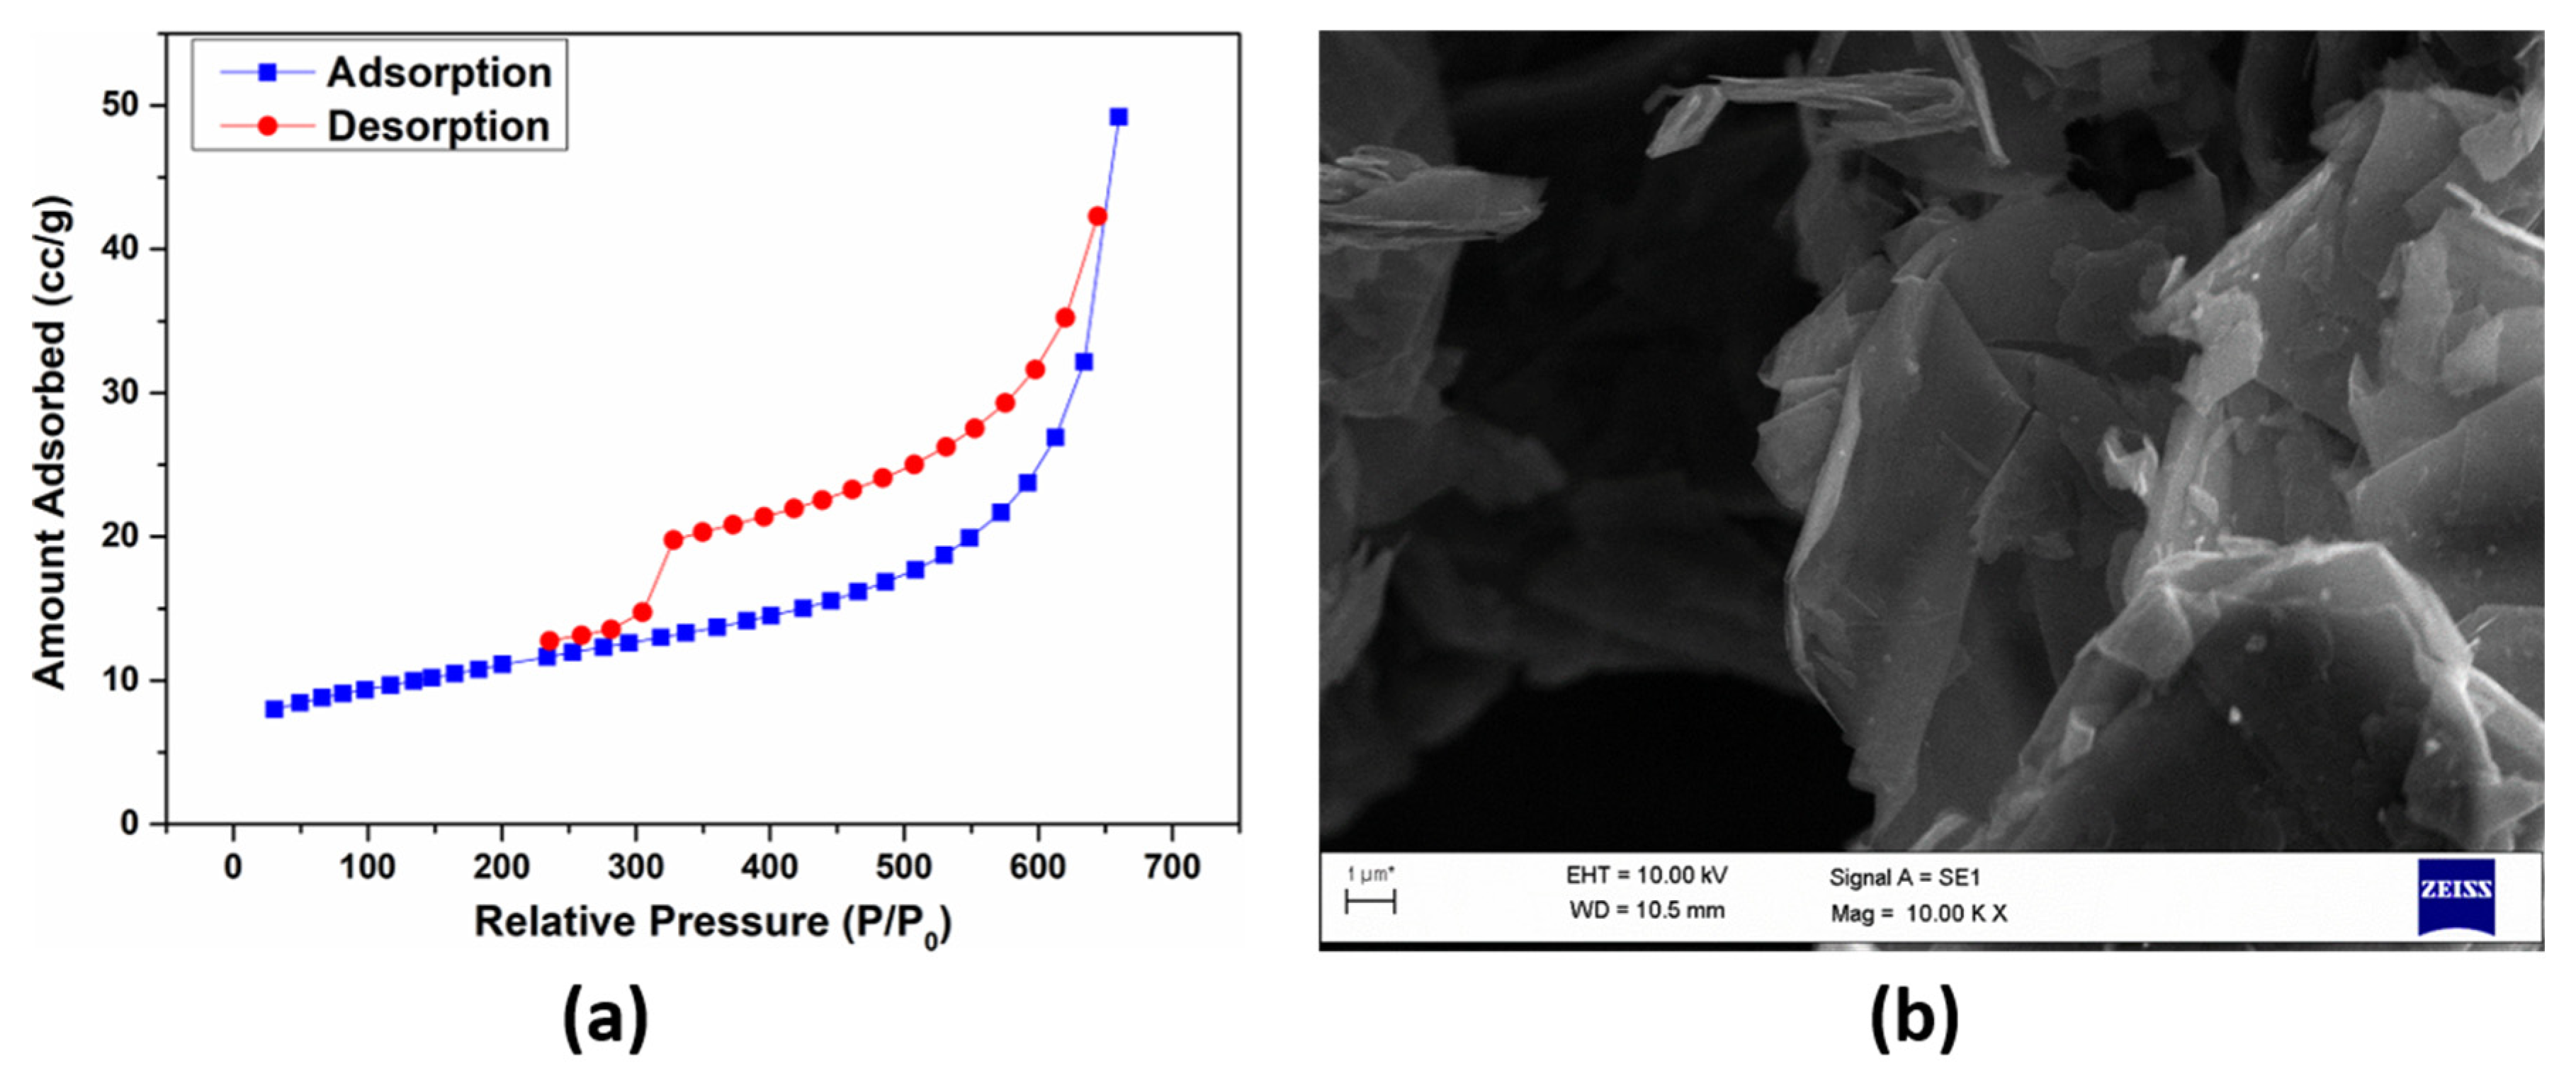
The BET isotherms were used under the same parameters as with Gr and GO. The BET isotherms are shown in Figure 6a, and the specific surface area and pore size of rGO were determined to be 70.31 m2/g and ≤6.46 nm, respectively. Furthermore, these results are comparable with the literature [48]. Furthermore, rGO displays a type IV isotherm with a pronounced hysteresis loop, which confirms the mesoporous nature of the samples [49,50]. The surface area of GO is smaller than that of rGO, which could be due to partial stacking of the graphene sheets. The morphological analysis of rGO is shown in Figure 6b. The SEM analysis shows that rGO has high porosity. The layered structure, together with the wrinkled areas of rGO, clearly appears due to the chemical exfoliation of GO and its reduction of rGO.
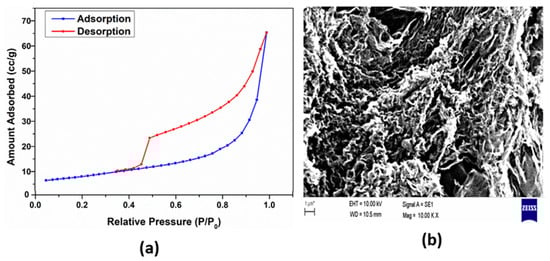
Figure 6.
BET analysis of surface area for rGO (a) and SEM image of rGO (b) (* The 1 µm scale bar shown here is based on the SEM’s calibration at 10 kV and a working distance of 10.5 mm, and may have minor deviations due to sample tilt or instrumental settings).
3.4. Hydrogen Storage Potential of Graphite, GO, and rGO
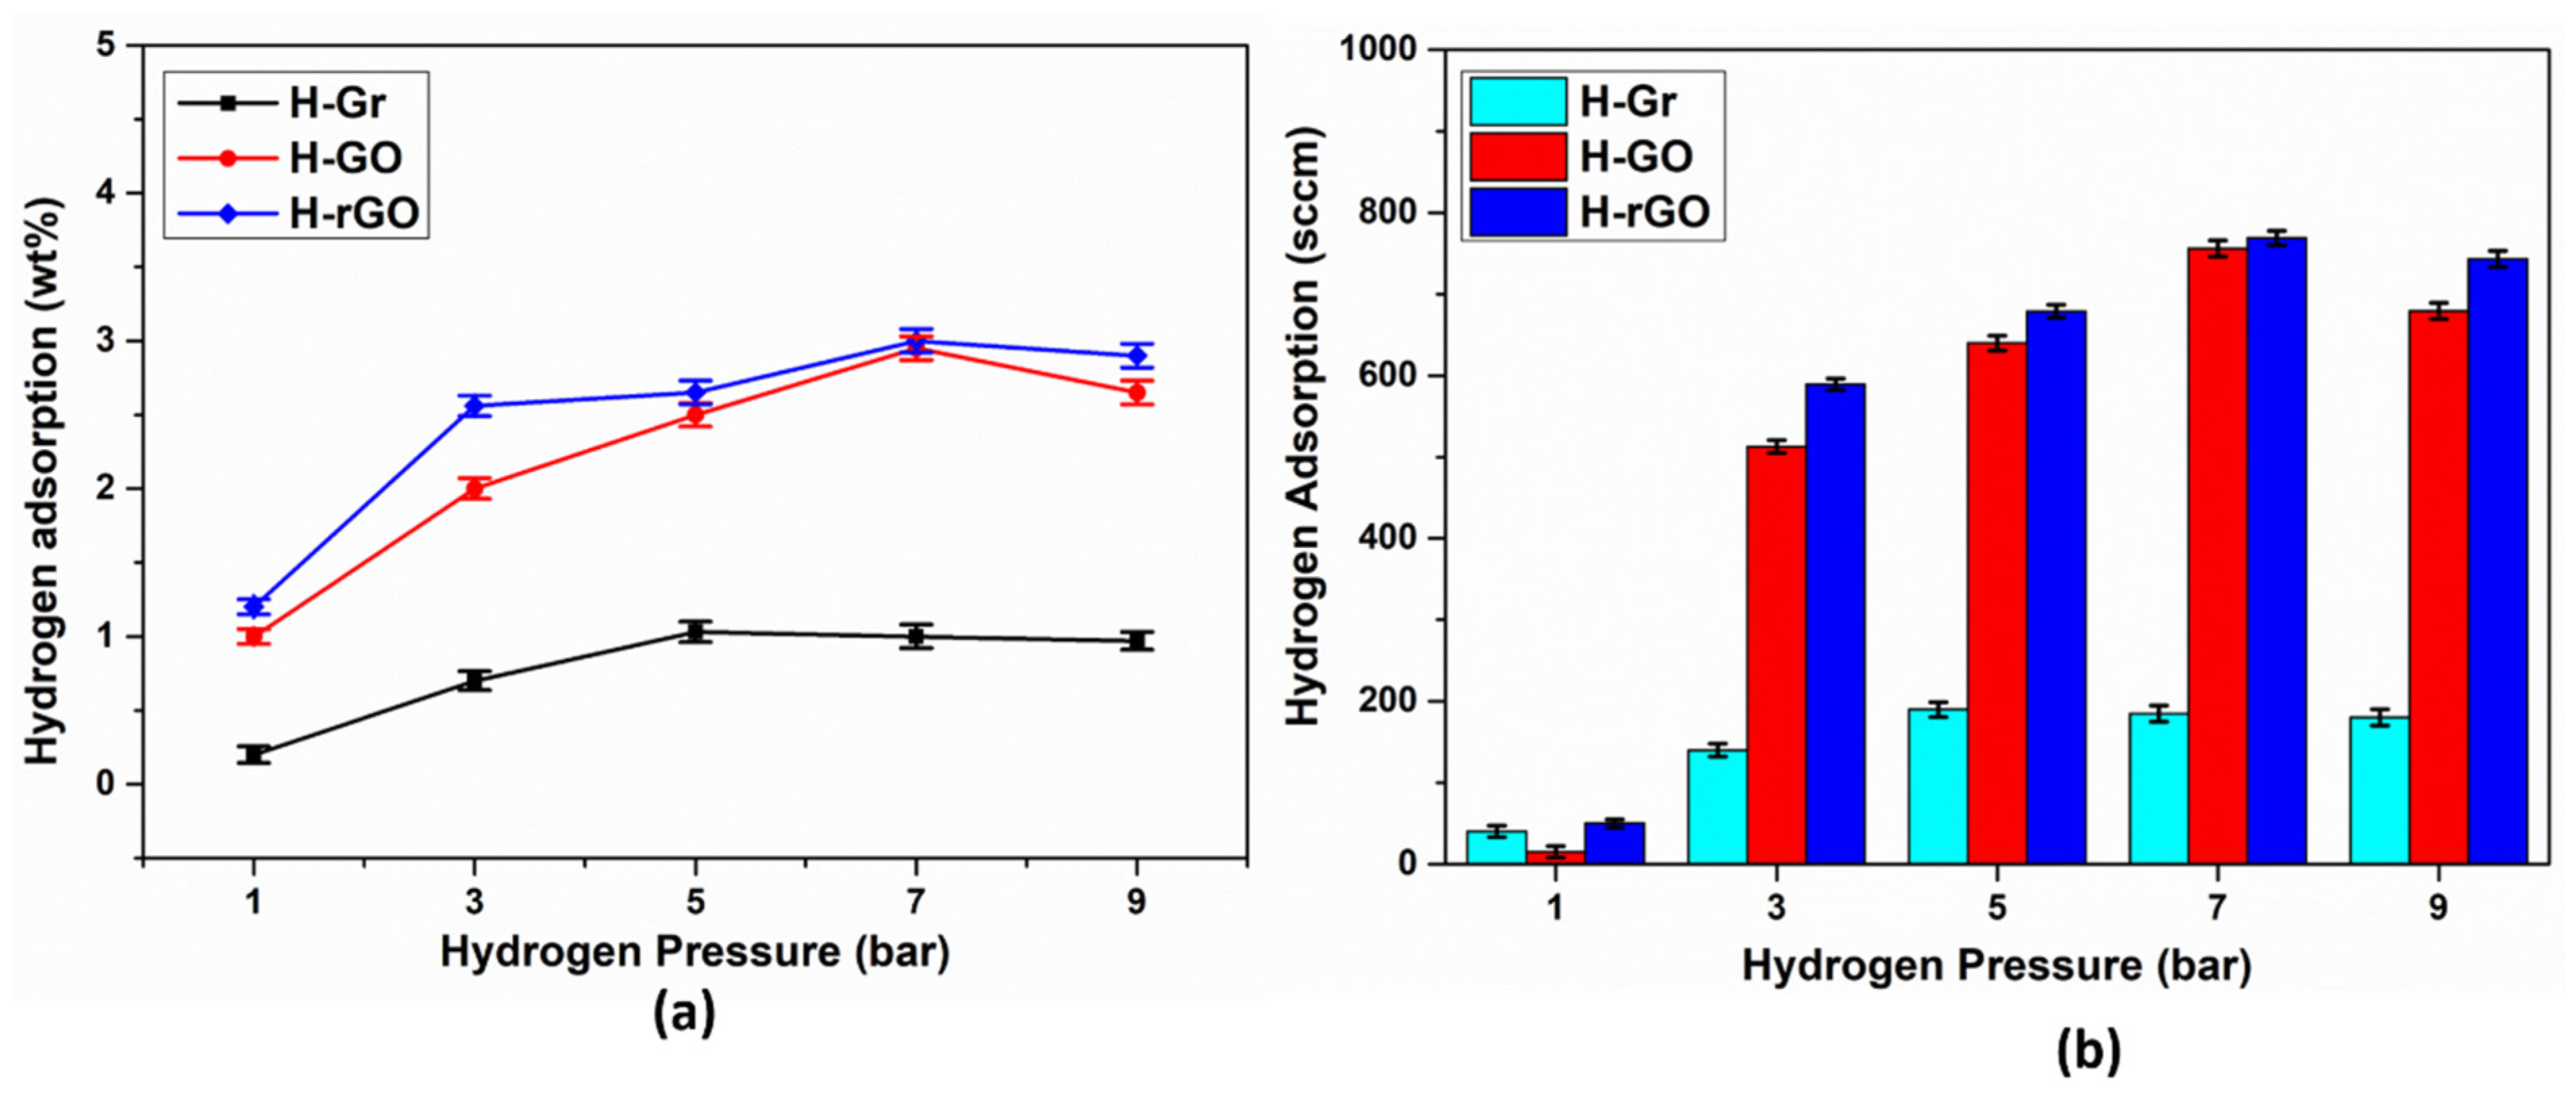
Hydrogen was adsorbed on graphite at different pressures (1–9 bar). As the pressure increased, the hydrogen storage potential of Gr increased up to a pressure of 5 bar, as shown in Figure 7. In addition, pressure increases can affect the increase in hydrogen storage on the surface. However, the pressure increase did not affect the hydrogen storage potential after it reached 5 bar. Hydrogen adsorption in carbon at high pressures is not efficient due to the large proportion of excluded volume. In addition, Gr indicated the highest adsorbed hydrogen at 5 bar, with values of 190 sccm and 1.03 wt.% [51].

Figure 7.
Effect of pressure on hydrogen adsorption for graphite, GO, and rGO. (a) Adsorbed hydrogen volume (sccm) at different pressures, showing the adsorption capacity in sccm. (b) Adsorbed hydrogen mass fraction (wt.%) at different pressures, indicating the percentage of hydrogen stored relative to the material’s weight.
The hydrogen storage potential of GO was investigated at different pressures. The highest hydrogen storage ratio measured was 742 sccm and 2.90 wt.% at a hydrogen pressure of 7 bar. After this, the increases remain close to each other. These results are attributed to Langmuir isotherm behavior for carbon-based materials [22,52]. In addition, carbon adsorption is limited at low pressures, but as the pressure increases, saturation is reached [53].
The same hydrogen storage parameters were then used for rGO. The hydrogen storage ratio increased up to a hydrogen pressure of 7 bar for rGO. It showed high hydrogen storage potential at 7 bar, with values of 768 sccm and 3 wt.%. rGO can adsorb more hydrogen at 7 bar than at 9 bar. This situation is mainly attributed to the hydrogen molecules inside the structure. The defects in graphene, such as topological defects, are an essential factor for enhancing hydrogen adsorption [24,54]. In rGO synthesis, the acidic treatment of the functionalized group on the graphene structure can cause topological defects, and this situation tends to increase hydrogen adsorption. In addition, the chemical oxidative processes of the carbon nanotube have shown higher hydrogen adsorption when compared to pristine carbon nanotubes in the literature. This means that defects on the surface provide more reactive surface sites for improving hydrogen adsorption potential [55,56]. This situation contributes to the total hydrogen storage at low pressures and characterizes the exceptional binding mode for hydrogen confined in rGO.
When comparing the hydrogen storage potential of Gr, GO, and rGO, rGO showed attractive properties under the same hydrogen storage conditions. Hydrogen storage is related to the surface area of materials and is well-known in the literature [57,58,59]. Our experimental findings are in agreement with theoretical and experimental studies reported in the literature. Chan et al. utilized applied mathematical modeling to investigate hydrogen storage in graphene–oxide frameworks (GOFs), with the measured hydrogen capacity of 1.85 wt.% for graphene sheets being in good agreement with previous theoretical estimates of 2.0–6.33 wt.% derived from ab initio and grand canonical Monte Carlo calculations [60]. Additionally, another research work on mesoporous graphene oxide demonstrated that hydrogen storage may be significantly enhanced by way of a two-dimensional potential well mechanism to yield a determined storage density of 4.65 wt.% for hydrogen at 40 atm and room temperature [61]. This enhancement is due to delocalized hydrogen gas permeation through the void spaces rather than regular site-specific adsorption. Similarly, our rGO samples synthesized with a high defect density and optimized porosity are also anticipated to improve other hydrogen desorption. Throughout our research, although we did not use external ligand-supported GOF structures, our rGO samples showed a high defect density and specific surface area (70.31 m2/g) that improved hydrogen adsorption. Our rGO was proven by BET analysis to possess a specific surface area of 70.31 m2/g, which provides additional adsorption sites. The structural vacancies and oxygen-containing functional groups in rGO may also be responsible for enhanced hydrogen binding energy, which in turn explains the enhanced adsorption capacity.
As expected, the hydrogen adsorption potential increased with the rising BET surface area [22,62]. Consequently, rGO exhibited a higher hydrogen storage capacity compared to Gr and GO due to its greater BET surface area. It is important to note that the enhanced BET surface area of rGO provides a larger number of hydrogen ion storage sites within the internal layer structure of macro-, meso-, and micropores in the material, in contrast to GO [46]. In addition, the O and OH groups in rGO contribute to hydrogen storage by helping to overcome large lattice strains in the structure [23]. In addition, GO has a higher hydrogen storage potential than Gr for similar reasons. Increasing the hydrogen pressure did not affect the hydrogen storage potential of the materials beyond the optimum pressure values. These situations are associated with carbon adsorption behavior at lower pressures for Gr, GO, and rGO, as well as a linear increase for higher hydrogen pressures attributed to hydrogen physisorption on the carbon surface [53].
In terms of the adsorption and desorption balance for all materials, measurements indicate that the amount of desorbed hydrogen was slightly lower than the adsorbed amount. This discrepancy is likely due to hydrogen retention in micro- and mesoporous structures, as well as minor structural changes in the material during repeated cycles. The desorbed gas was primarily hydrogen, although trace amounts of oxygen-containing species may have originated from residual functional groups in GO and rGO.
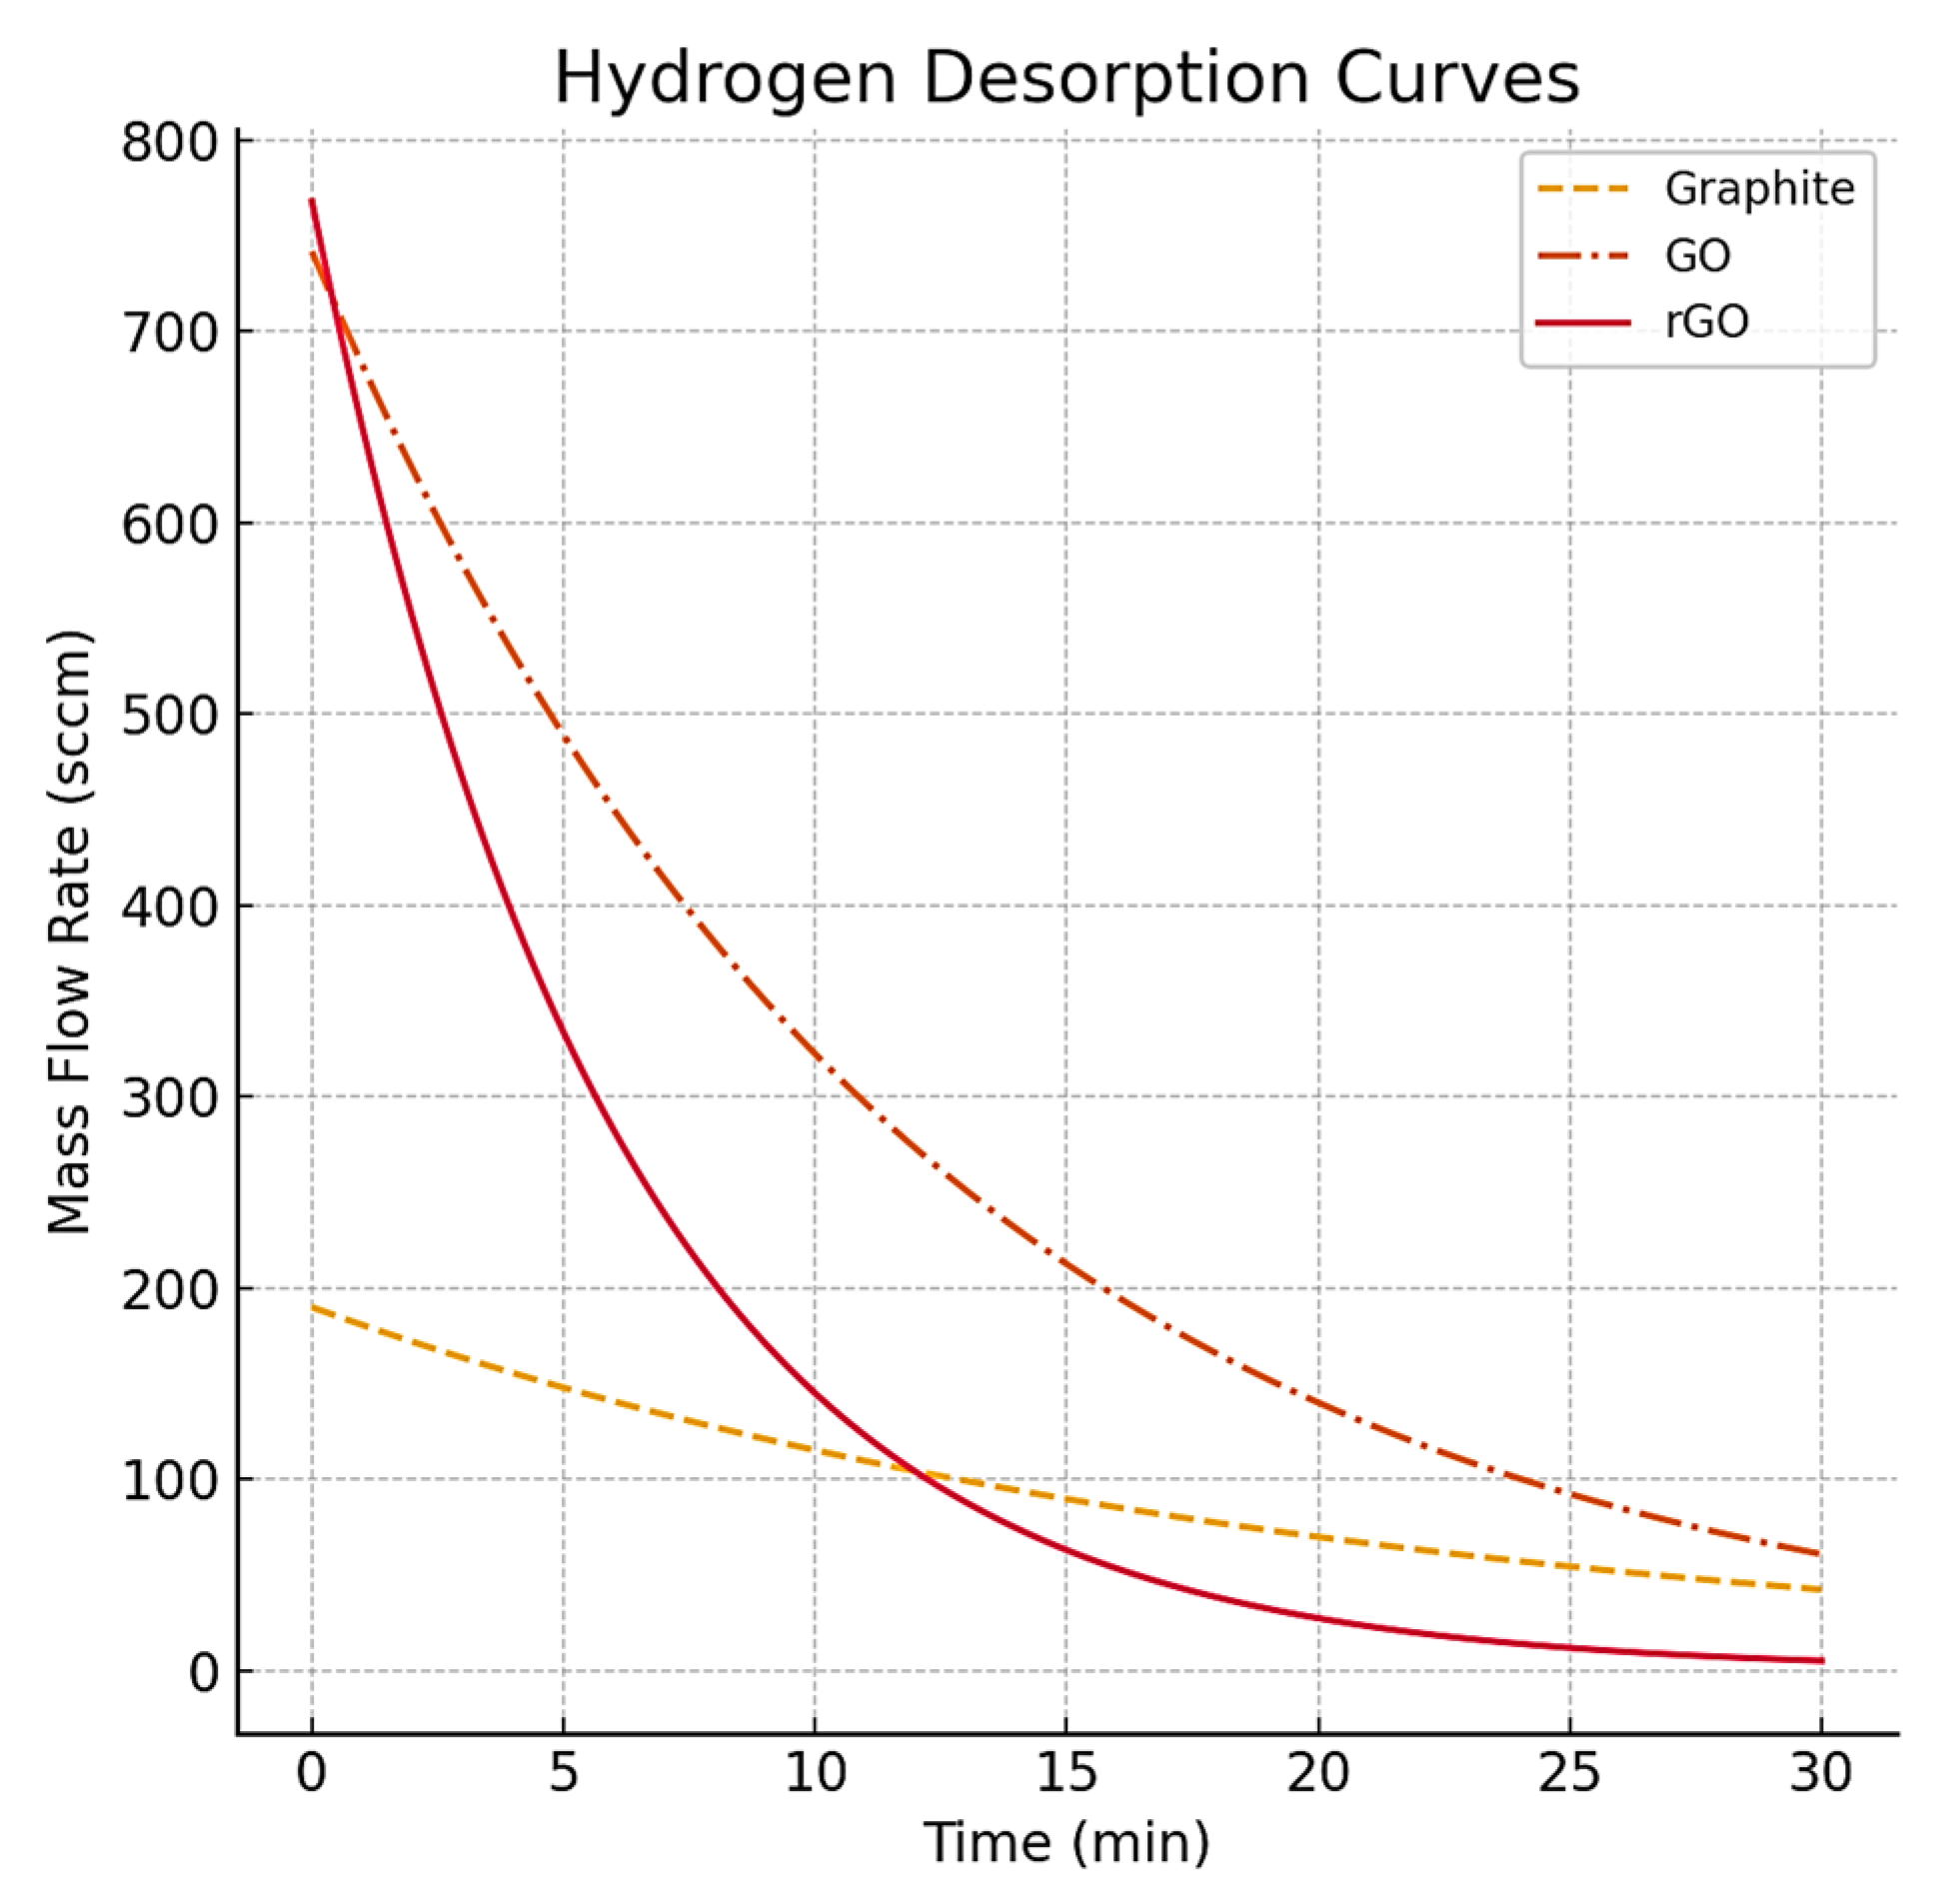
Figure 8 presents the simulated hydrogen mass flow rate (sccm) as a function of time for the desorption processes of graphite, GO, and rGO. The adsorption curves indicate that rGO exhibits the highest and fastest hydrogen uptake with a peak flow rate of approximately 768 sccm in a shorter duration, consistent with its higher surface area and defect density. GO also shows high hydrogen absorption (742 sccm), while graphite reaches a lower peak value (190 sccm) over a longer time. The desorption curves show that rGO releases hydrogen more quickly than GO and graphite, indicating faster desorption kinetics. Graphite, however, shows a slower release of hydrogen, which is consistent with the longer power output duration observed in the PEM fuel cell experiments. These dynamic profiles validate the hydrogen storage behavior already described and also support the conclusion that surface area and structural defects are determining factors for desorption rate and adsorption capacity.
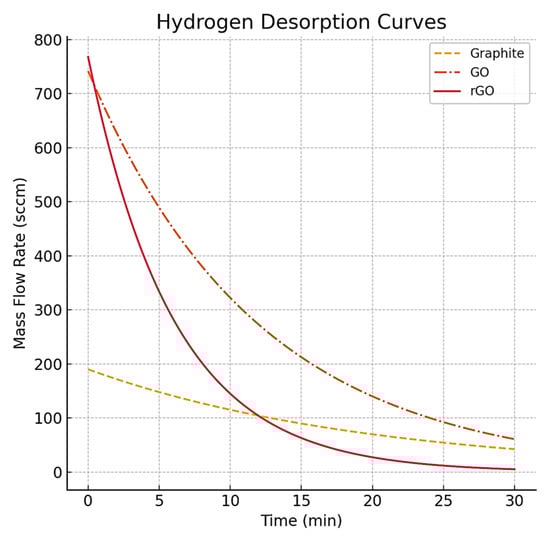
Figure 8.
The simulated hydrogen mass flow rate (sccm) as a function of time for desorption processes of graphite, GO, and rGO.
3.5. Utilization of Hydrogen-Adsorbed Graphite, GO, and rGO in PEM Fuel Cells
The hydrogen storage performance of carbon-based materials was further investigated using a PEM fuel cell. Figure 9 shows the power density with time, and the power density reaches the maximum power density of 0.082 W/cm2 for H-rGO. H-Gr and H-GO showed lower power densities of 0.071 and 0.017 W/cm2, respectively. These results are related to the hydrogen flow ratios for hydrogen-adsorbed materials. The PEMFC polarization curve indicated a maximum power density of 0.082 W/cm2 at 250 mA/cm2 with an open-circuit voltage (OCV) of 0.97 V, indicating minimal hydrogen crossover and uncompromised membrane integrity. To ensure precision in our measurements of the hydrogen flow rate, MFC was used to monitor the actual time taken for hydrogen consumption during the PEMFC test. For an estimation of efficiency, we plotted the experimentally obtained current versus the theoretical maximum current according to Faraday’s law for comparison from the hydrogen flow rate. In the calculation, 88.5% of the hydrogen utilization was consistent with results given by the literature values of similar standard PEMFCs under corresponding conditions [63,64]. In an additional test to determine the feasibility of H-rGO as a source of hydrogen, we compared its performance to that of standard hydrogen sources, such as pressurized gas cylinders and balloons containing hydrogen. Their polarization curves were found to be barely different, which suggests that the adsorbed hydrogen system is as efficient as standard hydrogen sources under normal operating conditions.
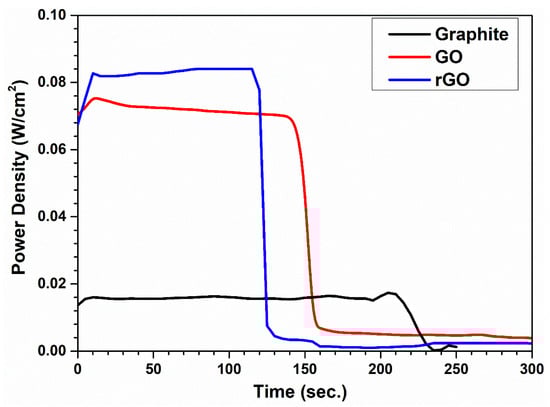
Figure 9.
Power density of a PEM fuel cell at room temperature using H-Gr, H-GO, and H-rGO hydrogen sources.
Similarly, the power density behavior of H-Gr and H-GO materials follow analogous decreasing trends over time, albeit with slightly lower initial power densities. This is a common trend in carbon-based materials and highlights the changing nature of power generation as the PEM fuel cell operates. In addition, the power density decreased over time due to hydrogen consumption as a result of hydrogen desorption in the materials. rGO has a higher hydrogen storage capacity than graphite and GO due to its larger specific surface area, resulting in a higher power density. Although H-rGO showed a higher power density compared to the others, its cell performance was limited by a shorter operating time compared to H-Gr and H-GO. This result can be attributed to the faster desorption time of H-rGO. Despite its high hydrogen storage capacity, the rapid desorption time of H-rGO resulted in a higher power density only at a high hydrogen flow rate within a short time frame. Conversely, H-Gr has the lowest power density due to its lower hydrogen storage capacity. However, it delivered a longer-lasting performance than the other materials. This extended performance can be attributed to the slower hydrogen desorption of H-Gr, which allows for a longer operating time.
The rapid desorption of hydrogen from H-rGO largely determines the steady-state performance of PEM fuel cells. While rGO possesses the highest hydrogen storage capacity (3 wt.%), the rapid desorption rate results in the power density first reaching a sharp peak and then decaying quickly with the fast consumption of hydrogen. This phenomenon can limit the stability and long-term usage of the fuel cell. The rate of hydrogen desorption is governed by a range of factors, such as the binding energy, defect density, and surface functional groups in rGO [65,66]. It is worth emphasizing that high surface areas and topological defects facilitate the speedy release of hydrogen, leading to fluctuations in the power output of the PEM fuel cell. In order to provide more descriptive information, we have used quotations from comparative studies describing the behavior of hydrogen desorption rates to electrochemical performances in fuel cells. Such studies have described how rapid desorption affects current density stability, power output, and efficiency in fuel utilization. Theoretical models have been presented specifically by quoting models related to Langmuir desorption kinetics and hydrogen spillover mechanisms to describe this phenomenon.
In summary, the power density decreased over time as a result of hydrogen desorption and consumption within the materials. The high specific surface area of rGO resulted in an increased power density due to its superior hydrogen storage capacity compared to graphite and GO. Despite the superior power density of H-rGO, its shorter operating time compared to H-Gr and H-GO can be attributed to its faster desorption rate. In Figure 9, all samples exhibit an initially high power density, followed by a steep decline. This immediate drop is primarily attributed to hydrogen consumption and the rapid desorption characteristics of the carbon-based materials. Importantly, the performance decay observed in our measurements is not related to the intrinsic degradation of the PEM fuel cell stack, but rather to the limited amount of hydrogen stored in the solid-state adsorbent materials. Once the stored hydrogen is depleted, the power output naturally drops due to the insufficient fuel supply. Among the tested materials, H-Gr showed the lowest power density due to its limited hydrogen capacity, but it provided a longer operating time thanks to its slower hydrogen desorption rate. This resulted in more sustained, albeit lower, power delivery. In contrast, the poor and fluctuating power characteristics observed in H-GO and H-rGO stem from discontinuous hydrogen flow and the rapid depletion of available hydrogen. Despite the low absolute power densities, these results confirm the viability of using solid-state hydrogen storage materials as hydrogen sources for PEM fuel cells. It is important to note that the data presented here reflect performance based on a small quantity of hydrogen-storing material.
4. Conclusions
Hydrogen storage plays a crucial role in various hydrogen applications. In this study, we aimed to explore the impact of hydrogen pressure and surface area on storage capabilities. As part of this investigation, we found that the increase in hydrogen pressure enhances storage up to 7 bar, beyond which the material reaches saturation. Notably, carbon-based materials followed the Langmuir isotherm, indicating that the hydrogen pressure does not significantly alter the hydrogen storage potential. However, it is important to consider this aspect for all adsorption processes conducted at room temperature. While the effect of the hydrogen pressure is relatively limited, the surface area of the materials emerges as a critical factor influencing hydrogen storage potential. Remarkably, a larger surface area led to greater hydrogen storage potential in rGO (70.31 m2/g) compared to GO (33.75 m2/g) and graphite (7.27 m2/g). rGO showed a higher hydrogen capacity of 768 sccm and 3 wt.% than other adsorbent materials. In summary, the surface area exerts a more substantial influence on hydrogen storage compared to pressure for Gr, GO, and rGO.
The power density over time was observed, and it was found that the power density gradually increased until it reached its peak value. For H-rGO, the maximum power density attained was 0.082 W/cm2. In contrast, both H-Gr and H-GO exhibited lower power densities, determined as 0.071 W/cm2 and 0.017 W/cm2, respectively. On the contrary, H-Gr exhibited the lowest power density, which is attributed to its comparatively lower hydrogen storage capacity. Nonetheless, it showcased a prolonged and sustained performance when compared to the other materials under consideration. This extended operational performance of H-Gr can be attributed to its slower hydrogen desorption rate. This slow desorption of hydrogen release enables H-Gr to maintain its operating capacity for an extended period.
In the future, both the adsorption capacity and desorption kinetics must be balanced in real-world hydrogen energy applications. rGO could be a good candidate for low-pressure hydrogen storage, but testing over several cycles and tuning of the material will be required to enable stability and scale-up in operational applications. By integrating rGO-based storage with PEM fuel cells, cost-effective, flexible, and cleaner power solutions are potentially attainable, particularly if future research refines defect engineering or functionalization techniques to enhance both storage capacity and fuel cell performance over long-term utilization.
Author Contributions
A.A.: Writing—original draft, Validation, Data curation. S.Ç.: Visualization, Validation, Data curation. R.Z.: Writing—review and editing, Validation, Investigation. All authors have read and agreed to the published version of the manuscript.
Funding
This research received no external funding.
Data Availability Statement
The data presented in this study are available on request from the corresponding author.
Conflicts of Interest
The authors declare no conflict of interest.
References
- Li, X.; Ye, T.; Meng, X.; He, D.; Li, L.; Song, K.; Jiang, J.; Sun, C. Advances in the Application of Sulfonated Poly (Ether Ether Ketone)(SPEEK) and Its Organic Composite Membranes for Proton Exchange Membrane Fuel Cells (PEMFCs). Polymers 2024, 16, 2840. [Google Scholar] [CrossRef] [PubMed]
- Abusnina, M.M. Synthesis and Characterization of Kesterite Cu2ZnSnS4 (Czts) Thin Films for Solar Cell Application; University of Denver: Denver, CO, USA, 2016. [Google Scholar]
- Lin, H.-J.; Li, H.-W.; Shao, H.; Lu, Y.; Asano, K. In situ measurement technologies on solid-state hydrogen storage materials: A review. Mater. Today Energy 2020, 17, 100463. [Google Scholar]
- Niaz, S.; Manzoor, T.; Pandith, A.H.; Reviews, S.E. Hydrogen storage: Materials, methods and perspectives. Renew. Sustain. Energy Rev. 2015, 50, 457–469. [Google Scholar]
- Brinkman, L.; Bulfin, B.; Steinfeld, A. Thermochemical hydrogen storage via the reversible reduction and oxidation of metal oxides. Energy Fuels 2021, 35, 18756–18767. [Google Scholar] [CrossRef]
- So, S.H.; Ha, S.; Min, C.G.; Lee, Y.-S.; Park, C.R. Effects of nitrogen plasma treatments on hydrogen storage capacity of microporous carbon at room temperature and its feasibility as a hydrogen storage material. Carbon Lett. 2023, 33, 1027–1034. [Google Scholar]
- Sakintuna, B.; Lamari-Darkrim, F.; Hirscher, M. Metal hydride materials for solid hydrogen storage: A review. Int. J. Hydrog. Energy 2007, 32, 1121–1140. [Google Scholar]
- Kalam, S.; Abu-Khamsin, S.A.; Kamal, M.S.; Abbasi, G.R.; Lashari, N.; Patil, S.; Abdurrahman, M. A mini-review on underground hydrogen storage: Production to field studies. Energy Fuels 2023, 37, 8128–8141. [Google Scholar]
- Seayad, A.M.; Antonelli, D.M. Recent advances in hydrogen storage in metal-containing inorganic nanostructures and related materials. Adv. Mater. 2004, 16, 765–777. [Google Scholar]
- Zhao, P.; Zeng, X.; Wang, Y. Hydrogen absorption/desorption performance analysis and optimization on thin double-layered annular hydrogen storage bed: Heat and mass transfer. J. Energy Storage 2024, 100, 113647. [Google Scholar]
- Zubizarreta, L.; Arenillas, A.; Pis, J.J. Carbon materials for H2 storage. Int. J. Hydrog. Energy 2009, 34, 4575–4581. [Google Scholar]
- Attia, N.F.; Elashery, S.E.; Nour, M.A.; Policicchio, A.; Agostino, R.G.; Abd-Ellah, M.; Jiang, S.; Oh, H. Recent advances in sustainable and efficient hydrogen storage nanomaterials. J. Energy Storage 2024, 100, 113519. [Google Scholar] [CrossRef]
- Ströbel, R.; Garche, J.; Moseley, P.; Jörissen, L.; Wolf, G. Hydrogen storage by carbon materials. J. Power Sources 2006, 159, 781–801. [Google Scholar]
- Ao, Z.; Tan, T.; Li, S.; Jiang, Q. Molecular hydrogen storage in Al-doped bulk graphite with wider layer distances. Solid State Commun. 2009, 149, 1363–1367. [Google Scholar]
- Lueking, A.D.; Pan, L.; Narayanan, D.L.; Clifford, C.E.B. Effect of expanded graphite lattice in exfoliated graphite nanofibers on hydrogen storage. J. Phys. Chem. B 2005, 109, 12710–12717. [Google Scholar]
- Kothandam, G.; Singh, G.; Guan, X.; Lee, J.M.; Ramadass, K.; Joseph, S.; Benzigar, M.; Karakoti, A.; Yi, J.; Kumar, P.; et al. Recent advances in carbon-based electrodes for energy storage and conversion. Adv. Sci. 2023, 10, 2301045. [Google Scholar]
- Kiciński, W.; Szala, M.; Bystrzejewski, M. Sulfur-doped porous carbons: Synthesis and applications. Carbon 2014, 68, 1–32. [Google Scholar]
- Pei, P.; Whitwick, M.B.; Kureshi, S.; Cannon, M.; Quan, G.; Kjeang, E. Hydrogen storage mechanism in transition metal decorated graphene oxide: The symbiotic effect of oxygen groups and high layer spacing. Int. J. Hydrog. Energy 2020, 45, 6713–6726. [Google Scholar]
- Klechikov, A.; Sun, J.; Hu, G.; Zheng, M.; Wågberg, T.; Talyzin, A.V. Graphene decorated with metal nanoparticles: Hydrogen sorption and related artefacts. Microporous Mesoporous Mater. 2017, 250, 27–34. [Google Scholar] [CrossRef]
- Bonanno, M.; Müller, K.; Bensmann, B.; Hanke-Rauschenbach, R.; Aili, D.; Franken, T.; Chromik, A.; Peach, R.; Freiberg, A.T.; Thiele, S. Review and prospects of PEM water electrolysis at elevated temperature operation. Adv. Mater. Technol. 2024, 9, 2300281. [Google Scholar] [CrossRef]
- Zan, R.; Altuntepe, A. Nitrogen doping of graphene by CVD. J. Mol. Struct. 2020, 1199, 127026. [Google Scholar]
- Srinivas, G.; Zhu, Y.; Piner, R.; Skipper, N.; Ellerby, M.; Ruoff, R. Synthesis of graphene-like nanosheets and their hydrogen adsorption capacity. Carbon 2010, 48, 630–635. [Google Scholar] [CrossRef]
- Kim, B.H.; Hong, W.G.; Yu, H.Y.; Han, Y.-K.; Lee, S.M.; Chang, S.J.; Moon, H.R.; Jun, Y.; Kim, H.J. Thermally modulated multilayered graphene oxide for hydrogen storage. Phys. Chem. Chem. Phys. 2012, 14, 1480–1484. [Google Scholar] [CrossRef] [PubMed]
- Rajaura, R.S.; Srivastava, S.; Sharma, V.; Sharma, P.; Lal, C.; Singh, M.; Palsania, H.; Vijay, Y. Role of interlayer spacing and functional group on the hydrogen storage properties of graphene oxide and reduced graphene oxide. Int. J. Hydrog. Energy 2016, 41, 9454–9461. [Google Scholar] [CrossRef]
- Li, H.; Sun, C.; Li, J.; Mei, J.; Jiang, J.; Fan, F.; Yang, W.; Zhuo, R.; Song, K. Self-Tuning Oxygen Excess Ratio Control for Proton Exchange Membrane Fuel Cells Under Dynamic Conditions. Processes 2024, 12, 2807. [Google Scholar] [CrossRef]
- Tuinstra, F.; Koenig, J.L. Raman spectrum of graphite. J. Chem. Phys. 1970, 53, 1126–1130. [Google Scholar] [CrossRef]
- Ferrari, A.C.; Robertson, J. Interpretation of Raman spectra of disordered and amorphous carbon. Phys. Rev. B 2000, 61, 14095. [Google Scholar] [CrossRef]
- Ferrari, A.C.; Meyer, J.C.; Scardaci, V.; Casiraghi, C.; Lazzeri, M.; Mauri, F.; Piscanec, S.; Jiang, D.; Novoselov, K.S.; Roth, S.; et al. Raman spectrum of graphene and graphene layers. Phys. Rev. Lett. 2006, 97, 187401. [Google Scholar] [CrossRef]
- Liu, W.; Li, H.; Xu, C.; Khatami, Y.; Banerjee, K. Synthesis of high-quality monolayer and bilayer graphene on copper using chemical vapor deposition. Carbon 2011, 49, 4122–4130. [Google Scholar] [CrossRef]
- Hao, Y.; Wang, Y.; Wang, L.; Ni, Z.; Wang, Z.; Wang, R.; Koo, C.K.; Shen, Z.; Thong, J.T.L. Probing layer number and stacking order of few-layer graphene by Raman spectroscopy. Small 2010, 6, 195–200. [Google Scholar] [CrossRef]
- Elias, D.C.; Nair, R.R.; Mohiuddin, T.; Morozov, S.; Blake, P.; Halsall, M.; Ferrari, A.C.; Boukhvalov, D.; Katsnelson, M.; Geim, A.K.; et al. Control of graphene’s properties by reversible hydrogenation: Evidence for graphane. Science 2009, 323, 610–613. [Google Scholar] [CrossRef]
- Albetran, H.M. Structural Characterization of Graphite Nanoplatelets Synthesized from Graphite Flakes. Preprints 2020, 100, 520 2020080325. [Google Scholar] [CrossRef]
- Monteserín, C.; Blanco, M.; Aranzabe, E.; Aranzabe, A.; Laza, J.M.; Larrañaga-Varga, A.; Vilas, J.L. Effects of graphene oxide and chemically-reduced graphene oxide on the dynamic mechanical properties of epoxy amine composites. Polymers 2017, 9, 449. [Google Scholar] [CrossRef] [PubMed]
- Patterson, A.L. The Scherrer formula for X-ray particle size determination. Phys. Rev. B 1939, 56, 978. [Google Scholar]
- Fouda, A.N.; El Shazly, M.D.; Almaqwashi, A.A. Facile and scalable green synthesis of N-doped graphene/CNTs nanocomposites via ball milling. Ain Shams Eng. J. 2021, 12, 1017–1024. [Google Scholar]
- Hoang, N.B.; Nguyen, T.T.; Nguyen, T.S.; Bui, T.P.Q.; Bach, L.G. The application of expanded graphite fabricated by microwave method to eliminate organic dyes in aqueous solution. Cogent Eng. 2019, 6, 1584939. [Google Scholar]
- Krishna, R.; Titus, E.; Okhay, O.; Gil, J.C.; Ventura, J.; Ramana, E.V.; Gracio, J.J. Rapid electrochemical synthesis of hydrogenated graphene oxide using Ni nanoparticles. Int. J. Electrochem. Sci. 2014, 9, 4054–4069. [Google Scholar]
- Rout, D.R.; Senapati, P.; Sutar, H.; Sau, D.C.; Murmu, R. Graphene oxide (GO) supported palladium (Pd) nanocomposites for enhanced hydrogenation. Graphene 2020, 8, 33–51. [Google Scholar]
- Gupta, R.; Alahmed, Z.; Yakuphanoglu, F. Graphene oxide based low cost battery. Mater. Lett. 2013, 112, 75–77. [Google Scholar]
- Ariharan, A.; Viswanathan, B.; Nandhakumar, V. Nitrogen doped graphene as potential material for hydrogen storage. Graphene 2017, 6, 41–60. [Google Scholar]
- Esmaeili, A.; Entezari, M. Facile and fast synthesis of graphene oxide nanosheets via bath ultrasonic irradiation. J. Colloid Interface Sci. 2014, 432, 19–25. [Google Scholar]
- Fatima, S.; Ali, S.I.; Younas, D.; Islam, A.; Akinwande, D.; Rizwan, S. Graphene nanohybrids for enhanced catalytic activity and large surface area. MRS Commun. 2019, 9, 27–36. [Google Scholar] [CrossRef]
- Zhang, S.; Wang, H.; Liu, J.; Bao, C. Measuring the specific surface area of monolayer graphene oxide in water. Mater. Lett. 2020, 261, 127098. [Google Scholar] [CrossRef]
- Kim, J.; Eum, J.-H.; Kang, J.; Kwon, O.; Kim, H.; Kim, D.W. Tuning the hierarchical pore structure of graphene oxide through dual thermal activation for high-performance supercapacitor. Sci. Rep. 2021, 11, 2063. [Google Scholar]
- Shen, J.; Yan, B.; Shi, M.; Ma, H.; Li, N.; Ye, M. One step hydrothermal synthesis of TiO2-reduced graphene oxide sheets. J. Mater. Chem. 2011, 21, 3415–3421. [Google Scholar]
- Jindal, H.; Oberoi, A.S.; Sandhu, I.S.; Chitkara, M.; Singh, B. Graphene for hydrogen energy storage-A comparative study on GO and rGO employed in a modified reversible PEM fuel cell. Int. J. Energy Res. 2021, 45, 5815–5826. [Google Scholar]
- Mehta, S.S.; Nadargi, D.Y.; Tamboli, M.S.; Alshahrani, T.; Minnam Reddy, V.R.; Kim, E.S.; Mulla, I.S.; Park, C.; Suryavanshi, S.S. RGO/WO3 hierarchical architectures for improved H2S sensing and highly efficient solar-driving photo-degradation of RhB dye. Sci. Rep. 2021, 11, 5023. [Google Scholar] [CrossRef]
- Wei, L.; Mao, Y. Enhanced hydrogen storage performance of reduced graphene oxide hybrids with nickel or its metallic mixtures based on spillover mechanism. Int. J. Hydrog. Energy 2016, 41, 11692–11699. [Google Scholar] [CrossRef]
- Ganesha, H.; Veeresh, S.; Nagaraju, Y.; Vandana, M.; Basappa, M.; Vijeth, H.; Devendrappa, H. 2-Dimensional layered molybdenum disulfide nanosheets and CTAB-assisted molybdenum disulfide nanoflower for high performance supercapacitor application. Nanoscale Adv. 2022, 4, 521–531. [Google Scholar]
- Li, G.; Jing, M.; Chen, Z.; He, B.; Zhou, M.; Hou, Z. Self-assembly of porous CuO nanospheres decorated on reduced graphene oxide with enhanced lithium storage performance. RSC Adv. 2017, 7, 10376–10384. [Google Scholar]
- Georgiev, P.; Ross, D.; Albers, P.; Ramirez-Cuesta, A. The rotational and translational dynamics of molecular hydrogen physisorbed in activated carbon: A direct probe of microporosity and hydrogen storage performance. Carbon 2006, 44, 2724–2738. [Google Scholar]
- Aboutalebi, S.H.; Aminorroaya-Yamini, S.; Nevirkovets, I.; Konstantinov, K.; Liu, H.K. Enhanced hydrogen storage in graphene oxide-MWCNTs composite at room temperature. Adv. Energy Mater. 2012, 2, 1439–1446. [Google Scholar]
- Hynek, S.; Fuller, W.; Bentley, J. Hydrogen storage by carbon sorption. Int. J. Hydrog. Energy 1997, 22, 601–610. [Google Scholar] [CrossRef]
- Yadav, S.; Zhu, Z.; Singh, C.V. Defect engineering of graphene for effective hydrogen storage. Int. J. Hydrog. Energy 2014, 39, 4981–4995. [Google Scholar] [CrossRef]
- Darkrim, F.L.; Malbrunot, P.; Tartaglia, G. Review of hydrogen storage by adsorption in carbon nanotubes. Int. J. Hydrog. Energy 2002, 27, 193–202. [Google Scholar] [CrossRef]
- Lee, S.-Y.; Park, S.-J. Hydrogen adsorption of acid-treated multi-walled carbon nanotubes at low temperature. Bull. Korean Chem. Soc. 2010, 31, 1596–1600. [Google Scholar] [CrossRef]
- Xia, Y.; Walker, G.S.; Grant, D.M.; Mokaya, R. Hydrogen storage in high surface area carbons: Experimental demonstration of the effects of nitrogen doping. J. Am. Chem. Soc. 2009, 131, 16493–16499. [Google Scholar] [CrossRef]
- Ozturk, Z. The effect of surface area and dopant percentage on hydrogen storage of Pt@ ac loaded activated carbon and Cu-BTC composites. Int. J. Renew. Energy Res. 2016, 6, 1007–1014. [Google Scholar]
- Blackman, J.M.; Patrick, J.W.; Arenillas, A.; Shi, W.; Snape, C.E. Activation of carbon nanofibres for hydrogen storage. Carbon 2006, 44, 1376–1385. [Google Scholar] [CrossRef]
- Chan, Y.; Hill, J.M. Hydrogen storage inside graphene-oxide frameworks. Nanotechnology 2011, 22, 305403. [Google Scholar] [CrossRef]
- Kim, T.H.; Bae, J.; Lee, T.H.; Hwang, J.; Jung, J.H.; Kim, D.K.; Lee, J.S.; Kim, D.O.; Lee, Y.H.; Ihm, J. Room-temperature hydrogen storage via two-dimensional potential well in mesoporous graphene oxide. Nano Energy 2016, 27, 402–411. [Google Scholar]
- Ghosh, A.; Subrahmanyam, K.; Krishna, K.S.; Datta, S.; Govindaraj, A.; Pati, S.K.; Rao, C. Uptake of H2 and CO2 by graphene. J. Phys. Chem. C 2008, 112, 15704–15707. [Google Scholar] [CrossRef]
- Saeed, E.W.; Warkozek, E.G. Modeling and analysis of renewable PEM fuel cell system. Energy Procedia 2015, 74, 87–101. [Google Scholar]
- Wang, Y.; Pang, Y.; Xu, H.; Martinez, A.; Chen, K.S. PEM Fuel cell and electrolysis cell technologies and hydrogen infrastructure development–a review. Energy Environ. Sci. 2022, 15, 2288–2328. [Google Scholar] [CrossRef]
- Chen, Z.; Shu, C.; Gan, Z.; Cao, J.; Qiu, P.; Sun, X.; Deng, C.; Wu, Y.; Tang, W. Research Progress and Perspectives on Anti-Poisoning Hydrogen Oxidation Reaction Electrocatalysts for Hydrogen Fuel Cells. Small 2025, 21, 2411049. [Google Scholar] [CrossRef] [PubMed]
- Zhai, Q.; Huang, H.; Lawson, T.; Xia, Z.; Giusto, P.; Antonietti, M.; Jaroniec, M.; Chhowalla, M.; Baek, J.B.; Liu, Y.; et al. Recent advances on carbon-based metal-free electrocatalysts for energy and chemical conversions. Adv. Mater. 2024, 36, 2405664. [Google Scholar]


Disclaimer/Publisher’s Note: The statements, opinions and data contained in all publications are solely those of the individual author(s) and contributor(s) and not of MDPI and/or the editor(s). MDPI and/or the editor(s) disclaim responsibility for any injury to people or property resulting from any ideas, methods, instructions or products referred to in the content. |
© 2025 by the authors. Licensee MDPI, Basel, Switzerland. This article is an open access article distributed under the terms and conditions of the Creative Commons Attribution (CC BY) license (https://creativecommons.org/licenses/by/4.0/).