Article

Cushion Gas in Hydrogen Storage—A Costly CAPEX or a Valuable Resource for Energy Crises?

by
Niklas Heinemann
*,
Mark Wilkinson
,
Kate Adie
,
Katriona Edlmann
,
Eike Marie Thaysen
,
Aliakbar Hassanpouryouzband
and
Robert Stuart Haszeldine
School of Geosciences, University of Edinburgh, Edinburgh EH9 3FE, UK
*
Author to whom correspondence should be addressed.
Hydrogen 2022, 3(4), 550-563; https://doi.org/10.3390/hydrogen3040035
Submission received: 5 September 2022 / Revised: 5 December 2022 / Accepted: 7 December 2022 / Published: 12 December 2022

Abstract

:
The geological storage of hydrogen is a seasonal energy storage solution, and the storage capacity of saline aquifers is most appropriately defined by quantifying the amount of hydrogen that can be injected and reproduced over a relevant time period. Cushion gas, stored in the reservoir to support the production of the working gas, is a CAPEX, which should be reduced to decrease implementation cost for gas storage. The cushion gas to working gas ratio provides a sufficiently accurate reflection of the storage efficiency, with higher ratios equating to larger initial investments. This paper investigates how technical measures, such as well configurations and adjustments to the operational size and schedule, can reduce this ratio, and the outcomes can inform optimisation strategies for hydrogen storage operations. Using a simplified open saline aquifer reservoir model, hydrogen storage is simulated with a single injection and production well. The results show that the injection process is more sensitive to technical measures than the production process; a shorter perforation and a smaller well diameter increases the required cushion gas for the injection process but has little impact on the production. If the storage operation capacity is expanded, and the working gas volume increased, the required cushion gas to working gas ratio increases for injection, reducing the efficiency of the injection process. When the reservoir pressure has more time to equilibrate, less cushion gas is required. It is shown that cushion gas plays an important role in storage operations and that the tested optimisation strategies impart only minor effects on the production process, however, there is significant need for careful optimisation of the injection process. It is suggested that the recoverable part of the cushion gas could be seen as a strategic gas reserve, which can be produced during an energy crisis. In this scenario, the recoverable cushion gas could be owned by the state, and the upfront costs for gas storage to the operator would be reduced, making the implementation of more gas storage and the onset of hydrogen storage more attractive to investors.

1. Introduction

Stored hydrogen energy can alleviate key drawbacks associated with renewable energy generation, such as intermittency and seasonal and geographical constraints [1,2,3]. Renewable energy generation is reliant on seasonally fluctuating atmospheric events and is, therefore, often unable to match energy demand patterns. Green hydrogen storage—the storage of renewable energy converted to hydrogen during times of excess energy production and its reproduction and usage during periods of high-energy demand—could improve renewable energy efficiency. Additionally, hydrogen storage can increase energy security and decrease reliance on costly gas imports. Natural gas storage, the storage of gas that can be added to the market during times of low supply and soaring prices, has been used to support energy security for decades. The storage of green hydrogen, especially when produced from domestic, otherwise curtailed wind energy, would reduce the reliance on exports further, and at the same time decarbonise the carbon-based energy storage system for a net-zero future.
In cyclic gas storage, the working gas (WG) is the part of the gas that is injected and withdrawn during the commercial gas storage operation, while the cushion gas (CG) remains in the storage site to maintain efficient and desired production levels and reduce water inflow. An assessment of CG requirements, and the potential to reduce the necessary volume, while maintaining production rates (optimisation), is of interest, as CG is a significant upfront CAPEX investment. Additionally, CG is directly related to dynamic storage capacity in that the lower the required CG/WG ratio is, the higher the WG capacity of the site is.
The assessment of storage capacity in hydrogen storage, and in fact in all gas storage strategies, is an important exercise for industry and investors. Previous work on CO2 storage introduced the storage pyramid, to distinguish between theoretical, effective, practical and matched capacity e.g., [4,5]. This stepwise methodology, depending on the state of research and knowledge, is transferable, especially when it comes to the two fundamental differences in capacity estimation: static and dynamic capacity. In cyclic gas storage, such as for hydrogen and natural gas, the difference between static and dynamic capacity is highly important. Compared to permanent CO2 storage, in cyclic gas storage the WG must be injected and produced over a few months – a very different scenario compared to CO2 storage. As an example, the hydrogen storage capacity of depleted gas fields is often calculated based on a substitution of the original gas in place with hydrogen [6,7]. However, the original gas in place has been produced often over decades, while the window for production in cyclic gas storage is just several months. Additionally, very high production rates are often achieved during the early stages of the gas field operation, when the ratio of produced gas (working gas) is small compared to the cushion gas volume. As a consequence, dynamic gas storage capacities require extensive optimisation strategies to achieve dynamic storage capacities comparable to static capacities.
There have been several scientific publications on the role of cushion gas in hydrogen storage recently, including work on alternative cushion gas, such as nitrogen, methane and CO2, in depleted oil reservoir stores [8]. More detailed work on the mixing of hydrogen and alternative cushion gases in hydrogen storage was published by Wang, where he analysed the recovery performance during hydrogen storage [9]. A recent study presented an open-source tool for the calculation of cushion gas to working gas ratios for hydrogen storage scenarios utilizing the well inflow performance equation [10]. They conclude that the performance of the hydrogen storage operation can change significantly by adjusting the number of wells and the well properties, and, hence, discuss the concept of technical optimization in hydrogen storage using a very different approach compared to this work.
Heinemann et al. published a study on how to calculate dynamic hydrogen storage capacity based on cushion gas in an open saline aquifer [11]. The main conclusion is that geological parameters, such as reservoir properties and depths, have an important impact on cushion gas requirements and, hence, that dynamic capacities and cushion gas volumes are higher, and, as such, costs vary depending on the geological environment. In this study, the impact of technical aspects on cushion gas requirements to optimise capacity is investigated in order to assess whether different operational setups can reduce cost and increase storage efficiency. The methodology introduced by [11] is applied in this study. Five technical specifications, which can be adjusted by engineers, are introduced as variables: perforation length, well diameter, working gas volume, rest time after cushion gas injection and working gas injection and production time. It is important to highlight that the presented study is linked to a specific demand scenario and investigated how much cushion gas would be required to inject and produce this set amount of hydrogen during a pre-defined time. As an example, it is obvious that a bigger well can produce more gas during a certain time interval, but will the associated cushion gas requirement be reduced, to produce with the same rate with this well size? Hence, the study compares the cushion gas requirement depending on the technical specification, and if the cushion gas requirement is lower, a larger dynamic capacity is expected.
Hydrogen storage that supplies sustainable energy in the GWh- or TWh-range over months requires subsurface storage in subsurface formations, such as depleted hydrocarbon reservoirs, saline aquifers and salt caverns [12,13]. Considering the scale of decarbonisation required across the entire energy sector, large-scale storage in depleted gas fields and saline aquifers is considered a promising strategy. A thorough introduction to hydrogen storage in open saline aquifers is provided by [11]; therefore, only a summary will be presented here:
  • Open saline aquifers are mostly hydrostatically pressured; as such, injecting in an open system leads to a pressure build-up. This can initially restrict injection rates, but will equilibrate with time, depending on how well the aquifer is hydraulically connected to the regional geology. When gas is injected into a saline aquifer, two-phase flow of hydrogen and brine can be expected.
  • Open saline aquifers are often poorly characterised because their exploration has, so far, been of little commercial value. However, the low well density reduces the risk of leakage via abandoned wells, which is considered to be a major threat to gas storage containment [14].
  • Saline aquifers are geologically connected to sedimentary basins, which occur worldwide. The size of individual anticlines, potential storage targets, can also be significant, such as the Bunter Sandstone dome structures in the Southern North Sea [15].
  • Saline aquifer storage sites (in comparison to depleted gas fields) will most likely require infrastructure investment. The cost of expensive infrastructure required for the storage operation could be significantly reduced by storage in sites close to already existing infrastructure; however, legacy infrastructure would require certification to be hydrogen compatible.
  • Hydrogen injection into subsurface porous media could stimulate the activity of microbes potentially causing well corrosion, hydrogen loss, the co-production of contaminating gases and clogging of pore space [16,17].
The commercial reservoir simulator GEM [18] was used for this study, and only the first storage cycle was simulated. The homogenous reservoir model is not representative of any ‘real-world’ storage sites, but rather represents their basic properties; hence, it is the trends, rather than the absolute results, which are of value to the development and optimisation of subsurface hydrogen storage projects.

2. Methodology

Heinemann et al. provides a detailed introduction of the storage demand scenario, the reservoir model and the modelled operation used in this study; therefore, only a summary is presented here [11]:

2.1. Hydrogen Storage Demand Scenario

Mouli-Castillo et al. [7] calculated a hydrogen energy demand of 6.5 TWh for the decarbonisation of domestic heating in East Anglia (UK). This study aims to inject and reproduce 25% of this annual hydrogen demand (1.625 TWh) in a saline aquifer anticline using one well as injector and producer. A higher heating value of 39.4 kWh/kg is used for the energy to mass conversion.

2.2. Reservoir Model

A 3D anticline reservoir model with a top depth of 1500 m, and a height difference between crest and base of 250 m (corresponding to a 10° dip angle), was created using Petrel (Schlumberger). The reservoir model has a radius of 2000 m, and the upper and lower boundaries do not allow flow across them. The model consists of 121,680 cells (50 × 50 m in the horizontal and 5 m in the vertical direction), and the central region of the grid is refined (25 × 25 × 2.5). Basic reservoir data are taken from [19,20], collated in [15]. The maximum allowable injection pressure is 90% of the calculated fracture pressure. The salinity of the brine represents an average of the East Irish Sea as well as the North Sea, compiled by [21] and the Oil and Gas Authority website (https://www.ogauthority.co.uk/data-centre/ (accessed in 2 March 2021)). Two-phase flow data from [22] is used, and capillary pressure is ignored in this study. A Fetkovitch analytical aquifer is used to model a virtually open system with a radius of 100 km [23]. Please see Table 1 for more information; the aquifer has the same properties as the reservoir model.
The dissolution of hydrogen in brine, as well as diffusion, is neglected because it is considered low and not of importance [24,25]. The Soave–Redlich–Kwong equation of state is utilised to model hydrogen properties. Common viscosity calculations [26,27] are used; see [11] for more detailed uncertainties.
Hydrogen injection and production is operated through a single well in the centre of the crest of the anticline and is controlled using a generalized Peaceman well model [28,29]. The pressure loss between the reservoir and the surface is calculated using a modification of a mechanistic wellbore model [30]. For the base case model, the perforation of the vertical well is connected to the upper 25 m of the reservoir, with a skin factor of zero and a well diameter of 4.5 inches.

2.3. Scenario Schedule

If the bottom-hole pressure (BHP) of the well during the CG and WG injection exceeds 90% of the calculated fracture pressure, the injection rate must be reduced in order to continue injecting. Additionally, in order to prevent water breakthrough, if the first cell underneath the perforation detects a water saturation at least 30%, production stops automatically. A minimum well-head pressure (WHP) for the production of hydrogen of 5 MPa is determined, based on current requirements for natural gas transmission in the UK [25,31]. Hence, if the wellhead pressure drops below 5 MPa, the production is reduced to allow the pressure to increase again.
The simulation schedule is similar to the previously published study [11]:
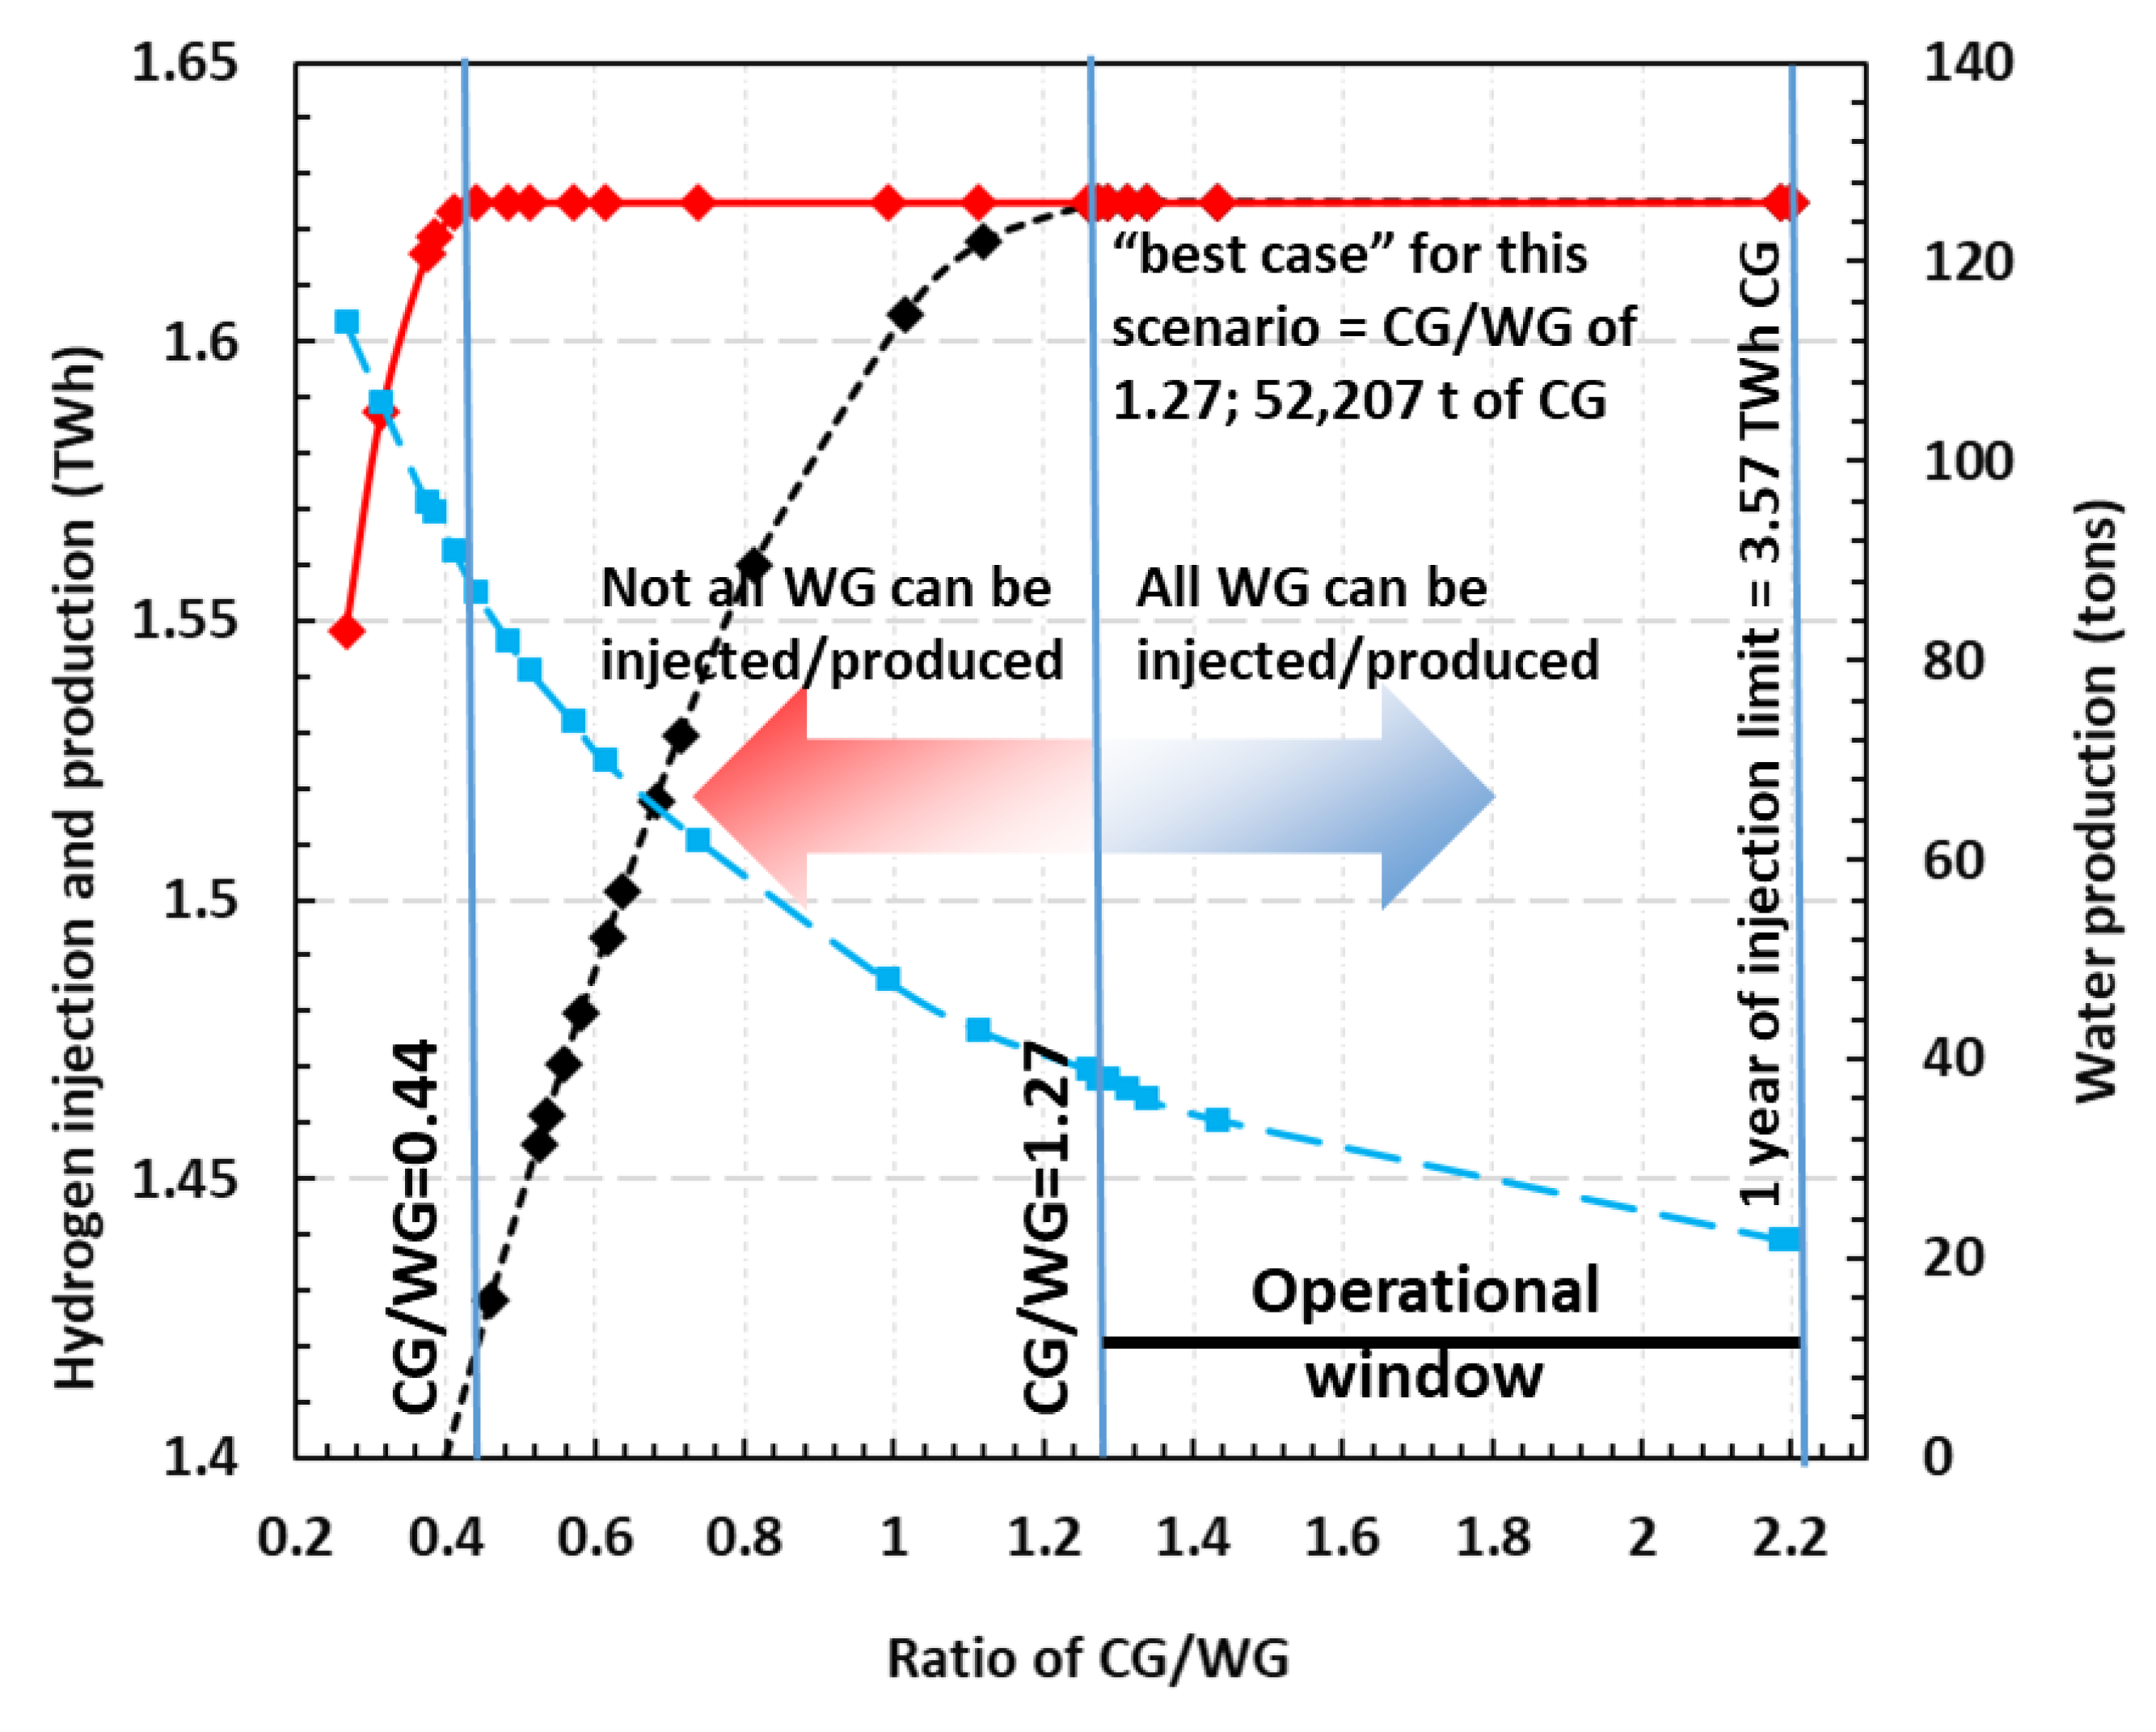
  • CG is injected during the first year and is controlled by a maximum allowed BHP, and, hence, the amount of CG injected depends on the duration of CG injection. The maximum CG injection time is one year.
  • The second year of operation starts with a rest phase of five months (January–May) for the CG injection pressure to equilibrate.
  • After the rest phase, the three-month WG injection period (June–August) commences and is succeeded by a rest phase of three months (September–November).
  • WG production starts at the beginning of December and lasts for 91 days, until the beginning of March.
As in [11], the target WG injection and production rate for the scenario is 1.625 TWh, or 41,244 tons, of hydrogen over a three-month (91 days) injection and production cycle, if not otherwise specified in the sensitivity tests. The targeted injection and production rate is capped at 453 tons per day, and a successful operation injects and produces the 453 tons of hydrogen per day for 91 days. The accuracy of the CG/WG ratios, reported via multiple scenarios runs, is +/−0.02 at ratios of interest.

2.4. The Base Case

Heinemann et al. describe the base case hydrogen injection and production process in detail, only the highlights will be repeated in this study [11]. During CG injection, the BHP rises to its maximum value immediately, and the injection rate is relatively low and increases only slowly. The reservoir pressure equilibrates after the CG injection ceases and the further expansion of the hydrogen plume leads to continued brine displacement. Upon commencement of the WG injection period, the BHP increases again, but, in contrast to the CG injection, the increase is slower. As the WG is injected, some brine is displaced; however, space in the reservoir is also accommodated by CG compression. The more CG was injected, the more space for WG is created by CG compression, and, hence, the slower the pressure increases, increasing WG injection efficiency. If insufficient CG is present, the BHP reaches the maximum allowable BHP during WG injection, and the injection rate is reduced; hence, the full 1.625 TWh of WG cannot be injected (Figure 1, CG/WG < 1.27).
After the rest period, the production cycle commences, and, therefore, the reservoir pressure, as well as the BHP and the WHP, drop. If the WHP drops below 5 MPa, production rate is restricted by the model, and the target 1.625 TWh of hydrogen cannot be produced (Figure 1, CG/WG < 0.44). The base case shows that, for most cases, under the study conditions, the production process requires less CG to be successful compared with the injection process.

2.5. Technical Optimisation Tests

This study highlights the effect of technical specifications as attempts to decrease the CG/WG ratio for hydrogen storage in open saline aquifers. The five tests are (Table 2):
(1)
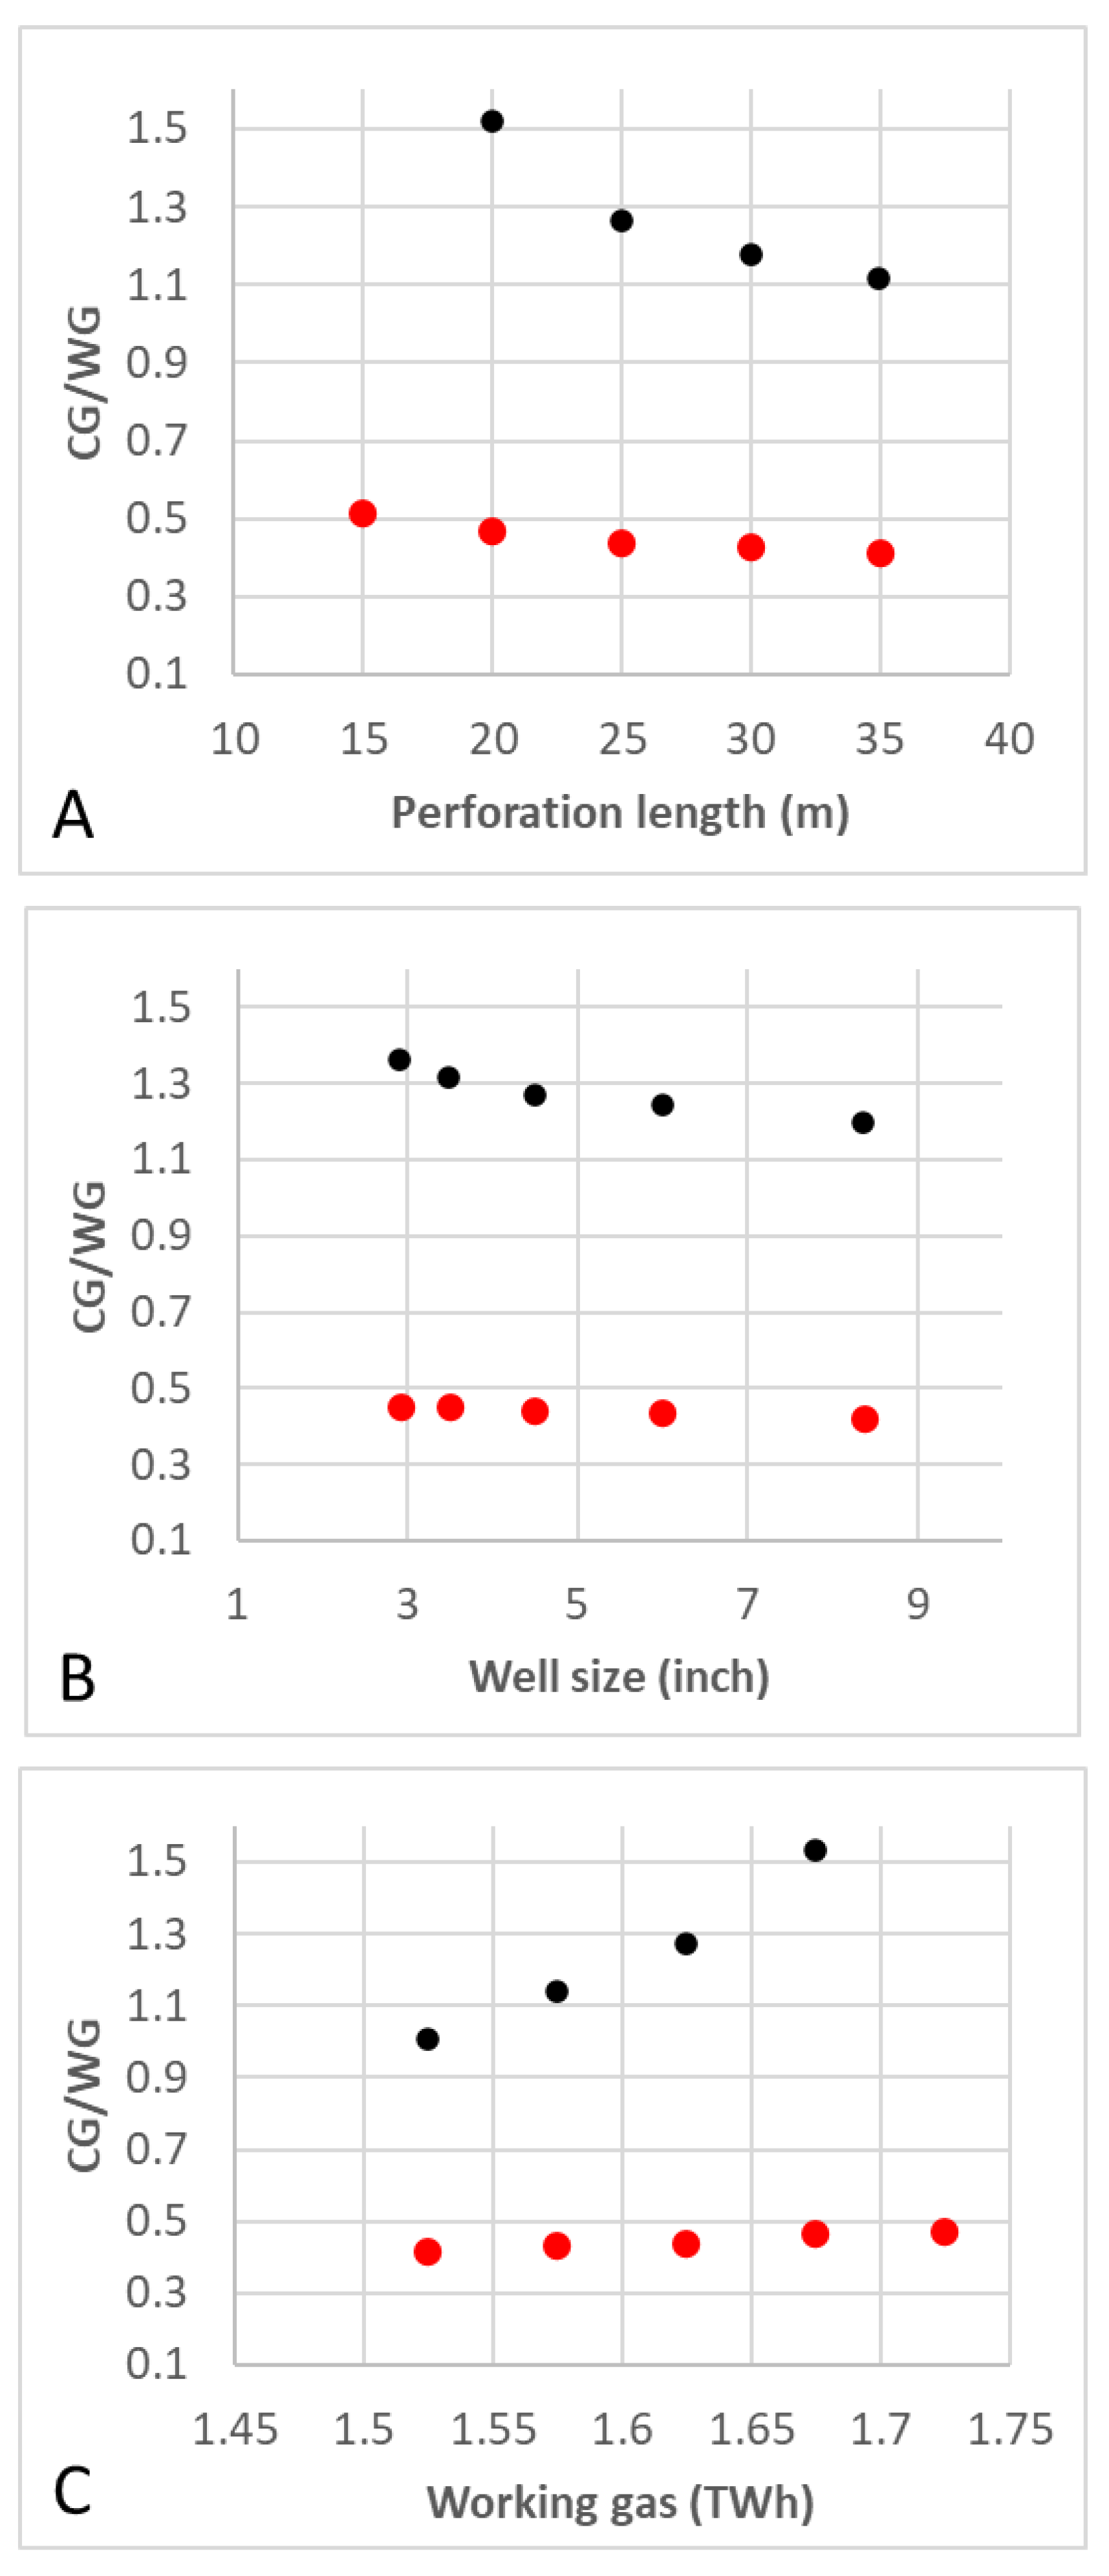
The perforation length: The perforation length determines how deep the open well penetrates the reservoir from the roof of the reservoir. The base case has a perforation of 25 m, and the sensitivity tests investigate a length between 15 m and 35 m.
(2)
The well diameter: The well diameter determines the size of the injection and production well and, hence, how much fluid can travel through the well for a fixed pressure gradient. The base case well had a diameter of 4.5″, and the sensitivity tests investigate a well diameter between 2.925″ and 8.378″.
(3)
WG target: This simulation tests if a change in the WG target will change the CG/WG ratio, essentially evaluating whether smaller or bigger scenarios are preferable in terms of CG requirements. The base case WG target was 1.625 TWh worth of hydrogen, and the sensitivity tests investigate WG targets between 1.525 TWh and 1.725 TWh.
(4)
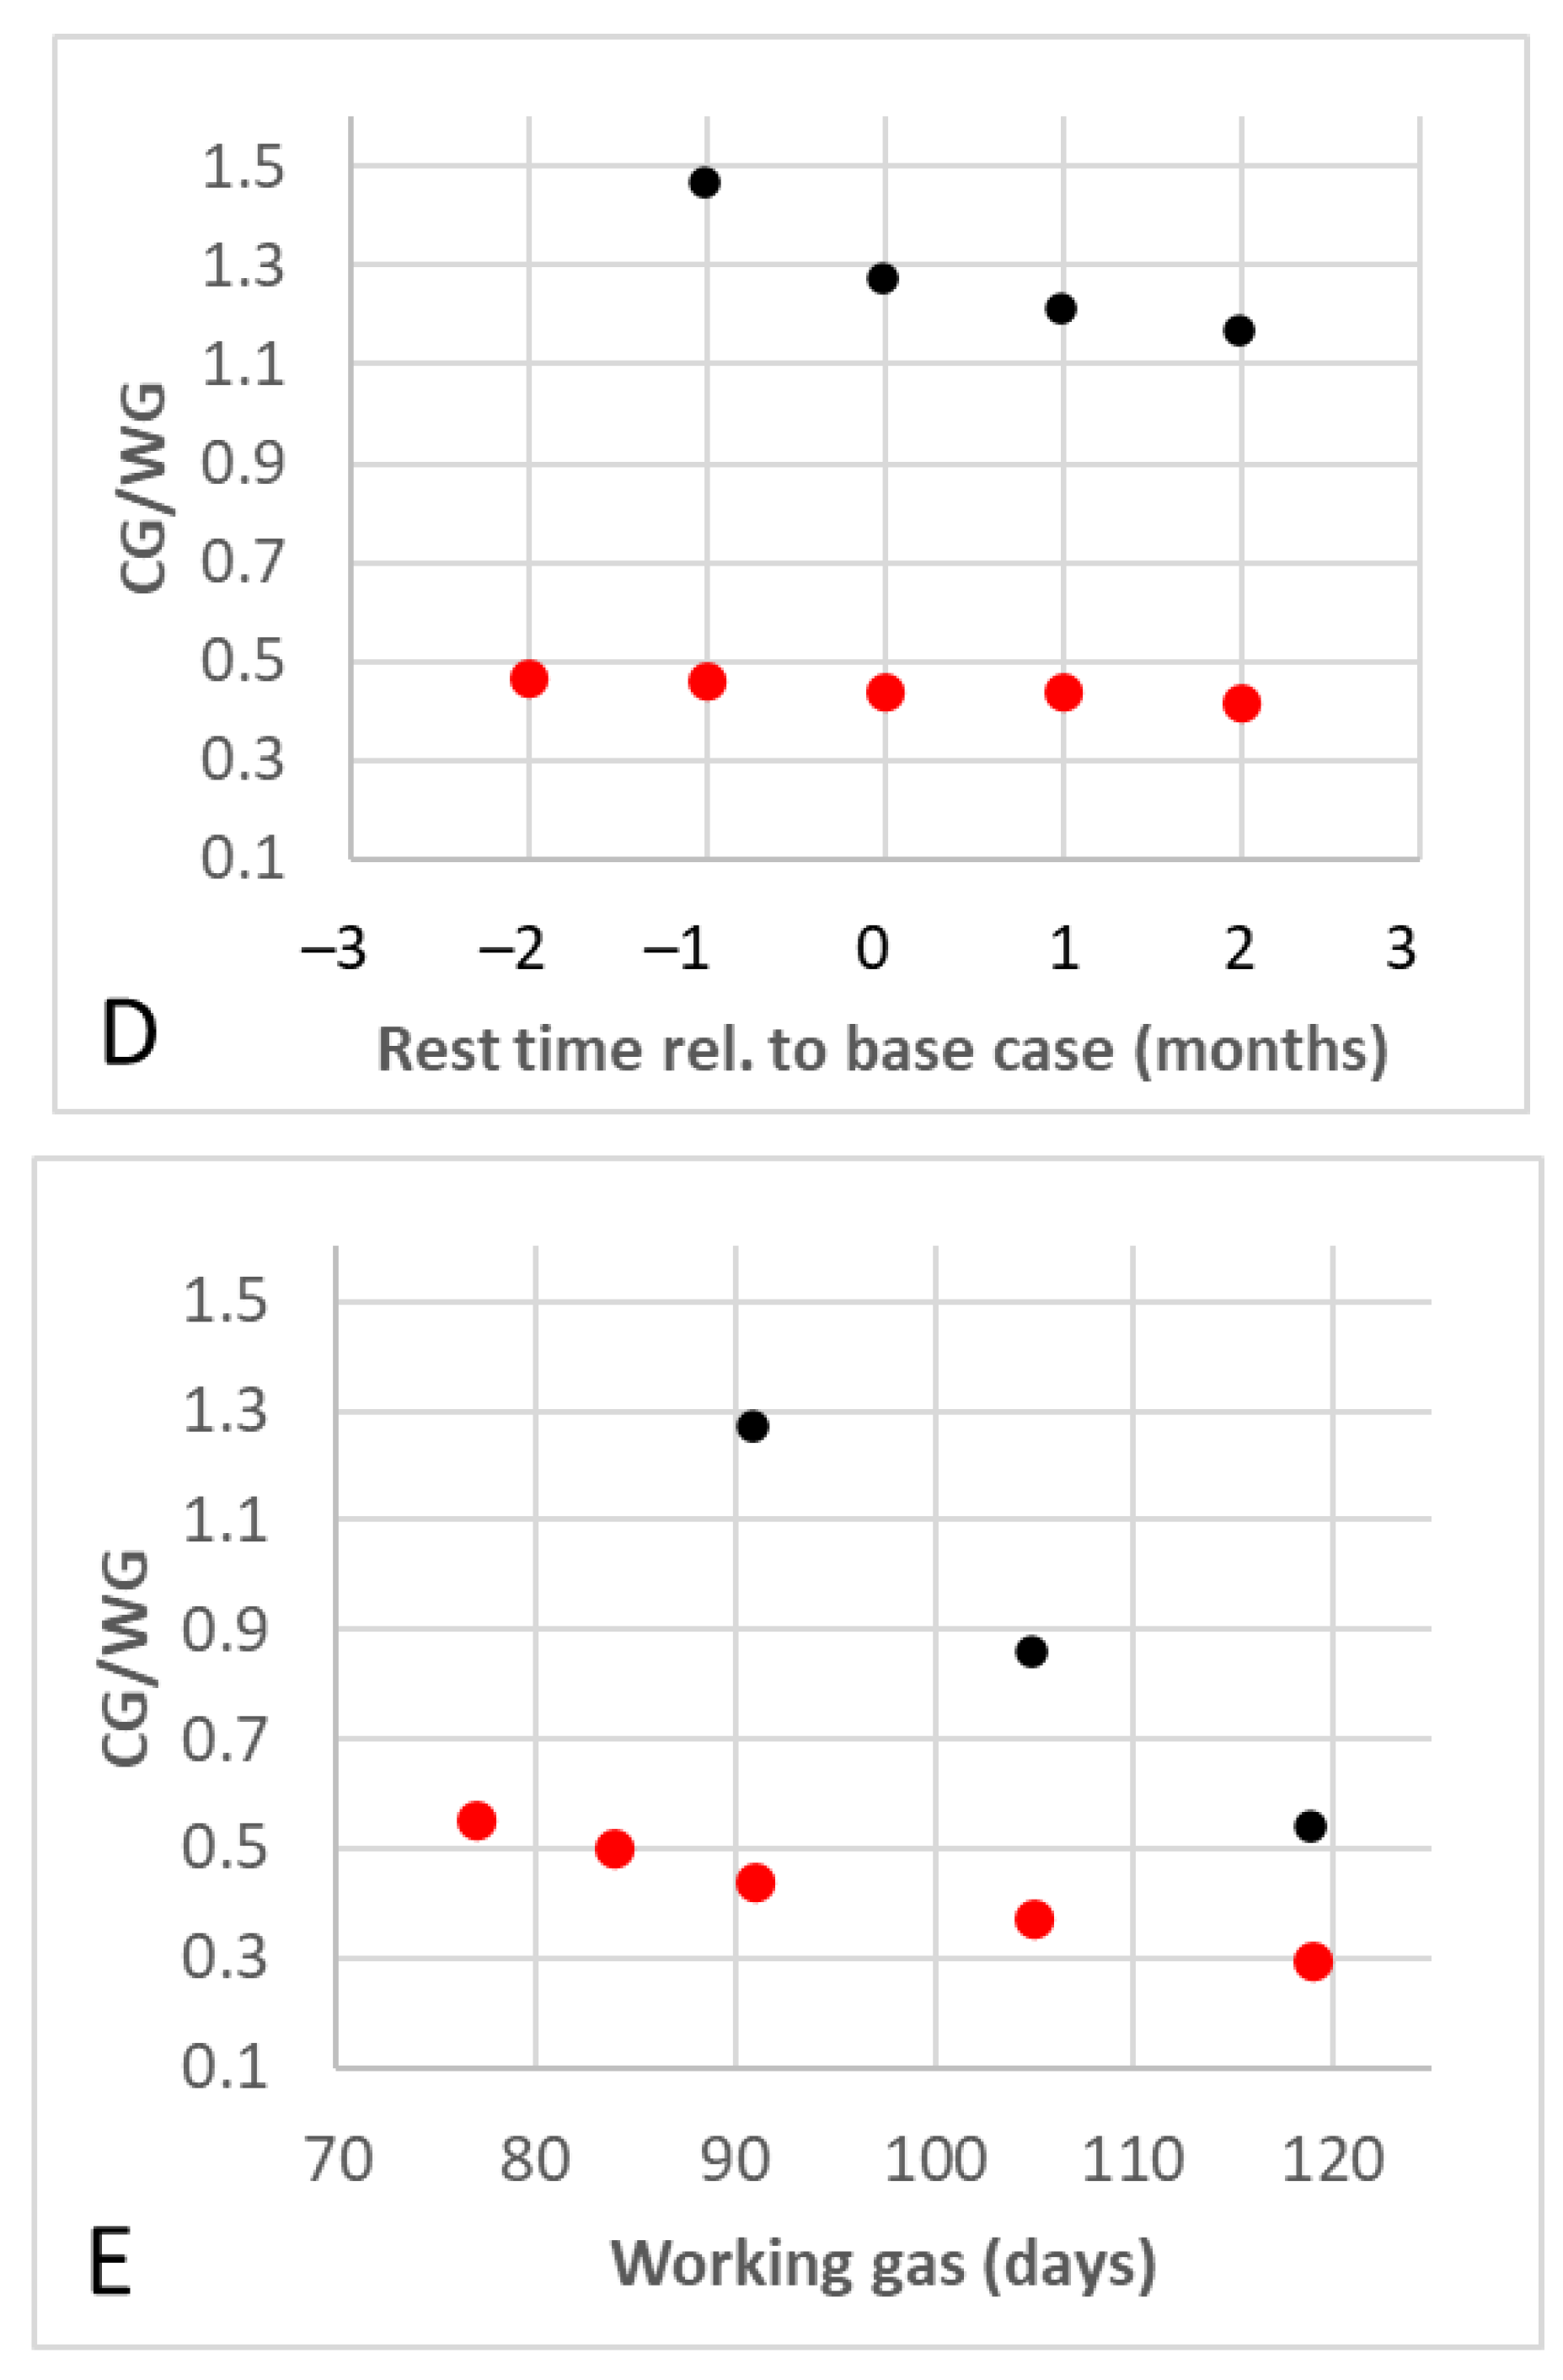
Rest time after CG injection: The rest time is the time the reservoir is given to equilibrate after the CG injection. For the base case, the rest time is at least 5 months, following a CG injection period lasting the entire first year. The rest time is longer than 5 months for scenarios with shorter CG injection periods. The sensitivity tests investigate a rest time of at least 3 to 7 months.
(5)
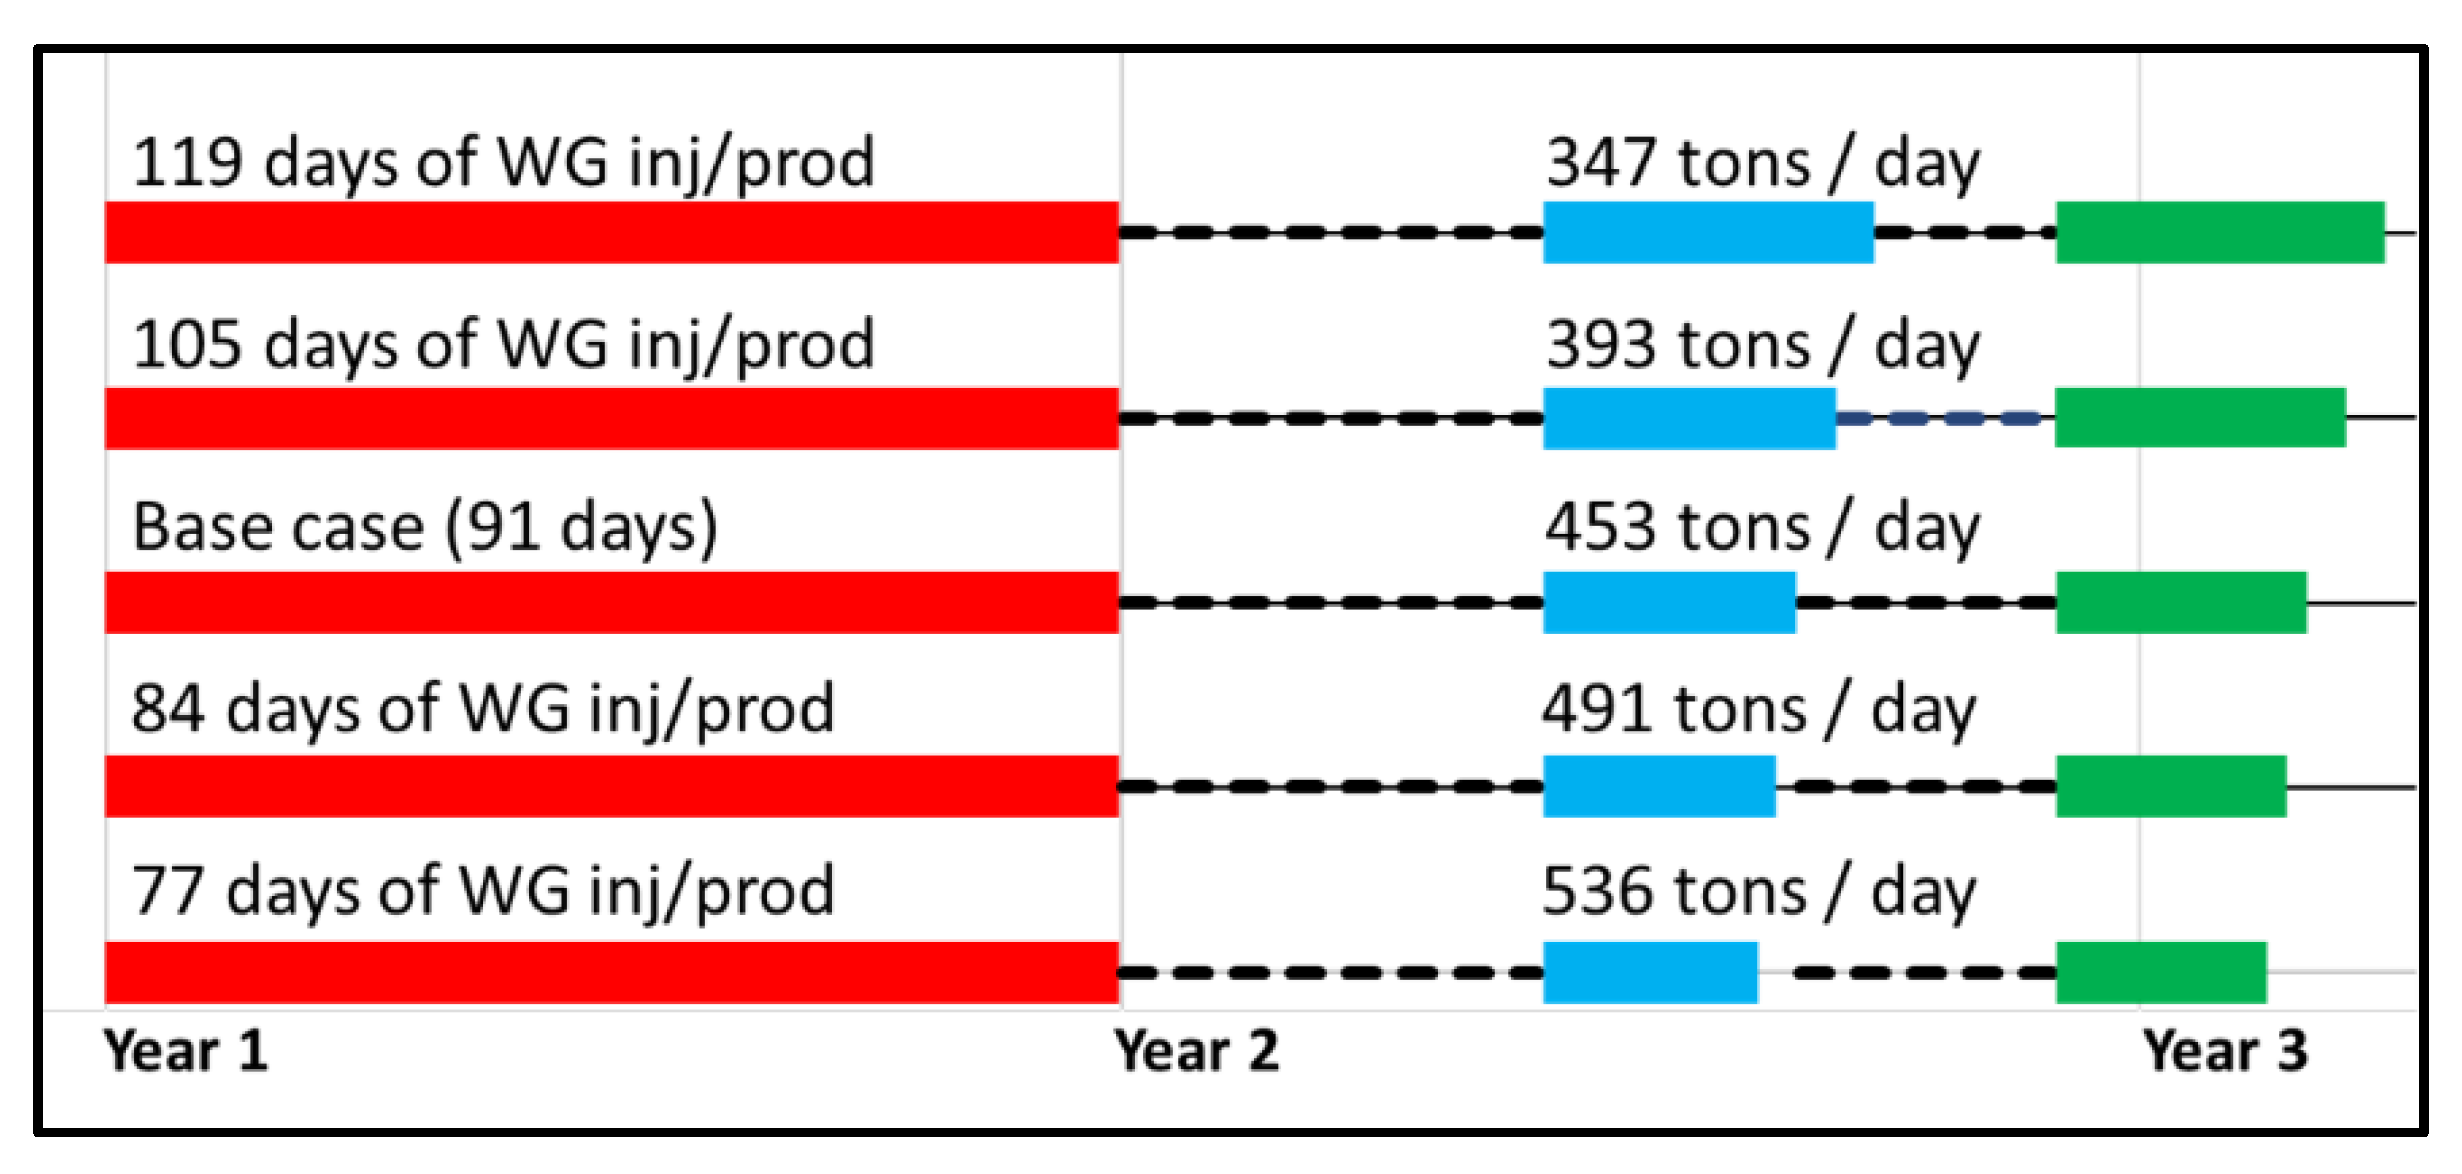
WG inj/prod duration (Figure 2): The base case injects and produces WG for 91 days with a 91-day rest period in between. This sensitivity test increases or decreases the duration of the injection, while decreasing and increasing the injection and production rate target accordingly to maintain the 1.625 TWh target, respectively, at the expense of the rest time between WG injection and production. The production duration is also adjusted in the same way, by extending or shortening the production period and increasing or decreasing the production rate target.

3. Results and Discussion

3.1. Base Case Scenario

The results of the base case scenario have been described in [11]; this will be repeated here in a condensed form only. Figure 1 illustrates the results of various base case modelling runs with different CG injection durations. Firstly, the hydrogen WG injection performance relative to the CG in place (dashed black line) is shown. With a CG/WG ratio of ~1.27 or higher, the targeted hydrogen (1.625 TWh) can be injected during the three-month injection period. If the CG/WG ratio is lower, not all the WG can be injected. Secondly, the hydrogen WG production performance relative to the CG in place (red line) is shown. With a CG/WG ratio of ~0.44 or higher, the targeted hydrogen (1.625 TWh) can be produced during the three-month production period. If the CG/WG ratio is lower than 0.44, not all the WG can be produced. The “best case” scenario, with the smallest volume of CG in place to support the WP cycling, is 1.27.
Most of the processes involved, and the importance of CG to exploit the total capacity of a storage site, have already been discussed in [11], and will only be summarised here. The storage process is dominated by gas compression and decompression and brine displacement. With low CG/WG, more brine must be displaced to accommodate the presence of the new hydrogen gas phase in the reservoir, and less CG is compressed, leading to a rapid pressure increase during the injection process. Heinemann et al. showed that although the pre-injection pressure of a scenario with small volumes of CG is lower, the corresponding pressure increase leads to a decline of the injection rate [11]. The production is most effective when the modelled gas pressure in the reservoir is highest. There are two reasons for high pressures in the simulations: high buoyancy pressure or high reservoir pressure due to insufficient pressure equilibration after the CG injection. Both high-pressure scenarios are linked to high CG volumes.
Heinemann et al. investigated the impact of geological parameters, storage depth, reservoir permeability and storage architecture on the CG requirements for hydrogen storage in an open saline aquifer [11]. The limiting factor for most of the modelled scenarios—with the exception of deeper storage structures and high reservoir permeabilities—was the WG injection operation. This was primarily related to the fact that large volumes of hydrogen need to be injected because of the lower energy density by volume for hydrogen under subsurface pressures and temperatures. The production process is more efficient than the injection, requiring less CG to produce the target volumes [11]. Taking this knowledge forward, any optimisation effort should focus on improving the injection process rather than the production. Indeed, all results of this study suggest that the impact of optimisation is far greater on the injection process than on the production process.
Compared to static storage capacity (based on pore space, the size of the structure or original gas in place), cyclic storage capacity is often better described by calculating how much can be injected and withdrawn over a time of interest. The results show that for all scenarios, the injection process is less efficient than the production process. It may be argued that the fracture pressure determination could be re-interpreted in order to allow higher injection pressures, but this will not be further discussed here as the applied values are taken from published methodology, and fracture pressure calculation is not a part of the presented research. The results also show that most of the investigated optimisation strategies have little effect on the production cycle but have distinct impact on the injection procedure. Hence, strategies to reduce the CG/WG of the “best case” scenario contribute to reduced costs by reducing CG requirements and increased storage capacity by increasing the WG volume.
It is important for the interpretation of the results to consider that this is a highly idealized scenario, and that the absolute results are heavily dependent on the choice of parameters. The simplification of the reservoir model, the homogenous reservoir properties, the regular shape and the homogonous aquifer characteristics, to name just a few, are presumably not to be seen in the geological world. However, the chosen setup allows for comparison of different scenarios and reduces the interpretation of the results to the basic modifications under investigation.

3.2. Sensitivity Tests

It is important to note that the results are based on an open, homogenous, almost ideal reservoir. The rapid pressure equilibration that this allows controls some of the study outcomes, and future work has to show how sensitive the conclusions are to other aquifer geologies and reservoir heterogeneities. Additionally, this study only investigates the CG injection and the first WG injection and production cycle. Table 3 and Figure 3 show the results of the sensitivity tests. Here, the results are reduced to two key figures, the CG/WG ratio required to inject and produce the targeted hydrogen volume. Scenarios that were unable to inject or produce the 1.625 TWh worth of hydrogen, or failed due to exceeding the allowed BHP pressure during injection and/or the WHP dropping below the allowed pressure level during production, are not included, unless highlighted in the text. For all scenarios and simulations, it is the lack of pressure support that causes failure to produce the targeted 1.625 TWh of hydrogen. No scenario shows a risk of the gas/water interface reaching the production perforation.
The length of the well perforation has an effect on the CG required for the injection of the targeted hydrogen. The longer the perforation, the lower the CG/WG ratio required, as this spreads the injection pressure over a larger area. All the target hydrogen WG can be injected with a CG/WG ratio of 1.12 and a perforation of 35 m, whilst a perforation of 20 m requires a CG/WG ratio of 1.52. No full injection is possible within the model boundary conditions with a perforation of 15 m or shorter. The effect of perforation length on the hydrogen production is less distinct, ranging from a CG/WG ratio between 0.42 (35 m) and 0.52 (15 m). Shortening it relative to the base case increases the CG requirement only slightly, to transport the WG faster through the shorter well bore. In general, and respecting the modelled scenario, this study suggests that a longer perforation helps to reduce the CG requirements.
The size (diameter) of the well exhibits a minimal effect on the CG requirement for the production process. For the presented scenarios, the CG/WG ratio for production ranged between 0.45 (2.925″) and 0.42 (8.375″). However, smaller well sizes increase the demand for CG during the hydrogen injection process, because injection through smaller wells generates a higher BHP. It is identified that the greater the well diameter, the lower the CG/WG ratio required for the hydrogen injection. All hydrogen WG can be injected with a CG/WG ratio of 1.20 and a well diameter of 8.375″; a well diameter of 2.925″ requires a CG/WG ratio of 1.36.
If the WG volume is increased, the simulations show that a higher CG/WG ratio is required. Hence, the storage operation becomes less efficient when upscaled. The more efficient production process is not affected by higher WG volumes, and producing more WG requires only slightly more CG. Increasing the WG by 0.05 TWh (approximately 1250 tons), with respect to the 1.625 TWh base case, increases the required CG/WG ratio for the injection to 1.53 (from 1.00) and for the production to 0.46 (from 0.41). If the WG target is increased by 0.1 TWh, the entire WG cannot be injected within the model boundary conditions. A reduction of the WG volume reduces the required CG/WG ratio to 0.41 (production) and 1.00 (injection), hence, making the process more efficient. Once again, the impact on the production is low compared to the impact on the injection process.
If the rest time is increased, the CG requirement for the injection process is reduced and vice versa. The system is overpressured after the CG injection, and, as such, the more time the pressure has to equilibrate, the more efficiently the WG can be injected. This optimisation strategy has no impact on the production, because any benefit will be overridden by the WG injection process. It is, therefore, identified that the longer the rest time, the lower the CG/WG ratio required for the injection. All WG can be injected with a CG/WG ratio of 1.17 if 2 months is added to the rest time; a reduction of the rest time by one month increases the requires a CG/WG ratio of 1.46. No full injection is possible within the model boundary conditions with a reduction of the rest time by 2 months.
The increase and decrease in the injection and production duration has the greatest effect of all the tested optimisation procedures. A reduction of the WG injection time by one week and, hence, a higher injection rate, does not allow the injection of the targeted WG. An increase in the injection duration by 4 weeks reduces the CG/WG requirement down to 0.54. The same effect, to a smaller degree, is also apparent for the production process. If the production time is reduced by 2 weeks, and the allowed production rate is increased accordingly, the required CG/WG ratio increases to 0.55. However, when the production time is increased by 4 weeks, the required CG/WG ratio decreases to 0.29.
CG is traditionally regarded as an expensive investment in gas storage, and a reduction of the CG requirement will reduce the costs of the storage operation. Successful optimisation strategies may even increase the incentive for more natural gas storage projects and the implementation of large-scale hydrogen storage. However, CG is also an asset, as it can be, at least down to a certain extent, recovered using standard production techniques. The production rate would be lower than the rate of production of the WG and would decline with time, as would the production pressure. How much of the CG can be recovered during a specific period of time, and can be defined as “recoverable CG”, is site specific, but it would act as a one-time emergency supply during times of energy shortage (Figure 4). Because the state has the right to access these emergency supplies, the “recoverable CG” should be subsidised by the government, combining economic gas storage with national emergency gas reserves. This approach to gas storage could have three important outcomes:
  • Firstly, gas dependent countries would have a national strategic gas reserve. Strategic reserves are known from oil; they act as emergency resources if, for political or other reasons, oil supply is hindered. National, or international, strategic gas reserves will most likely be discussed in Europe soon, as Russia as the main supplier has started reducing gas supply as a political measure.
  • Secondly, the implementation of natural gas storage projects would become cheaper, and, hence, more gas storage projects will be installed, increasing energy security and reducing gas cost spikes, as recently seen.
  • Thirdly, the incentive to invest into hydrogen storage would also increase. As hydrogen is a valuable commodity, the usage of vast amounts of hydrogen as essential, but ordinarily unused (i.e., not produced to the surface) CG, is an obstacle for the implementation of large-scale hydrogen storage. If classified as “recoverable CG” and paid for by national governments, hydrogen storage would become cheaper for a site operator, and the decarbonisation of energy supply could make a big step forward.

4. Summary and Conclusions

This study provides insights into the planning of seasonal hydrogen storage operations. The results show that for one-well hydrogen injection and storage in a homogenous open aquifer, the perforation length, the well size and the working gas volume have only minor impact on the CG/WG ratio for a pre-defined working gas production operation. A lower production rate, accompanied with a shorter rest time between the WG injection and production operation, reduces the CG/WG ratio. In general, the production process is mainly constrained by a developing low-pressure region around the production well, where the brine does not occupy the space of the produced gas, and productivity is lost. No tested technical alteration changes that. The impact on the injection is generally greater, and strategies that reduce pressure accumulations during injection, such as a longer perforation, less WG and more time for the pressure to equilibrate, reduce the CG/WG ratio.
It is important to look at the results by taking the simulation parameters into account. The work shows how important pressure equilibration is, and the simulated scenario allows a high degree of homogenous pressure equilibration. Other parameters, such as the reservoir geology, depth (pressure/temperature), the trap architecture, etc., also have an important impact, and the interplay of these aspects, as well as the investigation of real-world examples, will be analysed in the future. This reported analysis looks at injection and production separately, but they are, of course, part of the same operation. As an example, the low-pressure zone that develops during production directly benefits the subsequent injection process, and since the modelled scenarios indicate that the injection process is not only less efficient (and hence requires a higher CG/WG ratio) but also more affected by the presented optimisation strategies, it is the injection process that has to be optimised. Water invasion from the aquifer raises the pressure during injection, increasing the required energy and, hence, the cost and time of the operation.
The CG is essential for the storage operation but, at the same time, is a costly one-time investment. The current energy and gas crises show that countries should have more gas storage capacity in order to increase energy independence, but gas storage is run as a business and does not often take national security into account [32]. As parts of the CG can be produced, governments should invest and take ownership of the CG in gas storage operations. This could de-risk gas storage for investors and encourage involvement and engagement, increase national energy security and could help to kick start the hydrogen economy by reducing hydrogen storage implementation costs.

Author Contributions

Conceptualization, N.H.; methodology, N.H.; software, N.H.; validation, N.H., K.A. and A.H.; investigation, N.H., K.E. and M.W.; data curation, N.H., A.H. and E.M.T.; writing—original draft preparation, N.H.; writing—review and editing, all; visualization, N.H. and A.H.; supervision, N.H. and R.S.H.; project administration, R.S.H.; funding acquisition, N.H. and K.E. All authors have read and agreed to the published version of the manuscript.

Funding

T.E.M.T., A.H., S.H. and M.W. are funded by the Engineering and Physical Sciences Research Council (EPSRC) funded research project “HyStorPor” (grant number EP/S027815/1). Heinemann and Edlmann are supported by funding from the Engineering and Physical Sciences Research Council (EPSRC) [Grant Number EP/S027815/1] (HyStorPor Project) and by funding from the Fuel Cells and Hydrogen 2 Joint Undertaking (now Clean Hydrogen Partnership) under grant agreement No 101006632. This Joint Undertaking receives support from the European Union’s Horizon 2020 research and innovation program, Hydrogen Europe and Hydrogen Europe Research.

Acknowledgments

The authors would like to thank Computer Modelling Group (CMG) for the license for the used reservoir engineering software suit. We would also like to thank Schlumberger for the Petrel license.

Conflicts of Interest

The authors declare no conflict of interest.

References

  1. Miocic, J.M.; Heinemann, N.; Edlmann, K.; Scafidi, J.; Molaei, F.; Alcalde, J. Underground hydrogen storage: A review. In Miocic, Heinemann, Edlmann, Alcalde, Schultz: Enabling Secure Subsurface Storage in Future Energy Systems; Geological Society of London Special Publication: London, UK, 2022; p. 528. [Google Scholar] [CrossRef]
  2. Tarkowski, R.; Uliasz-Misiak, B. Towards underground hydrogen storage: A review of barriers. Renew. Sustain. Energy Rev. 2022, 162, 112451. [Google Scholar] [CrossRef]
  3. Engeland, K.; Borga, M.; Creutin, J.D.; Francois, B.; Ramos, M.H.; Vidal, J.P. Space-time variability of climate variables and intermittent renewable electricity production—A review. Renew. Sustain. Energy Rev. 2017, 79, 600–617. [Google Scholar] [CrossRef]
  4. Sun, X.; Alcalde, J.; Bakhtbidar, M.; Elío, J.; Vilarrasa, V.; Canal, J.; Ballesteros, J.; Heinemann, N.; Haszeldine, S.; Cavanagh, A.; et al. Hubs and clusters approach to unlock the development of carbon capture and storage–Case study in Spain. Appl. Energy 2021, 300, 117418. [Google Scholar] [CrossRef]
  5. Cavanagh, A.; Wilkinson, M.; Haszeldine, S. Deliverable D2.1 Report: Methodologies for Cluster Development and Best Practices for Data Collection in the Promising Regions. Part 2: Bridging the Gap Storage Resource Assessment Methodologies. 2020. Available online: https://www.strategyccus.eu/sites/default/files/STRATCCUSWP21-PART2-SRAM-v1.pdf (accessed on 2 December 2022).
  6. Hassanpouryouzband, A.; Joonaki, E.; Edlmann, K.; Haszeldine, R.S. Offshore Geological Storage of Hydrogen: Is This Our Best Option to Achieve Net-Zero? ACS Energy Lett. 2021, 6, 2181–2186. [Google Scholar] [CrossRef]
  7. Mouli-Castillo, J.; Heinemann, N.; Edlmann, K. Mapping geological hydrogen storage capacity and regional heating demands: An applied UK case study. Appl. Energy 2021, 283, 116348. [Google Scholar] [CrossRef]
  8. Kanaani, M.; Sedaee, B.; Asadian-Pakfar, M. Role of Cushion Gas on Underground Hydrogen Storage in Depleted Oil Reservoirs. J. Energy Storage 2022, 45, 103783. [Google Scholar] [CrossRef]
  9. Wang, G.; Pickup, G.; Sorbie, K.; Mackay, E. Scaling analysis of hydrogen flow with carbon dioxide cushion gas in subsurface heterogeneous porous media. Int. J. Hydrog. Energy 2022, 47, 1752–1764. [Google Scholar] [CrossRef]
  10. Scafidi, J.; Schirrer, L.; Vervoort, I.; Heinemann, N. An open-source tool for the calculation of field deliverability and cushion gas requirements in volumetric gas reservoir storage sites. Geol. Soc. Lond. Spec. Publ. 2022, 528, SP528-2022. [Google Scholar] [CrossRef]
  11. Heinemann, N.; Scafidi, J.; Pickup, G.; Thaysen, E.M.; Hassanpouryouzband, A.; Wilkinson, M.; Satterley, A.K.; Booth, M.G.; Edlmann, K.; Haszeldine, R.S. Hydrogen storage in saline aquifers: The role of cushion gas for injection and production. Int. J. Hydrog. Energy 2021, 46, 39284–39296. [Google Scholar] [CrossRef]
  12. Matos, C.R.; Carneiro, J.F.; Silva, P.P. Overview of Large-Scale Underground Energy Storage Technologies for Integration of Renewable Energies and Criteria for Reservoir Identification. J. Energy Storage 2019, 21, 241–258. [Google Scholar] [CrossRef]
  13. Wallace, R.L.; Cai, Z.; Zhang, H.; Zhang, K.; Guo, C. Utility-scale subsurface hydrogen storage: UK perspectives and technology. Int. J. Hydrog. Energy 2021, 46, 25137–25259. [Google Scholar] [CrossRef]
  14. Alcalde, J.; Flude, S.; Wilkinson, M.; Johnson, G.; Edlmann, K.; Bond, C.E.; Scott, V.; Gilfillan, S.M.V.; Ogaya, X.; Haszeldine, R.S. Estimating geological CO2 storage security to deliver on climate mitigation. Nat. Commun. 2019, 9, 2201. [Google Scholar] [CrossRef] [PubMed]
  15. Williams, J.D.O.; Jin, M.; Bentham, M.; Pickup, G.E.; Hannis, S.D.; Mackay, E.J. Modelling carbon dioxide storage within closed structures in the UK Bunter Sandstone Formation. Int. J. Greenh. Gas Control. 2013, 18, 38–50. [Google Scholar] [CrossRef] [Green Version]
  16. Thaysen, E.M.; McMahon, S.; Strobel, G.J.; Butler, I.B.; Ngwenya, B.T.; Heinemann, N.; Wilkinson, M.; Hassanpouryouzband, A.; McDermott, C.; Edlmann, K. Estimating Microbial Growth and Hydrogen Consumption in Hydrogen Storage in Porous Media. Renew. Sustain. Energy Rev. 2021, 151, 111481. [Google Scholar] [CrossRef]
  17. Gregory, S.P.; Barnett, M.J.; Field, L.P.; Milodowski, A.E. Subsurface microbial hydrogen cycling: Natural occurrence and implications for industry. Microorganisms 2019, 7, 53. [Google Scholar] [CrossRef] [Green Version]
  18. CMG. ‘GEM’. 2021. Available online: https://www.cmgl.ca/gem (accessed on 2 December 2022).
  19. Bentham, M. An assessment of carbon sequestration potential in the UK—Southern North Sea case study. Tyndall Cent. Clim. Change Res. Work. Pap. 2006, 85. [Google Scholar]
  20. Gammer, D.; Green, A.; Holloway, S.; Smith, G. The Energy Technologies Institute’s UK CO2 Storage Appraisal Project (UKSAP). In SPE 148426, Proceedings of the SPE Offshore Europe Oil and Gas Conference and Exhibition, Aberdeen, UK, 6–8 September 2011. [Google Scholar]
  21. Gluyas, J.G.; Hichens, H.M. The United Kingdom Oil and Gas Fields Commemorative Millennium Volume; Gluyas, J.G., Hichens, H.M., Eds.; Memoirs of the Geological Society of London: London, UK, 2003. [Google Scholar]
  22. Yekta, A.E.; Manceau, J.-C.; Gaboreau, S.; Pichavant, M.; Audigane, P. Determination of Hydrogen–Water Relative Permeability and Capillary Pressure in Sandstone: Application to Underground Hydrogen Injection in Sedimentary Formations. Transp. Porous Media 2018, 122, 333–356. [Google Scholar] [CrossRef]
  23. Fetkovitch, M.J. A simplified approach to water influx calculations—Finite aquifer systems. J. Pet. Technol. 1971, 23, 814–828. [Google Scholar] [CrossRef]
  24. Carden, P.O.; Paterson, L. Physical, chemical and energy aspects of underground hydrogen storage. Int. J. Hydrog. Energy 1979, 4, 559–569. [Google Scholar] [CrossRef]
  25. Amid, A.; Mignard, D.; Wilkinson, M. Seasonal storage of hydrogen in a depleted natural gas reservoir. Int. J. Hydrog. Storage 2016, 41, 5549–5558. [Google Scholar] [CrossRef]
  26. Jossi, J.A.; Stiel, L.I.; Thodos, G. The viscosity of pure substances in the dense gaseous and liquid phases. Am. Inst. Chem. Eng. J. 1962, 8, 59–63. [Google Scholar] [CrossRef]
  27. Stiel, L.I.; Thodos, G. The viscosity of nonpolar gases at normal pressures. Am. Inst. Chem. Eng. J. 1961, 7, 611–615. [Google Scholar] [CrossRef]
  28. Peaceman, D.W. Interpretation of well-block pressures in numerical reservoir simulation with nonsquare grid blocks and anisotropic permeability. SPE J. 1983, 23, 531–543. [Google Scholar] [CrossRef]
  29. Peaceman, D.W. Interpretation of well-block pressures in numerical reservoir simulation: Part 3: Off-center and multiple wells within a well-block. In SPE 16976, Proceedings of the SPE Annual Technical Conference and Exhibition, Dallas, TX, USA, 27–30 September 1987. [Google Scholar]
  30. Aziz, K.; Govier, G.W. Pressure drop in wells producing oil and gas. J. Can. Pet. Technol. 1972, 11, 3. [Google Scholar] [CrossRef]
  31. Dodds, P.E.; Demoullin, S. Conversion of the UK gas system to transport hydrogen. Int. J. Hydrog. Energy 2013, 38, 18. [Google Scholar] [CrossRef] [Green Version]
  32. Miocic, J.M.; Alcalde, J.; Heinemann, N.; Marzan, I.; Hangx, S. Toward Energy-Independence and Net-Zero: The Inevitability of Subsurface Storage in Europe. ACS Energy Lett. 2022, 7, 2486–2489. [Google Scholar] [CrossRef]
Figure 1. Base case results taken from [11]. The dashed black line represents the hydrogen (in TWh) that can be injected, depending on the CG in place. The red line represents the hydrogen (in TWh) that can be produced, again, depending on the CG. The scenario target total injection and production is 1.625 TWh, which can be injected and produced with a CG/WG ratio of at least 1.27. Diamonds represent individual simulation runs. See [11] for more information.
Hydrogen 03 00035 g001
Figure 2. The WG inj/prod duration sensitivity test. The figure shows the CG injection duration (red), the WG injection (blue) and production (green) duration of the base case and the sensitivity tests on a timeline. The rest times are shown as black dashed lines. Additionally, the adjusted target injection and production rates are provided.
Hydrogen 03 00035 g002
Figure 3. The figure shows the results of the sensitivity tests. The impact of five technical optimisation strategies was tested: (A) perforation length, (B) well size, (C) working gas volume, (D) rest time and (E) injection and production duration. The black circles show the “best case” injection performance, and the red circles show the “best case” production performance.
Hydrogen 03 00035 g003aHydrogen 03 00035 g003b
Figure 4. Simplified sketch to illustrate the redefinition of “recoverable CG”, the part of the CG that could be accessed by governments as emergency supplied. The WG production rate is controlled by the operator of the storage site. The production rate and pressure of the “recoverable CG” will decrease with time due to the depletion of the reservoir.
Hydrogen 03 00035 g004
Table 1. Reservoir data and conditions (taken from [15]).
Reservoir thickness100 m
Water depth100 m
Horizontal permeability200 mD
Vertical permeability50 mD
Porosity20%
Brine salinity3.13 gmol NaCl/L
Hydrostatic gradient10.07 MPa/km
Lithostatic gradient22.7 MPa/km
Fracture pressure18 MPa/km
Temperature gradient3.65 °C/km
Surface temperature4 °C
Table 2. Well parameters and schedule information for the base case and the sensitivity tests.
Technical ParameterBase CaseAdditional Scenario Ranges
Perforation length25 m15–35 m
Well diameter4.52.925–8.375
Working gas target1.625 TWh1.525–1.725 TWh
Rest time5+ months3+–7+ months
Working gas inj/prod duration91 days77–119 days
Table 3. Results of the analysis.
ScenarioOptimal InjectionOptimal ProductionBest Case
(CG/WG)(CG/WG)(CG/WG)
Base case1.270.441.27
Perforation length
15 mfailed0.52failed
20 m1.520.471.52
30 m1.180.431.18
35 m1.120.421.12
Well size
2.925″1.360.451.36
3.5″1.320.451.32
6″1.240.441.24
8.375″1.200.421.20
Working gas volume
1.525 TWh1.000.411.00
1.575 TWh1.140.431.14
1.675 TWh1.530.461.53
1.725 TWhfailed0.47failed
Rest time
2 months shorterfailed0.46failed
1 month shorter1.460.461.46
1 month longer1.210.441.21
2 months longer1.170.421.17
Working gas injection/production duration
77 daysfailed0.55failed
84 daysfailed0.50failed
105 days0.860.370.86
119 days0.540.290.54
Publisher’s Note: MDPI stays neutral with regard to jurisdictional claims in published maps and institutional affiliations.

