Article

Leaf Trait Variability and CSR Strategy Shifts in Mediterranean Woody Species along an Edaphic Gradient

by
Khalil Kadaoui
1,*,
Jalal Kassout
2,
Vladimiro Andrea Boselli
3,
Soufian Chakkour
1,
Abdelouahab Sahli
1,
Mhammad Houssni
1,
Hassan Bouziane
1 and
Mohammed Ater
1,*
1
Bio-Agrodiversity Team, Biology, Ecology, and Health Laboratory, Sciences Faculty, Abdelmalek Essaâdi University, BP 2062, P.O. Box 2121, Tétouan 93030, Morocco
2
Regional Agricultural Research Center of Marrakech, National Institute of Agricultural Research, Avenue Ennasr, P.O. Box 415, Rabat 10090, Morocco
3
Istituto per il Rilevamento Elettromagnetico dell’Ambiente del Consiglio Nazionale delle Ricerche, CNR-IREA Via A Corti, 12-20133 Milano, Italy
*
Authors to whom correspondence should be addressed.
Ecologies 2024, 5(3), 455-469; https://doi.org/10.3390/ecologies5030028
Submission received: 31 July 2024 / Revised: 28 August 2024 / Accepted: 29 August 2024 / Published: 31 August 2024

Abstract

:
Plant species in Mediterranean ecosystems are expected to exhibit diverse responses to environmental stresses such as climate aridity and challenging soil conditions by adopting various functional strategies. However, intraspecific variability at the local scale has received insufficient attention in the study of CSR strategies. This study aims to evaluate intraspecific variability in leaf traits and CSR strategies of seven woody species growing on ultramafic and non-ultramafic soils in the Beni Bousera region of Northern Morocco. We first conducted a physicochemical analysis to assess differences in soil composition between the two sites. Subsequently, we measured leaf fresh weight, leaf dry weight, and leaf area and calculated CSR strategies for 10 individuals per species. The results revealed significant differences between the two soil types, primarily driven by a moderate serpentine effect characterized by a Ca:Mg ratio <1 in the ultramafic site, along with distinct soil texture. In response to these challenging conditions, we observed substantial intraspecific variability in leaf traits, accompanied by shifts in CSR strategies for certain species. At the ultramafic site, Quercus coccifera adopted an S strategy, while Cistus salviifolius exhibited an S/SC strategy. Lavandula stoechas and Teucrium fruticans displayed notable interindividual variability, whereas Cistus atriplicifolius, Phillyrea latifolia, and Erica arborea maintained consistent strategies across both sites. Our research contributes to the enrichment of CSR databases and highlights the applicability of the CSR strategy framework at the local, intraspecific level, offering a valuable foundation for future ecological studies and plant conservation efforts. Moreover, investigating intraspecific variability in leaf traits and CSR strategies enhances our understanding of plant adaptation mechanisms in extreme environments such as Mediterranean serpentine soils.

1. Introduction

Different ecosystems in the Mediterranean region can exert a filtering effect on plant species. Ultramafic outcrops, commonly known as serpentine soils, stand out for their significant role in conserving over half of the world’s biodiversity hotspots [1,2]. These soils increase microenvironmental heterogeneity across landscapes and enhance species richness [3,4,5].
Ultramafic outcrops, which cover approximately 1% of the Earth’s surface, are found globally and are often considered ecological islands due to their distinctiveness [6,7,8,9]. They are chemically extreme substrates due to their high concentrations of heavy metals (e.g., Ni, Co, and Cr), high pH values, low nutrient availability (N, P, and K), low Ca/Mg ratio, and heat stress [10,11,12,13]. Collectively, these unique geochemical properties are known as the ‘serpentine effect’ [11,14]. Nevertheless, certain plant species, often endemic or strict serpentinophytes, have developed physiological adaptations that allow them to thrive in serpentine environments [15,16,17]. Serpentine soils typically give rise to distinctive vegetation assemblages compared to neighboring communities [14,18,19,20]. For instance, serpentine ecosystems in the Western Mediterranean region are recognized for their extraordinary floral diversity [21,22] and serve as sanctuaries for Mediterranean plant species [23].
Plant functional traits are measurable features at the individual level that directly or indirectly influence overall plant fitness [24,25,26]. A prominent and widely adopted approach in plant ecology is the CSR strategy scheme proposed by Grime [27,28,29]. According to this theory, through the measurements of some functional traits, species can be classified into three major groups: Competitors (C), Stress-tolerants (S), and Ruderals (R), based on their ability to withstand stress and disturbances. Various secondary types emerge from these primary strategies representing the extremes, typically depicted using ternary graphs [30]. Grime [29] defines stress as conditions limiting plant biomass production and growth, including factors such as low light availability, water and nutrient deficiencies, and sub-optimal temperatures. Disturbances, on the other hand, involve factors causing partial or complete destruction of plant biomass, such as herbivory and anthropogenic activities.
Several methodologies have been proposed for evaluating the CSR strategy of species. For instance, Hodgson et al. [31] developed a methodology applied exclusively to herbaceous species, considering seven traits, most of which rely on categorical classes (e.g., flowering period, flowering start, lateral spread, and canopy height). In contrast, Pierce et al. [30] introduced an improved and simplified methodology with broader applicability, focusing on three quantitative traits: leaf fresh weight (LFW), leaf dry weight (LDW), and leaf area (LA). The success of this strategy scheme has been validated when applied to species across biomes worldwide [30,32]. Moreover, publications and databases containing C, S, and R values, along with CSR strategies of various species, are now available [30,33,34,35]. However, species growing in ultramafic soils remain poorly represented in trait databases [36]. There is an urgent international call for their trait measurements and publications on the TRY database [37]. In challenging habitats marked by soil toxicity, water scarcity, and nutrient deficiencies, the stress-tolerance (S) strategy is frequently observed in plants [38]. Nevertheless, studies have primarily focused on interspecific comparisons [39,40], and species are often characterized by their average trait values, with insufficient attention dedicated to intraspecific variability.
The significance and contribution of intraspecific variability (IV) in trait-based functional studies have been extensively discussed [41,42,43]. Recent studies have emphasized that IV should not be neglected [44,45,46,47,48]. Additionally, several case studies have presented evidence suggesting that species may exhibit variations in their CSR strategy in response to different climatic conditions, as demonstrated by May et al. [49] (Arabidopsis thaliana L. Heynh) and Giupponi. [50] (Campanula elatinoides Moretti), to diverse management regimes (Himantoglossum adriaticum H. Baumann from Baltieri et al. [51]), and according to differences in the ecological characteristics of their host environments (e.g., Bellevalia webbiana Parl. [52]. However, omitting the study of Lazzaro et al. [53] for Silene paradoxa L., information regarding IV in leaf traits and the CSR strategies of plant species occurring in serpentine and non-serpentine habitats is scarce.
Another point when evaluating IV in leaf traits and CSR strategies is that the vast majority of studies are conducted at a broader spatial scale. This approach optimizes the amount of IV observed by covering various environmental conditions [48]. Nevertheless, several studies have shown that even at local scales, plant traits can show substantial variation within plant communities [54,55,56,57].
Given the aforementioned gaps, our study aims to (1) enrich leaf trait databases by answering the urgent call for leaf trait measurements of species growing in ultramafic soils and determining their CSR strategies, (2) assess the intraspecific variability in leaf traits and CSR strategies of woody species growing on ultramafic and non-ultramafic soils, and (3) examine the potential applicability of the CSR scheme at the local intraspecific level. To achieve these objectives and address the insufficiently studied intraspecific trait variability and locality matter within Mediterranean ecosystems, we compared leaf traits and CSR strategies of seven woody species occurring in nearby ultramafic and non-ultramafic sites. Specifically, we hypothesize that, at a local scale, there is substantial intraspecific variability in leaf traits and CSR strategies of the studied species.

2. Materials and Methods

2.1. Study Area and Data Collection

This study was conducted in the Beni Bousera massif in northern Morocco, approximately 60 km southeast of Tetouan city (Figure 1). The climate is Mediterranean with a prevalent sub-humid bioclimate. Precipitation levels range from 500 mm to 900 mm, and average temperatures fluctuate between a minimum of 2.3 °C and a maximum of 30.6 °C [58]. Peridotites constitute the dominant lithological component of the Beni Bousera massif, although other ultramafic rocks such as harzburgite and dunite are generally common [20]. This massif stands as the most important peridotite outcrop on the southern shore of the Mediterranean basin [59] and is surrounded by a metamorphic aureole constituted by kinzignite, gneisses, and micaschists [60,61,62]. The surveyed area falls within the thermomediterranean and mesomediterranean vegetation belts [20]. At lower elevations alongside the coast, diverse formations of the climax series of Tetraclinis articulata are expanding. Besides that, the Tetraclinis articulata formations of Calicotomo intermediae-Tetraclinetum articulatae [63] are substituted by formations of Periploco laevigata-Tetraclinetum articulatae [64] under more arid climatic conditions. As altitude rises, patches of the climax vegetation of the Teucrium afrae-Quercetum suberis Cork oak series [63] are well recognized in sub-humid to humid climatic conditions. In between these two series, various formations of the Quercus coccifera series representing the Phyllireo latifoliae-Quercetum cocciferae association [65] cover the transition from thermomediterranean to mesomediterranean in an altitudinal range between 500 m and 900 m. Furthermore, studies have shown [14,19,20] that the woody plant communities on ultramafic soils of the Beni Bousera region host many rare and endemic species that are well-adapted to this substrate type together with other species that are tolerant of but not strict serpentinophytes.
This study was conducted between April and June 2022, with two sites chosen for comparison (Figure 1; Table 1). The first site was found on an ultramafic substrate (U) at an altitude of 881 m, characterized by a sub-humid bioclimate. It is considered a mesomediterranean Quercus coccifera-Cistus salviifolius arborescent matorral dominated by mesophilous species such as Rubus ulmifolius, Viburnum tinus, and Crataegus laciniata. The second site was found on a non-ultramafic substrate (NU) at 490 m with a semi-arid bioclimate. It is a thermomediterranean Quercus coccifera-Erica arborea low, dense matorral characterized by the presence of xerophilous and thermophilous species such as Tetraclinis articulata, Cistus monspeliensis, Cistus ladanifer, Calicotome infesta, Chamaerops humilis, and Ceratonia siliqua. The main characteristics of the two study sites are detailed in Table 1.
From each site, five soil samples were randomly collected from the superficial layer (0 to 20 cm depth), and various soil characteristics such as soil texture, variables related to soil fertility, and the serpentine effect were measured to assess physicochemical differences between the two soil types. Observations during the field survey led to the recognition of seven woody species common to both sites: Cistus atriplicifolius Lam., Cistus salviifolius L., Erica arborea L., Lavandula stoechas L., Phillyrea latifolia L., Quercus coccifera L., and Teucrium fruticans L. These are the species considered in this study and sampled for leaf trait measurements (see below). At each site, during the peak of plant growth, we randomly selected ten healthy adult individuals per species. Subsequently, thirty mature and healthy leaves per individual were randomly sampled from the sun-exposed side and transported to the laboratory on the same day in cool and hydrated plastic bags [48,67].

2.2. Soil Analyses

Soil moisture (SM%) was determined using the gravimetric method, which involves weighing a fresh soil sample (FW, g) and re-weighing it after oven-drying at 100 °C for 48 h (DW, g). SM% was calculated as (FW-DW) × 100. Soil texture was measured from 50 g of soil using the Bouyoucos densimeter method [68]. pH was determined in a 1:2.5 soil/water extract using a pH meter (Crison GLP 21, Hach Lange, Derio, Spain), and electrical conductivity (EC, µS/cm) was measured in a 1:5 soil/water extract using a conductivity meter (Crison model basic 30, Hach Lange, Derio, Spain). Soil samples were ground, and total organic carbon (C, mg/kg) and total nitrogen (N, mg/kg) were determined by dry combustion using an elemental analyzer (Eurovector EA3000; Eurovector SpA, Milan, Italy). Available phosphorus (P, mg/kg) was determined using the Olsen method [69]. Potassium (K, mg/kg), calcium (Ca, mg/kg), and magnesium (Mg, mg/kg) were extracted with 1 M NH4OAc at pH 7 and determined by atomic absorption spectrophotometry. Iron (Fe, mg/kg), zinc (Zn, mg/kg), and copper (Cu, mg/kg) were extracted with a solution containing 0.1 M triethanolamine (TEA), 0.01 M CaCl2, and 0.005 M diethylenetriaminepentaacetic acid (DTPA), and determined by atomic absorption spectrophotometry [70].

2.3. Leaf Trait Measurements and CSR Strategy Evaluation

We adhered to the criteria specified by Perez-Harguindeguy et al. [71] for leaf trait measurements. Specifically, we measured: (a) Leaf Fresh Weight (LFW, g); (b) Leaf Area (LA, cm2) determined by digital analysis of the fresh leaves’ scanned images, using ImageJ V.1.53 software [72]; and (c) Leaf Dry Weight (LDW, g), obtained after 48 h of drying at 70 °C. Leaf weight measurements were conducted using an analytical balance to the nearest 0.0001 g. Each leaf trait had 30 replicate leaves per individual, 10 individuals per species, and 7 species per site. Additionally, the average values of the leaf traits for each individual were used to calculate the relative contribution (%) of CSR variables to the tertiary CSR strategy directly using the StrateFy spreadsheet, following the approach described by Grime [28] and Pierce et al. [30].

2.4. Data Analyses

Descriptive statistics, Student’s t-tests, and principal components analysis (PCA) were performed on the soil data to assess differences in physicochemical characteristics between ultramafic (U) and non-ultramafic (NU) soils. Mean values for each leaf trait (LFW, LDW, and LA), as well as for C, S, and R parameters, were calculated for each species and each individual of both sites. To explore the effect of species, site, and their interaction on the studied leaf traits, we conducted a linear mixed effects model with individuals as a random effect. To evaluate intraspecific variability in leaf traits and C, S, and R parameters, analyses of variance were employed. The C, S, and R components (%) resulted in a total of 30 triplets of values for each species, which were then represented through ternary CSR diagram plots. Before conducting multivariate analyses, we checked the frequency distributions for normality and variance heterogeneity, and when necessary, variables were standardized by logarithmic transformations. All analyses were conducted using the R software V.4.3.3 [73] and PAST V.4.03 [74,75].

3. Results

3.1. Soil Properties

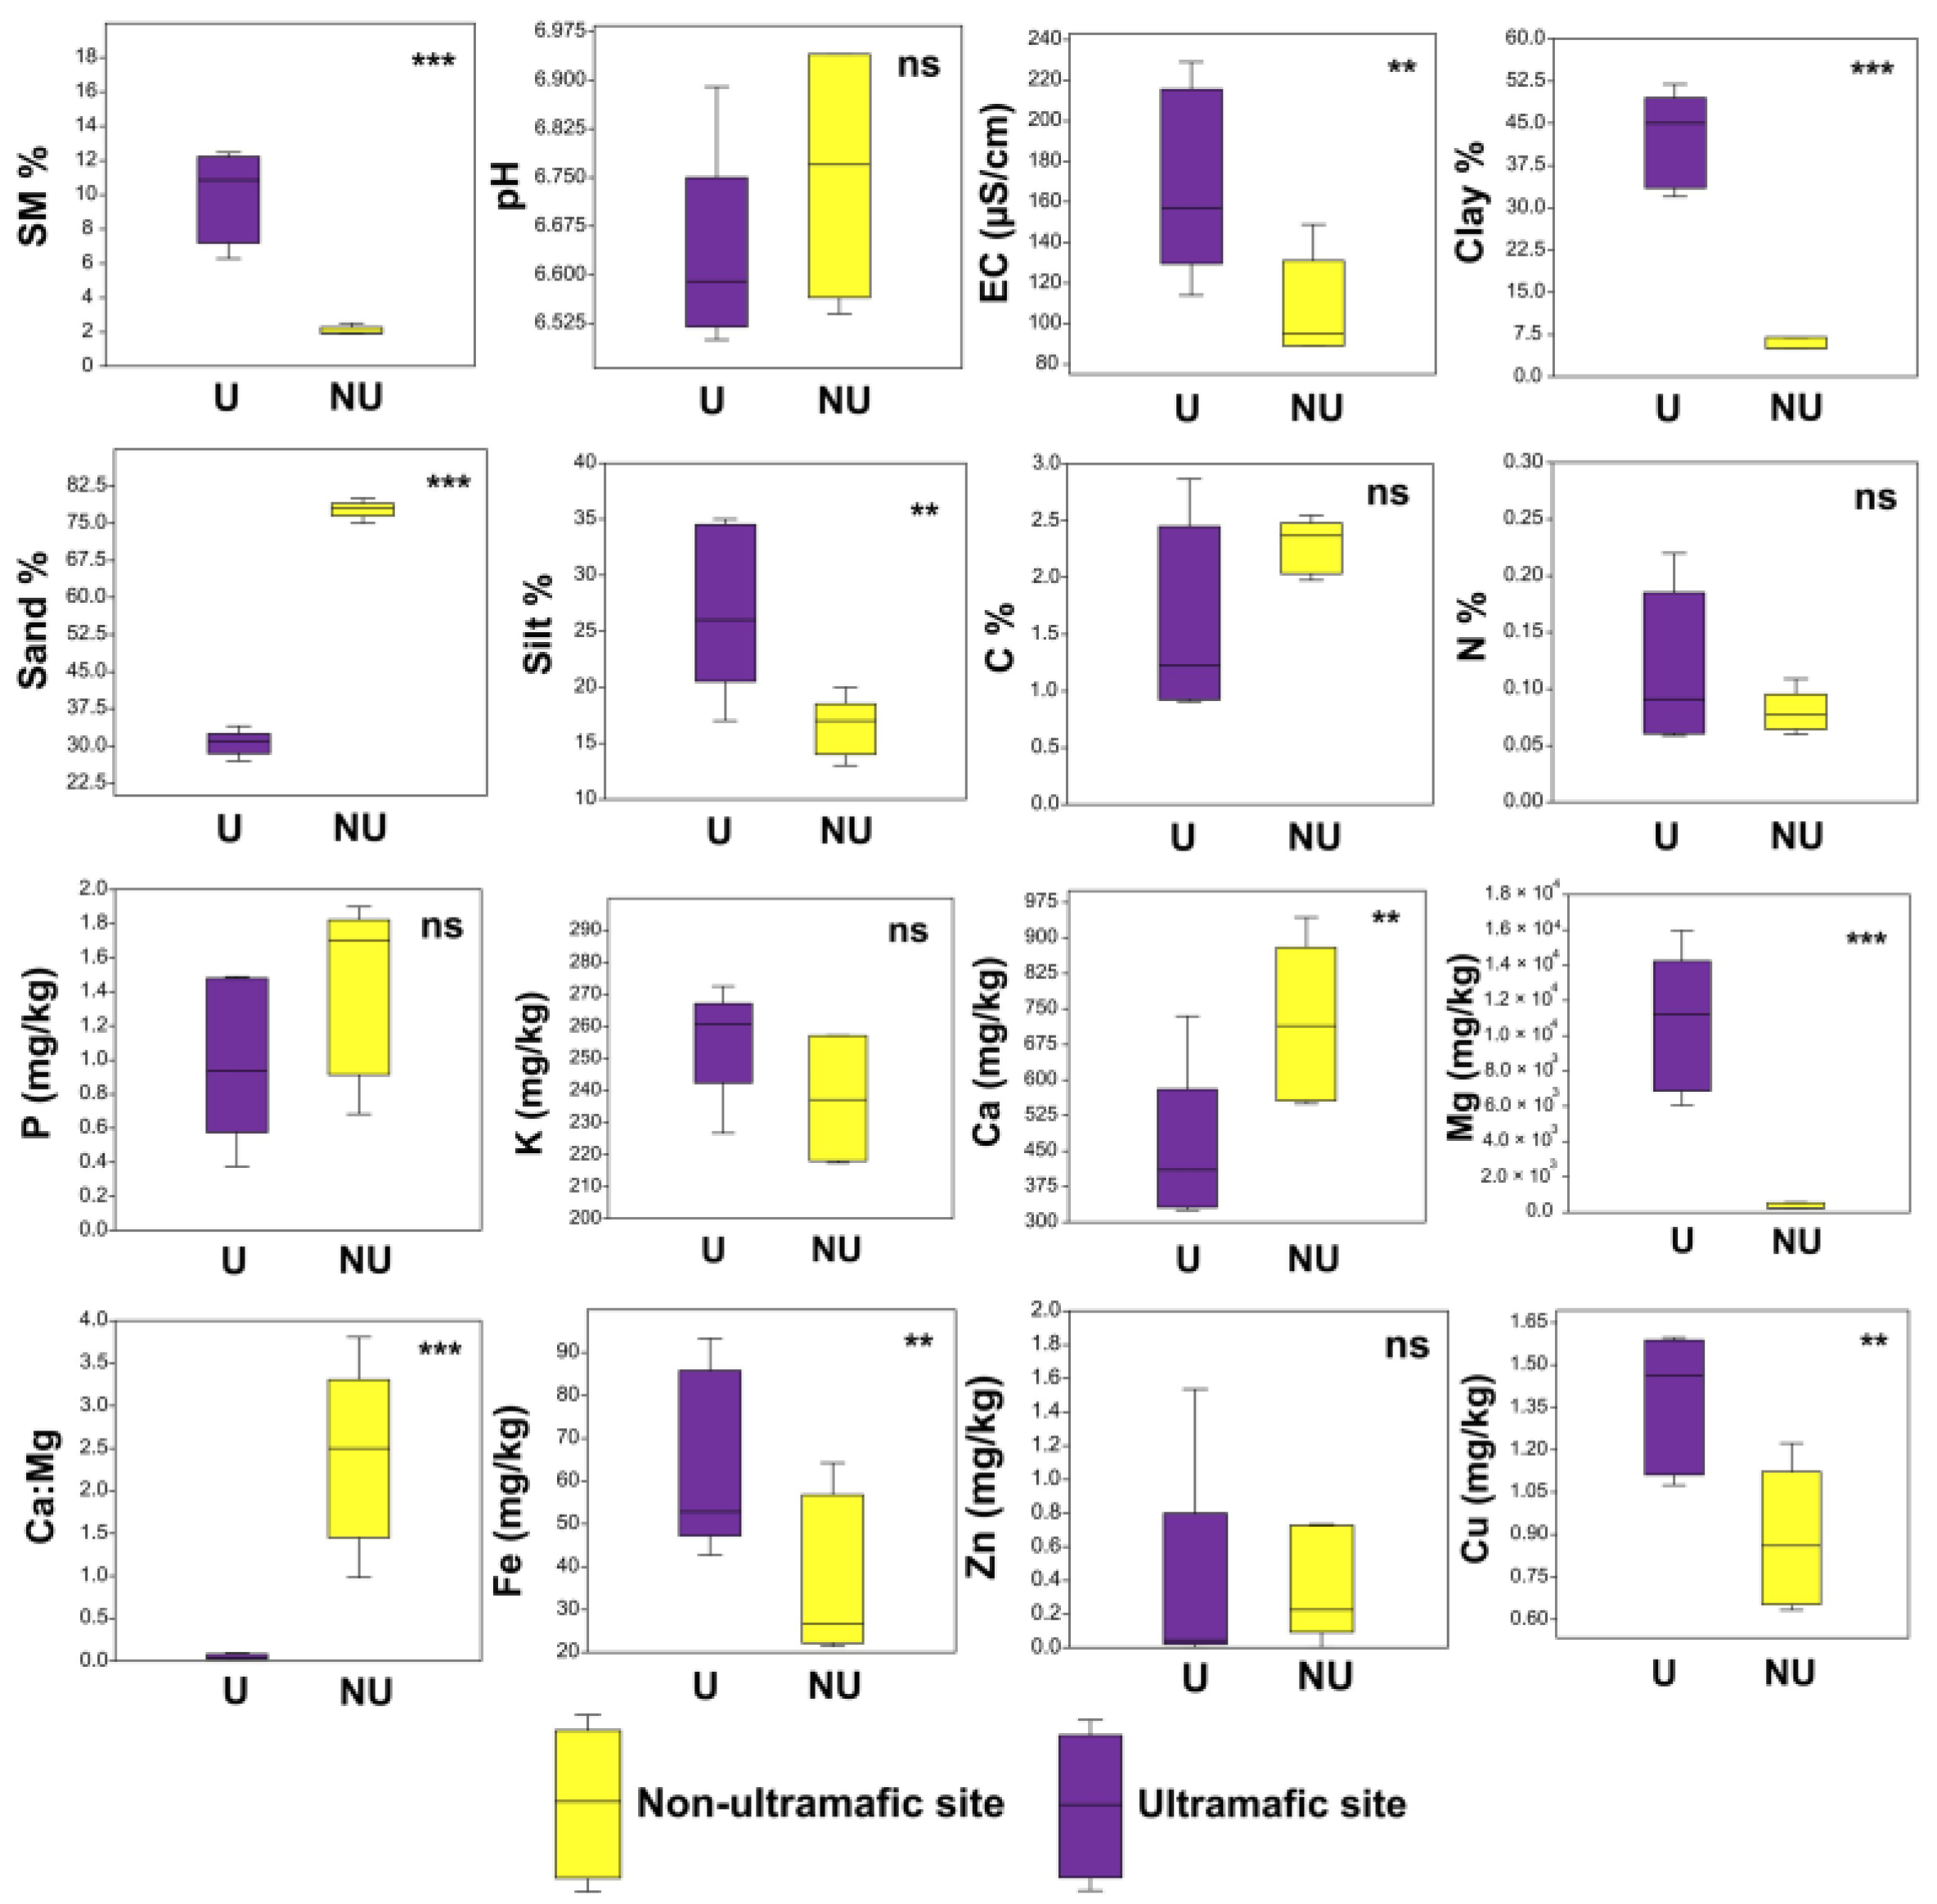
The soil analysis results (Figure 2) showed significant differences in physicochemical properties, texture, and indicators of the serpentine effect (such as Ca, Mg, Ca/Mg ratio, and heavy metals) between ultramafic (U) and non-ultramafic (NU) soils. In particular, values of SM and EC in soils sampled from the U site were higher than those observed at the NU site, while pH values were relatively similar. The NU site was characterized by poorly structured sandy soil, whereas the U site was found to have well-structured sandy clay soil. Regarding soil fertility, the concentrations of carbon (C), nitrogen (N), phosphorus (P), and potassium (K) did not differ significantly between the two sites. A similar pattern was observed for the trace elements manganese (Mn) and zinc (Zn). However, iron (Fe) levels were slightly higher at the U site. For parameters reflecting the ‘serpentine effect,’ notable differences were observed in the concentrations of copper (Cu) and calcium (Ca), with a clear contrast in magnesium (Mg) concentrations and the Ca/Mg ratio. Soil from the U site exhibited significantly higher Cu and Mg concentrations and a Ca/Mg ratio of less than 1.
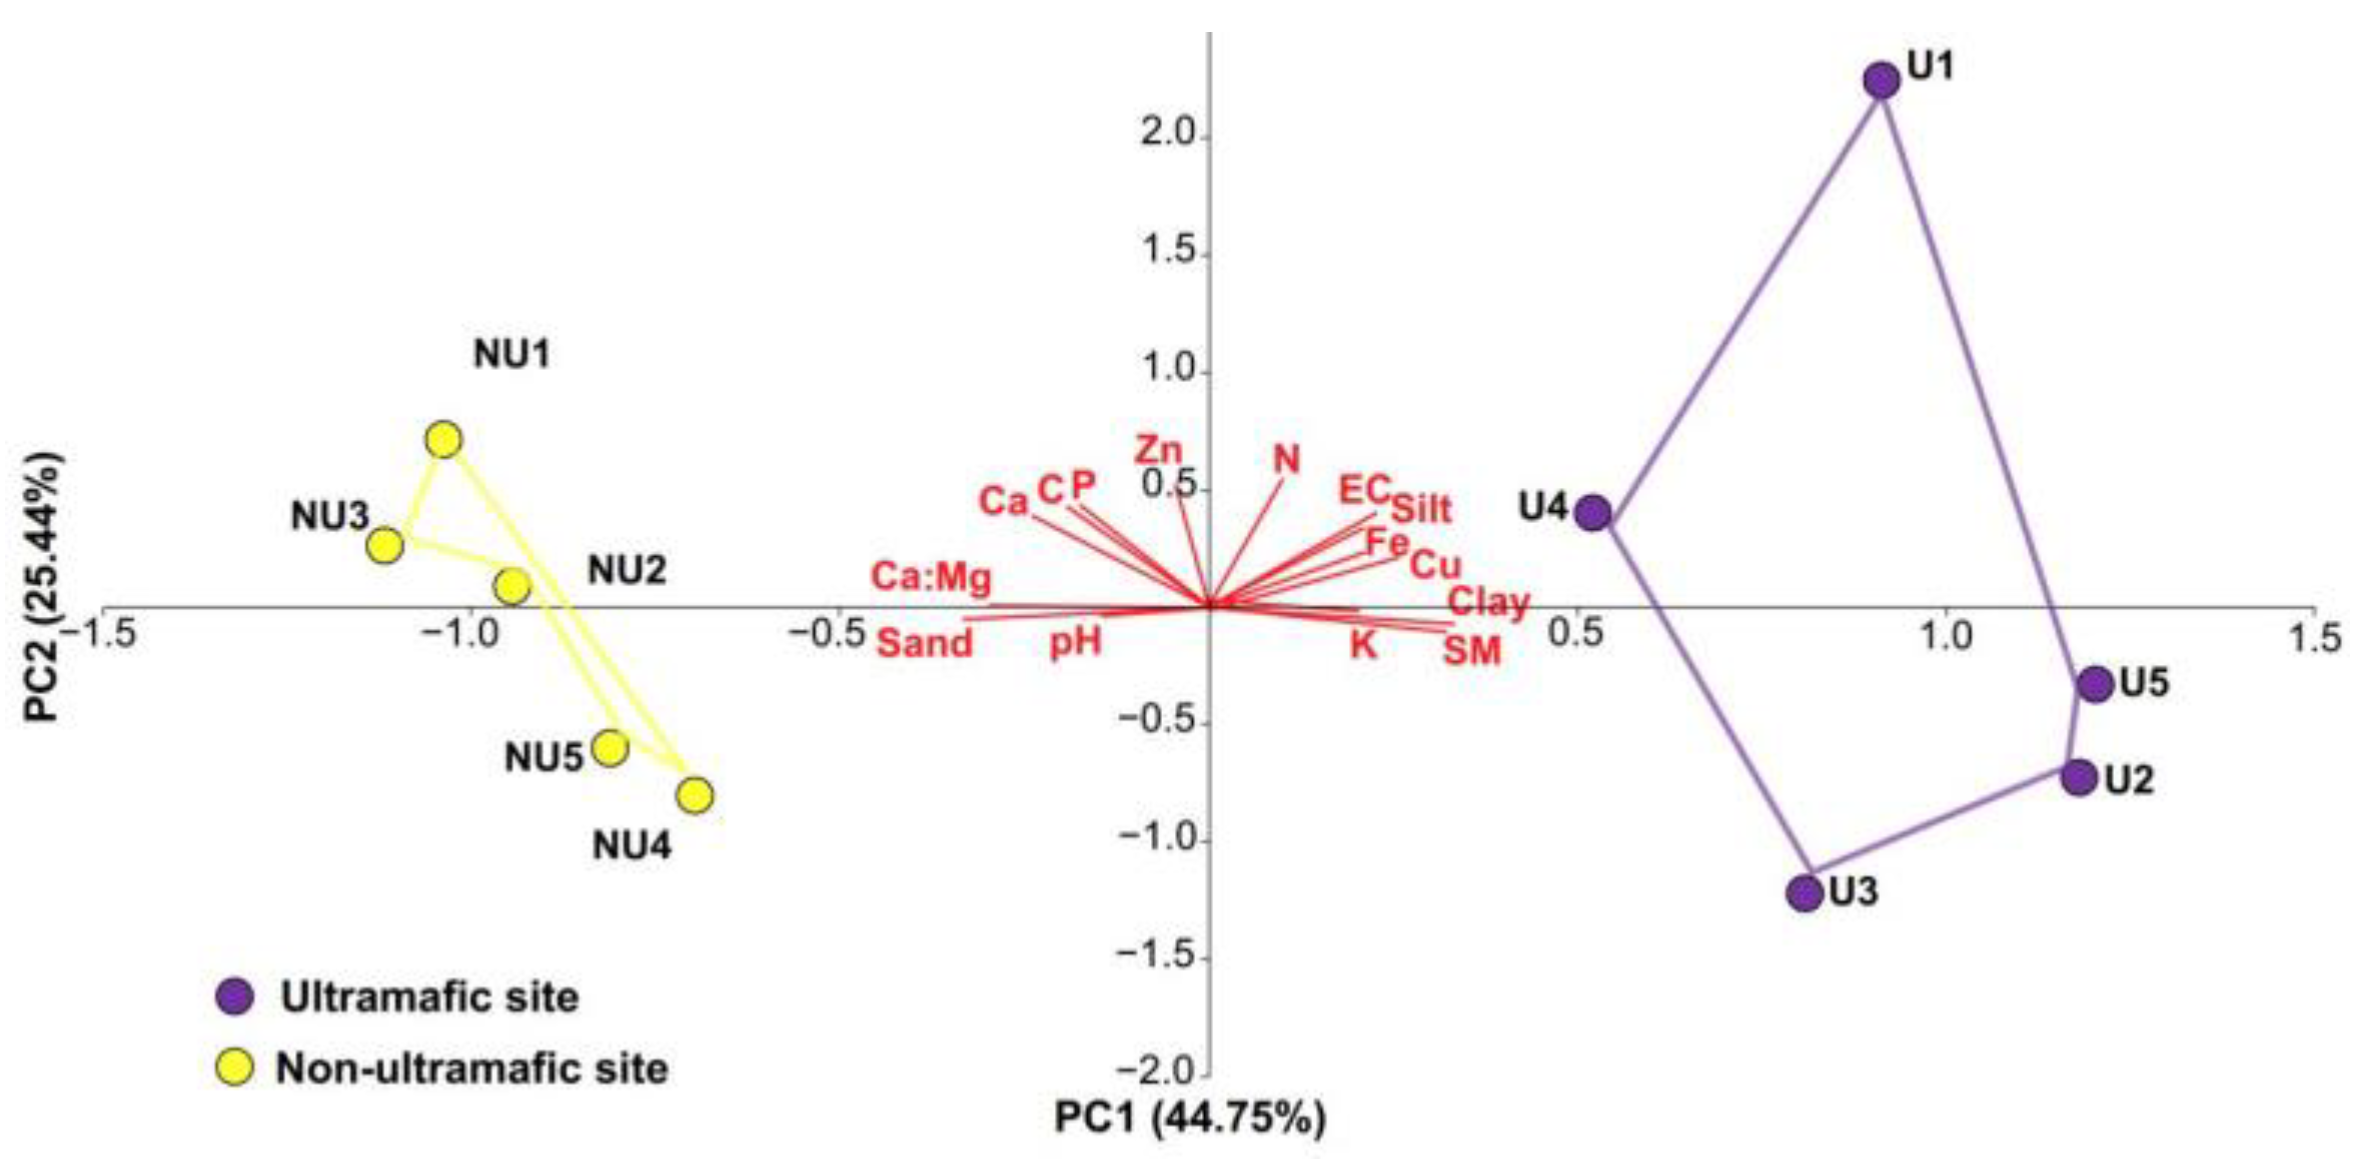
The PCA results (Figure 3) showed clear discrimination between the two soil types based on the projection of the first two axes, which together explained 70.19% of the variance. Mg was not included in the analyses due to its strong correlation with the Ca/Mg ratio. The two soil types are separated by PC1, which is primarily related to soil texture on the positive side and variables of the ‘serpentine effect’ (Ca, Mg, and Ca/Mg) on the negative side.

3.2. Intraspecific Variability in Leaf Traits

Linear mixed effects models revealed a significant effect of species on all studied traits (Table S1; Figure S1). F values ranged from 268.601 for LA to 277.692 for LFW. There was also a significant effect of site on LFW and LDW (Table S1; Figure S1). F values ranged from 34.871 for LFW to 66.791 for LDW. Moreover, the interactions species * site were significant for all traits (Table S1; Figure S1) with F values ranging from 5.240 for LA to 30.201 for LDW. These results indicate that the response of leaf traits is affected by both differences among species and sites.
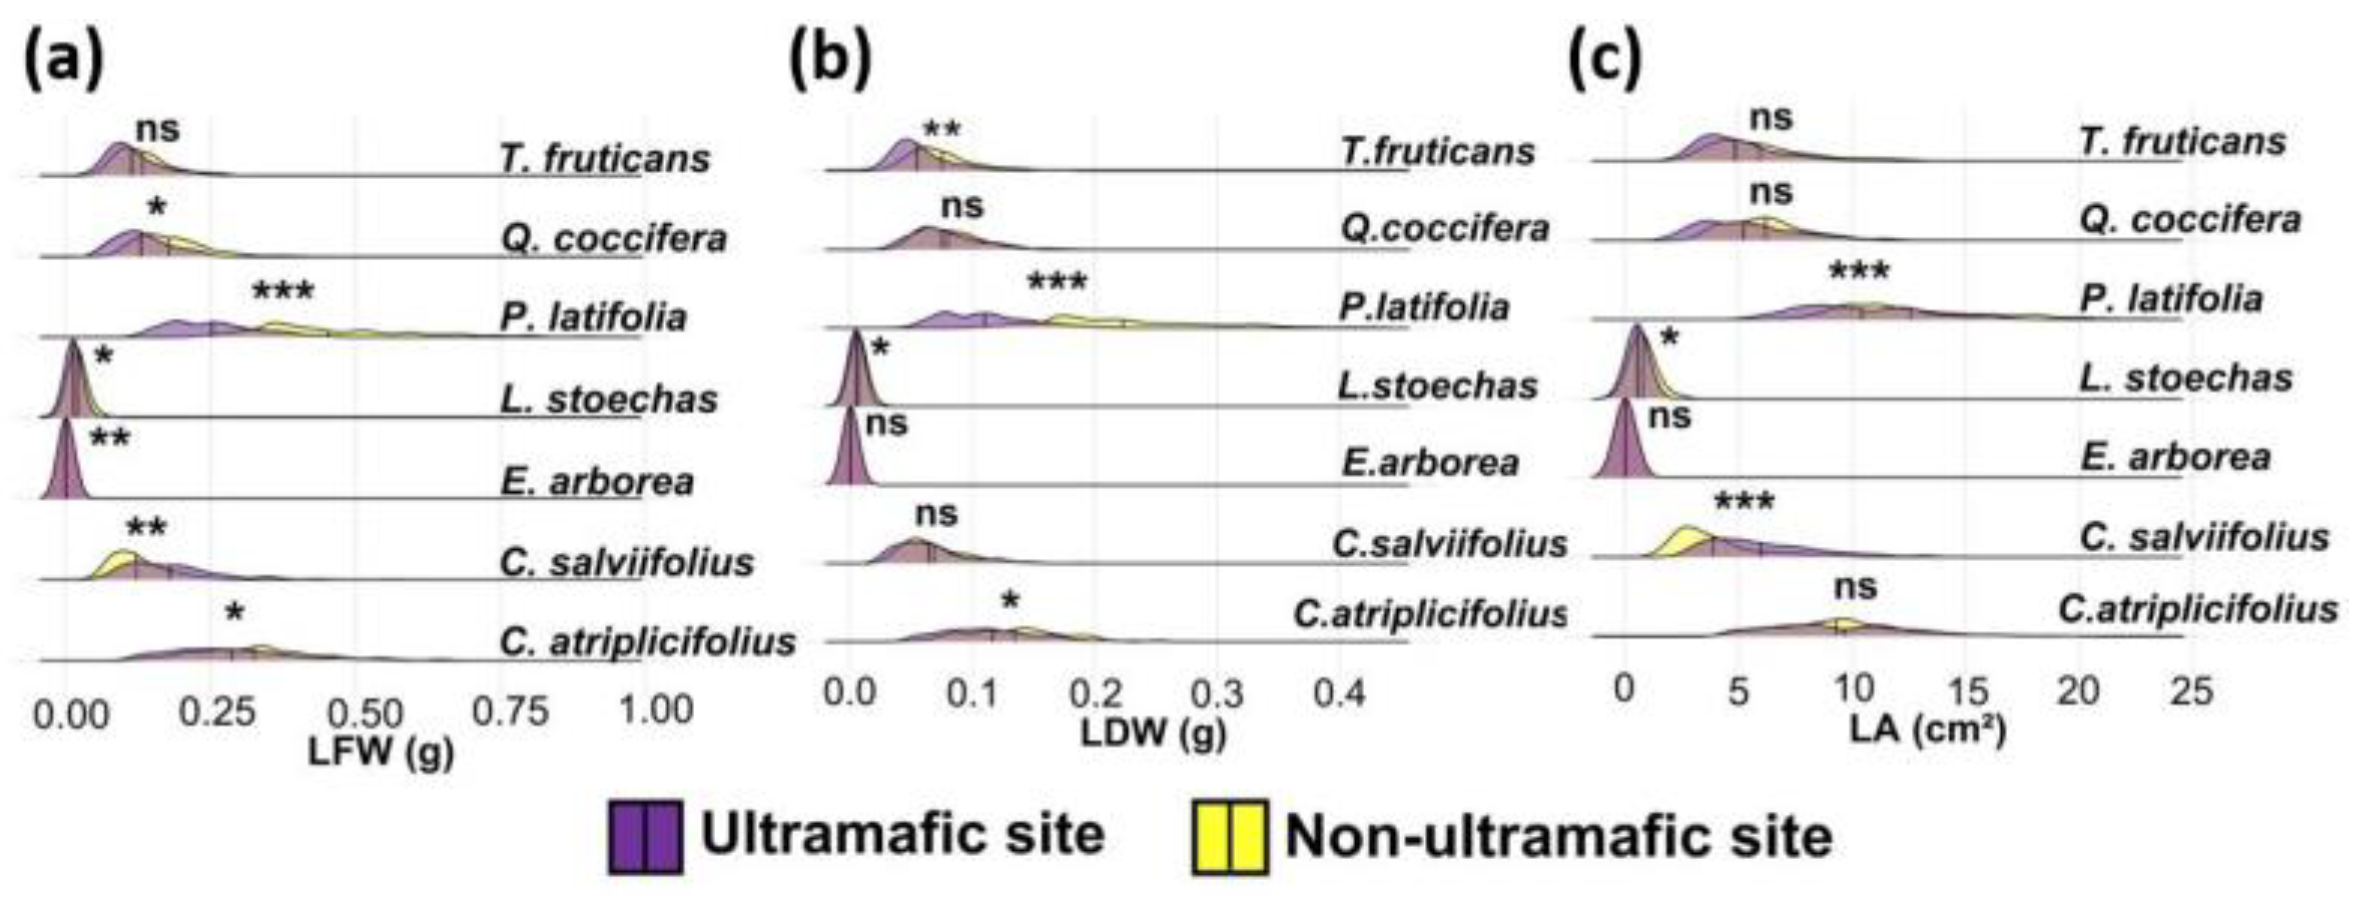
Regarding intraspecific variability, nearly all studied species exhibited significant differences in their leaf traits between the two study sites (Table 2). However, not all species responded uniformly to the substrate-type transition, highlighting species-specific and trait-specific responsiveness (Figure 4). For instance, Phillyrea latifolia and Lavandula stoechas showed significant differences across sites in all three studied leaf traits (LFW, LDW, and LA). In contrast, Erica arborea, Teucrium fruticans, and Quercus coccifera showed significant differences in only one trait. LFW and LDW were the most variable traits, with significant differences observed in 6 out of 7 species, whereas LA varied less frequently.
For Cistus atriplicifolius, the NU site displayed higher LFW and LDW values, while LA values did not differ significantly between the two populations (Figure 4; Table 2). In Cistus salviifolius, the two sites significantly differed in LFW and LA, with higher values recorded at the U site, while LDW values showed no significant differences (Figure 4; Table 2). For Erica arborea, significant differences were noted in LFW, with higher values at the NU site, but no significant differences were observed in LDW and LA values between the two sites (Figure 4; Table 2). The Lavandula stoechas at the NU site exhibited significantly higher LFW, LDW, and LA values than the population at the U site (Figure 4; Table 2). Similarly, the Phillyrea latifolia population at the NU site displayed higher LFW, LDW, and LA values than the population at the U site (Figure 4; Table 2). In Quercus coccifera, the only trait that differed significantly between sites was LFW, with higher values for the population at the NU site (Figure 4; Table 2). Similarly, Teucrium fruticans populations differed significantly only in LDW, with lower values observed in the U site population (Figure 4; Table 2).

3.3. Intraspecific Variability in CSR Strategies

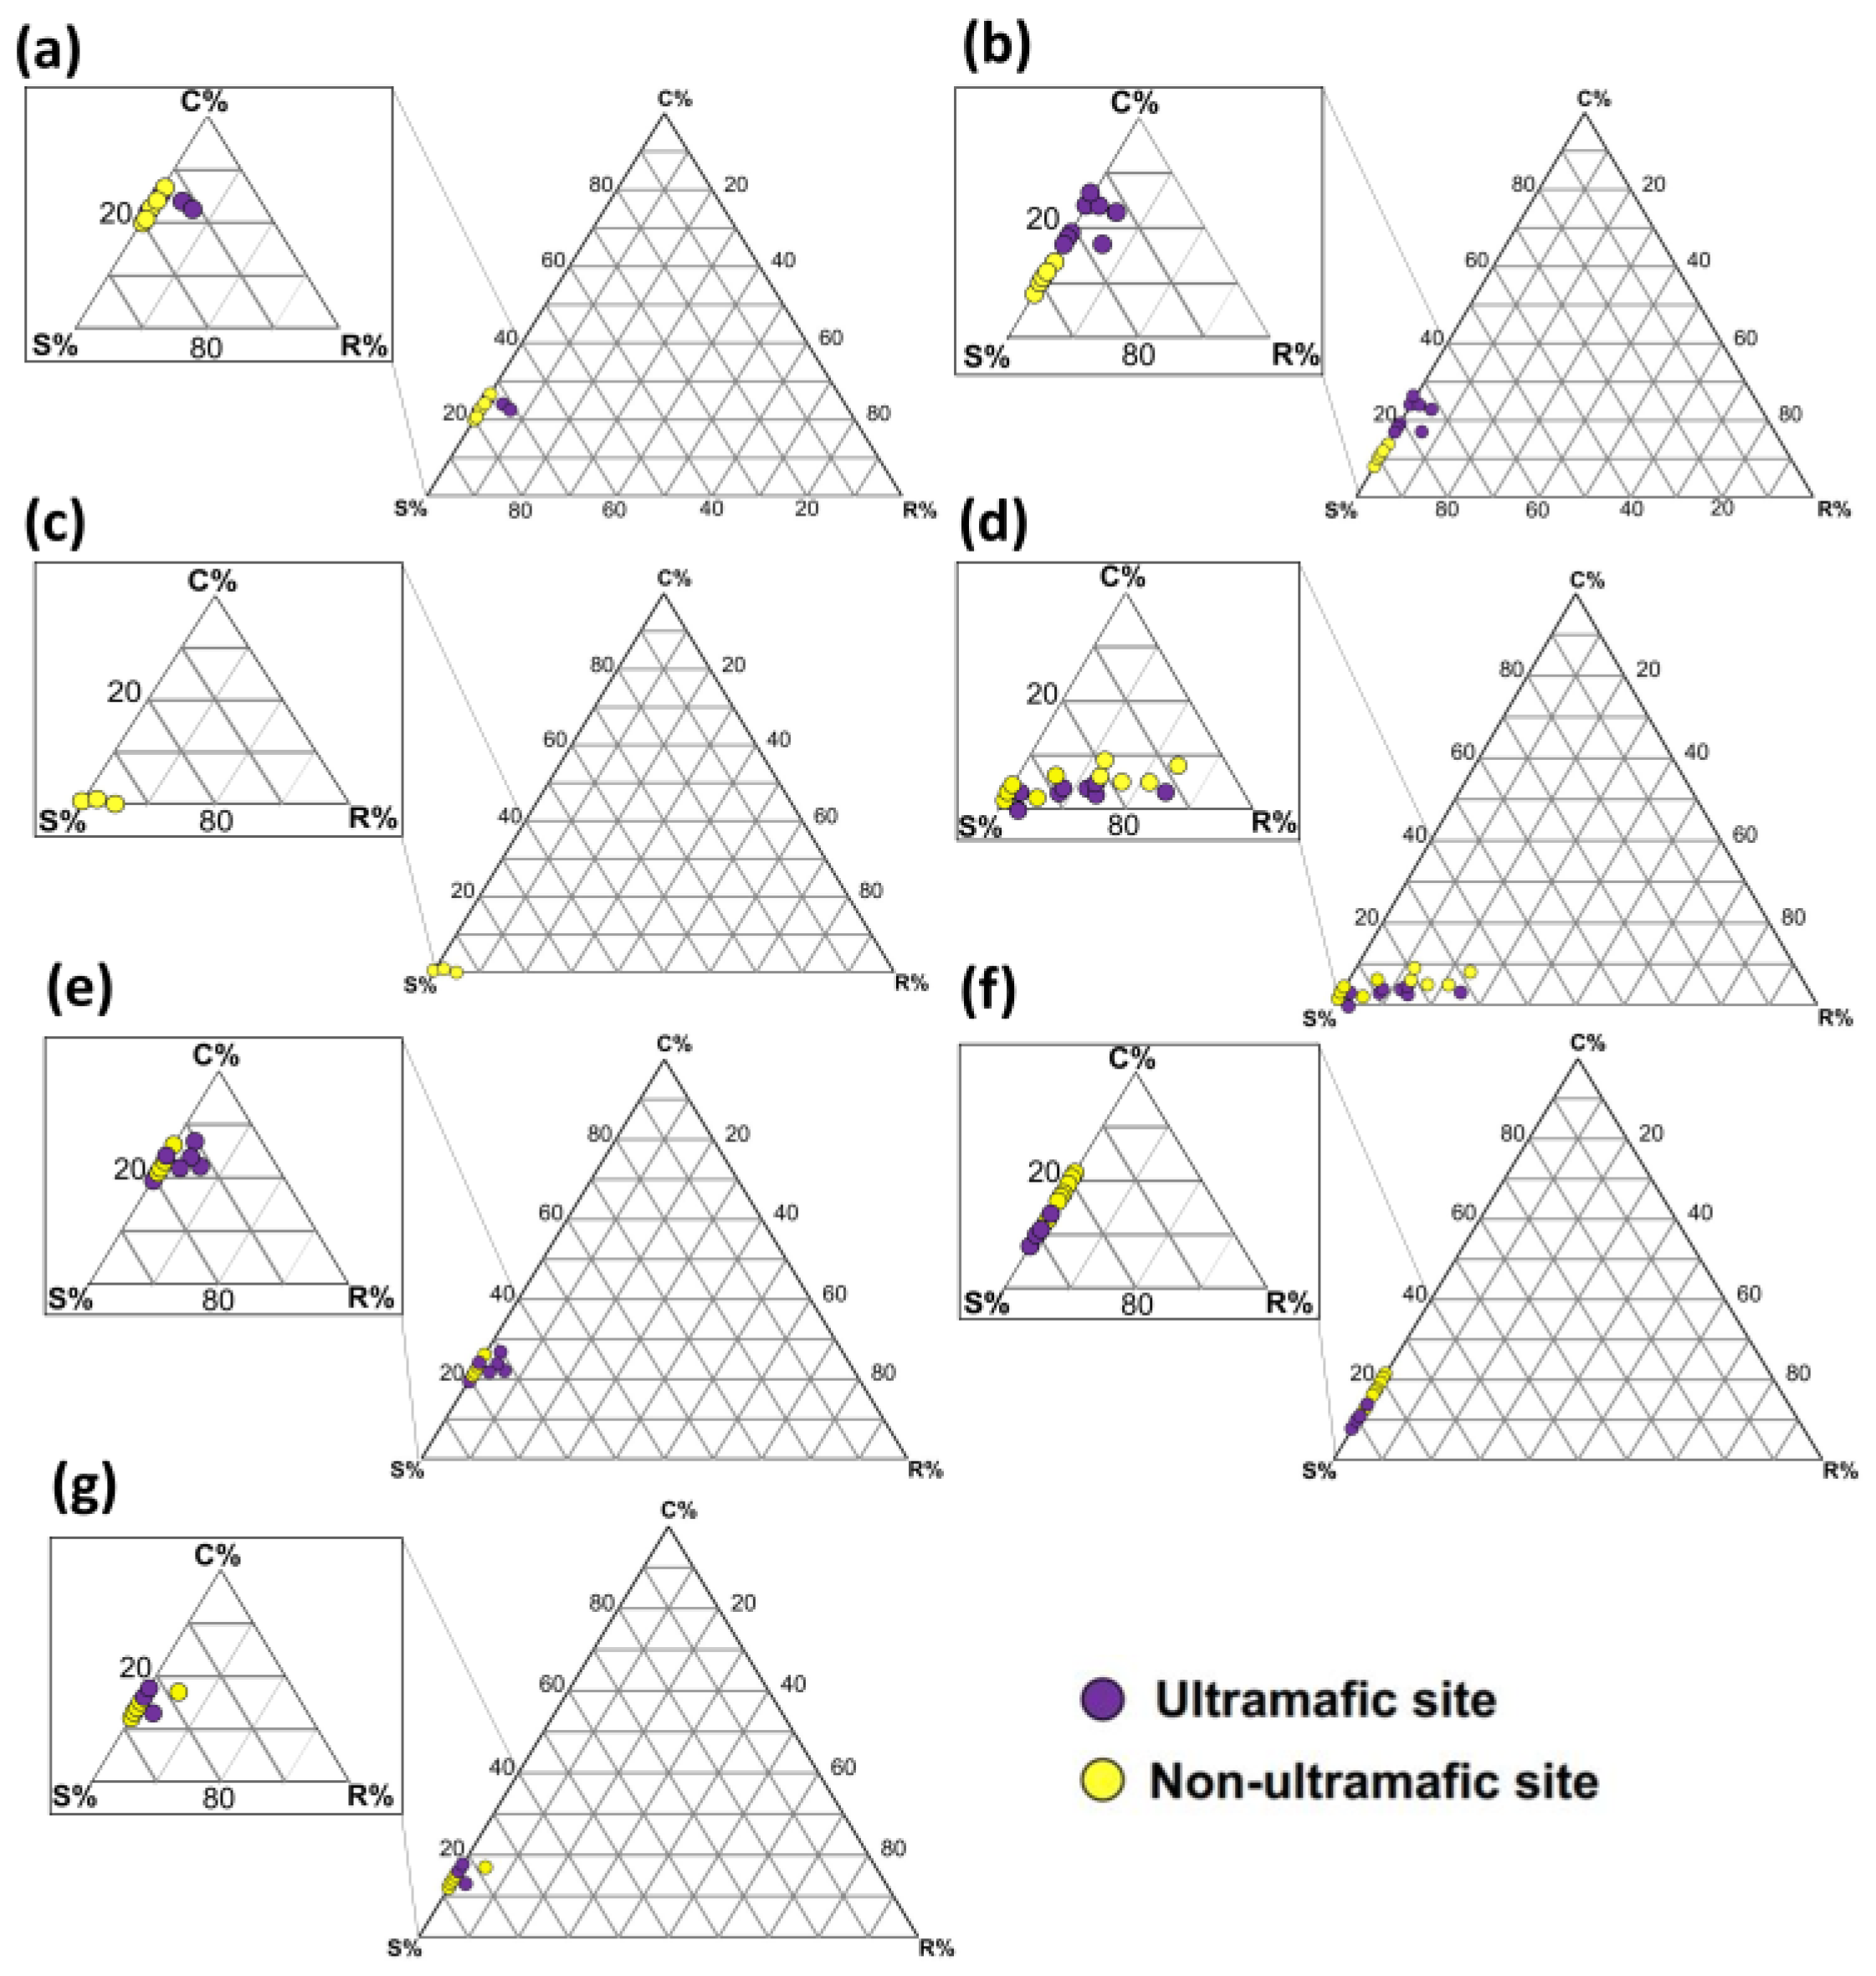
When considering interspecific comparisons of CSR strategies (Table 3), by averaging individual strategies regardless of site type, Erica arborea, Lavandula stoechas, Quercus coccifera, and Teucrium fruticans were classified as S species. In contrast, Cistus atriplicifolius, Cistus salviifolius, and Phillyrea latifolia were classified as S/CS species. These classifications changed for certain species when evaluating CSR strategies at the intraspecific level, as shown by the ternary diagram plots (Figure 5). With site transitions, Quercus coccifera adopted an S/CS strategy at the NU site and an S strategy at the U site (Figure 5; Table 3). Conversely, Cistus salviifolius shifted from an S strategy at the NU site to an S/CS strategy at the U site (Figure 5; Table 3). Meanwhile, the remaining species maintained the same strategies: Cistus atriplicifolius displayed a mean strategy of S/CS, as did Phillyrea latifolia (Figure 5; Table 3). Erica arborea, Lavandula stoechas, and Teucrium fruticans maintained a mean strategy of S (Figure 5; Table 3).
Erica arborea individuals showed a great overlap across the CSR triangle diagram space and were polarized toward the S axis. In contrast, Lavandula stoechas exhibited a notable percentage of ruderality (R%) at both sites, ranging from 8.2% at the U site to 9.8% at the NU site (Figure 5; Table 3).
Some species exhibited substantial variability at the interindividual level (Table S1). For example, Lavandula stoechas is classified as an S species at the NU site, although some individuals exhibited an S/SR strategy. Similarly, Quercus coccifera is classified as an S/SC species at the NU site, while some individuals displayed an S strategy. Teucrium fruticans qualifies as an S species at the U site, although some individuals showed an S/SC strategy.

4. Discussion

The soil analysis comparing U and NU soils revealed significant differences in several physicochemical properties, effectively distinguishing between the two types. However, both soil types shared similarities in variables related to low soil fertility, such as low concentrations of carbon (C), nitrogen (N), phosphorus (P), potassium (K), and zinc (Zn), aligning with the general nutrient limitations observed in Mediterranean ecosystems [76,77,78,79]. Serpentine soils are traditionally characterized by their coarse texture and low water-holding capacity [6,11]. Unexpectedly, our findings for the U soil contradicted this trend, revealing a high clay percentage that likely enhances water retention. This could explain the higher soil moisture (SM%) observed in U soil compared to NU soil. On the other hand, our results confirmed the presence of the serpentine effect in the ultramafic soils of the Beni Bousera region, as evidenced by a Ca–Mg ratio of less than 1, elevated magnesium levels, and significant concentrations of heavy metals [14,19,80]. However, compared to other serpentine outcrops worldwide, the serpentine effect in Beni Bousera is considered moderate [6,80]. In our study, the stress associated with the serpentine effect at the ultramafic site was not associated with heat stress as in other Mediterranean serpentine ecosystems [13,81] and may be mitigated by relatively humid climatic conditions.
Our study also uncovered significant intraspecific variability in leaf traits among populations at both U and NU sites for each species studied. These findings are consistent with previous research showing trait divergence among populations from ultramafic and non-ultramafic soils (e.g., Anisopappus chinensis from Lange et al. [44], Helianthus exilis from Sambatti and Rice [82], Silene paradoxa from Lazzaro et al. [53]). The responses observed were species-specific and trait-specific, underscoring the distinctiveness of species in their environmental adaptations [41,42,83,84]. However, except for Cistus salviifolius, individuals of species growing on ultramafic sites had substantially smaller leaves, with smaller LFW and LDW reflecting adaptive responses that enable plants to optimize their use of water and nutrient resources in stressed environments like Mediterranean serpentines fulfilling the core leaf economics spectrum [46,48,85,86,87,88]. Considering the diverse stressors within Mediterranean serpentine contexts, the trait variations observed in our study likely result from the combined effects of multiple environmental factors acting simultaneously [89].
Our examination of Grime’s CSR strategies revealed that the seven species present at both U and NU sites experienced significant stress. At the U site, plants were primarily affected by stress factors associated with the serpentine syndrome, whereas at the NU site, stress arose mainly from aridity. Furthermore, we observed a notable contribution of the C-component in both sites, indicating competition for nutrients and water available in the soil. Competition for light may also be an important factor, particularly at the U site, where trees and shrubs dominate the canopy cover [20]. Despite evidence of anthropogenic impacts like fire, grazing, and wood-cutting at our study sites, the relative contribution of the R-component remained small. This could be attributed to the life form of the studied species, as trees and shrubs typically exhibit lower %R values than other life form categories, as indicated by Pierce et al. [30]. However, Lavandula stoechas exhibited a relatively high percentage of %R, probably due to the microhabitat conditions in which this species occupies relatively open spaces.
The intraspecific variability in leaf traits observed in our study corresponded with shifts in adaptive CSR strategies among certain species, such as Quercus coccifera and Cistus salviifolius. Each species has its own ecological niche preferences in terms of climate and soil conditions. Quercus coccifera, for instance, tolerates both sub-humid and semi-arid bioclimates but prefers calcareous soils. However, its tolerance for substrates with high magnesium concentrations limits its ability to absorb calcium efficiently [90]. Therefore, the U site, characterized by Ca:Mg ratio < 1, represents a stressful habitat for Quercus coccifera, which adopts a stress-tolerant (S) strategy. In contrast, Cistus salviifolius, known as a calcifuge species, finds habitats with high calcium concentrations unfavorable, explaining its stress-tolerant (S) behavior at the NU site. Indeed, this species showed the highest responsiveness for Ca and higher foliar Mg contents [80]. These findings underscore the role of the Ca:Mg ratio in driving the differentiation of CSR strategies in Quercus coccifera and Cistus salviifolius, reflecting their calcicole or calcifuge affinities.
Erica arborea consistently exhibited an S strategy in both U and NU sites, aligning with previous observations that the Ericaceae family tends to be dominated by S-selected species across different biomes globally [30]. Similarly, Cistus atriplicifolius, Lavandula stoechas, Phillyrea latifolia, and Teucrium fruticans maintained stable CSR strategies across both sites. In the case of Cistus atriplicifolius, considered a local endemic species with preferential affinity to serpentine soils [20,80], the S/CS exhibited at the ultramafic site could be explained by the Mg exclusion behavior to cope with the extreme nature of ultramafic soils. In fact, this species had a very low foliar concentration of Mg and Ni on ultramafic soils in Beni Bousera [80]. However, it is important to note that relying solely on average CSR value results in a significant loss of information [52]. For instance, depicting the CSR strategy of Phillyrea latifolia using its average leaf traits extracted from the TRY database [91] would result in a CS species. However, this general classification did not correspond to the S/CS strategy observed in our study. Additionally, significant intraspecific variability was found, particularly for Lavandula stoechas, Quercus coccifera, and Teucrium fruticans, which exhibited notable interindividual differences. Our study underscores the importance of considering both interpopulation and interindividual variability to accurately characterize species’ CSR strategies at the local scale [52].

5. Conclusions

Our study confirms the distinction between the soils of the Beni Bousera region based on their ultramafic and non-ultramafic characteristics, with a moderate serpentine effect observed in the ultramafic soils. However, this differentiation is not solely determined by the serpentine effect but is also influenced by factors such as soil texture. In response to these challenging environmental conditions, we identified significant intraspecific variability (IV) in leaf traits across the seven studied species present in both ultramafic and non-ultramafic sites. These findings emphasize that IV should not be overlooked in trait-based functional studies, even at small spatial scales. This variability was accompanied by shifts in CSR (Competitive, Stress-tolerant, and Ruderal) strategies among some species at both interpopulation and interindividual levels. Our results contribute to enriching CSR databases and underscore the practical application of the CSR strategy framework at the local, intraspecific level. We highlight the potential of CSR theory and trait-based approaches in comparative vegetation studies and research focused on characterizing functional traits. This approach reveals the variability in response traits, highlighting the resilience and adaptive capacity of plants when faced with ecological challenges, especially in specialized habitats like Mediterranean serpentine soils.

Supplementary Materials

The following supporting information can be downloaded at: https://www.mdpi.com/article/10.3390/ecologies5030028/s1, Table S1: Results of linear mixed-effects models with individuals as a random effect showing the effects of species, site, and their interaction on the mean leaf fresh weight (LFW), leaf dry weight (LDW), and leaf area (LA). Figure S1: Linear mixed-effects models showing the effects of species, site, and their interaction on the mean leaf fresh weight (LFW), leaf dry weight (LDW), and leaf area (LA). Mean leaf traits per individual were shown in the background. Table S2: CSR strategy components in % and strategy means of the seven species growing on ultramafic (U) and non-ultramafic (NU) sites. Mean values per individual were presented.

Author Contributions

Conceptualization, K.K. and M.A.; methodology, K.K. and M.A.; software, K.K. and J.K.; validation, K.K. and M.A.; formal analysis, K.K. and J.K.; investigation, K.K. and M.A.; resources, M.A.; data curation, K.K. and M.A.; writing—original draft preparation, K.K. and M.A.; writing—review and editing, K.K., J.K., S.C., V.A.B., A.S., M.H., H.B. and M.A.; visualization, K.K.; J.K. and M.A.; supervision, M.A. and H.B.; project administration, K.K. and M.A. All authors have read and agreed to the published version of the manuscript.

Funding

This research received no specific grant from any funding agency in the public, commercial, or not-for-profit sectors.

Institutional Review Board Statement

No ethical statement was reported.

Data Availability Statement

All of the data that support the findings of this study are available in the main text and/or in the Supplementary Materials.

Acknowledgments

We thank El Ghalabzouri Abdeljalil for his guidance in the fieldwork and Kadiri Mohamed for his valuable feedback and suggestions. A special thanks goes out to Vidal Barrón and his team from the Department of Agronomy at the University of Cordóba (Spain) for allowing access to their laboratory and for their technical support in the soil chemical analyses. Additionally, we would like to thank the SCAI at the University of Cordóba (Spain) for the analysis of soil N and C concentrations. The authors are grateful to the reviewers for their useful suggestions and comments.

Conflicts of Interest

The authors declare no conflicts of interest.

References

  1. Mittermeier, R.A.; Gil, P.R.; Hoffman, M.; Pilgrim, J.; Brooks, T.; Mittermeier, C.G.; Lamoreux, J.; da Fonseca, G.A.B. Hotspots Revisited—Earth’s Biologically Richest and Most Endangered Terrestrial Ecoregions; University of Chicago Press: Chicago, IL, USA, 2005. [Google Scholar] [CrossRef]
  2. Myers, N.; Mittermeier, R.A.; Mittermeier, C.G.; da Fonseca, G.A.B.; Kent, J. Biodiversity hotspots for conservation priorities. Nature 2000, 403, 853–858. [Google Scholar] [CrossRef]
  3. Harrison, S.; Rajakaruna, N. What Have We Learned from Serpentine in Evolution, Ecology, and Other Sciences? In Serpentine: The Evolution and Ecology of a Model System; University of California Press: Berkeley, CA, USA, 2011; ISBN 0520268350. [Google Scholar] [CrossRef]
  4. Damschen, E.I.; Harrison, S.; Going, B.M.; Anacker, B.L. Climate change and plant communities on unusual soils. In Serpentine: The Evolution and Ecology of a Model System; Harrison, S., Rajakaruna, N., Eds.; University of California Press: Berkeley, CA, USA, 2011; pp. 359–382. ISBN 0520268350. [Google Scholar] [CrossRef]
  5. Hjort, J.; Gordon, J.E.; Gray, M.; Hunter, M.L., Jr. Why geodiversity matters in valuing nature’s stage. Conserv. Biol. 2015, 29, 630–639. [Google Scholar] [CrossRef] [PubMed]
  6. Brooks, R.R. Serpentine and Its Vegetation: A Multidisciplinary Approach; Croom Helm: London, UK, 1987; ISBN 0709950632. [Google Scholar]
  7. Lefèbvre, C.; Vernet, P. Microevolutionary processes on contaminated deposits. In Heavy Metal Tolerance in Plants: Evolutionary Aspects; Shaw, A., Ed.; CRC Press Inc.: Boca Raton, FL, USA, 1990; pp. 285–299. Available online: https://books.google.co.ma/books?hl=fr&lr=&id=kvsPo4Et5scC&oi=fnd&pg=PA285&dq=lefebvre+and+vernet+1990&ots=wH131FvRS0&sig=pmFrD9mvkM8caUmNZj08EUn7rw&redir_esc=y#v=onepage&q&f=false (accessed on 14 July 2024).
  8. Garnier, J.; Quantin, C.; Guimarães, E.; Garg, V.K.; Martins, E.S.; Becquer, T. Understanding the Genesis of Ultramafic Soils and Catena Dynamics in Niquelândia, Brazil. Geoderma 2009, 151, 204–214. [Google Scholar] [CrossRef]
  9. Coleman, R.G.; Jove, C. Geological Origin of Serpentinites. In The Vegetation of Ultramafic (Serpentine) Soils; Baker, A.J.M., Proctor, J., Reeves, R.D., Eds.; Intercept Ltd.: Andover, UK, 1993; pp. 1–18. [Google Scholar]
  10. Echevarria, G. Genesis and Behaviour of Ultramafic Soils and Consequences for Nickel Biogeochemistry. In Agromining: Farming for Metals; van der Ent, A., Baker, A.J., Echevarria, G., Simonnot, M.O., Morel, J.L., Eds.; Mineral Resource Reviews; Springer: Cham, Germen, 2021. [Google Scholar] [CrossRef]
  11. Brady, K.U.; Kruckeberg, A.R.; Bradshaw, H.D., Jr. Evolutionary Ecology of Plant Adaptation to Serpentine Soils. Annu. Rev. Ecol. Evol. Syst. 2005, 36, 243–266. [Google Scholar] [CrossRef]
  12. Kruckeberg, A.R. An essay: The stimulus of unusual geologies for plant speciation. Syst. Bot. 1986, 11, 455–463. [Google Scholar] [CrossRef]
  13. Adamidis, C.; Kazakou, E.; Baker, A.J.M.; Reeves, R.D.; Dimitrakopoulos, P.G. The effect of harsh abiotic conditions on the diversity of serpentine plant communities on Lesbos, an eastern Mediterranean island. Plant Ecol. Divers. 2014, 7, 433–444. [Google Scholar] [CrossRef]
  14. El Ghalabzouri, A.; Ajbilou, R.; Mariotti, M.G.; Targuisti, K.; Ater, M. Vegetation of Beni Bousera (northern Morocco) ultramafic soils and adjacent non-ultramafic soils in relation to edaphic factors. Aust. J. Bot. 2015, 63, 353–366. [Google Scholar] [CrossRef]
  15. Kazakou, E.; Dimitrakopoulos, P.G.; Baker, A.J.M.; Reeves, R.D.; Troumbis, A.Y. Hypotheses, mechanisms and tradeoffs of tolerance and adaptation to serpentine soils: From species to ecosystem level. Biol. Rev. 2008, 83, 495–508. [Google Scholar] [CrossRef]
  16. O’Dell, R.E.; Rajakaruna, N. Intraspecific variation, adaptation, and evolution. In Serpentine: Evolution and Ecology in a Model System; Harrison, S., Rajakaruna, N., Eds.; University of California Press: Berkeley, CA, USA, 2011. [Google Scholar] [CrossRef]
  17. Rajakaruna, N.; Bradfield, G.E.; Bohm, B.A.; Whitton, J. Adaptive differentiation in response to water stress by edaphic races of Lasthenia california (Asteraceae). Int. J. Plant Sci. 2003, 164, 371–376. [Google Scholar] [CrossRef]
  18. Stevanović, V.; Tan, K.; Iatrou, G. Distribution of the endemic Balkan flora on serpentine I.—Obligate serpentine endemics. Plant Syst. Evol. 2003, 242, 149–170. [Google Scholar] [CrossRef]
  19. Chakkour, S.; Kassout, J.; Kadaoui, K.; El Ghalabzouri, A.; Sahli, A.; Kadiri, M.; Ater, M. Arable plant communities of ultramafic and non-ultramafic soils in Beni Bousera (North Morocco). Community Ecol. 2023, 24, 171–187. [Google Scholar] [CrossRef]
  20. El Ghalabzouri, A.; Kassout, J.; Khamlichi, A.; Ajbilou, R.; Ater, M. Diversity and structure of woody vegetation of the Beni Bousera massif, northern Morocco: Conservation interest. Euro-Mediterr. J. Environ. Integr. 2023, 8, 863–873. [Google Scholar] [CrossRef]
  21. Selvi, F. Diversity, geographic variation and conservation of the serpentine flora of Tuscany (Italy). Biodivers. Conserv. 2007, 16, 1423–1439. [Google Scholar] [CrossRef]
  22. Pérez-Latorre, A.V.; Hidalgo-Triana, N.; Cabezudo, B. Composition, ecology and conservation of the south-Iberian serpentine flora in the context of the Mediterranean basin. An. Jard. Bot. Madr. 2013, 70, 62–71. [Google Scholar]
  23. Moreno-Saiz, J.C.; Martínez García, F.; Gavilán, R.G. Plant Conservation in Spain: Strategies to halt the loss of plant diversity. Mediterr. Bot. 2018, 39, 65–66. [Google Scholar] [CrossRef]
  24. Lavorel, S.; McIntyre, S.; Landsberg, J.; Forbes, T.D.A. Plant functional classifications: From general groups to specific groups based on response to disturbance. Trends Ecol. Evol. 1997, 12, 474–478. [Google Scholar] [CrossRef]
  25. Violle, C.; Navas, M.-L.; Vile, D.; Kazakou, E.; Fortunel, C.; Hummel, I.; Garnier, E. Let the concept of trait be functional! Oikos 2007, 116, 882–892. [Google Scholar] [CrossRef]
  26. Udayakumar, M.; Sekar, T. Leaf Traits of Trees in Tropical Dry Evergreen Forests of Peninsular India. Ecologies 2021, 2, 268–284. [Google Scholar] [CrossRef]
  27. Grime, J.P. Vegetation classification by reference to strategies. Nature 1974, 250, 26–31. [Google Scholar] [CrossRef]
  28. Grime, J.P. Evidence for the existence of three primary strategies in plants and its relevance to ecological and evolutionary theory. Am. Nat. 1977, 111, 1169–1194. [Google Scholar] [CrossRef]
  29. Grime, J.P. Plant Strategies, Vegetation Processes and Ecosystem Properties; Wiley: Winchester, MA, USA, 2001. [Google Scholar]
  30. Pierce, S.; Negreiros, D.; Cerabolini, B.E.L.; Kattge, J.; Díaz, S.; Kleyer, M.; Shipley, B.; Wright, S.J.; Soudzilovskaia, N.A.; Onipchenko, V.G.; et al. A global method for calculating plant CSR ecological strategies applied across biomes world-wide. Funct. Ecol. 2017, 31, 444–457. [Google Scholar] [CrossRef]
  31. Hodgson, J.G.; Wilson, P.J.; Hunt, R.; Grime, J.P.; Thompson, K. Allocating C-S-R plant functional types: A soft approach to a hard problem. Oikos 1999, 85, 282–294. [Google Scholar] [CrossRef]
  32. Pierce, S.; Brusa, G.; Vagge, I.; Cerabolini, B.E.L. Allocating CSR plant functional types: The use of leaf economics and size traits to classify woody and herbaceous vascular plants. Funct. Ecol. 2013, 27, 1002–1010. [Google Scholar] [CrossRef]
  33. Caccianiga, M.; Luzzaro, A.; Pierce, S.; Ceriani, R.M.; Cerabolini, B. The functional basis of a primary succession resolved by CSR classification. Oikos 2006, 112, 10–20. [Google Scholar] [CrossRef]
  34. Cerabolini, B.E.; Brusa, G.; Ceriani, R.M.; De Andreis, R.; Luzzaro, A.; Pierce, S. Can CSR classification be generally applied outside Britain? Plant Ecol. 2010, 210, 253–261. [Google Scholar] [CrossRef]
  35. Yildirmi, C.; Karavin, N.; Cansaran, A. Classification and evaluation of some endemic plants from Turkey using Grime’s CSR strategies. Eurasia J. Biosci. 2012, 6, 97–104. [Google Scholar] [CrossRef]
  36. Violle, C.; Borgy, B.; Choler, P. Trait databases: Misuses and precautions. J. Veg. Sci. 2015, 26, 826–827. [Google Scholar] [CrossRef]
  37. Gervais-Bergeron, B.; Paul, A.L.; Chagnon, P.L.; Baker, A.J.; van der Ent, A.; Faucon, M.P.; Quintela-Sabarís, C.; Labrecque, M. Trace element hyperaccumulator plant traits: A call for trait data collection. Plant Soil 2023, 488, 187–196. [Google Scholar] [CrossRef]
  38. Von Wettberg, E.J.; Ray-Mukherjee, J.; D’Adesky, N.; Nesbeth, D.; Sistla, S. The evolutionary ecology and genetics of stress resistance syndrome (SRS) traits: Revisiting Chapin, Autumn and Pugnaire (1993). In Plant Ecology and Evolution in Harsh Environments; Rajakaruna, N., Boyd, R.S., Harris, T., Eds.; Nova Science Publishers: New York, NY, USA, 2014; pp. 201–226. [Google Scholar]
  39. Wright, I.J.; Reich, P.B.; Westoby, M.; Ackerly, D.D.; Baruch, Z.; Bongers, F.; Cavender-Bares, J.; Chapin, T.; Cornelissen, J.; Diemer, M.; et al. The world-wide leaf economics spectrum. Nature 2004, 428, 821–827. [Google Scholar] [CrossRef]
  40. Freschet, G.T.; Valverde-Barrantes, O.J.; Tucker, C.M.; Craine, J.M.; McCormack, M.L.; Violle, C.; Fort, F.; Blackwood, C.B.; Urban-Mead, K.R.; Iversen, C.M.; et al. Climate, soil, and plant functional types as drivers of global fine-root trait variation. J. Ecol. 2017, 105, 1182–1196. [Google Scholar] [CrossRef]
  41. Albert, C.H.; Thuiller, W.; Yoccoz, N.G.; Douzet, R.; Aubert, S.; Lavorel, S. A Multi-Trait Approach Reveals the Structure and the Relative Importance of Intra- vs. Interspecific Variability in Plant Traits. Funct. Ecol. 2010, 24, 1192–1201. [Google Scholar] [CrossRef]
  42. Albert, C.H.; Thuiller, W.; Yoccoz, N.G.; Soudant, A.; Boucher, F.; Saccone, P.; Lavorel, S. Intraspecific Functional Variability: Extent, Structure and Sources of Variation. J. Ecol. 2010, 98, 604–613. [Google Scholar] [CrossRef]
  43. Kattge, J.; Díaz, S.; Lavorel, S.; Prentice, I.C.; Leadley, P.; Bönisch, G.; Garnier, E.; Westoby, M.; Reich, P.B.; Wright, I.J.; et al. TRY—A global database of plant traits. Glob. Chang. Biol. 2011, 17, 2905–2935. [Google Scholar] [CrossRef]
  44. Lange, B.; Faucon, M.-P.; Delhaye, G.; Hamiti, N.; Meerts, P. Functional traits of a facultative metallophyte from tropical Africa: Population variation and plasticity in response to cobalt. Environ. Exp. Bot. 2017, 136, 1–8. [Google Scholar] [CrossRef]
  45. Messier, J.; McGill, B.J.; Lechowicz, M.J. How do traits vary across ecological scales? A case for trait-based ecology. Ecol. Lett. 2010, 13, 838–848. [Google Scholar] [CrossRef]
  46. Kassout, J.; Terral, J.-F.; Hodgson, J.G.; Ater, M. Trait-Based Plant Ecology a Flawed Tool in Climate Studies? The Leaf Traits of Wild Olive That Pattern with Climate Are Not Those Routinely Measured. PLoS ONE 2019, 14, e0219908. [Google Scholar] [CrossRef] [PubMed]
  47. Kassout, J.; Hmimsa, Y.; Fatehi, S.E.; Kadaoui, K.; Houssni, M.; Chakkour, S.; Sahli, A.; El Chami, M.A.; Ariza-Mateos, D.; Palacios-Rodríguez, G.; et al. Aridity Gradients Shape Intraspecific Variability of Morphological Traits in Native Ceratonia siliqua L. of Morocco. Plants 2023, 12, 3447. [Google Scholar] [CrossRef] [PubMed]
  48. Kassout, J.; Terral, J.F.; Souali, H.; Ater, M. Environment-dependent and intraspecific variations in leaf and size traits of a native wild olive (Olea europaea L.) along an aridity gradient in Morocco: A functional perspective. Plant Ecol. 2024, 225, 1–17. [Google Scholar] [CrossRef]
  49. May, R.L.; Warner, S.; Wingler, A. Classification of intra-specific variation in plant functional strategies reveals adaptation to climate. Ann. Bot. 2017, 119, 1343–1352. [Google Scholar] [CrossRef]
  50. Giupponi, L. Intraspecific variation in functional strategy and leaf shape of Campanula elatinoides reveals adaptation to climate. Flora 2020, 268, 151605. [Google Scholar] [CrossRef]
  51. Baltieri, M.; Fantinato, E.; Del Vecchio, S.; Buffa, G. Intraspecific variability of leaf traits and functional strategy of Himantoglossum adriaticum H. Baumann. Plant Sociol. 2020, 57, 105–112. [Google Scholar] [CrossRef]
  52. Astuti, G.; Ciccarelli, D.; Roma-Marzio, F.; Trinco, A.; Peruzzi, L. Narrow endemic species Bellevalia webbiana shows significant intraspecific variation in tertiary CSR strategy. Plant Biosyst. 2019, 153, 12–18. [Google Scholar] [CrossRef]
  53. Lazzaro, L.; Colzi, I.; Ciampi, D.; Gonnelli, C.; Lastrucci, L.; Bazihizina, N.; Viciani, D.; Coppi, A. Intraspecific trait variability and genetic diversity in the adaptive strategies of serpentine and non-serpentine populations of Silene paradoxa L. Plant Soil 2021, 460, 105–121. [Google Scholar] [CrossRef]
  54. Richardson, S.J.; Allen, R.B.; Doherty, J.E. Shifts in leaf N:P ratio during resorption reflect soil P in temperate rainforest. Funct. Ecol. 2008, 22, 738–745. [Google Scholar] [CrossRef]
  55. Jung, V.; Violle, C.; Mondy, C.P.; Hoffmann, L.; Muller, S.D. Intraspecific variability and trait-based community assembly. J. Ecol. 2010, 98, 1134–1140. [Google Scholar] [CrossRef]
  56. Kumordzi, B.B.; Nilsson, M.C.; Gundale, M.J.; Wardle, D.A. Changes in local-scale intraspecific trait variability of dominant species across contrasting island ecosystems. Ecosphere 2014, 5, 1–17. [Google Scholar] [CrossRef]
  57. Iozia, L.M.; Varone, L. Tackling local ecological homogeneity: Finding intraspecific trait variability in local populations of Mediterranean plants. Ecol. Evol. 2023, 13, e10550. [Google Scholar] [CrossRef]
  58. Fick, S.E.; Hijmans, R.J. World Clim 2: New 1-km spatial resolution climate surfaces for global land areas. Int. J. Climatol. 2017, 37, 4302–4315. [Google Scholar] [CrossRef]
  59. Manthei, C.D. Geochemical Properties of the Beni Bousera (N. Morocco) Peridotites: A Field and Laboratory Approach to Understanding Melt Infiltration and Extraction in an Orogenic Peridotite Massif. Ph.D. Dissertation, Massachusetts Institute of Technology, Cambridge, MA, USA, 2012. [Google Scholar]
  60. Reuber, I.; Michard, A.; Chalouan, A.; Juteau, T.; Jermoumi, B. Structure and emplacement of the Alpine-type peridotites from Beni Bousera, Rif, Morocco: A polyphase tectonic interpretation. Tectonophysics 1982, 82, 231–251. [Google Scholar] [CrossRef]
  61. Saddiqi, O.; Reuber, I.; Michard, A. Sur la tectonique de dénudation du manteau infracontinental dans les Béni Bousera, Rif septentrional, Maroc. C. R. Acad. Sci. 1988, 307, 657–662. [Google Scholar]
  62. Saddiqi, O.; Feinberg, H.; El Azzab, D.; Michard, A. Paléomagnétisme des péridotites des Beni Bousera (Rif interne, Maroc): Conséquences pour l’évolution miocène de l’Arc de Gibraltar. C. R. Acad. Sci. 1995, 321, 361–368, Série 2. Sciences de la terre et des planètes. [Google Scholar]
  63. Barbero, M.; Quezel, P.; Rivas-Martinez, S. Contribution à l’étude des groupements forestiers et préforestiers du Maroc. Phytocoenologia 1981, 9, 311–412. [Google Scholar] [CrossRef]
  64. Benabid, A. Étude Phyto-Écologique Biogéographique et Dynamique des Associations et Series Sylvatiques du Rif Occidental. Ph.D. Dissertation, Université Aix-Marseille-III, Aix-en-Provence, France, 1976. [Google Scholar]
  65. Quézel, P.; Barbero, M.; Benabid, A.; Loisel, R.; Rivas-Martinez, S. Contribution à l’étude des groupements pré-forestiers et des matorrals rifains. Ecol. Mediterr. 1988, 14, 77–122. [Google Scholar] [CrossRef]
  66. UNEP. World Atlas of Desertification; UNEP and E. Arnold Ltd.: Kent, UK, 1992; Volume 80. [Google Scholar]
  67. Cornelissen, J.H.C.; Lavorel, S.; Garnier, E.; Díaz, S.; Buchmann, N.; Gurvich, D.E.; Reich, P.B.; Steege, H.T.; Morgan, H.D.; van der Heijden, M.G.A.; et al. A handbook of protocols for standardized and easy measurement of plant functional traits worldwide. Aust. J. Bot. 2003, 51, 335–380. [Google Scholar] [CrossRef]
  68. Bouyoucos, G.J. Hydrometer method improved for making particle size analysis of soils. Agron. J. 1962, 54, 464–465. [Google Scholar] [CrossRef]
  69. Olsen, S.R.; Sommers, L.E. Methods of Soil Analysis, Chemical, and Microbiological Properties; American Society of Agronomy: Madison, WI, USA; Soil Science Society of America: Madison, WI, USA, 1982. [Google Scholar]
  70. Norvell, W.A.; Lindsay, W.L. Reactions of DTPA chelates of iron, zinc, copper, and manganese with soils. Soil Sci. Soc. Am. J. 1972, 36, 778–783. [Google Scholar] [CrossRef]
  71. Pérez-Harguindeguy, N.; Díaz, S.; Garnier, E.; Lavorel, S.; Poorter, H.; Jaureguiberry, P.; Bret-Harte, M.S.; Cornwell, W.K.; Craine, J.M.; Gurvich, D.E.; et al. New handbook for standardized measurement of plant functional traits worldwide. Aust. J. Bot. 2013, 61, 167–234. [Google Scholar] [CrossRef]
  72. Schneider, C.; Rasband, W.; Eliceiri, K. NIH Image to ImageJ: 25 years of image analysis. Nat. Methods 2012, 9, 671–675. [Google Scholar] [CrossRef]
  73. R Development Core Team. The R Project for Statistical Computing. Available online: https://www.r-project.org/ (accessed on 10 July 2024).
  74. Hammer, Ø.; Harper, D.A.T.; Ryan, P.D. PAST: Paleontological Statistical Software Package for Education and Data Analysis. Palaeontol. Electron. 2001, 4, 4. [Google Scholar]
  75. Hammer, Ø. Reference Manual Paleontological Statistics Version 3.15; Natural History Museum University of Oslo: Oslo, Norway, 2017. [Google Scholar]
  76. Kazakou, E.; Adamidis, G.C.; Baker, A.J.; Reeves, R.D.; Godino, M.; Dimitrakopoulos, P.G. Species adaptation in serpentine soils in Lesbos Island (Greece): Metal hyperaccumulation and tolerance. Plant Soil 2010, 332, 369–385. [Google Scholar] [CrossRef]
  77. Navas, M.-L.; Roumet, C.; Bellmann, A.; Laurent, G.; Garnier, E. Suites of plant traits in species from different stages of a Mediterranean secondary succession. Plant Biol. 2010, 12, 183–196. [Google Scholar] [CrossRef] [PubMed]
  78. Dimitrakopoulos, P.G.; Galanidis, A.; Siamantziouras, A.-S.D.; Troumbis, A.Y. Short-term invasibility patterns in burnt and unburnt experimental Mediterranean grassland communities of varying diversities. Oecologia 2005, 143, 428–437. [Google Scholar] [CrossRef]
  79. Spehn, E.M.; Scherer-Lorenzen, M.; Schmid, B.; Hector, A.; Caldeira, M.C.; Dimitrakopoulos, P.G.; Finn, J.A.; Jumpponen, A.; O’Donnovan, G.; Pereira, J.S.; et al. The role of legumes as a component of biodiversity in a cross-European study of grassland biomass nitrogen. Oikos 2002, 98, 205–218. [Google Scholar] [CrossRef]
  80. Ater, M.; Lefèbvre, C.; Gruber, W.; Meerts, P. A phytogeochemical survey of the flora of ultramafic and adjacent normal soils in North Morocco. Plant Soil 2000, 218, 127–135. [Google Scholar] [CrossRef]
  81. Hidalgo-Triana, N.; Pérez-Latorre, A.V.; Adomou, A.C.; Rudner, M.; Thorne, J.H. Adaptations to the stressful combination of serpentine soils and Mediterranean climate drive plant functional groups and trait richness. Front. Plant Sci. 2023, 14, 1040839. [Google Scholar] [CrossRef]
  82. Sambatti, J.B.; Rice, K.J. Functional ecology of ecotypic differentiation in the Californian serpentine sunflower (Helianthus exilis). New Phytol. 2007, 175, 107–119. [Google Scholar] [CrossRef]
  83. Wright, J.P.; Sutton-Grier, A. Does the leaf economic spectrum hold within local species pools across varying environmental conditions? Funct. Ecol. 2012, 26, 1390–1398. [Google Scholar] [CrossRef]
  84. Adamidis, G.C.; Kazakou, E.; Fyllas, N.M.; Dimitrakopoulos, P.G. Species Adaptive Strategies and Leaf Economic Relationships across Serpentine and Non-Serpentine Habitats on Lesbos, Eastern Mediterranean. PLoS ONE 2014, 9, e96034. [Google Scholar] [CrossRef]
  85. Diaz, S.; Hodgson, J.G.; Thompson, K.; Cabido, M.; Cornelissen, J.H.C.; Jalili, A.; Montserrat-Marti, G.; Grime, J.P.; Zarrinkamar, F.; Asri, Y.; et al. The plant traits that drive ecosystems: Evidence from three continents. J. Veg. Sci. 2004, 15, 295–304. [Google Scholar] [CrossRef]
  86. Díaz, S.; Kattge, J.; Cornelissen, J.H.C.; Wright, I.J.; Lavorel, S.; Dray, S.; Reu, B.; Kleyer, M.; Wirth, C.; Prentice, I.C.; et al. The global spectrum of plant form and function. Nature 2015, 529, 167–171. [Google Scholar] [CrossRef]
  87. Wright, I.J.; Dong, N.; Maire, V.; Prentice, I.C.; Westoby, M.; Díaz, S.; Gallagher, R.V.; Jacobs, B.F.; Kooyman, R.; Law, E.A.; et al. Global climatic drivers of leaf size. Nature 2017, 357, 917–921. [Google Scholar] [CrossRef] [PubMed]
  88. Roche, P.; Díaz-Burlinson, N.; Gachet, S. Congruency analysis of species ranking based on leaf traits: Which traits are the more reliable? Plant Ecol. 2004, 174, 37–48. [Google Scholar] [CrossRef]
  89. Anacker, B.L.; Rajakaruna, N.; Ackerly, D.D.; Harrison, S.; E Keeley, J.; Vasey, M.C. Ecological strategies in California chaparral: Interacting effects of soils, climate, and fire on specific leaf area. Plant Ecol. Divers. 2011, 4, 179–188. [Google Scholar] [CrossRef]
  90. Nguyen, H.; Maneepong, S.; Suraninpong, P. Effects of potassium, calcium and magnesium ratios in soil on their uptake and fruit quality of pummelo. J. Agric. Sci. 2017, 9, 110–121. [Google Scholar] [CrossRef]
  91. Kattge, J.; Bönisch, G.; Dìaz, S.; Lavorel, S.; Prentice, I.C.; Leadley, P.; Tautenhahn, S.; Werner, G.D.A.; Aakala, T.; Abedi, M.; et al. TRY plant trait database—Enhanced coverage and open access. Glob. Chang. Biol. 2020, 26, 119–188. [Google Scholar] [CrossRef] [PubMed]
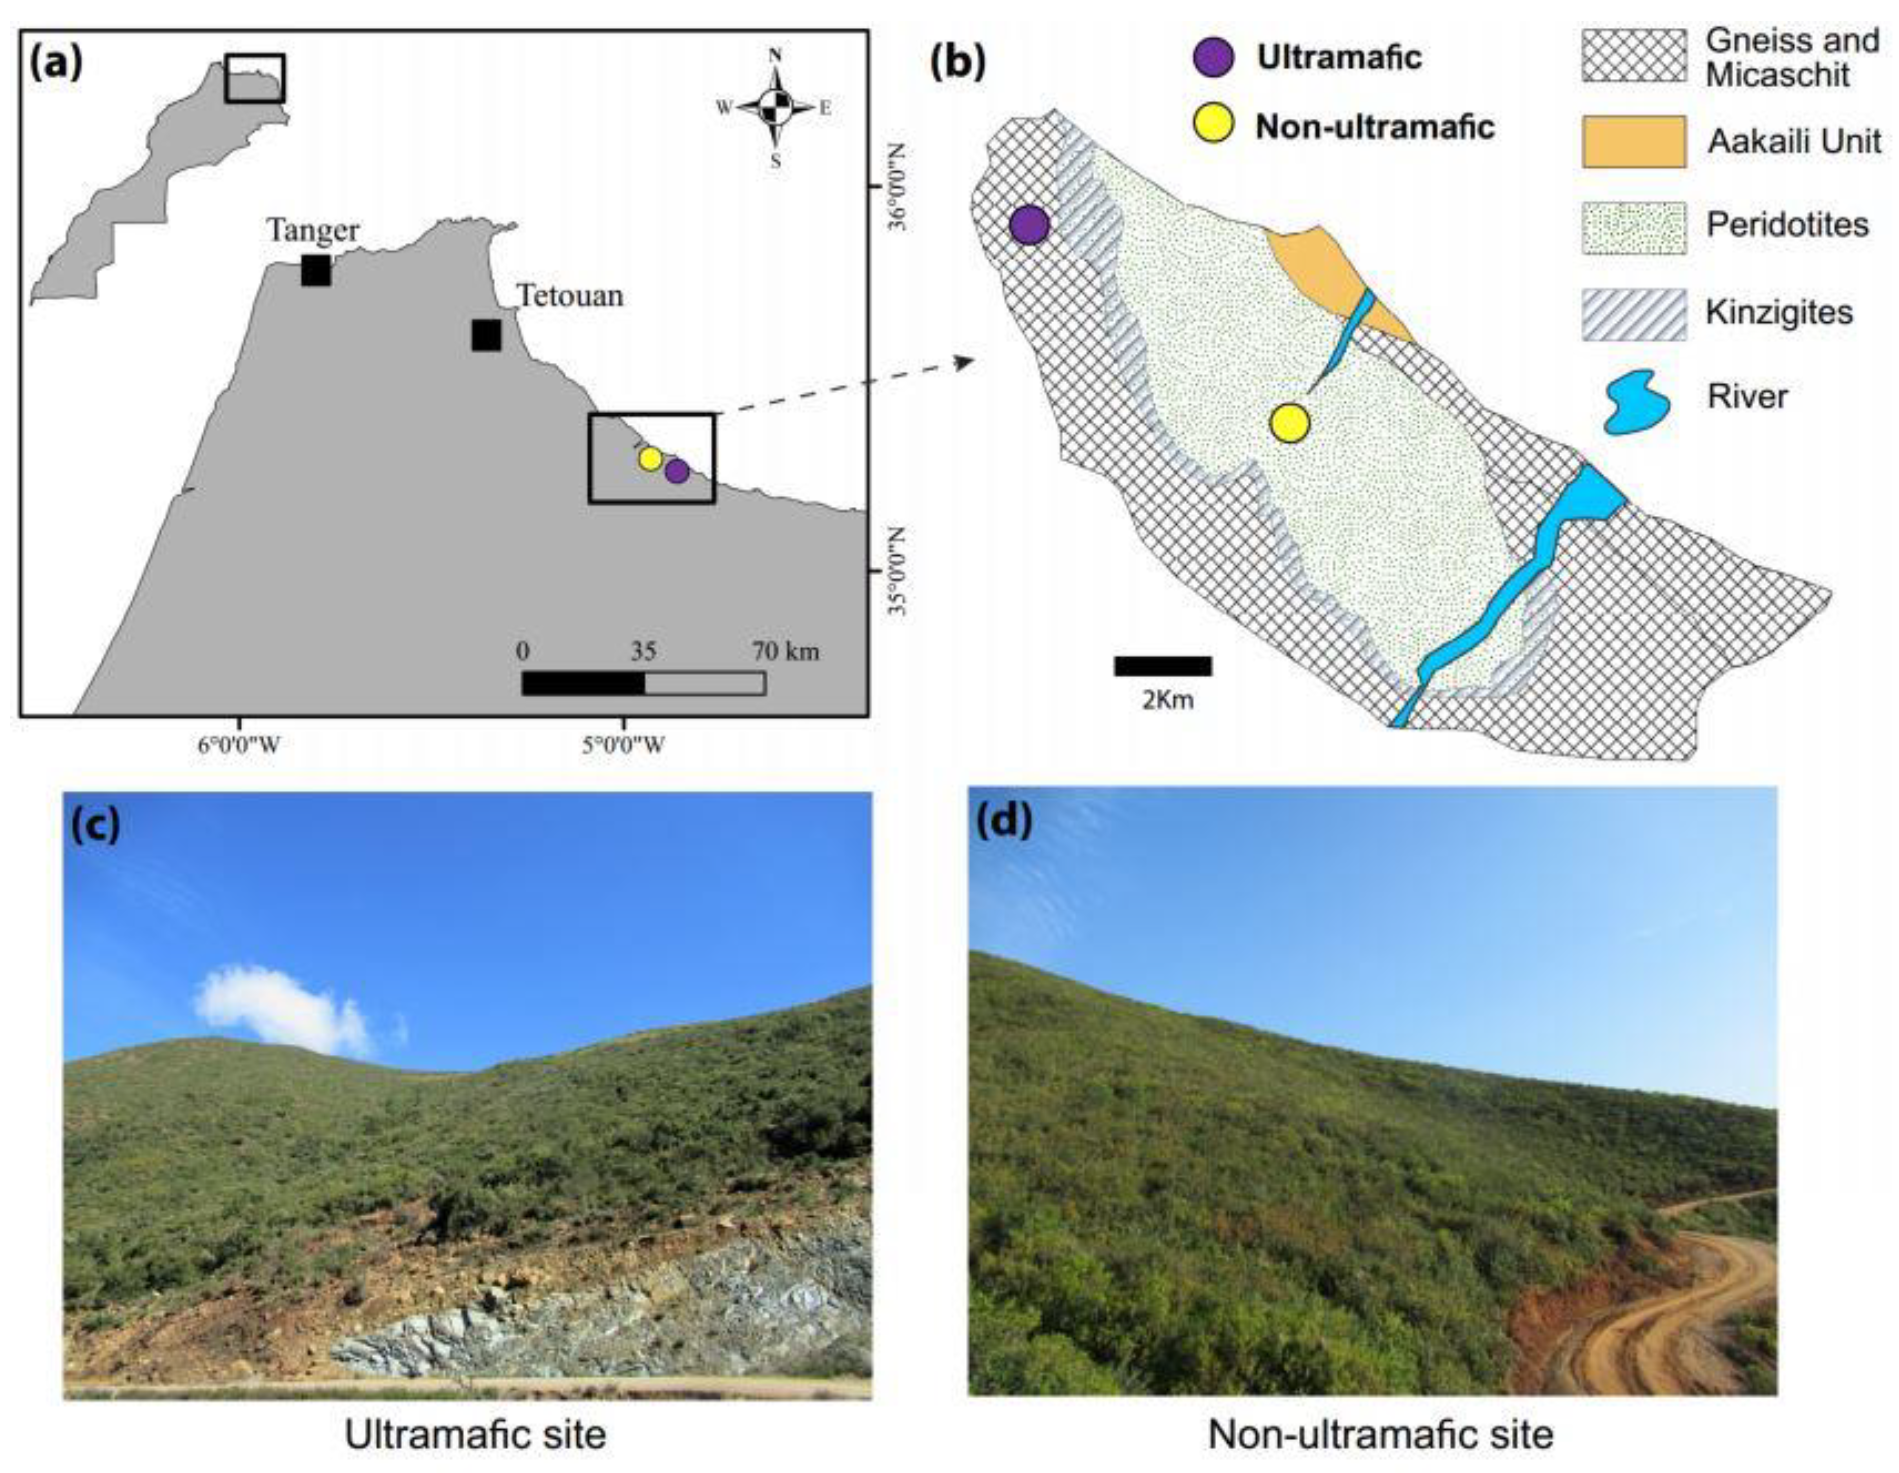
Figure 1. Location of Beni Bousera massif in northern Morocco, showing the distribution of the two study sites (a,b). (c) the ultramafic site, and (d) the non-ultramafic site.
Ecologies 05 00028 g001
Figure 2. Mean values of the characteristics and element concentrations in soils of ultramafic (U) and non-ultramafic (NU) sites. SM, Soil moisture; EC, electrical conductivity; C, total organic carbon; N, total nitrogen; P, available phosphorus; K, available potassium; Ca, exchangeable calcium; Mg, exchangeable magnesium; Ca:Mg ratio; Fe, assimilable iron; Cu, assimilable copper; and Zn, assimilable zinc. ** p < 0.01; *** p < 0.001. ns, non-significant.
Ecologies 05 00028 g002
Figure 3. Results of the principal components analysis (PCA) of the soil characteristics of the two study sites. The samples on the ultramafic site (purple circles) and those on the non-ultramafic site (yellow circles) are shown. SM, Soil moisture; EC, electrical conductivity; C, total organic carbon; N, total nitrogen; P, available phosphorus; K, available potassium; Ca, exchangeable calcium; Mg, exchangeable magnesium; Ca:Mg ratio; Fe, assimilable iron; Cu, assimilable copper; and Zn, assimilable zinc.
Ecologies 05 00028 g003
Figure 4. Comparative ridgeline density plots of (a) leaf fresh weight (LFW), (b) leaf dry weight (LDW), and (c) leaf area (LA) of the seven species located on ultramafic (U) (purple shapes) and non-ultramafic (NU) (yellow shapes) sites. * p < 0.05; ** p < 0.01; *** p < 0.001. ns, non-significant.
Ecologies 05 00028 g004
Figure 5. CSR ternary plots of the seven species located on both non-ultramafic (NU) (purple circles) and ultramafic (U) (yellow circles) sites. Individuals of each species are plotted. (a). Cistus atriplicifolius, (b) Cistus salviifolius L., (c) Erica arborea L., (d) Lavandula stoechas, (e) Phillyrea latifolia, (f) Quercus coccifera, and (g) Teucrium fruticans.
Ecologies 05 00028 g005
Table 1. The main characteristics of the ultramafic (U) and non-ultramafic (NU) study sites.
Study SitesUltramafic (U)Non-Ultramafic (NU)
Coordinates35.245°; −4.882°35.301°; −4.928°
Altitude (m)881490
Slope (°)2515
OrientationSoutheastSoutheast
GeologyPeridotitesKinzigte and Micaschist
AI **0.650.43
Aridity classSub-humid Semi-arid
Vegetation beltMesomediterraneanThermomediterranean
Phytosociological associationPhyllireo latifoliae-Quercetum cocciferae [65]Calicotomo intermediae-Tetraclinetum articulatae [64]
** AI (unitless), aridity index, calculated as MAP/PET (PET, potential evapotranspiration). The AI defines zones with AI < 0.05 as hyper-arid, 0.05 < AI < 0.2 as arid, 0.2 < AI < 0.5 as semi-arid, 0.5 < AI < 0.65 as dry sub-humid, 0.65 < AI < 0.80 as sub-humid, 0.8 < AI < 1.5 as humid, and AI > 1.5 as hyper-humid [66].
Table 2. Mean leaf fresh weight (LFW), leaf dry weight (LDW), and leaf area (LA) values of the seven species located on ultramafic (U) and non-ultramafic (NU) sites.
SpeciesSiteLFW (g)
Mean ± SD
LDW (g)
Mean ± SD
LA (cm2)
Mean ± SD
C. atriplicifoliusU0.286 ± 0.0420.117 ± 0.0179.75 ± 1.29
NU0.331 ± 0.0490.135 ± 0.0179.38 ± 1.28
F ANOVA4.83 *6.02 *0.40 ns
C. salviifoliusU0.179 ± 0.0250.064 ± 0.0116.0 ± 1.0
NU0.129 ± 0.0380.071 ± 0.0134.06 ± 0.8
F ANOVA12.07 **1.43 ns23.7 ***
E. arboreaU6.8 × 10−4 ± 1.6 × 10−53.8 × 10−4 ± 3.2 × 10−50.03 ± 0.01
NU7.6 × 10−4 ± 6.5 × 10−53.5 × 10−4 ± 1.6 × 10−50.03 ± 0.01
F ANOVA15.71 **1.05 ns0.06 ns
L. stoechasU0.014 ± 0.0040.005 ± 0.0010.55 ± 0.15
NU0.021 ± 0.0080.007 ± 0.0020.80 ± 0.34
F ANOVA5.94 *5.49 *4.59 *
P. latifoliaU0.261 ± 0.0440.112 ± 0.02010.84 ± 1.62
NU0.456 ± 0.0710.149 ± 002612.65 ± 1.64
F ANOVA54.54 ***79.10 ***6.18 *
Q. cocciferaU0.139 ± 0.0480.081 ± 0.0266.34 ± 1.51
NU0.179 ± 0.0380.081 ± 0.0165.47 ± 1.99
F ANOVA4.38 *0.005 ns1.21 ns
U0.117 ± 0.0300.056 ± 0.0115.07 ± 1.09
T. fruticansNU0.134 ± 0.0200.075 ± 0.0145.99 ± 1.08
F ANOVA2.05 ns10.86 **3.62 ns
* p < 0.05; ** p < 0.01; *** p < 0.001. ns, non-significant.
Table 3. Mean CSR scores of the seven species located on ultramafic (U) and non-ultramafic (NU) sites.
SpeciesSiteC%
Mean ± SD
S%
Mean ± SD
R%
Mean ± SD
Strategy
Class
C. atriplicifoliusU23.40 ± 1.7175.80 ± 2.571.00 ± 2.16S/CS
NU22.90 ± 1.7977.10 ± 1.790.00S/CS
Mean23.15 ± 1.7376.45 ± 2.260.50 ± 1.57S/CS
F ANOVA0.41 ns1.72 ns2.14 ns
C. salviifoliusU21.10 ± 3.3877.70 ± 3.681.30 ± 2.31S/CS
NU11.20 ± 1.5588.90 ± 1.370.00 S
Mean16.15 ± 5.6983.30 ± 6.350.65 ± 1.73S/CS
F ANOVA70.85 ***81.22 ***3.16 ns
E. arboreaU0.00 100.00 ± 0.00 0.00S
NU0.00 99.30 ± 1.640.70 ± 1.64 S
Mean0.00 99.65 ± 1.180.35 ± 1.18S
F ANOVA-1.83 ns1.83 ns
L. stoechasU3.00 ± 1.4188.80 ± 8.308.30 ± 7.86S
NU5.00 ± 2.3685.40 ± 10.529.80 ± 8.94S
Mean4.00 ± 2.1587.10 ± 9.399.05 ± 8.23S
F ANOVA5.29 *0.64 ns0.16 ns
P. latifoliaU23.00 ± 1.8375.70 ± 2.871.60 ± 2.22S/CS
NU22.80 ± 1.4877.20 ± 1.480.00S/CS
Mean22.90 ± 1.6276.45 ± 2.350.80 ± 1.74S/CS
F ANOVA0.07 ns2.16 ns5.19 *
Q. cocciferaU12.60 ± 2.5587.50 ± 2.680.00S
NU17.40 ± 2.1782.70 ± 2.110.00S/CS
Mean15.00 ± 3.3785.10 ± 3.400.00S
F ANOVA20.57 ***19.82 ***-
T. fruticansU14.10 ± 1.9185.60 ± 1.960.30 ± 0.95S
NU14.00 ± 1.3385.50 ± 2.760.50 ± 1.58S
Mean14.05 ± 1.6185.55 ± 2.330.40 ± 1.27S
F ANOVA0.02 ns0.009 ns0.12 ns
* p < 0.05; *** p < 0.001. ns, non-significant.
Disclaimer/Publisher’s Note: The statements, opinions and data contained in all publications are solely those of the individual author(s) and contributor(s) and not of MDPI and/or the editor(s). MDPI and/or the editor(s) disclaim responsibility for any injury to people or property resulting from any ideas, methods, instructions or products referred to in the content.