Article

Effects of Soil Properties on the Distribution of Woody Plants in Communally Managed Rangelands in Ngaka Modiri Molema District, North-West Province, South Africa

by
Makuété A. P. Tiawoun
*,
Pieter W. Malan
and
Alvino A. Comole
Unit for Environmental Sciences and Management, Department of Botany, North-West University Mafikeng Campus, Private Bag X 2046, Mmabatho 2735, South Africa
*
Author to whom correspondence should be addressed.
Ecologies 2022, 3(3), 361-375; https://doi.org/10.3390/ecologies3030027
Submission received: 6 July 2022 / Revised: 19 August 2022 / Accepted: 26 August 2022 / Published: 1 September 2022

Abstract

:
Soil properties are important drivers of species distribution and community structure in grassland. This study was undertaken to assess the influence of soil properties on woody plant distribution around six selected communally managed rangelands in the District. At each communal rangeland, a total of 25 plots of 20 × 20 m were surveyed to record the density, frequency, and composition of woody species. Soil samples were collected for thirteen soil variables. A Tukey HSD (Tukey’s honestly significant difference) post hoc test was used to compare soil properties and canonical correspondence analysis (CCA) to relate the soil properties to the woody species distribution. The study recorded a total of 17 woody species in 9 families. Fabaceae was the most dominant family, and Senegalia mellifera was the most abundant and frequent encroaching species. Most of the species were native, whereas Prosopis velutina was the only invasive alien species recorded. Senegalia mellifera, P. velutina, and Terminalia sericea were considered the most encroaching in the study sites, with densities exceeding 2000 TE ha-1 (i.e., tree equivalent). CCA results exhibited the strong effect of soil variables on the distribution of woody plant species. CCA ordination analyses showed that K was the most influential soil variable on woody species distributions, followed by Mg, CEC, Na, pH, sand, clay and silt. In terms of woody distribution, the CCA diagram showed similarities between Disaneng, Logageng and Tshidilamolomo. This study provides baseline information on woody species diversity for future management of this ecosystem.

1. Introduction

Encroachment by “aggressively” spreading woody plant species is a pernicious threat to the structure and function of ecosystems in arid and semiarid savannas worldwide [1,2]. In many parts of the world, savanna ecosystems are experiencing woody plant encroachment, which is reducing open herbaceous vegetation, and having a negative impact on livestock production [3,4,5].
Increases in the abundance and proliferation of woody plants have been reported in ecosystems worldwide [6], and most studies reveal that various factors are accountable for woody plant encroachment [7]. However, among other factors, soil properties play a significant role in shaping the physiognomic differentiation of vegetation [8] and may largely regulate the density and distribution of plant species. Especially in the early stages of woody encroachment, plant communities can be influenced by soil type. As several factors co-occur and interact to influence the pattern of woody plant abundance and composition [6], understanding the variability of the soil properties is vital to explain to what extent the patterns of distribution and the density of woody plants vary among locations. Environmental factors, especially soil characteristics, directly or indirectly shape natural plant communities [9]. However, the impact of soil properties on woody plant species remains limited and poorly understood in selected localities.
Across a wide range of environmental conditions, woody plants have increased in many parts of the savannas and grasslands of South Africa [10,11]. The dominance of “aggressive” woody species is currently a problem for rangeland productivity in savannas. It reduces biodiversity and exposes soil to erosion, limiting grass growth beneath tree canopies [12,13]. This alteration in the composition and structure of vegetation has increasingly accelerated since the 1940s in the savanna region found in the Kalahari basin, which includes the North-West and the Northern Cape Provinces [14]. It will likely continue under future climate change and global warming scenarios due to the interactive effects of natural and anthropogenic factors in many savanna ecosystems. According to several authors [15,16,17], ten to twenty million hectares (ha) of South African savannas are affected by woody species encroachment.
Woody plant encroachment is increasingly being documented from various arid and semiarid rangelands in South Africa [17,18,19,20]. Like other parts of South African rangelands, the vast areas of the communal rangelands in the North-West Province (NWP) play an essential role in the livelihoods of local inhabitants. However, despite the extensive amounts of grassland used for agriculture and conservation in the province, these rangelands are experiencing severe transformation by the encroachment of woody species. With the extent of woody encroachment in the NWP, it was necessary to estimate the effect of soil properties on the expansion of woody encroachment in several villages in the Ngaka Modiri Molema District. The idea of this study was to determine the woody density for many species to compare the extent of woody expansion for different species. This may assist in understanding the composition of woody species that contribute primarily to woody encroachment of the area. Understanding their proliferation based on the soil properties is crucial in managing the semiarid and arid rangeland ecosystems of South Africa.
This study, therefore, sought to assess the effects of soil properties on woody species density and distributional patterns around six selected villages as representatives of many parts of the communally managed areas of the Ngaka Modiri Molema District. There is, however, limited research examining the soil properties’ impacts on woody encroachment. Information on the effect of soil properties on density and the distribution patterns of woody plants may help to efficiently understand the general trend of woody plant structure and then put in place proper management schemes for the ecosystem and its associated services in the area. Hence, the objectives were (1) to assess woody plant density and examine the patterns of woody species distribution; (2) to examine the local soil characteristics of selected villages; and (3) to assess the relationships between the soil properties and the distribution of woody plant species.

2. Materials and Methods

2.1. Study Area

The study was carried out within the communally managed area in the Ngaka Modiri Molema Municipal District, formerly Molopo District, in the North-West Province (NWP) of South Africa. Six communally managed grazing lands, as indicated in Figure 1, were selected for this study. Communal grazing lands are communally owned and grazed throughout the year at a high intensity. Fences are absent and animals graze on a “free-for-all” basis [21]. The study area falls within the Eastern Kalahari Bushveld (SVK 1, Mahikeng Bushveld Vegetation type) [22], in semiarid areas of the Savanna Biome. According to Barnes [23], a semiarid savanna is characterized by a range of physiognomic vegetation types in the tropical summer rainfall regions of Africa. The Ngaka Modiri Molema District forms part of the southeastern edge of the Kalahari sand basin [24] and is 1000–1300 m above sea level [22]. The area receives mean annual precipitation (MAP) of 400–600 mm, with an average of 550 mm. The precipitation is predominantly received between November and March, also known as the summer-wet season in most parts of South Africa [25]. The annual average evaporation of the area is 2201 mm. The daily temperature (often 42 °C) is high during the summer months (November–February), and the winter months (May–July) are much colder (often −9 °C) [26]. According to a land type classification system based upon terrain form, soil pattern, and climate, the study area is situated in the Ah, Ai, and Ae land types [27]. The geology of the study area mainly represents Aeolian Kalahari sand of Tertiary to recent age of flat to sandy soils (>1.2 m deep) [22]. The land type concept has regularly provided a useful basis for the description of vegetation [28]. The study area is described as the Molopo Bushveld vegetation type, with a scattered tree layer characterized by selected woody species. The dominant woody species in the area include Dichrostachys cinerea, Grewia flava, Senegalia mellifera, Terminalia sericea, Vachellia erioloba, V. hebeclada, V. karroo and Ziziphus mucronata [22].

2.2. Experimental Design

2.2.1. Vegetation Sampling

Field surveys were conducted within five selected sites around each of the six villages in the Ngaka Modiri Molema Municipal District in the NWP of South Africa (Figure 1). The latitude and longitude of each village were recorded as follows: Disaneng (25°49′15″ S and 25°18′12″ E), Setlhabaneng (25°49′15″ S and 25°18′12″ E), Matloding (25°54′00″ S and 24°40′00″ E), Logageng (25°56′24″ S and 24°41′44″ E), Selosesha (29°10′52.16″ S and 26°49′14.43″ E) and Tshidilamolomo (25°49′60″ S and 24°40′60″ E). These villages have relatively similar ecological characteristics. Within each of the five sites near each village (n = 30 sites), five line transects of 200 m long facing the same direction were established. The first line transect was randomly placed and the subsequent ones were placed parallel to the first one at intervals of 50 m. At 25 m intervals along each transect, five plots of 20 × 20 m were placed. Each site had 25 plots corresponding to 10,000 m2, which is 1 hectare (ha) and a total of 150 plots (60,000 m2 = 6 ha) were established in the whole study area for sampling all rooted woody plant species. In each plot, woody species were identified, the number of individuals of each species was counted and tree height was measured using a clinometer. The height of plants was grouped into six height classes assigned at 1 m high increments: <1 m, 1–<2 m, 2–<3 m, 3–<4 m, 4–<5 m and ≥5 m.
The counts of the species in each height class from each plot were pooled for each site and then for each village. Woody plant density was measured by tree equivalents per unit area (hectare). The density of woody species was determined by converting the total number of individuals of each woody species encountered in all the sites (30 sites) to equivalents per hectare. The term “tree equivalent” (TE) is widely used in South Africa to express the woody plant population in a currency or unit [29]. A “tree equivalent” is defined as a 1.5 m high tree or shrub [29]. For example, a plant of 3 m in height represents 2 TE. To determine the proportional representation of each woody species relative to the entire plant community, mean density, relative frequency and relative abundance values for each woody species were calculated and expressed as a percentage. The following formula was used:
Density = (number of individuals of a species × factor/sample size in hectare) × 100
Frequency = (total no. of sites with a species/total no. of sites sampled) × 100
Relative frequency = (frequency of a species/sum frequencies of all species) × 100
Relative abundance = number of individuals of a species/total number of individuals of all species combined × 100

2.2.2. Soil Sampling

Within each of the 30 sites in the six villages, three replicates of soil samples from the upper 20 cm were collected from the centre of the sites, mostly where the species were denser. Samples collected in three selected 1 m × 1 m plots from the upper 20 cm were pooled homogeneously for each site, air-dried and sifted through a 2 mm mesh. Soil samples of about 2 kg from each site were carried in brown paper bags to the laboratory at the Agricultural Research Council–Institute for Soil, Climate and Water (ARC-ISCW) in Pretoria (South Africa) to determine soil properties. The analyses included particle size (clay, slit and sand content), determined using the hydrometer method [30], pH was determined using a glass electrode in a 1:2.5 soil–water suspension following equilibration for 16 h [31], organic matter (OM) was determined by the Walkley–Black method [32], and total nitrogen (TN) was determined by the micro-Kjeldhal technique [33]. Exchangeable K, Ca, Mg and Na were extracted with 1 N ammonium acetate at pH 7. Available phosphorus (P) was measured using the Bray analysis method [30]. Cation exchange capacity (CEC) was estimated by ammonium acetate extraction at pH 7 [34], and electrical conductivity (EC) was performed on a saturated extract of the soil [35]. Huyssteen et al. [36] describe the South African soil taxonomy as a morphogenetic system. According to Fey [37], the 73 soil forms of the South African classification can be placed into 14 groups (organic, humic, vertic, melanic, silicic, calcic, duplex, podzolic, plinthic, oxidic, gleyic, cumulic, lithic and anthropic). The classification of South African soils has nevertheless evolved.

2.3. Data Analysis

Data analysis started by summing up the densities of each woody species in every height class to determine the density of woody species. The averages of all the variables of the soil properties samples from each site were used for data analysis. The data obtained from the field survey were organized and recorded in a Microsoft Excel 2019 datasheet and analyzed using one-way analysis of variance (ANOVA), followed by Tukey’s honestly significant difference (HSD) post hoc tests to check for significant differences in the various variables measured. To examine the relationships between the distribution patterns of woody plant species and soils attributes, canonical correspondence analysis (CCA), run in PAST 4.03 Software was used. CCA is a constrained unimodal ordination method and has been widely used as an analytical method [38]. For data that did not require analysis, descriptive statistics were employed appropriately.

3. Results

3.1. Woody Species Composition and Abundance

In total, 17 woody species belonging to 9 families (Table 1) were recorded in selected sites in the communally managed rangelands in the Ngaka Modiri Molema District. A comparison between the six villages showed that Matloding had the largest number of species (11 species), while Selosesha had the least number of species (two species) (Table 1). Seven species (41.18%) belonged to the Fabaceae family, followed by the Malvaceae and Anacardiaceae families, which each had two species (23.53%). The remaining six families (Asteraceae, Boraginaceae, Capparaceae, Combretaceae, Rhamnaceae, Scrophulariaceae) were represented by only one species (35.29%) each. The current study shows that woody species in the Fabaceae family are widely distributed around the six villages, i.e., within the whole study area. However, among the Fabaceae family, Senegalia mellifera and Vachellia hebeclada were the most dominant. Moreover, Grewia flava (Malvaceae) and Ziziphus mucronata (Rhamnaceae) were also widely distributed in the whole area, whereas Boscia albitrunca, Buddleja saligna, Grewia occidentalis, Prosopis velutina, Searsia dentata, S. lancea, Tarchonanthus camphoratus, Terminalia sericea and Vachellia tortilis had a restricted distribution and each was only recorded in one study area (Table 1).
In Disaneng, eight woody species were recorded, with a total density of 3527 TE ha−1, but only Senegalia mellifera (1186 TE ha−1) and Dichrostachys cinerea (1109 TE ha−1) occurred at densities higher than 1000 TE ha−1. Their combined density (2295 TE ha−1) was 65% of the total woody plant density (Table 1).
Of the six species recorded in Logageng village, S. mellifera was the most abundant with a density of 2024 TE ha−1 representing 55% of the total density (Table 1).
Terminalia sericea was the most abundant woody species present in Matloding village and was present at a density of 2131 TE ha−1 (59% of the total density). Other woody species present were Vachellia hebeclada, V. erioloba, Senegalia mellifera, Buddleja saligna, Boscia albitrunca, Maytenus polyacantha, Dichrostachys cinerea, Grewia flava, G. occidentalis as well as Ziziphus mucronata (Table 1).
Senegalia mellifera was the sole abundant encroacher in Selosesha village with a density of 6967 TE ha−1, thus comprising 99.52% of the total density (Table 1). Vachellia erioloba was the only other woody species present and occurred at a density of 33 TE ha−1 (Table 1).
The most abundant woody species recorded in Setlhabaneng were Vachellia hebeclada and V. tortilis with densities of 1027 and 932 TE ha−1 respectively. The combined density for the remaining species (Grewia flava, Vachellia karroo, V. tortilis) accounted for a density of 1146 TE ha−1, which represented 37% of the total woody plant density (Table 1).
Prosopis velutina (8460 TE ha−1) was dominant in Tshidilamolomo and contributed to 96% of the total density of woody species in the area. Vachellia hebeclada, Grewia flawa and Searsia lancea were less abundant and were the only other species present (Table 1).
From the seventeen woody species encountered in the study sites, S. mellifera was the most abundant with a relative abundance value of 35.40%, followed by the alien invader, P. velutina with 29.16%, while Searsia dentata and Boscia albitrunca were the least abundant species with a relative abundance value of 0.11% and 0.12% respectively (Table 1).
Grewia flava and Vachellia hebeclada were the two woody species with the widest distribution and were present near five villages, followed by Senegalia mellifera and Vachellia erioloba near four villages each. Prosopis velutina, Searsia lancea and Boscia albitrunca were restricted to one village each (Table 1).

3.2. Vegetation Structure

3.2.1. Density and Frequency of Woody Plant Species among the Study Sites (n = 30)

The mean density for all woody species was variable and ranged from a low of 5.5 TE ha−1 to a high of 1827.3 TE ha−1 (Table 1). Senegalia mellifera was recorded as the densest woody plant species with a mean density of 1828.33 TE ha−1, followed by Prosopis velutina at a mean density of 1410 TE ha−1. Prosopis velutina, however, was restricted to only one site (Tshidilamolomo) and was recorded at a density of 8460 TE ha−1 (Table 1). Not all woody species were a manifestation of woody encroachment, but S. mellifera in Disaneng, Logageng and Selosesha, P. velutina in Tshidilamolomo and Terminalia sericea in Matloding with densities exceeding 2000 TE ha−1 were identified as woody encroachment in the survey sites (Table 1). The highest combined woody plant density was recorded in Tshidilamolomo at 8810 TE ha−1 while the lowest was in Disaneng at 3527 TE ha−1 (Table 1).
In the current study, the relative frequency of woody species varied between 0.86% and 17.39% (Table 1). The most frequently distributed woody species encountered in the study area was Senegalia mellifera with a relative frequency of 17.39%, followed by Vachellia hebeclada (15.65%), V. karroo (10.43%), Ziziphus mucronata (9.56%), Dichrostachys cinerea (7.82%) and Grewia flava (6.95%). Boscia albitrunca, Searsia dentata and Searsia lancea recorded the lowest relative frequency (0.86%) and were rarely observed in the whole study area (Table 1).

3.2.2. The Combined Density of all Woody Plant Species of Different Height Class Distribution at Various Sites (n = 30)

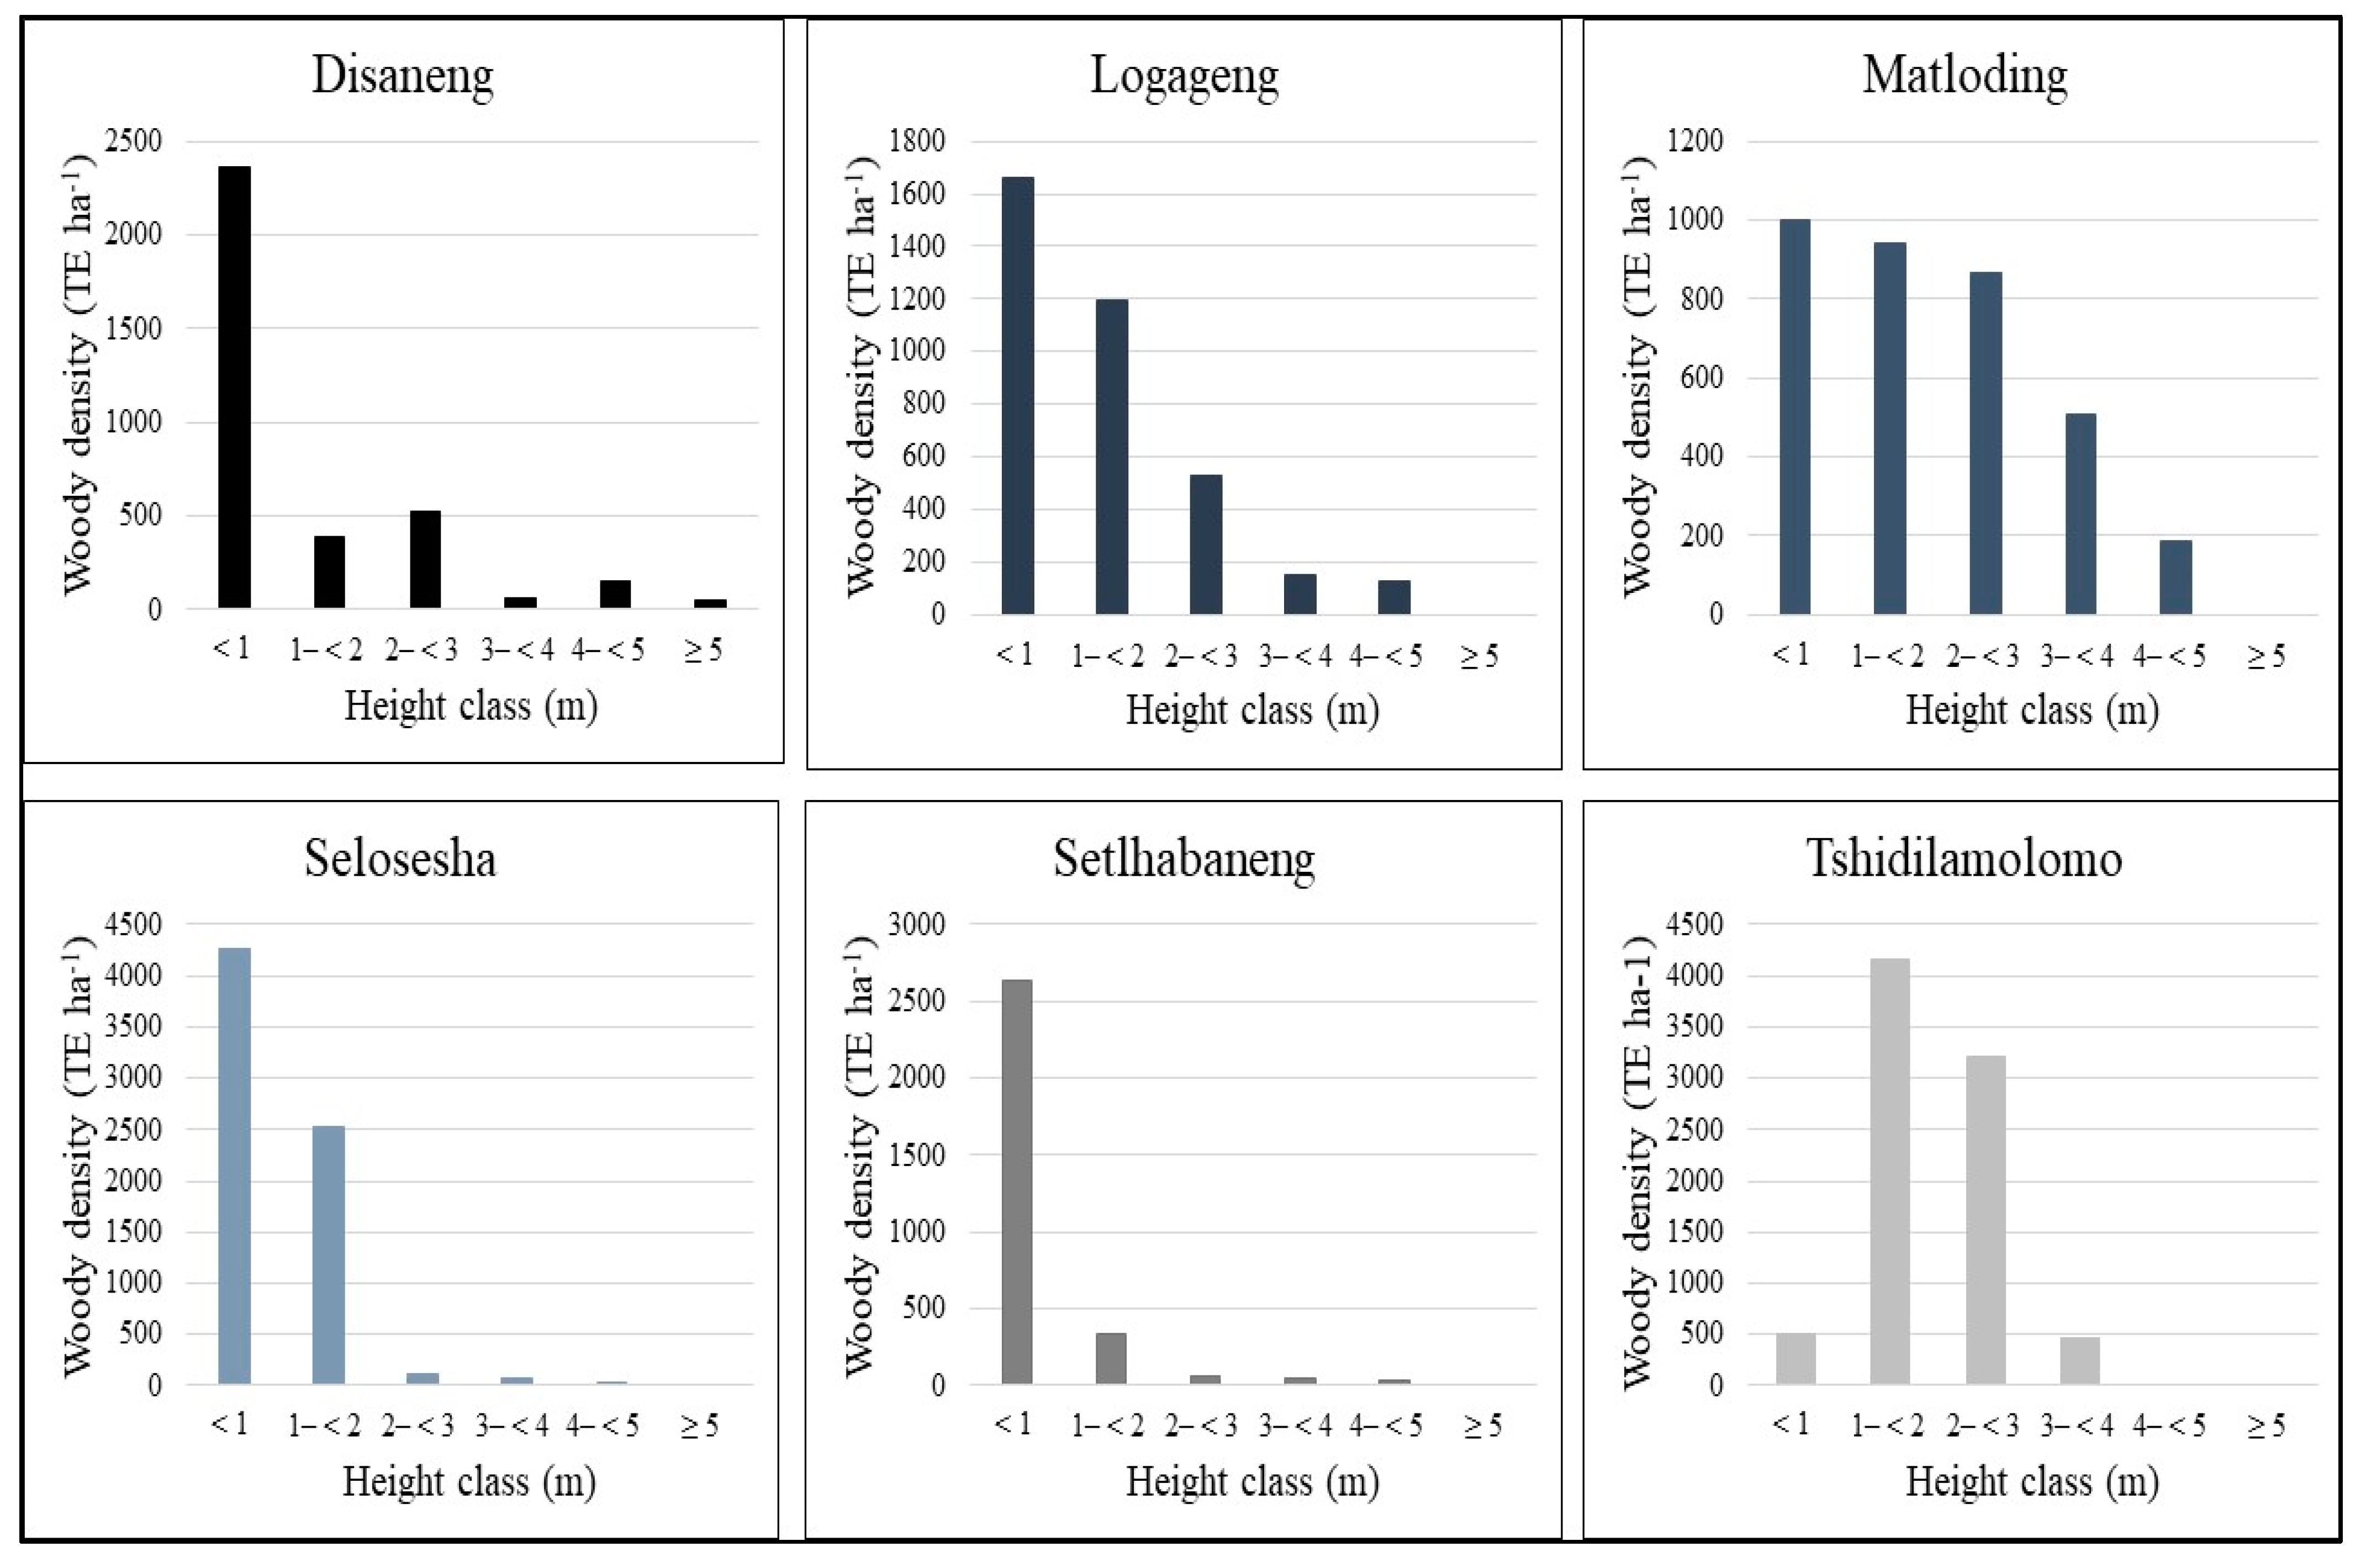
The combined density of woody species by different height class distributions encountered in each of the six villages exhibited a higher number of individuals per hectare at the lowest height class and progressively, the numbers declined with increasing height classes, except in Tshidilamolomo, where the number of individuals was recorded in the intermediate height class (1–<2 m, 2–<3 m) (Figure 2). Hence, the distribution by height classes in five of the selected villages shows a reverse “J” shaped curve, whereas in Tshidilamolomo village a bell-shaped distribution pattern is shown (Figure 2). Disaneng village was the only site where woody plants exceeding 5 m in height occurred (Figure 2).
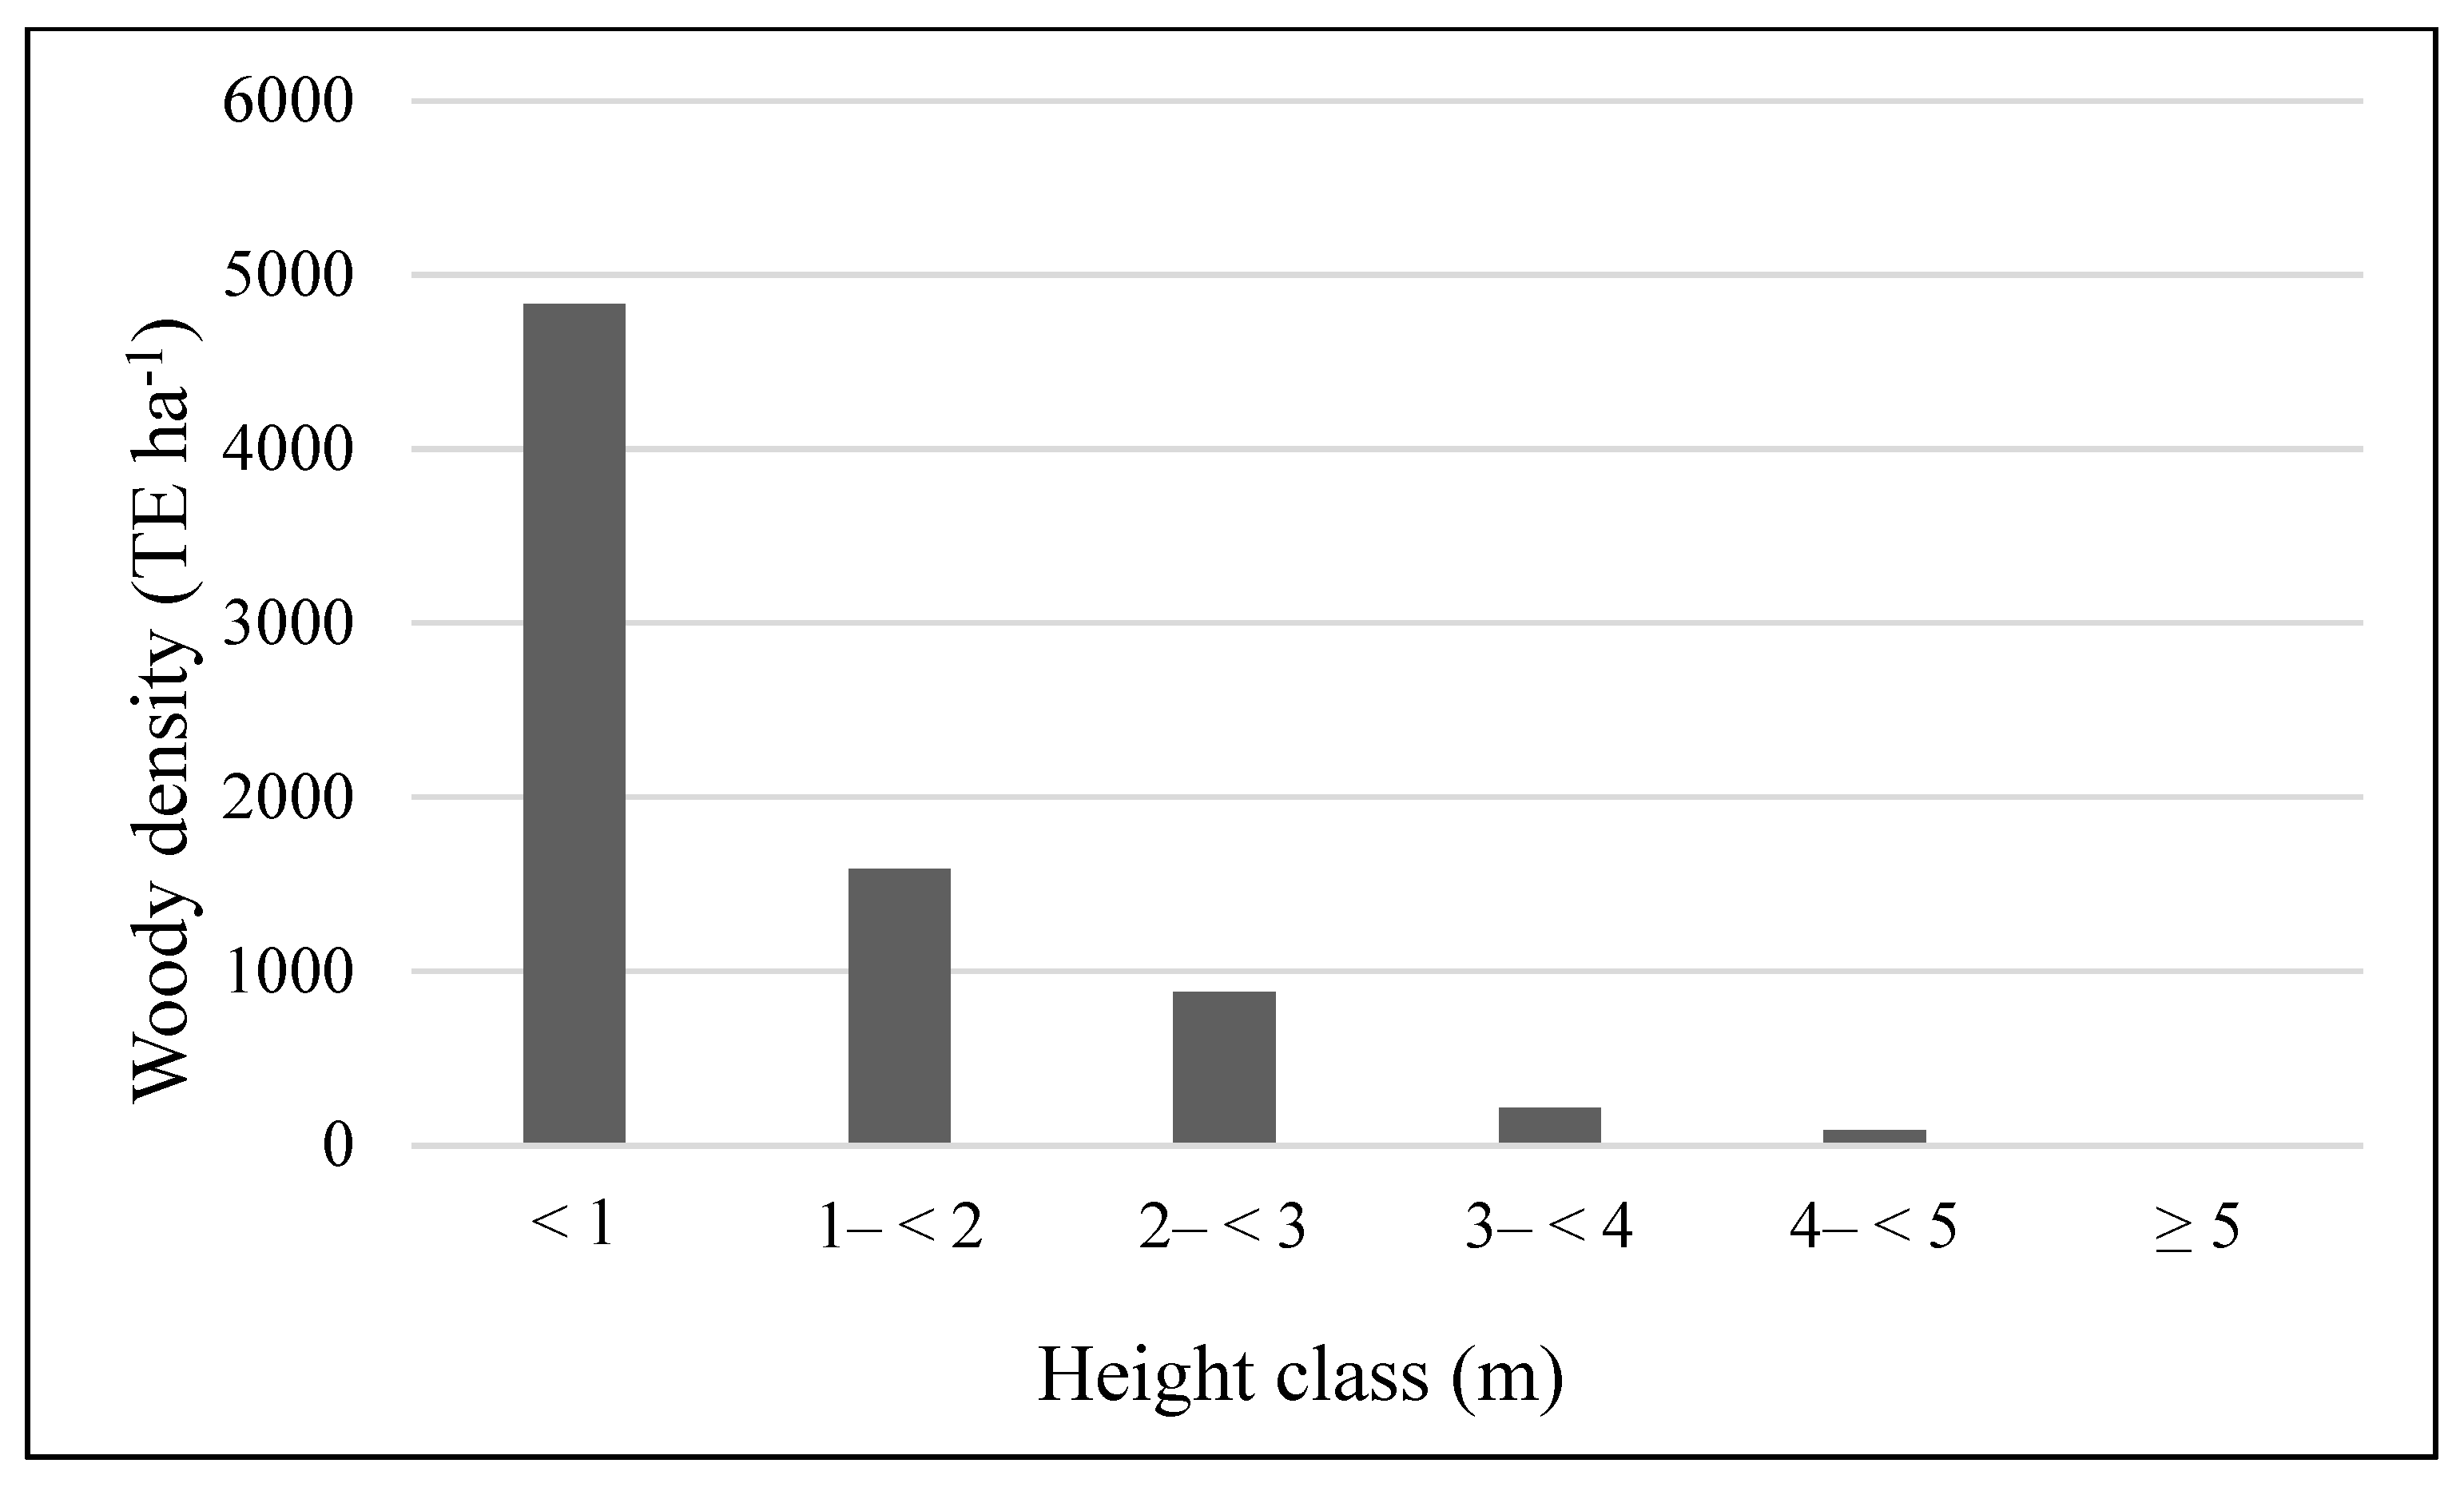
A total woody plant density of 29,706 TE ha−1 of all woody species was recorded within the 30 sites near the six villages, representing a mean density of 4951 TE ha−1 in the whole study area (Table 1). Woody plants lower than 1 m showed the highest density (Figure 3) with a total density of 4834 TE ha−1 in the study area, while trees higher than 5 m recorded the lowest density and were recorded at a mean density of 9 TE ha−1 (Figure 3). In general, the population structure of all woody plant species in different height class distributions showed a typical reversed J-shaped curve (Figure 3).
According to Table 2, the densities of woody species decreased as height classes increased across all the selected villages, except for the height classes 1–<2 and 2–<3 m at Tshidilamolomo village, where the density was higher than the density of trees lower than 1 m. The highest woody plant densities were recorded in height classes 1–<2 and 2–<3 m in Tshidilamolomo, with a significant difference (p < 0.05) between the five other villages. However, there was a significant difference in all the height class densities between the villages (p < 0.05) (Table 2).

3.3. Variation in Soil Properties between the Six Selected Communally Managed Rangelands

The results showed that all six villages differed significantly in all soil properties (Table 3). The sand proportion of the six villages varied between 59.2% (Setlhabaneng) and 90.16% (Tshidilamolomo). However, the sand content between Tshidilamolomo and Matloding soils was not significantly different (p > 0.01), as well as between Disaneng and Logageng soils (Table 3). In contrast, the silt and clay proportions were relatively higher in Setlhabaneng compared to the five other villages (Table 3). The soil’s sand content represented the greatest proportion of soil texture in all the selected sites. Soil chemical properties varied between the six villages. Soil pH, EC, Ca, Mg and P were all significantly higher in Tshidilamolomo than in the five other villages (Table 3). Soil Mg, Na, K, CEC, OM and TN were significantly higher in Setlhabaneng than in the five other villages. The soil samples of all study sites were acidic except in Tshidilamolomo (Table 3).

3.4. Effect of Soil Properties on Tree Species Distribution

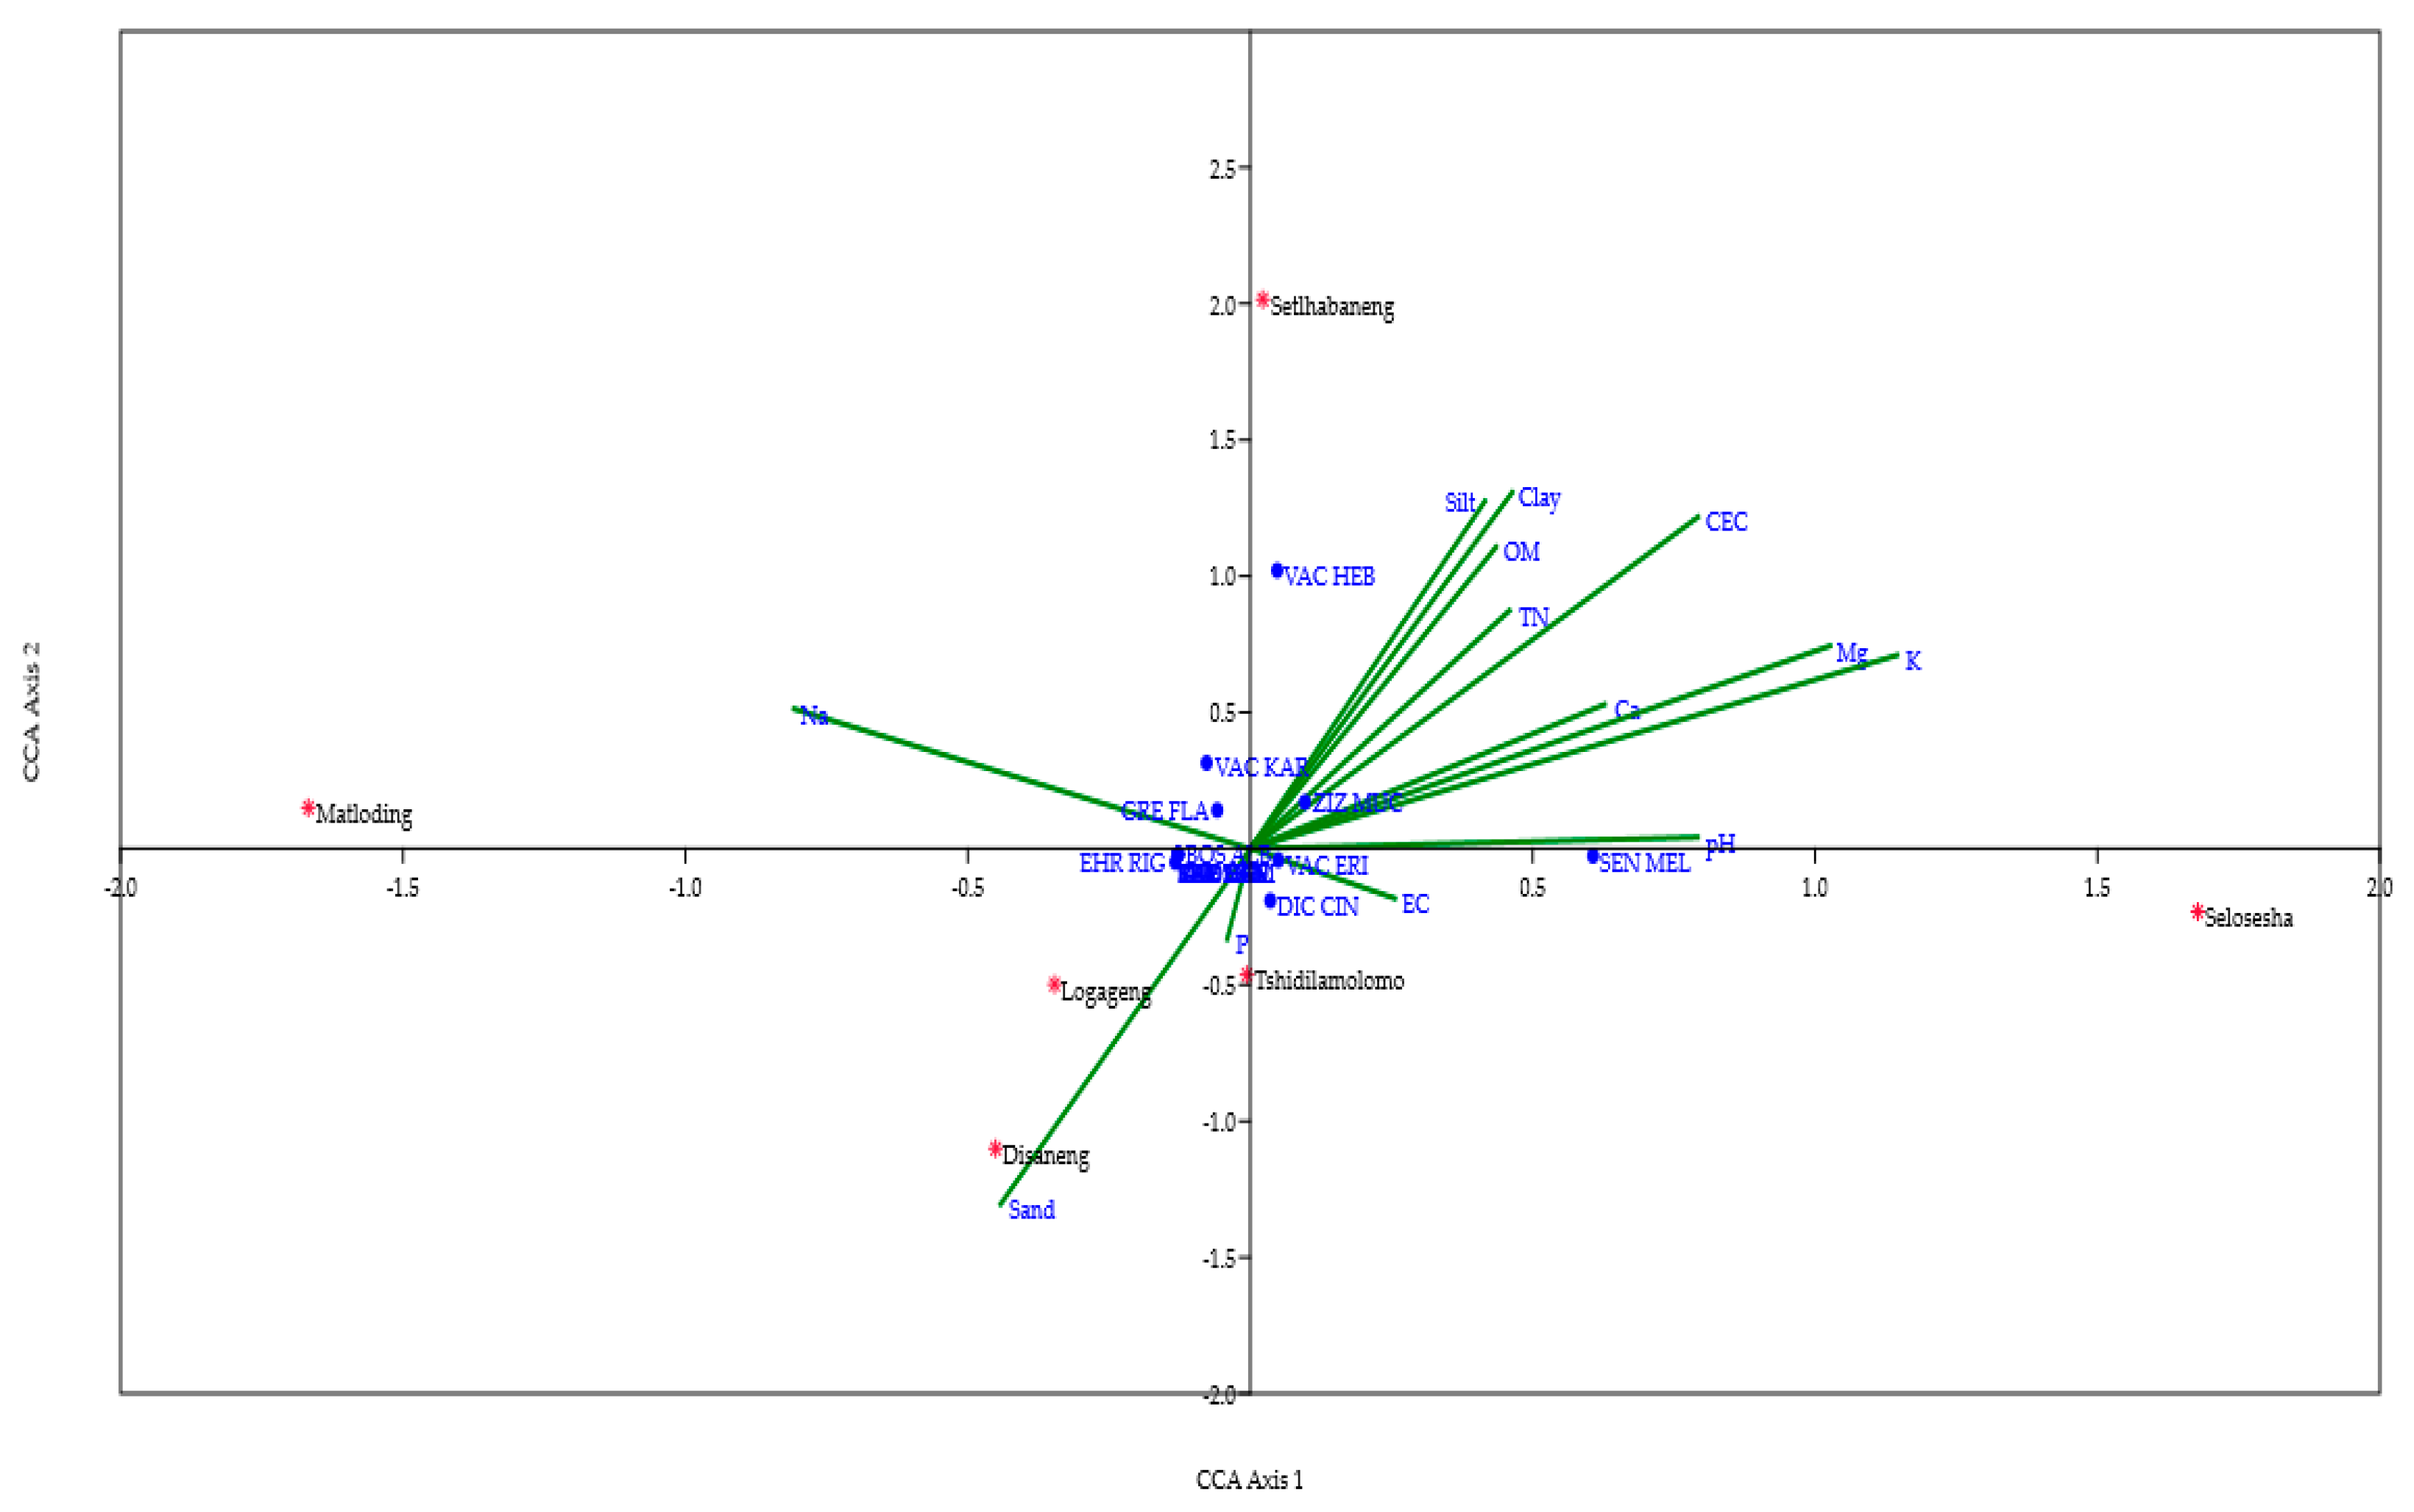
The canonical correspondence analysis (CCA) triplot ordination was applied to find out the relationships between soil properties, plant species and their site preferences (Figure 4). The star shape showed different study areas (villages), while the lines indicated soil properties (environmental variables) and the dots revealed the woody species. Potassium (K) with the longest line had the most important influence on species distribution. It showed a remarkable effect on Ziziphus mucronata. Mg, Ca, CEC, TN, OM, clay and silt also showed an important effect on Z. mucronata (Figure 4). Grewia flava, Searsia dentata and Erhetia rigida exhibited high affinity for Na, while Dichrostachys cinerea and Vachellia karroo showed higher preferences for EC and the distribution of Senegalia mellifera was greatly influenced by pH (Figure 4). Overall, the species nearest the lines were strongly influenced by the nearby soil properties, while the species far away from the line were less affected by the environmental factors. Vachellia hebeclada was the species least affected by soil properties (Figure 4).
The distance between different species within the same study area showed the degree of similarity. Results from CCA indicated an overlap in woody species distribution in parts of Disaneng and Logageng that were influenced by sand and phosphorus (Figure 4). Many other species were found closer to each other indicating that their abundance was the same and affected by that particular gradient in the very same way in that particular area. With increased K, Mg and CEC there was also an obvious increasing pH trend along the first axis. From left to right, distribution patterns of plant communities varied along the first axis.

4. Discussion

4.1. Woody Species Composition and Abundance

Various woody species are encroaching on different sites in the Ngaka Modiri Molema District. The field survey of this study demonstrated that 17 woody species were recorded in the selected sites near the six villages are potentially a threat to the Ngaka Modiri Molema Municipal District rangelands in the North-West Province of South Africa. Woody plants from the Fabaceae family were identified to be the most prevalent. This is in accordance with the findings of Van Rooyen [39], who studied the composition and structure of woody vegetation in a thickened and controlled bushveld savanna in the Molopo, South Africa. Woody plants from the Fabaceae family were the most dominant in the whole study area, which is the third largest woody plant family in southern Africa [40]. The dominance of plants from this family could be because of habitat adaptation and favorable environmental conditions that encourage pollination, dispersal and eventually establishment of species. Senegalia mellifera was the most abundant and frequent encroaching woody species across the study area. This result is in line with previous studies in the southern Kalahari savanna, where Dreber et al. [41] revealed that S. mellifera is one of the most abundant and frequently occurring species in the area. Moreover, S. mellifera has been reported as an increasing woody species and the most serious encroaching species of semiarid savannas in the NWP of South Africa [42].
The abundance of S. mellifera could be explained by its large amount of seed production [43], which increases its ability to establish in high numbers. It is thus clear that the abundance of S. mellifera in the Ngaka Modiri Molema District should concern ecologists and rangeland managers. Although Prosopis velutina was less frequent in the study area, it was, however, the next abundant species in the area and was found principally in Tshidilamolomo village. The abundance of P. velutina could be due to the existence of dry watercourses in this village, resulting in the suppression of herbaceous plants. In general, there was a difference in species composition among the different villages, and this could be due to microclimatic factors. According to Scholes and Walker [44], tree establishment in the semiarid savanna ecosystems is generally determined by soil moisture, soil characteristics, landscape position and species-specific growth requirements. These outcomes are corroborated by the findings of Sankaran et al. [45] who described the deep sandy soil in the Kalahari as favorable for woody vegetation establishment and growth. It was, therefore, noticeable that S. mellifera was the most abundant encroaching species in the Ngaka Modiri Molema District, whereas P. velutina was evident but virtually restricted to the riparian areas, especially around Tshidilamolomo village.

4.2. Vegetation Structure

4.2.1. The Density and Frequency of Woody Plant Species among the Study Sites

Senegalia mellifera in Logageng and Selosesha, Prosopis velutina in Tshidilamolomo and Terminalia sericea in Matloding, with densities exceeding 2000 TE ha−1, were considered an indication of considerable woody encroachment in the survey sites. According to Moore and Odendaal [46], woody plant densities exceeding 2000 TE ha−1 will almost totally suppress grass growth. In the case of S. mellifera, in Selosesha and P. velutina in Tshidilamolomo, woody plant densities far exceeded 2500 TE ha−1 and according to Roquest [12], a tree cover of 40% or a density of 2400 TE ha−1 has been considered as the borderline between a non-encroached and an encroached condition. This was supported by Gemedo-Dalle et al. [47] who found that an area is “moving” towards bush encroachment when the woody plant density exceeds 2400 TE ha−1. Moreover, Richter et al. [48] reported that a tree density of 2500 TE ha−1 is an indication of a highly encroached condition. The results of this research, therefore, indicate that not all woody species were a manifestation of woody encroachment in the survey sites. However, S. mellifera and P. velutina were the two most abundant woody encroachers in the area. Hence, these two species may have a negative impact on herbaceous production and livestock production by forming impenetrable thickets.
The high relative frequency exhibited by S. mellifera in different sites denotes their wide range of niche preferences and ability to establish over a large area, which is in agreement with [49,50], who reported that S. mellifera is frequently regarded as the main encroacher in overgrazed savannas in southern Africa. As indicated by Dreber et al. [41], S. mellifera was most frequently observed with healthy recruitment across the study areas in the southern Kalahari. Alien plant invasions alter an indigenous community’s composition and deplete species diversity. This was observed around Tshidilamolomo, where a few woody species with very low densities occupied the survey site, dominated by Prosopis velutina.

4.2.2. Woody Plant Height Class Distribution

Based on the combined height class distributions, the woody plant density near Tshidilamolomo showed a “problem” of regeneration with lower densities in lower height class distributions. Whereas woody plant density within the sites around the five other villages showed good potential for plant recruitment. However, the general pattern of height class distribution of woody species around the selected villages in the Ngaka Modiri Molema District showed an inverted J shape where woody species had the highest number of individuals/ha in low height classes and a gradual decrease towards the higher classes. This is in line with the work of [41], who say that S. mellifera and Grevia flava have high densities at lower height classes in the southern Kalahari savannas.
As observed in the current study, the highest woody plant densities in the lower height classes could result from anthropogenic activities such as the selective harvesting of matured or big tree species for fuel-wood consumption, construction materials and charcoal production, as noted by Twine and Holdo [51]. These authors [51] stated that the impact of deforestation and wood removal on tree populations and wood resources is strongly influenced by the resprouting ability of trees. It could also be due to competition with trees in other height classes for available soil moisture and nutrients. Overall, the population structure due to the combined woody species in different height classes shows good potential for reproduction and recruitment in the whole study area. This corresponds with [52,53], who revealed the ongoing recruitment of species because woody species in the lower height classes will be recruited into the larger size classes to replace the die-offs.

4.3. Variation in Soil Properties between the Six Selected Communally Managed Rangelands

In this study, the soil properties differed significantly across sites, and this could reveal that the study sites near the villages covered a wide range of different soil conditions. The spatial and temporal heterogeneity of soil properties in natural soil environments commonly has significant effects on habitat quality for different vegetation types [8]. Soils may affect the structure and diversity of plant communities indirectly by affecting parameters such as tree height and basal area in a particular area [54]. Soil properties, according to Jafari et al. [55], can influence vegetation growth patterns by influencing the distribution and density of woody plant species in savanna ecosystems. The vegetation structure depends on the soil characteristics and the types of species present within a particular area [56].

4.4. Effect of Soil Properties on Tree Species Distribution

The use of canonical correspondence analysis (CCA) determined patterns in the species distribution relating to the measured soil attributes [57]. The soil properties that significantly influenced the distribution of species in the selected sites in rangelands in Ngaka Modiri Molema District were almost of equal length (K, Mg, CEC, Na, pH, sand, clay and silt). These results showed that these variables were almost of equal importance to the distribution of woody species. Among the 13 soil properties analyzed, only the above eight variables strongly influenced the distribution of some woody species. As reported in other studies, environmental variables are not the only factors controlling plant distribution [58,59].
Some soil properties showed positive associations, while sand, P and Na indicated negative relationships. This implies that tree species differ in their affinity and tolerance for soil properties [60]. For instance, the distribution of Prosopis velutina was mainly found in Tshidilamolomo where water conditions were predominant. Soil properties play a fundamental role in determining plant community composition and distribution [61], but they vary due to environmental differences between sites.
The results of the CCA ordination revealed that available potassium (K) in the soil was an important factor that influenced the distribution patterns of woody species. Lyu et al. [62] also concluded that K played a determinative role in the distribution and diversity of plants in the forest. Plant species differ in their environmental requirements, and each species shows an individualistic response to environmental gradients.

5. Conclusions

The selected sites in the Ngaka Modiri Molema district are characterized by a variety of woody plant species. A total of 17 woody plant species were identified from the Fabaceae family, which was the most dominant family recorded and Senegalia mellifera was identified as the most abundant and frequent encroaching species. Most of the species were native, whereas Prosopis velutina was the only invasive alien species. In this study, CCA was applied to assess relationships between soil properties, plant species and their site preferences. The CCA results exhibited the strong effect of soil variables on the distribution of woody plant species. The analysis revealed that potassium (K) was the most influential variable responsible for woody species distribution. The outputs of the current study provide an important baseline evaluation of species and soil relationships. Vegetation and soil are the most visible resources of rangelands and understanding the existing vegetation and the distribution patterns of woody species can enhance our knowledge of species coexistence. To better understand the processes involved in the soil–vegetation relationship in the Ngaka Modiri Molema District, more sampling plots and more environmental factors with multiple analyses need to be further studied to develop a management strategy in the area.

Author Contributions

P.W.M. and M.A.P.T. designed the study, P.W.M. and A.A.C. conducted the fieldwork, M.A.P.T. conducted all analyses, P.W.M. and M.A.P.T. wrote the original draft, P.W.M., M.A.P.T. and A.A.C. read and approved the final manuscript. All authors have read and agreed to the published version of the manuscript.

Funding

This research received no external funding.

Institutional Review Board Statement

Not applicable.

Informed Consent Statement

Not applicable.

Data Availability Statement

The data presented in this study will be made available upon acceptance for publication.

Acknowledgments

We acknowledge the financial support provided by North-West University. Sammy Bett is also thanked for compiling the study area map, and A.J. Malan for language editing the manuscript.

Conflicts of Interest

The authors declare no conflict of interest.

References

  1. Drake, J.A.; Mooney, H.A.; di Castri, F.; Groves, R.H.; Kruger, F.J.; Rejmanek, M.; Williamson, M.D. (Eds.) Biological Invasions: A Global Perspective; John Wiley: Chichester, UK, 1989. [Google Scholar]
  2. Reynolds, J.F.; Stafford Smith, D.M. Global Desertification: Do Humans Cause Deserts? Dahlem Workshop Report 88; Dahlem University Press: Berlin, Germany, 2002; p. 437. [Google Scholar]
  3. Van Auken, O.W. Shrub invasions of North American semi-arid grasslands. Annu. Rev. Ecol. Evol. Syst. 2000, 31, 197–215. [Google Scholar] [CrossRef]
  4. Eldridge, D.J.; Bowker, M.A.; Maestre, F.T.; Roger, E.; Reynolds, J.F.; Whitford, W.G. Impacts of shrub encroachment on ecosystem structure and functioning: Towards a global synthesis. Ecol. Lett. 2011, 14, 709–722. [Google Scholar] [CrossRef] [PubMed]
  5. Anadón, J.D.; Sala, O.E.; Turner, B.L.; Bennett, E.M. Effect of woody plant encroachment on livestock production in North and South America. Proc. Natl. Acad. Sci. USA 2014, 111, 12948–12953. [Google Scholar] [CrossRef]
  6. Archer, S.R.; Andersen, E.M.; Predick, K.I.; Schwinning, S.; Steidl, R.J.; Woods, S.R. Woody plant encroachment: Causes and consequences. In Rangeland Systems: Processes, Management and Challenges; David, E., Briske, D., Eds.; Springer: Cham, Switzerland, 2017; pp. 25–84. [Google Scholar]
  7. Pule, H.T.; Tjelele, J.T.; Tedder, M.J. The effects of abiotic factors in South African semi-arid grassland communities on Seriphium plumosum L. density and canopy size. PLoS ONE 2018, 13, e0202809. [Google Scholar] [CrossRef] [PubMed]
  8. Rodrigues, P.M.S.; Gonçalves, C.E.; Schaefer, R.; Silva, J.O.; Júnior, W.G.F.; dos Santos, R.M.; Neri, A.V. The influence of soil on vegetation structure and plant diversity in different tropical savannic and forest habitats. J. Plant Ecol. 2018, 11, 226–236. [Google Scholar] [CrossRef]
  9. May, R.M. An Overview: Real and Apparent Patterns in Community Structure: Ecological Communities Conceptual Issues and the Evidence; Strong, D.R., Jr., Simberloff, D., Abele, L.G., Thistle, A.B., Eds.; Princeton University Press: Princeton, NJ, USA, 1984; pp. 3–16. [Google Scholar]
  10. Khavhagali, V.P.; Bond, W.J. Increase of woody plants in savannah ecosystems. Grassroots Newsl. Grassl. Soc. S. Afr. 2008, 8, 21–24. [Google Scholar]
  11. Buitenwerf, R.; Bond, W.J.; Stevens, N.; Trollope, W.S.W. Increased tree densities in South African savannas: >50 years of data suggests CO2 as a driver. Glob. Chang. Biol. 2012, 18, 675–684. [Google Scholar] [CrossRef]
  12. Roquest, K.G.; O’ Connor, T.G.; Watkinson, A.R. Dynamics of shrub encroachment in an African savanna: Relative influences of fire, herbivore, and rainfall and density dependence. J. Appl. Ecol. 2001, 38, 268–280. [Google Scholar] [CrossRef]
  13. Liniger, H.P.; Mekdaschi Studer, R. Sustainable Rangeland Management in Sub-Saharan Africa–Guidelines to Good Practice; Centre for Development and Environment (CDE), University of Bern: Bern, Switzerland, 2019. [Google Scholar]
  14. Hoffman, M.T.; Ashwell, A. Nature Divided: Land Degradation in South Africa; University of Cape Town Press: Cape Town, South Africa, 2001. [Google Scholar]
  15. Trollope, W.S.W.; Hobson, F.O.; Donckwerts, J.E.; Van Niekerk, J.P. Encroachment and control of undesirable plants. In Veld Management in the Eastern Cape; Danckwerts, J.E., Teague, W.R., Eds.; Department of Agriculture and Water Supply: Pretoria, South Africa, 1989; pp. 73–89. [Google Scholar]
  16. Ward, D. Do we understand the causes of bush encroachment in African Savannas? Afr. J. Range Forage Sci. 2005, 22, 101–105. [Google Scholar] [CrossRef]
  17. Wigley, B.J.; Bond, W.J.; Hoffman, M.T. Bush encroachment three contrasting land-use practices in mesic South African savanna. Afr. J. Ecol. 2009, 47, 62–70. [Google Scholar] [CrossRef]
  18. O’Connor, T.G.; Puttick, J.R.; Hoffman, M.T. Bush encroachment in southern Africa: Changes and causes. Afr. J. Range Forage Sci. 2014, 31, 67–88. [Google Scholar] [CrossRef]
  19. Ward, D.; Hoffman, M.T.; Collocott, S.J. A century of woody plant encroachment in the dry Kimberley savanna of South Africa. Afr. J. Range Forage Sci. 2014, 31, 107–121. [Google Scholar] [CrossRef]
  20. Stevens, N.; Erasmus, B.F.N.; Archibald, S.; Bond, W.J. Woody encroachment over 70 years in South African savannahs: Overgrazing, global change or extinction aftershock? Phil. Trans. R. Soc. B 2016, 371, 20150437. [Google Scholar] [CrossRef]
  21. Malan, P.W.; Tiawoun, M.A.P.; Molatlhegi, K.S.; Materechera, S.A. Effect of encroaching woody plant species on soil nutrients and selected soil chemical properties in communally managed semiarid savanna grazing lands in the North-West province, South Africa. S. Afr. J. Plant. Soil. 2021, 38, 27–35. [Google Scholar] [CrossRef]
  22. Mucina, L.; Rutherford, M.C. (Eds.) The vegetation of South Africa, Lesotho and Swaziland. In Strelitzia 19; South African National Biodiversity Institute (SANBI): Pretoria, South Africa, 2006; ISBN 10: 1-919976-21-3. [Google Scholar]
  23. Barnes, M.E. Effects of large herbivores and fire on the regeneration of Acacia erioloba woodlands in Chobe National Park, Botswana. Afr. J. Ecol. 2001, 39, 340–350. [Google Scholar] [CrossRef]
  24. Dougill, A.J.; Thomas, A.D. Kalahari sand soils: Spatial heterogeneity, biological soil crusts and land degradation. Land Degrad. Dev. 2004, 15, 233–242. [Google Scholar] [CrossRef]
  25. Thomas, D.S.G.; Sporton, D.; Perkins, J. The environment impact of livestock ranches in the Kalahari, Botswana: Natural resource use, ecological change and human response in a dynamic dryland system. Land Degrad. Dev. 2000, 11, 327–341. [Google Scholar] [CrossRef]
  26. Mahikeng Local Municipality. Mahikeng Local Municipality Audited Annual Report; City Council of Mahikeng: Mmabatho, South Africa, 2013. [Google Scholar]
  27. Land Type Survey Staff. Land Type Survey Staff. Land types of the maps SE27/20 Witdraai, 2720 Noenieput, 2722 Kuruman, 2724 Christiana, 2820 Upington, 2822 Postmasburg. In Memoirs on the Agricultural Natural Resources of South Africa; Department of Agriculture and Water Supply: Pretoria, South Africa, 1986; Volume 3, pp. 1–185. [Google Scholar]
  28. Bezuidenhout, H. The classification, mapping and description of the vegetation of the Rooipoort Nature Reserve, Northern Cape, South Africa. Koedoe 2009, 51, 69–79. [Google Scholar] [CrossRef]
  29. Bashour, I.I.; Sayegh, A.H. Methods of Analysis for Soils of Arid and Semi-Arid Regions; Food and Agriculture Organization of the United Nations: Rome, Italy; American University of Beirut: Beirut, Lebanon, 2007; pp. 1–128. [Google Scholar]
  30. Hagos, M.G.; Smit, G.N. Soil enrichment by Acacia mellifera subsp. detinens on nutrient poor sandy soil in a semi-arid southern African savanna. J. Arid. Environ. 2005, 61, 47–59. [Google Scholar] [CrossRef]
  31. FSSA (Fertilizer Society of South Africa). Fertilizer Society of South Africa Fertilizer Handbook, 5th ed.; Publ. Fertility. Society of South Africa, Lynnwood Ridge: Pretoria, South Africa, 2003. [Google Scholar]
  32. Nelson, D.W.; Sommers, L.E. Total carbon, organic carbon and organic matter. In Methods of Soil Analysis Part 2; Page, A.L., Ed.; Agronomy Monographs 9.ASA and SSSA: Madison, WI, USA, 1982; pp. 539–579. [Google Scholar]
  33. Van Reeuwijk, L.P. Procedures for Soil Analysis; International Soil Reference and Information Center (ISRIC): Wageningen, The Netherlands, 2002. [Google Scholar]
  34. Rowell, D.L. Soil Science: Methods and Applications; Routledge Publications: New York, NY, USA, 2014. [Google Scholar]
  35. Khorsandi, F.; Yazdi, F.A. Estimation of saturated paste extracts’ electrical conductivity from 1:5 soil/water suspension and gypsum. Commun. Soil Sci. Plant Anal. 2011, 42, 315–321. [Google Scholar] [CrossRef]
  36. Van Huyssteen, C.W.; Turner, D.P.; Le Roux, P.A.L. Principles of soil classification and the future of the South African system. S. Afr. J. Plant Soil. 2013, 30, 23–32. [Google Scholar] [CrossRef]
  37. Fey, M. Soils of South Africa; Cambridge University Press: Cape Town, South Africa, 2010. [Google Scholar]
  38. Leps, J.; Simlauer, P. Multivariate Analysis of Ecological Data Using CANOCO; Cambridge University Press: Cambridge, UK, 2003. [Google Scholar]
  39. Van Rooyen, S.E. Composition and structure of woody vegetation in thickened and controlled bushveld savanna in the Molopo, South Africa. In Magister Scientiae in Environmental Sciences; Potchefstroom Campus of the North-West University: Potchefstroom, South Africa, 2016. [Google Scholar]
  40. Dingaan, M.; du Preez, P.J. Vachellia (Acacia) karroo Communities in South Africa: An Overview. In Pure and Applied Biogeography; Intechopen: London, UK, 2018. [Google Scholar] [CrossRef]
  41. Dreber, N.; Van Rooyen, S.E.; Kellner, K. One savanna, many shapes: How bush control affects the woody layer in the southern Kalahari. S. Afr. J. Bot. 2019, 125, 511–520. [Google Scholar] [CrossRef]
  42. Morgenthal, T.; Meyer, H.; Kellner, K.; Nauss, T. A sentinel-based analysis of vegetation patterns of a semi-arid savanna in South Africa. In Proceedings of the 46th Annual Meeting of the Ecological Society of Germany, Austria and Switzerland, Marburg, Germany, 5–9 September 2016. [Google Scholar] [CrossRef]
  43. Joubert, D.F.; Smit, G.N.; Hoffman, M.T. The influence of rainfall, competition and predation on seed production, germination and establishment of an encroaching Acacia in an arid Namibian savanna. J. Arid Environ. 2013, 91, 7–13. [Google Scholar] [CrossRef]
  44. Scholes, R.J.; Walker, B.H. An African Savanna-Synthesis of the Nylsvley Study; Cambridge University Press: Cambridge, UK, 1993. [Google Scholar]
  45. Sankaran, M.; Ratnam, J.; Hanan, N.P. Tree–grass coexistence in savannas revisited–insights from an examination of assumptions and mechanisms invoked in existing models. Ecol. Lett. 2004, 7, 480–490. [Google Scholar] [CrossRef]
  46. Moore, A.; Odendaal, A. Die ekonomiese implikasie van bosverdigting en bosbeheer soos van toepassing op n speenkalfproduksietelsel in die doringbosveld van die Molopo gebied. Afr. J. Range Forage Sci. 1987, 4, 139–142. [Google Scholar]
  47. Gemedo-Dalle, T.; Maass, B.L.; Isselstein, J. Rangeland condition and trend in the semi-arid Borana lowlands, southern Oromia, Ethiopia. Afr. J. Range Forage Sci. 2006, 23, 49–58. [Google Scholar] [CrossRef]
  48. Richter, C.G.F.; Snyman, H.A.; Smit, G.N. The influence of tree density on the grass layer of three semi-arid savanna types of southern Africa. Afr. J. Range Forage Sci. 2001, 18, 103–109. [Google Scholar] [CrossRef]
  49. Tolsma, D.J.; Ernst, W.H.O.; Verweij, R.A.; Vooijs, R. Seasonal variation of nutrient concentrations in a semiarid savanna ecosystem in Botswana. J. Ecol. 1987, 75, 755–770. [Google Scholar] [CrossRef]
  50. Kraaij, T.; Ward, D. Effects of rain, nitrogen, fire, and grazing on tree recruitment and early survival in bush-encroached savanna. Plant Ecol. 2006, 186, 235–246. [Google Scholar] [CrossRef]
  51. Twine, W.C.; Holdo, R.M. Fuelwood sustainability revisited: Integrating size structure and resprouting into a spatially realistic fuelshed model. J. Appl. Ecol. 2016, 53, 1766–1776. [Google Scholar] [CrossRef] [Green Version]
  52. Mwavu, E.N.; Witkowski, E.T.F. Population structure and regeneration of multiple use tree species in a semi-deciduous African tropical rainforest: Implications for primate conservation. Forest Ecol. Manag. 2009, 258, 840–849. [Google Scholar] [CrossRef]
  53. Helm, C.V.; Witkowski, E.T.F. Characterising wide spatial variation in population size structure of a keystone African savanna tree. Forest Ecol. Manag. 2012, 263, 175–188. [Google Scholar] [CrossRef]
  54. Yang, Q.; Zhang, H.; Wang, L.; Ling, F.; Wang, Z.; Li, T.; Huang, J. Topography and soil content contribute to plant community composition and structure in subtropical evergreen-deciduous broadleaved mixed forests. Plant Divers. 2021, 43, 264–274. [Google Scholar] [CrossRef] [PubMed]
  55. Jafari, M.; Zare Chahouki, M.A.; Tavili, A.; Azarnivand, H.; Zahedi Amiri, G. Effective environmental factors in the distribution of vegetation types in Poshtkouh rangelands of Yazd Province, Iran. J. Arid Environ. 2004, 56, 627–641. [Google Scholar] [CrossRef]
  56. Breshears, D.D.; Barnes, F.J. Interrelationships between plant functional types and soil moisture heterogeneity for semiarid landscapes within the grassland/forest continuum: A unified conceptual model. Landsc. Ecol. 1999, 14, 465–478. [Google Scholar] [CrossRef]
  57. Ter Braak, C.J.E. Partial canonical correspondence analysis. In Classification and Related Methods of Data Analysis; Bock, H.H., Ed.; North-Holland: Amsterdam, The Netherlands, 1988; pp. 551–558. [Google Scholar]
  58. Vitousek, P.; Carla, D.; Loope, L.; Westbrooks, R. Biological invasions as global environmental change. Am. Sci. 1996, 84, 468–478. [Google Scholar]
  59. Bailey, R.G. Ecoregions: The Ecosystem Geography of the Oceans and Continents; Springer: New York, NY, USA, 2014. [Google Scholar]
  60. Mathew, M.M.; Majule, A.E.; Sinclair, F.; Marchant, R. Effect of Soil Properties on Tree Distribution across an Agricultural Landscape on a Tropical Mountain, Tanzania. Open J. Ecol. 2016, 6, 264–276. [Google Scholar] [CrossRef]
  61. Jones, M.M.; Tuomisto, H.; Borcard, D.; Legendre, P.; Clark, D.B.; Olivas, P.C. Explaining variation in tropical plant community composition: Influence of environmental and spatial data quality. Oecologia 2008, 155, 593–604. [Google Scholar] [CrossRef]
  62. Lyu, Q.; Liu, J.; Liu, J.; Luo, Y.; Chen, L.; Chen, G.; Zhao, K.; Chen, Y.; Fan, C.; Li, X. Response of plant diversity and soil physicochemical properties to different gap sizes in a Pinus massoniana plantation. PeerJ 2021, 9, e12222. [Google Scholar] [CrossRef]
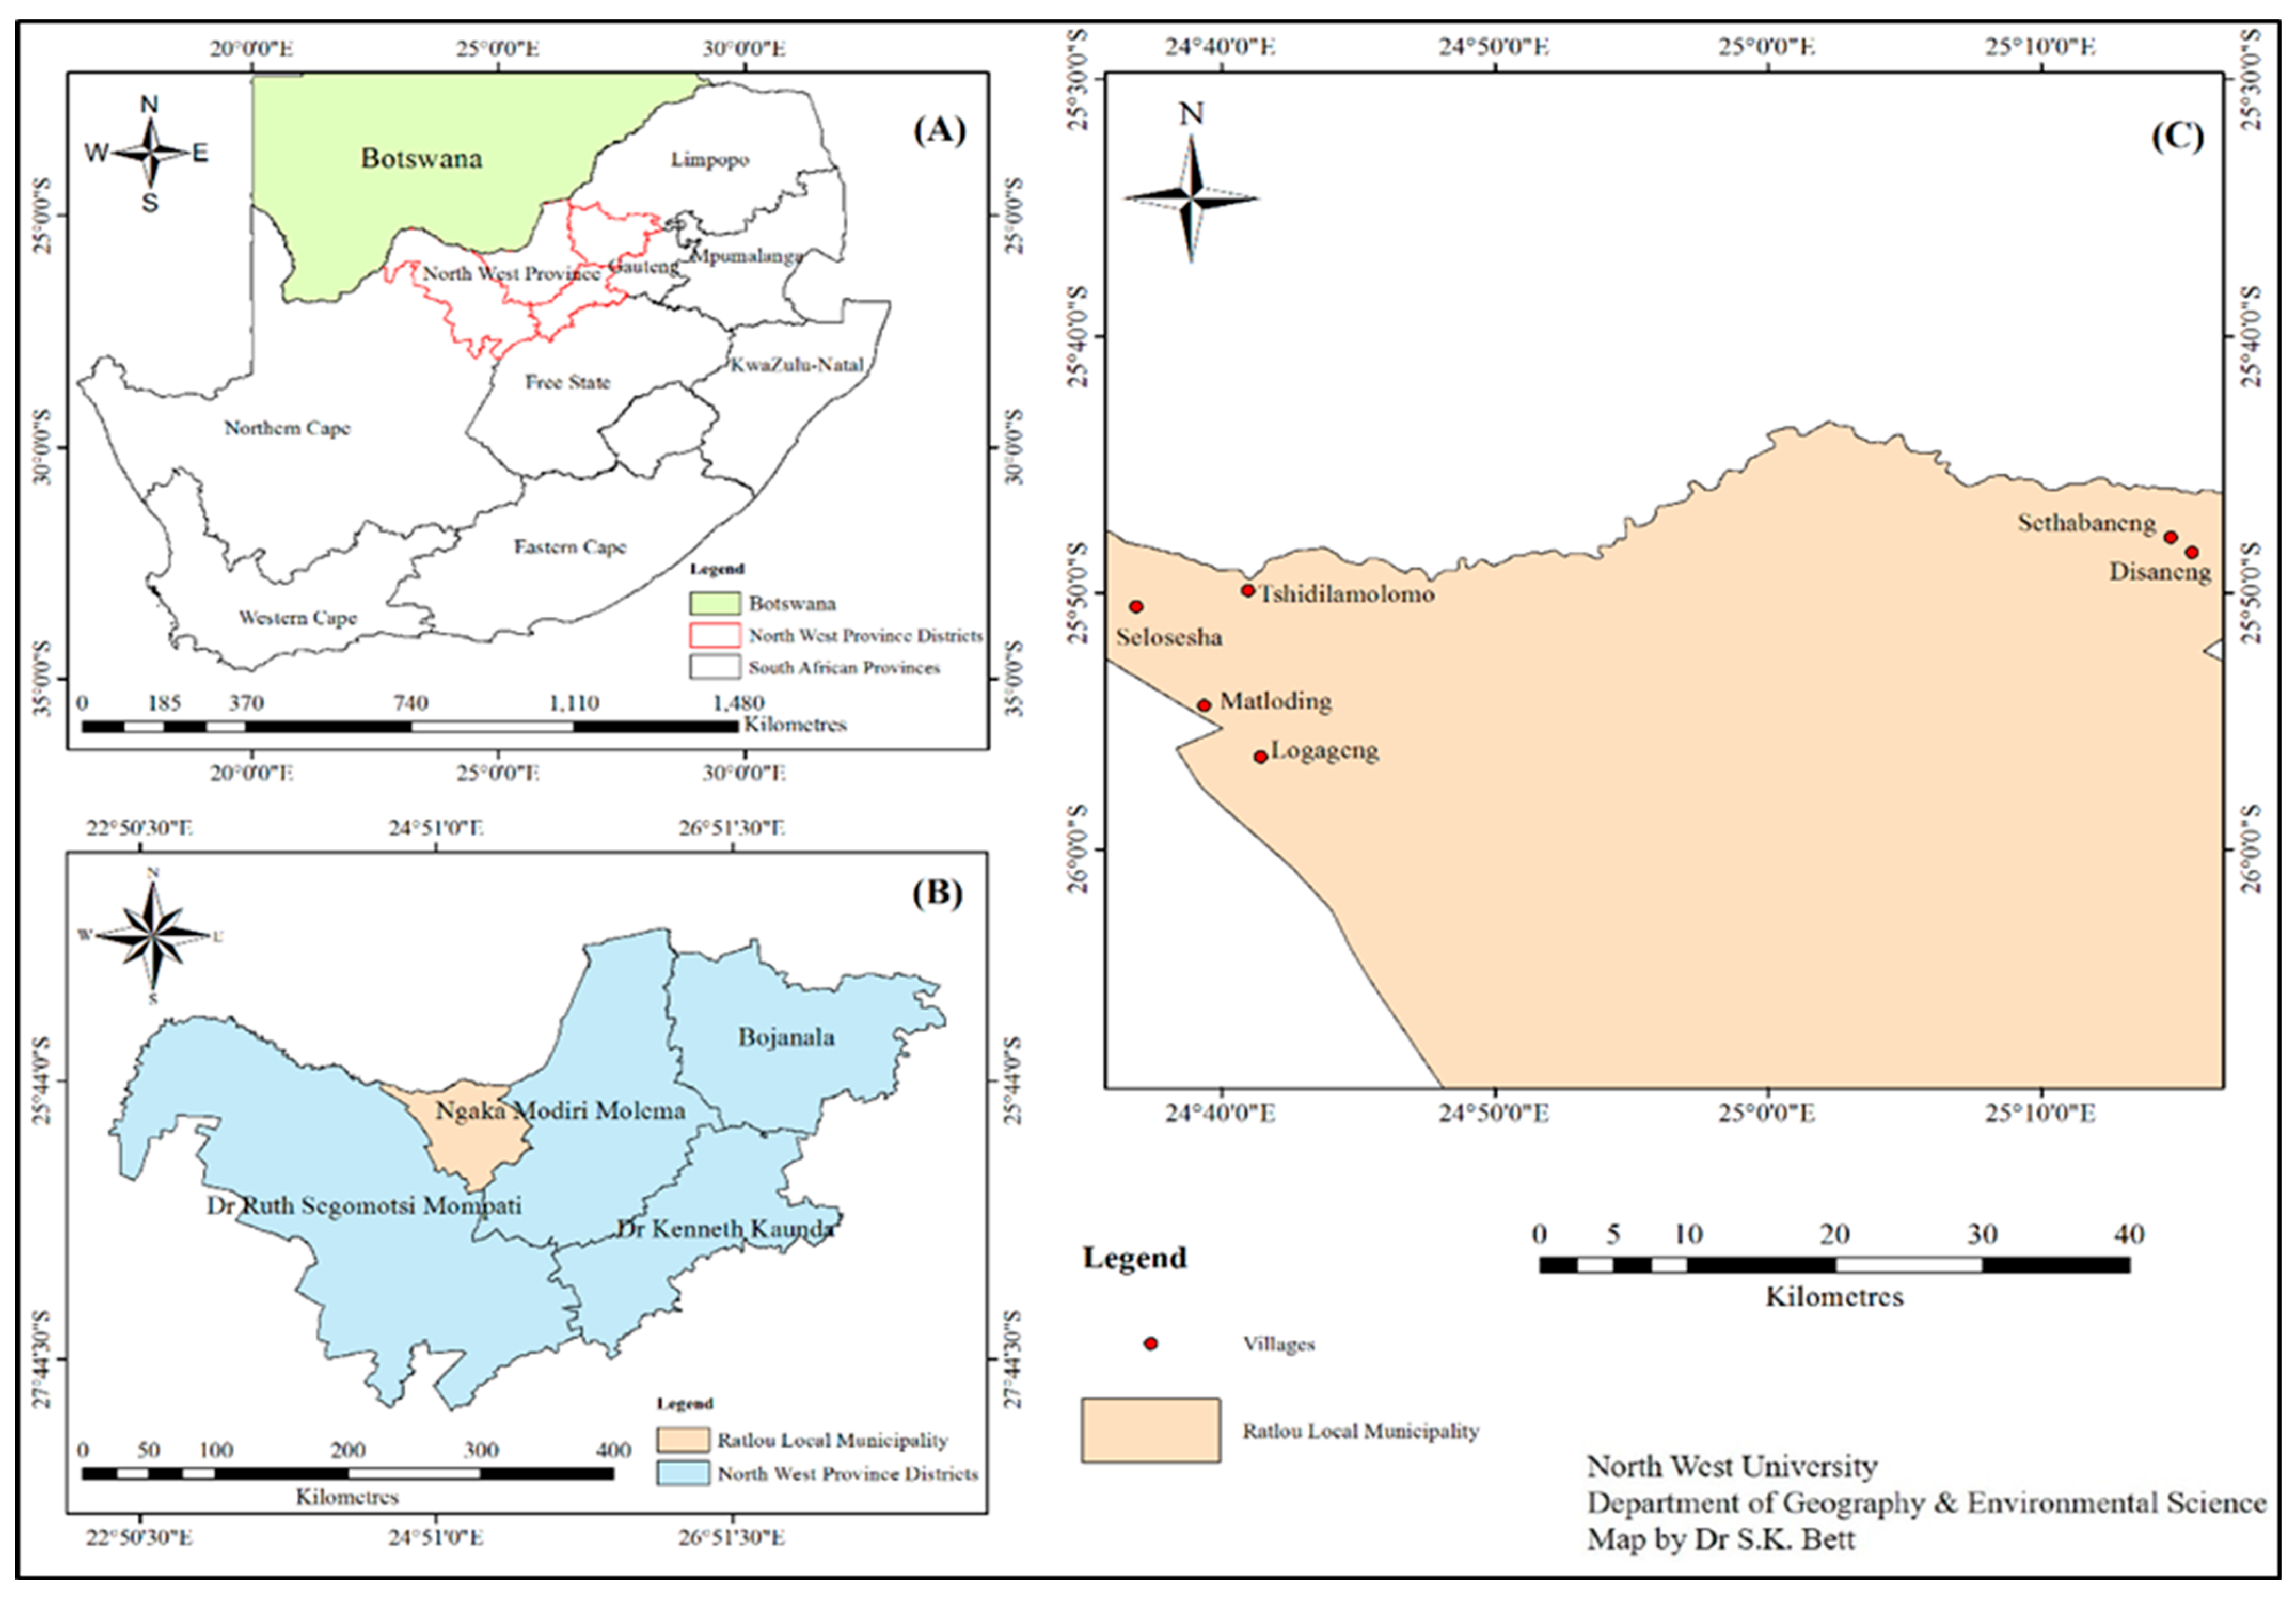
Figure 1. The map shows six selected villages in the Ngaka Modiri Molema District (C) in North-West Province (B) of South Africa (A).
Ecologies 03 00027 g001
Figure 2. Combined density (TE ha−1) of woody species in different height classes around each village.
Ecologies 03 00027 g002
Figure 3. Combined mean density of all woody species in different height classes in the whole study area.
Ecologies 03 00027 g003
Figure 4. Canonical correspondence analysis (CCA) triplot ordination showing ordination of woody species, sites and soil variables. The lines represent the soil variables, the stars the sites and the dots the woody species, which are denoted by a six code letter where the first three letters represent the generic name and the last three letters the specific name (full list in Table 1).
Ecologies 03 00027 g004
Table 1. Overview of woody species density of all sampling sites (n = 30) in decreasing order of mean density of each species.
Woody SpeciesFamiliesDensity of Woody Species (TE ha−1) in Each VillageTotal Density (TE ha−1) Relative Frequency (%)Relative Abundance (%)Mean Density (TE ha−1)
DisanengLogagengMatlodingSeloseshaSetlhabanengTshidilamolomo
Senegalia melliferaFabaceae18862024936967 10,97017.3935.401828.33
Prosopis velutinaFabaceae 846084605.2129.161410
Terminalia sericeaCombretaceae 2131 21314.347.34355.17
Vachellia hebecladaFabaceae7650235 1027133152115.655.24253.50
Dichrostachys cinereaFabaceae1109 117 12267.824.22204.33
Ziziphus mucronataRhamnaceae5463250 431 11679.564.02194.50
Vachellia tortilisFabaceae 932 9325.213.21155.33
Grewia flavaMalvaceae178142132 2481508506.952.93141.67
Tarchonanthus camphoratusAsteraceae 764 7644.342.63127.33
Vachellia karrooFabaceae100 467 56710.431.9594.50
Buddleja salignaScrophulariaceae 520 5202.601.7986.67
Grewia occidentalisMalvaceae 269 2691.730.9244.83
Ehretia rigidaBoraginaceae9151 1423.470.4823.67
Searsia lanceaAnacardiaceae 67670.860.2311.17
Vachellia eriolobaFabaceae 1733 502.600.178.33
Boscia albitruncaCapparaceae 37 370.860.126.17
Searsia dentataAnacardiaceae33 330.860.115.50
Total density (TE ha−1) 35273663360170003105881029,706 4951
Table 2. Mean density (TE ha−1) ± SE of woody plants in different height classes around the six villages.
Height Class (m)Villagesp-Value
DisanengLogagengMatlodingSeloseshaSetlhabanengTshidilamolomo
<12366 ± 53.08 b1662 ± 5.29 c1000 ± 31.20 d4228 ± 14.88 a2639 ± 4.20 b494 ± 18.52 e<0.05
1–<2385 ± 4.08 e1198 ± 6.55 c943 ± 4.08 d2523 ± 16.50 b332 ± 1.63 e4151 ± 5.90 a<0.05
2–<3525 ± 20.41 c525 ± 20.41 c865 ± 8.16 b111 ± 8.98 d56 ± 4.89 e3204 ± 34.64 a<0.05
3–<458 ± 0.81 c149 ± 2.06 b509 ± 7.34 a67 ± 5.71 c43 ± 2.44 c468 ± 5.37 a<0.05
4–<5147 ± 5.71 b129 ± 0.81 b185 ± 4.08 a20 ± 4.08 c36 ± 3.26 c <0.05
≥552 ± 1.63
Means in the same row with different letter superscripts denote significant differences between villages by Tukey’s HSD test (p < 0.05).
Table 3. Comparison of the mean values of soil properties obtained around the six selected villages.
Soil PropertiesVillages
DisanengSetlhabanengSeloseshaTshidilamolomoMatlodingLogageng
Sand (%)86.2 b59.2 d80.94 c90.16 a89.8 a85.1 b
Silt (%)5.8 c20.8 a7.06 b3.84 d2.2 c4.9 c
Clay (%)8.0 bcd20.0 a12.0 b6.0 d8.0 bcd10.0 bc
pH5.96 c6.74 b6.62 b8.07 a5.10 c6.43 b
EC (µS cm−1)7.00 e14.00 c17.50 b72.50 a10.00 d7.50 de
Ca (mg kg−1)183.00 e1651.50 b974.50 c2370.50 a52.50 f349.50 d
Mg (mg kg−1)55.00 e552.00 b477.50 a537.00 c31.50 f151.50 d
Na (mg kg−1)34.50 b38.50 a17.00 d19.50 d30.00 c36.50 ab
K (mg kg−1)60.50 e123.50 a109.00 b101.00 c35.50 f86.50 d
CEC (cmolc kg−1)3.88 cd15.98 a11.69 b3.35 d4.38 cd5.08 c
P (mg kg−1)4.50 c3.81 c1.49 d70.80 a8.00 b9.74 b
OM (%)0.25 d0.77 a0.33 c0.31 c0.14 e0.49 b
TN (%)0.03 bc0.07 a0.03 bc0.04 b0.01 c0.05 ab
Means in the same row with different letter superscripts denote significant differences between villages by Tukey’s HSD test (p < 0.05).
Publisher’s Note: MDPI stays neutral with regard to jurisdictional claims in published maps and institutional affiliations.